

11+11=22
Volume V, Issue 164


“It doesn’t matter if you win by an inch or a mile, winning is winning.”
— Vin Diesel as Dominic Toretto in The Fast and the Furious
DASHBOARD
AGENDA
CROSS-ASSET DELIBERATIONS
Why has the iffy title “11+11=22” to do with yesterday’s market action or today’s newsletter? Absolutely nothing!
(except for a childish attempt to play today’s date, of course).
Hence, in order to compensate for the iffy title with something suitable for yesterday’s session, please listen to this song whilst reading the rest of The Quotedian.
So, right on with the show!
And … well … what can we say …?! Investors were obviously very eager to get a piece of good news, and a small ‘beat’ on the inflation number was apparently enough to get even the shyest risk-on hugger out of his hiding place.

Whilst most of us are net-long players and hence always enjoy a good market rally, yesterday's full-blown risk on move (e.g. Nasdaq +7.5%) raises a bunch of red flags. But for now, let’s take it for what it is and without commenting too much, let’s look at some of the charts.
On the equity side, the 5%-plus move on the S&P 500 has now confirmed the pattern of higher highs and higher lows, which is only for the second time this year and probably means the rally still has legs:

You know it was a good day when the weakest sector (Energy) is up 2.2%:

Only 18 poor little stocks (out of 503) closed lower on the day, meaning more than 96% of the stocks in the S&P 500 advanced … stunning! Put on your sunglasses before checking out yesterday’s market heatmap below:

Apple’s nearly 9% jump equals a one-day increase in market cap by $187 billion. Just saying…
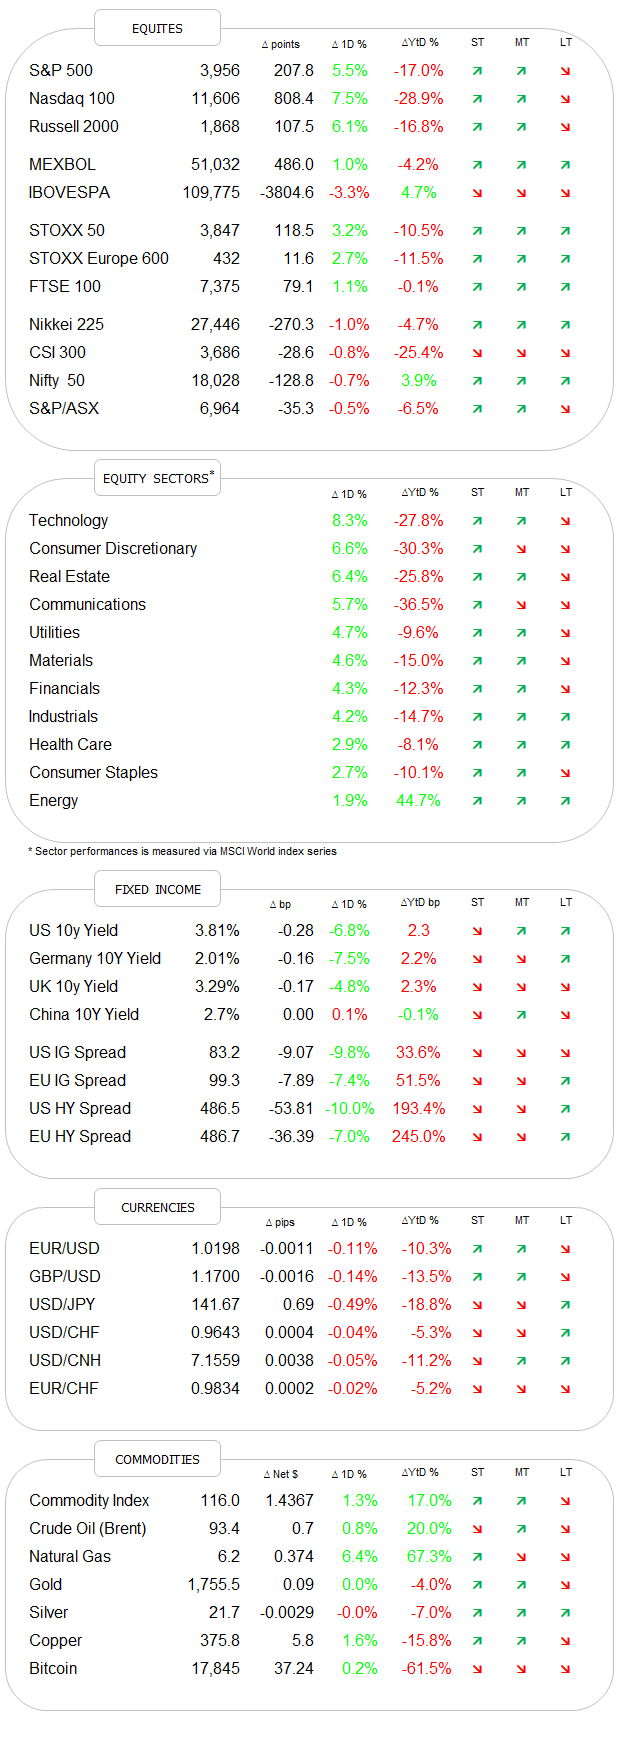
There is an interesting chart in the COTD section below, but here is yet another noteworthy one:
The PHLX Semiconductor Sector, better known as the SOX index, just formed quite a textbook inverted shoulder-head-shoulder pattern (green arcs) with a breakaway gap (dark circle) above the neckline (lower dashed black line). The implied price target would take it right back to the 3,000ish level, which is a cluster-resistance zone. Let’s see how this works out over the coming weeks…
European shares had already been a relative outperformers over the past few weeks and looking at today’s futures indicate that the STOXX 600 Europe index will also be lifted above the downward sloping cyclical trend line:

In Asian equity markets, fireworks continued this morning, with the lead taken by Hong Kong stocks via a 7%-plus rally, further bolstered after China reduced the quarantine time for travellers. Of course, this is being interpreted, probably rightfully so, as the beginning of the end to the COVID zero policy.
For those brave enough to catch the falling knife a few weeks ago when the Hang Seng’s P/E was 5.5x this is paying off handsomely:

By the way, the P/E is now 6.5x - that’s still quite a nice discount in international comparison. Just saying …
Ok, enough stock talk, over to bonds …
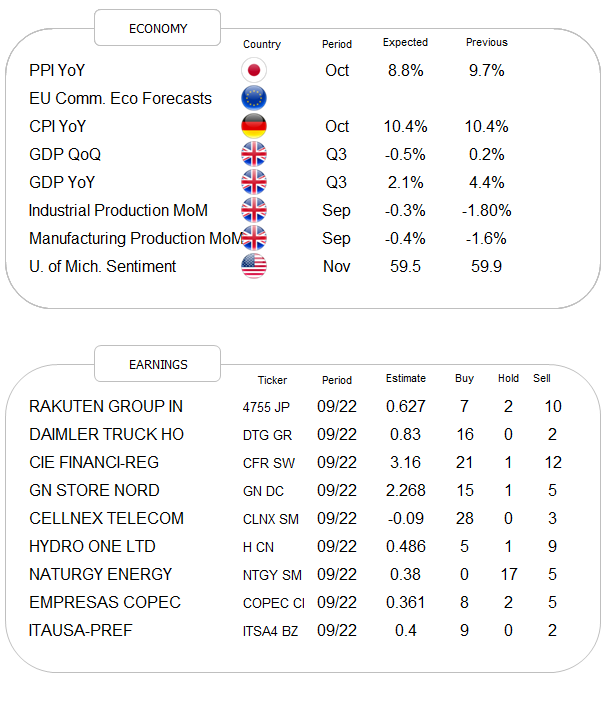
Where the rally was not less meaningful as yields completely fell out of bed after the CPI number.
I mean, a one-day 30 bp drop in the US 10-year treasury,
translates into a two percent advance in the price of the same bond, which is massive, as the following chart of one-day %-returns of the 10-year treasury future over the past five years demonstrates:

In terms of the path of the rates set by the Fed Reserve Bank (FOMC), there was a dramatic shift downwards from Wednesday to yesterday:

A “terminal rate” above 5% is for now off the books and minds of futures traders and the easing of monetary policy is expected to accelerate in the second half of next year. Which, by the way, would lead to a bearish steepening of the yield curve and would NOT be good for risky asset classes…
Let’s press on two currencies, where the US Dollar (DXY) had its worst day since 2015 according to this chart:

Importantly on the daily chart, we had been observing for a few days, the support zone (grey shaded) has now been broken to the downside:

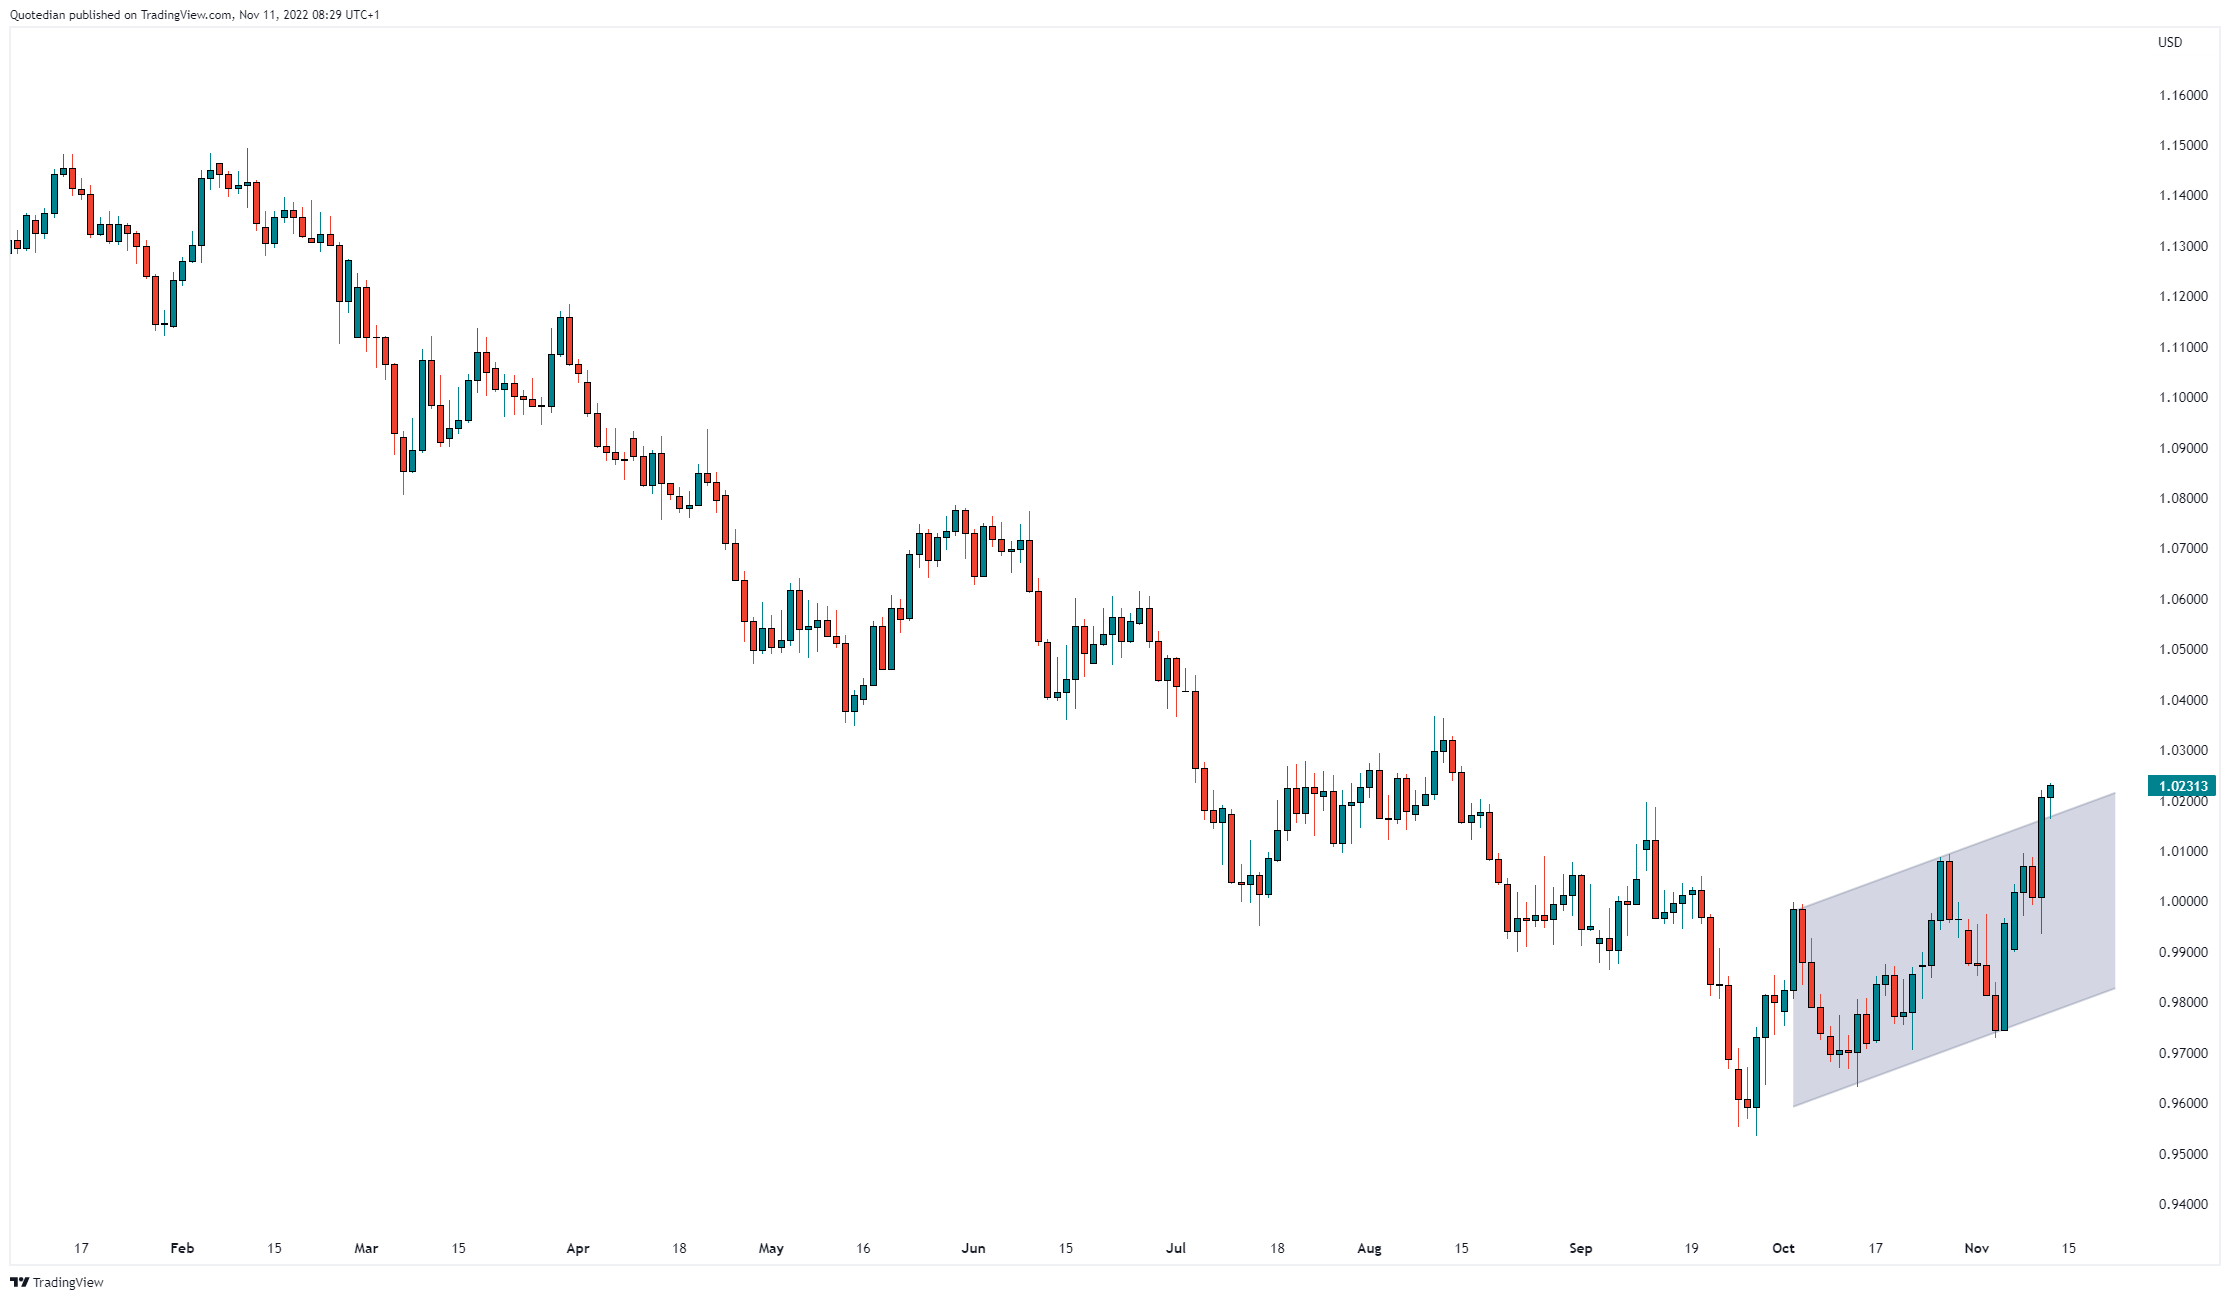
Looking at the EUR/USD cross, we see the medium-term uptrend confirmed and even accelerating:
Of course, we have not forgotten about Bitcoin and the crypto space in general, which was in full meltdown mode yesterday, but then miraculously recovered post-CPI number, which makes only limited sense to me:

But note that on the daily chart and at a current price of $17,400 Bitcoin is still below previous support, now turned resistance, line:

Finally, turning to commodities briefly, a quick small victory lap for all of us, as yesterday we discussed as follows:
… have grown quite bullish on Gold here, not least because of the crypto meltdown. But for that reason to hold up, Gold has to follow through NOW on recent strength, otherwise, …
There was no otherwise, as Gold indeed continued with its upwards momentum, leaving us with this constructive picture:

We will have a closer look at some other commodities in our Sunday edition, together with the usual weekly market review and a special focus on relativity theory … so, stay tuned!!
Have a great Friday and an even great weekend!
André
P.S. Do not forget to leave a comment in the comment section should you wish so, but above all, do not forget to hit the LIKE button, it really helps!
CHART OF THE DAY
We usually take use the S&P 500 as a benchmark for what’s going on in global equity markets, but let me highlight here another mighty index - enter the Dow Jones Industrial index!
You will remember from further up that the daily chart of the S&P 500 showed how that index still has about 4% to run to meet resistance at the downward slopping line of the cyclical bear trend. But now, check out the chart of the Dow Jones Industrial Index:

Elementary, Dr Watson!
Thanks for reading The Quotedian! Subscribe for free to receive new posts and support my work.
DISCLAIMER
Everything in this document is for educational purposes only (FEPO)
Nothing in this document should be considered investment advice
Past performance is hopefully no indication of future performance
Hello André. Talking about commodities, don't you see the situation with oil as clear as the one you saw in gold? Given the supply constraints and the Chinese end of Covid zero policy, I think that it would be really interesting to have a look at this commodity.
Thanks in advance, hope you are great😊
Good morning all!
Would like to question Andre and is followers, if we believe we are in a bear market, what could be the size of this recovery?
Best!