42
Vol VII, Issue 42-8 | Powered by NPB Neue Privat Bank AG
"So long and thanks for all the fish"
— Douglas Adams
I have mentioned several times in this space that two of my favourite financial books are “Triumph of the Optimist” (2002, Elroy Dimson, Paul Marsh, Mike Staunton) and “Being right or making Money” (2000, Ned Davis). Both are fantastic, already starting at their respective titles.
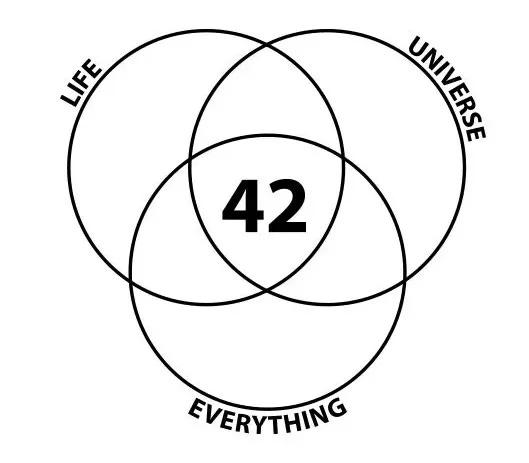
Outside of financial market books, one of my all-time favourites, gives a lot of importance to the number 42. Drop me a line or leave a comment if you know which one it is. But 42 is also an important financial number this year, namely, it is the number of times the S&P 500 has hit a new all-time high so far this year.
The other possible name for this week’s (first) Quotedian could have been “Dilemma”. Because it is a dilemma I have regarding writing this week. First of all, it is Monday, which means you are due for a Quotedian treat. However, secondly, we (NPB) are holding our Q4 Investment Committee this coming Wednesday. Preparing our quarterly ICs keeps is extraordinarily resource intensive, given our 100+ pages chart book and all … hhhmmm… lively conversations … amongst committee members.
And then, today is also the last day of the month, which means you would normally receive the also resource-intensive “Monthly Review”-Quotedian on day one or two of the new month.
So, the dilemma is to which give priority. Hence, today we will keep it extraordinarily short, with the promise to launch a month-end Quotedian later this week and of course, also send you a link to NPB’s Q4 outlook.
With that out of the way, let’s have a look at a few key charts only across the different asset classes.
As mentioned, the S&P 500 has been ticking higher since the 50 bp FOMC rate cut, exceeding our upper resistance line and seemingly on its march to 6,000:
An interesting situation has evolved on the Nasdaq 100 hoewever, where the July 17th gap lower was EXACTLY filled last Thursday and from where then stock price immediately retreated:
Very clearly, that level (20,280) has now to be exceed over the coming sessions to keep to bull run alive.
But again, tech stocks can underperform the rest of the market within a bull market and the rotation, i.e. broadening out of the rally, theme continues to be centre piece of our equity view.
Here’s another way to look at increasing “broadness” of the rally. The Value Line Geometric index is an equal-weight index of roughly 1,700 stocks across all market-cap sizes. Unlike most stock indices, the Value Line Geometric Index doesn't just add up the prices of the included stocks. Instead, it looks at the percentage price change of each stock and takes the geometric mean of those changes. The index recently reached new cycle highs:
Using ETFs as a proxy, the relative chart of semiconductors stock (SMH) to the overall market (SPY) also rebounced just about where it had to:
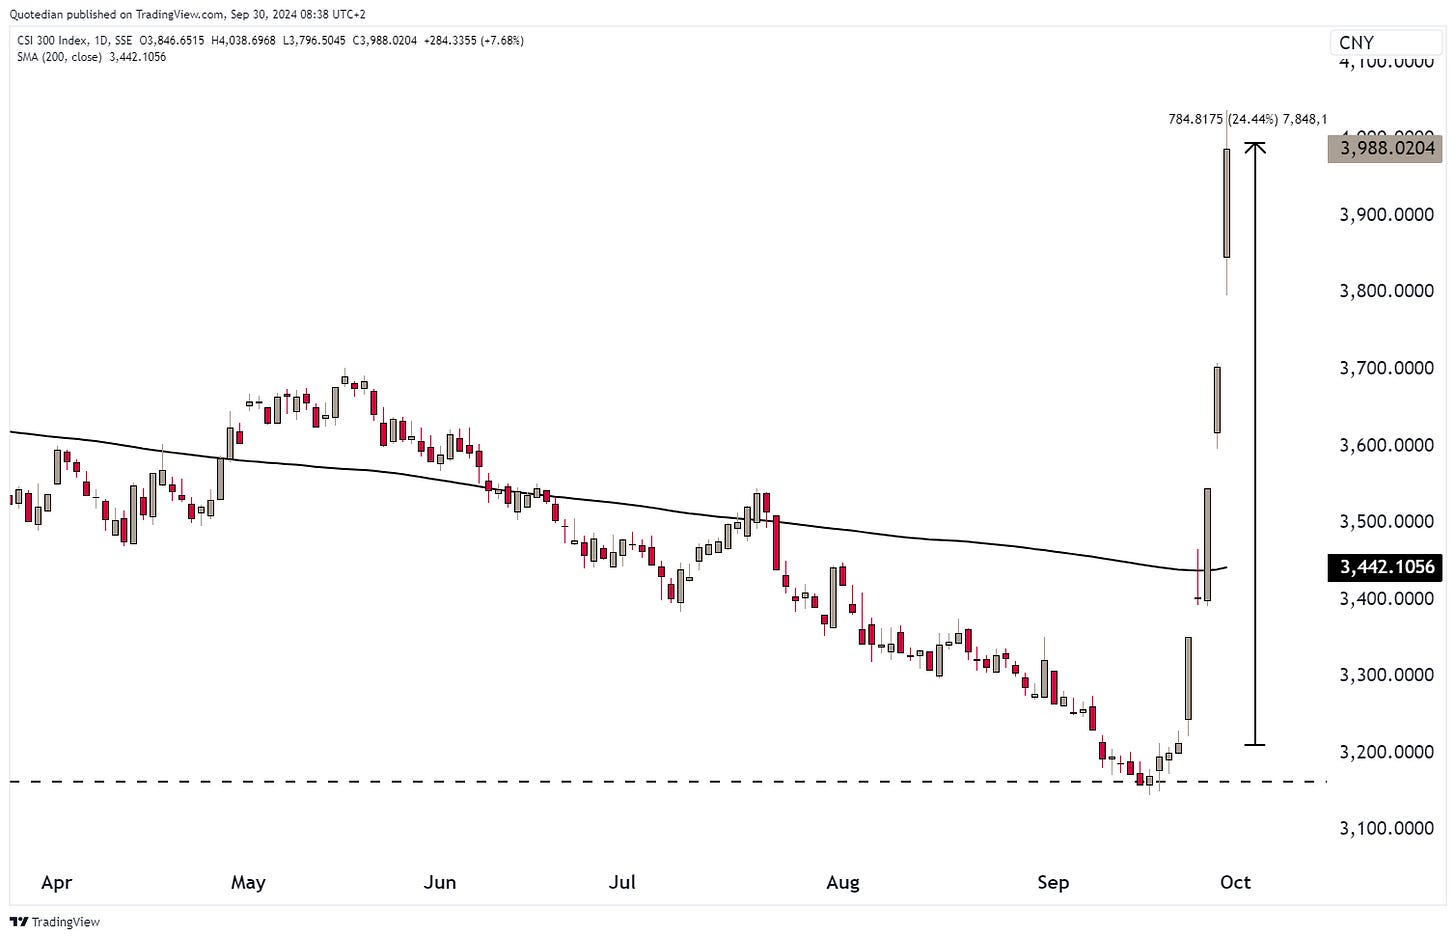
But, of course, the start of last week was the Chinese equity market, which after the governments stimulus blitz/bazooka is witnessing a short squeeze of epic proportions. Here’s the CSI 300:
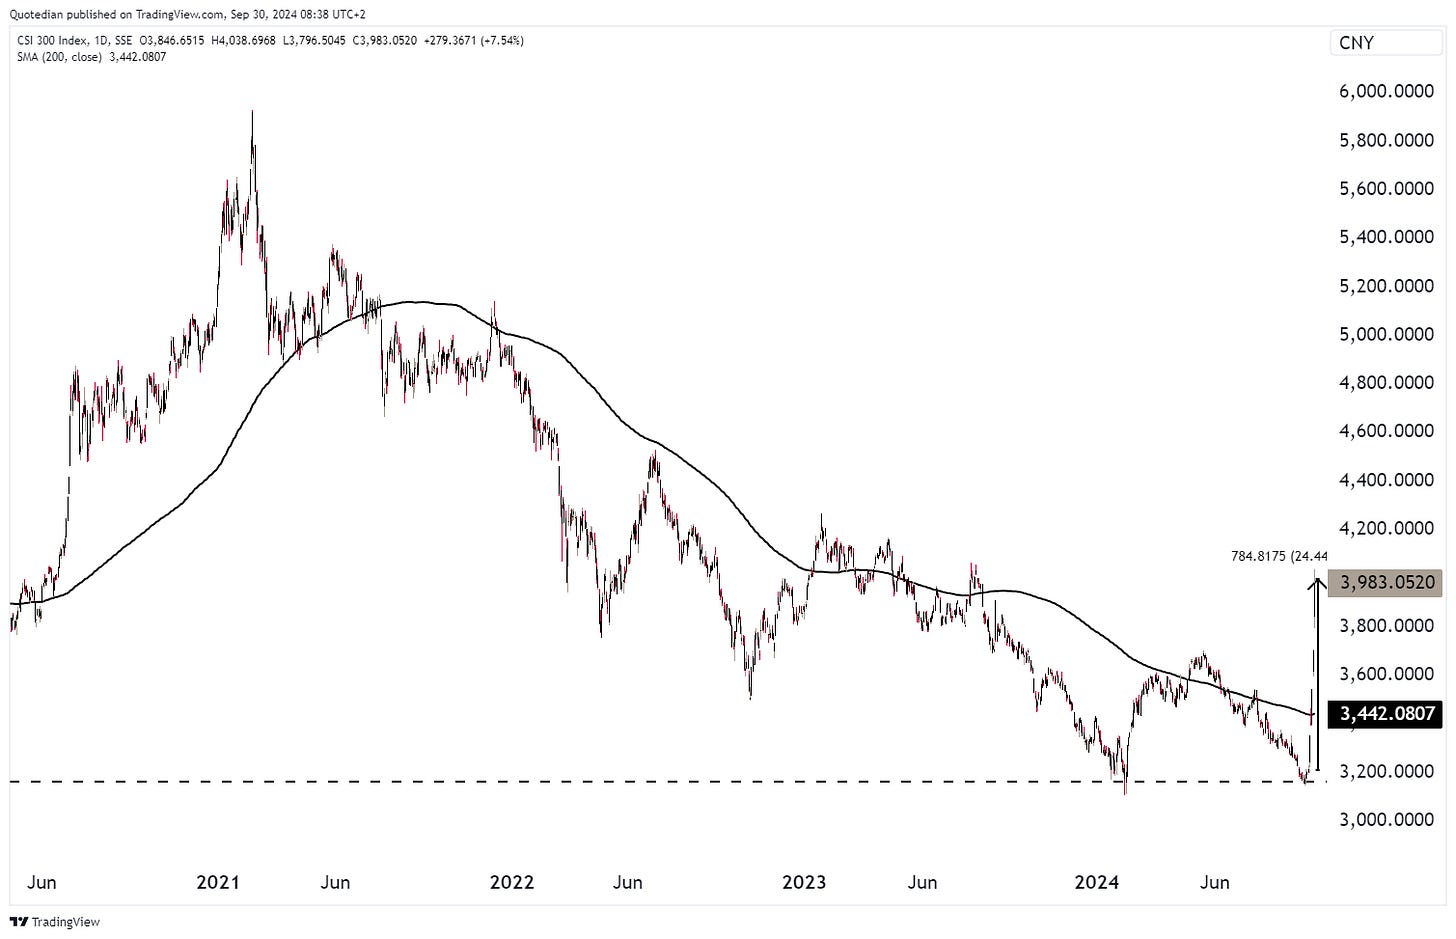
Zooming out, we realize of course, that the potential for more upside, at least from a chart point of view, remains non-neglectable:
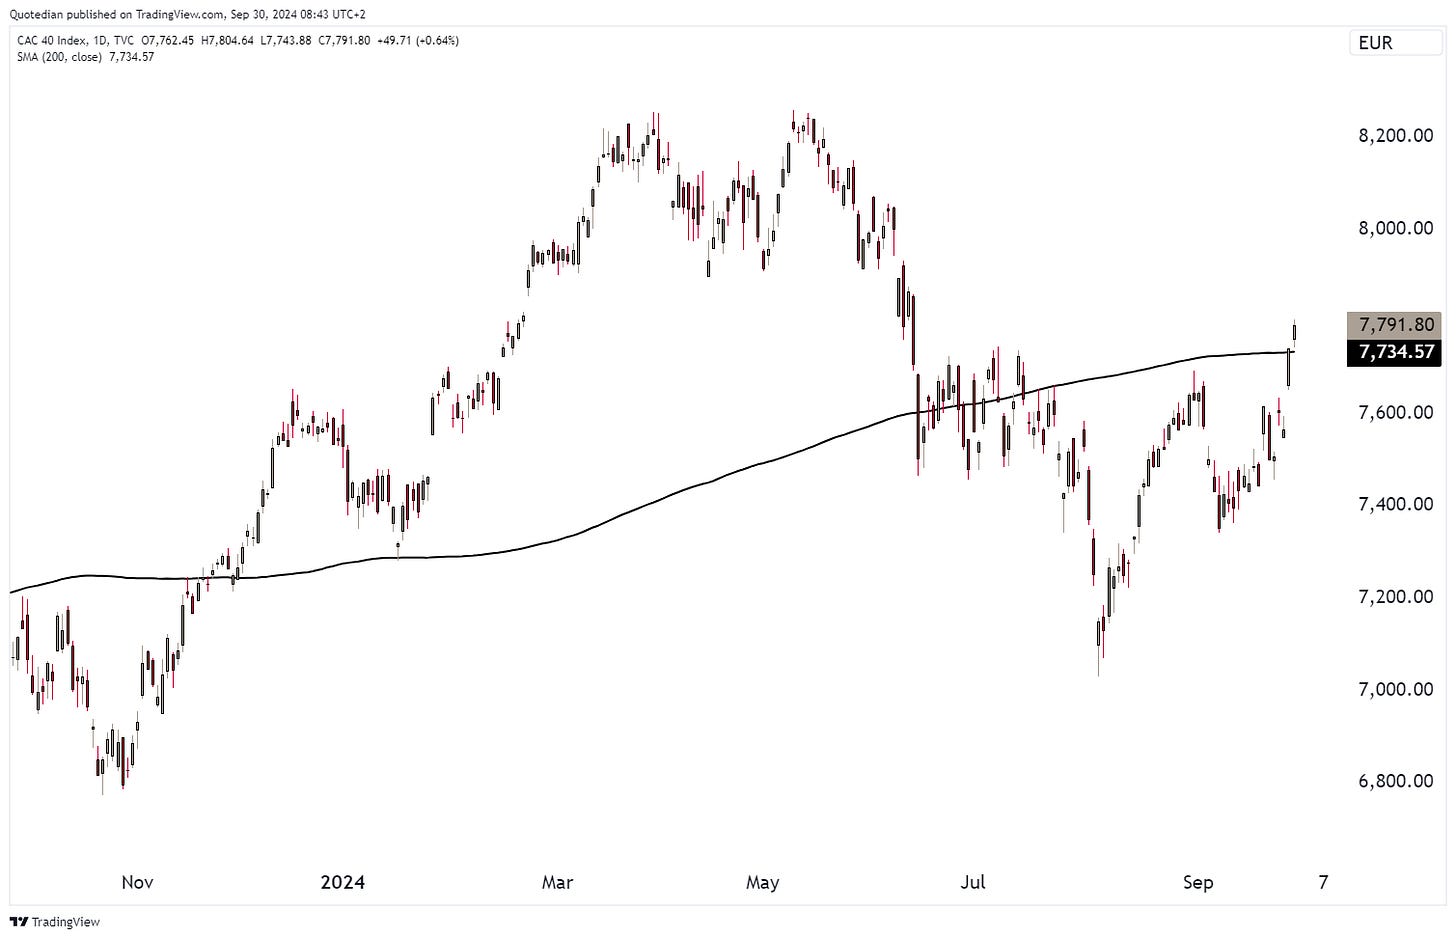
Not surprisingly, Hong Kong stocks in its different variations were also lifted. But, probably more important to European investors here, is that the Chinese rally also lifted luxury stocks out of their slump and hence France’s CAC index suddenly looks a tad friendlier:
With the index back above the 200-day moving average, the outlook is much brighter and most importantly, the lift has been enough to propel the broader STOXX 600 Europe index to new all-time highs!
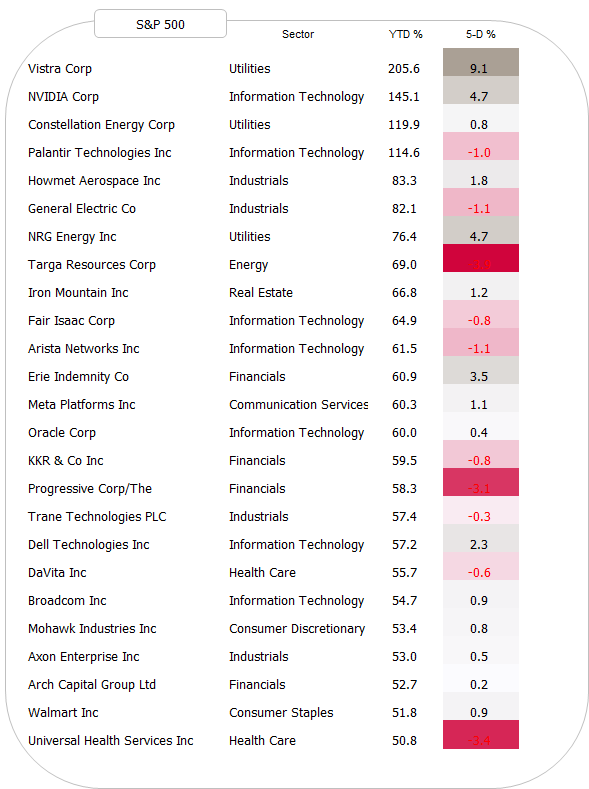
For completeness purposes, please find below also the tables of the best performing stocks year-to-date in the US and Europe and how they have performed over the past five days:
Very little to report back on the global rates side, except maybe for that the Swiss National Bank (SNB) cut their key monetary policy rate as expected by 25 basis points. Ten year yields in Switzerland are now back to 0.40% only, though still a far cry away from the (negative) lows a few years ago:
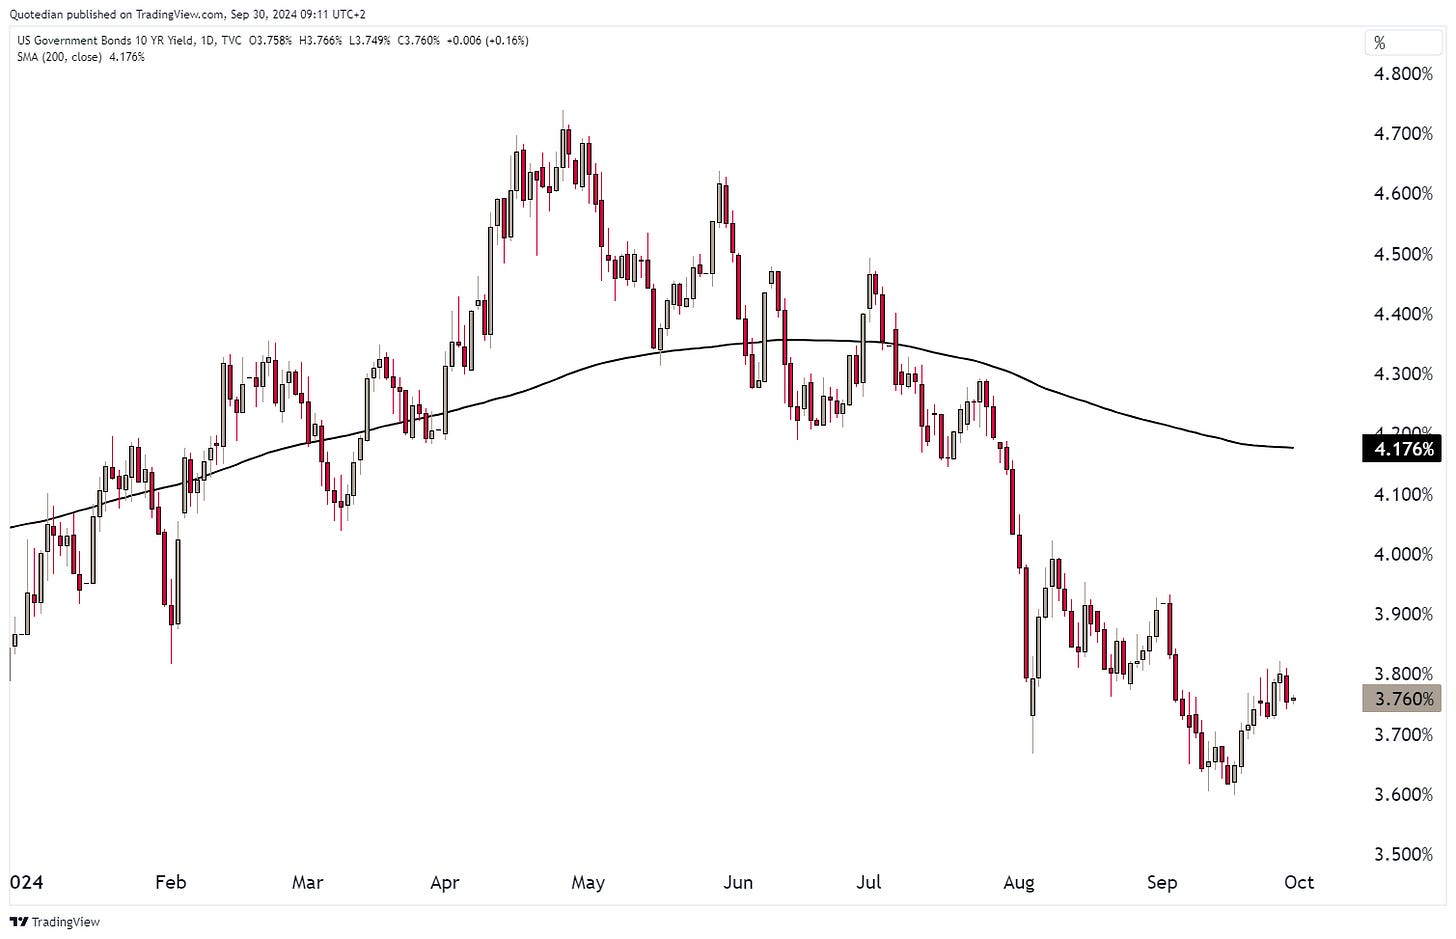
The US 10-year yield has not really gone anywhere last week:
Though the yield curve has continued to steepen:
Israel’s increased spending on war has an longer-term impact on the country’s finances, at least in the view of Moody’s:
For much of last decade shekel bond yields were lower than those of US Treasuries … no longer. Here’s the 10-year Shekel vs US treasury yield spread:
In the currency realm, the US Dollar continues to seem to be on the verge of breaking key supports. For example, here’s the US Dollar Index (DXY):
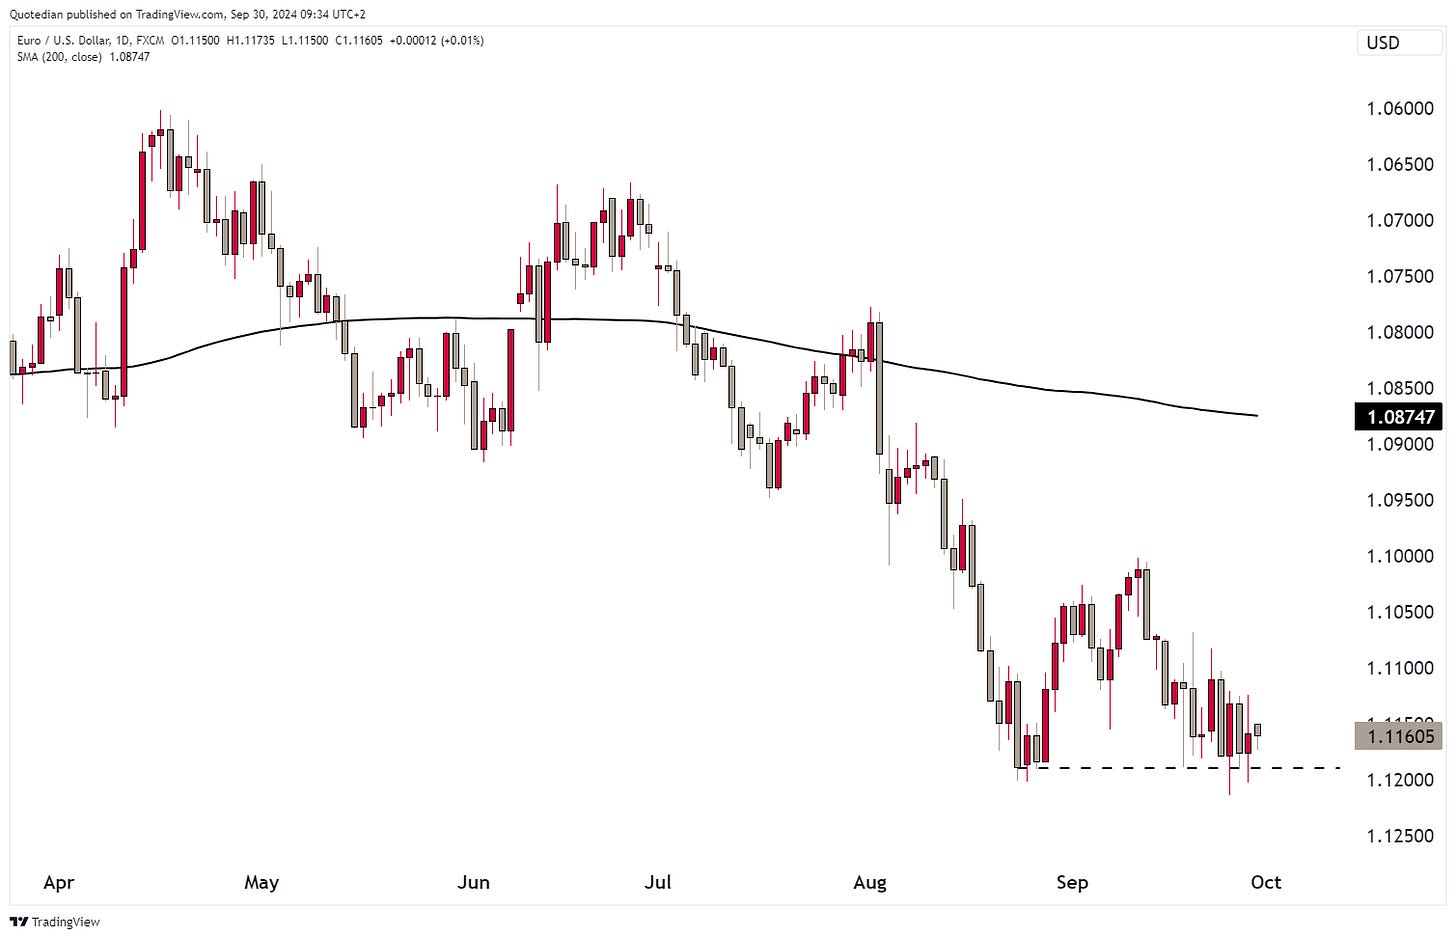
Versus the EUR, the greenback also seems on the verge of breaking lower (attention: inverted y-scale):
And the same is true for the USD/CHF currency pair:
Given the US Dollar weakness, no wonder the price of Gold (normally priced in USD) is going from all-time-highs to all-time-highs:
Though all truth being told, on a more technical chart, the yellow metal’s rally seems overextended and due for a pause:
Oil, despite all the increasing geopolitical dangers, especially in the Middle East, continues to trade close to this year’s minimum levels:
And that’s all for today … as promised, the Quotedian should be back later this week with performance tables, monthly charts and longer-term views.
Stay tuned,
André
P.S. Do not forget to sign up for the daily (Tue-Fri) updates via the QuiCQ:
Not a beautiful, but nevertheless impressive chart. The CSI300 (China Mainland stock market) just closed up 8.48% today (30.9.), marking its best one-day return since … ever! And this follows already three updays in excess of four percent last week:
As I said … IMPRESSIVE!
Everything in this document is for educational purposes only (FEPO)
Nothing in this document should be considered investment advice
Investing real money can be costly; don’t do stupid shit
The views expressed in this document may differ from the views published by Neue Private Bank AG
Past performance is hopefully no indication of future performance


