

A Random Walk Down Chart Street
Vol IX, Issue 18 | A NPB Original
“With the markets now all but ignoring the economy, I’d note that the economy has never been more immediately reflective of the market prices.”
— Peter Atwater

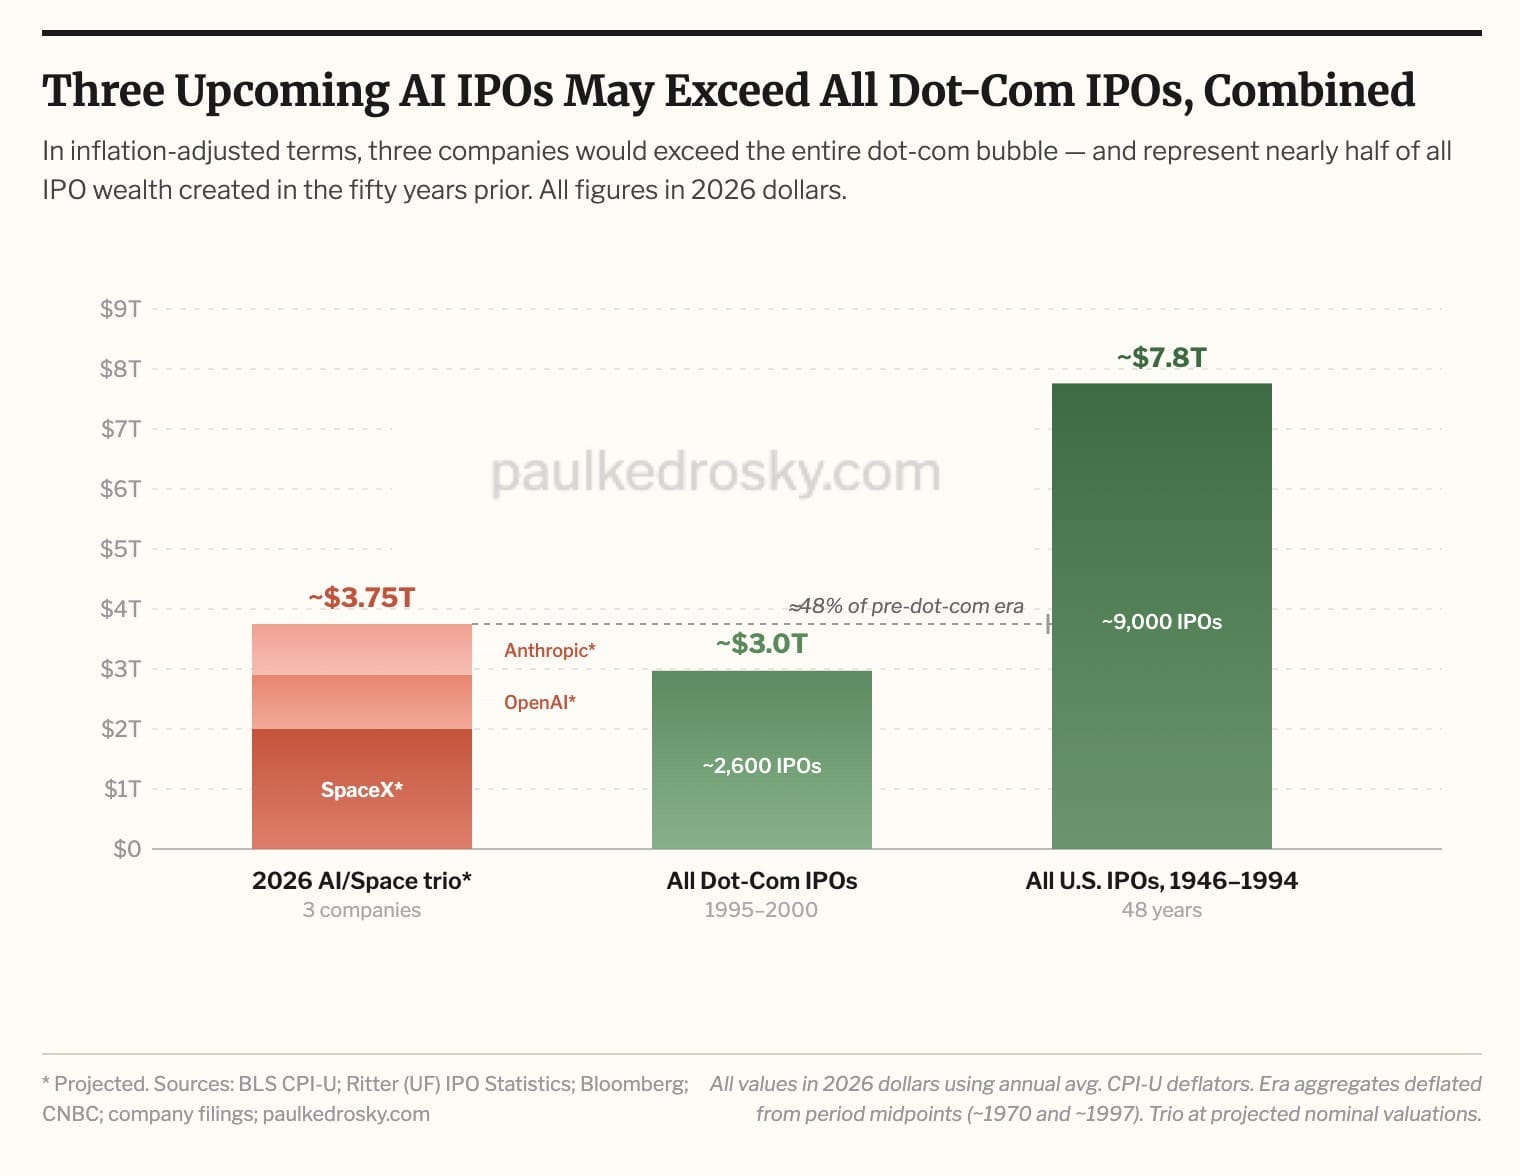
Similar as in the 1998 blockbuster movie “Armageddon”, a major threat is heading towards our planet of financial market. However, unlike in the movie, not one, but two massive asteroids are heading towards us, both threatening to change the current path of “numbers go up”. Let’s nickname those asteroids PI (passive investing) and IPO (initial public offerings). Both, PI and IPO deserve their own weekly Quotedians, however, given I have just been disconnected from markets due to a long weekend away, we will focus this week’s letter on a brief “where we stand” update, and will follow up in the coming weeks with dedicated letters to IP and separately IPO. But, as a little teaser on the latter, consider the following chart, which without any further comment gives away already quite a lot:
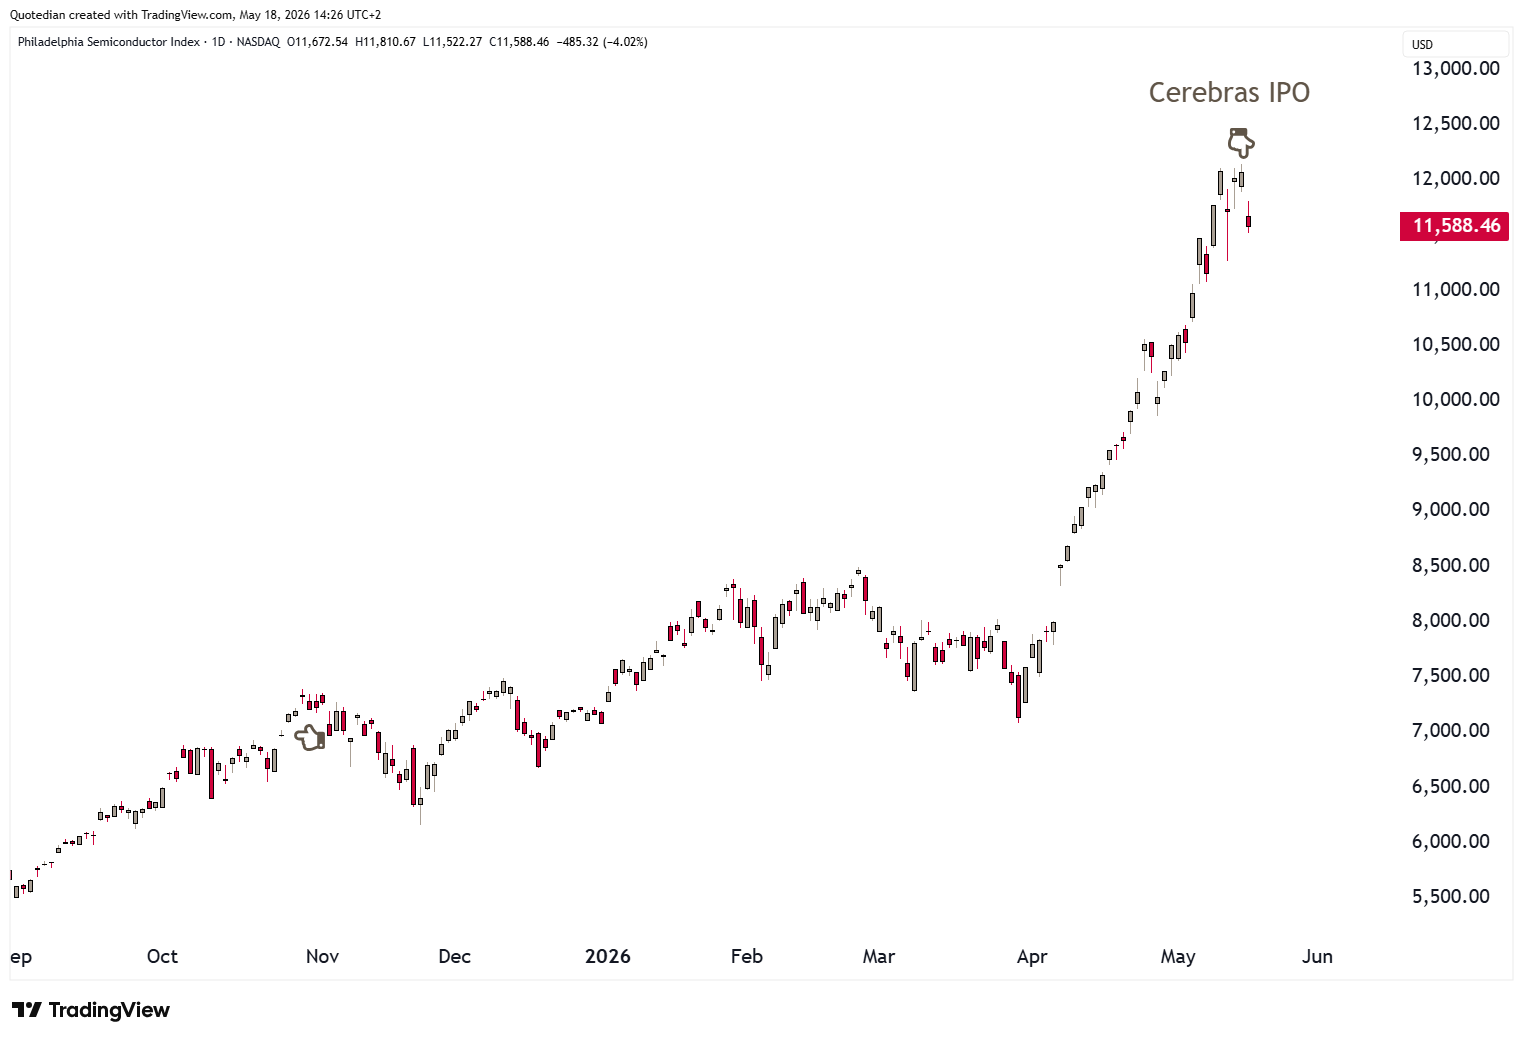
And as a second teaser (careful: spoiler alert), here’s what happened last week with the Philadelphia semiconductor index (SOX) after the largest chip-maker (Cerebras Systems) went public on Thursday:
But onwards with our casual Sunday afternoon market observations, where we start this week with the bond market as it matters for all the rest. A lot.
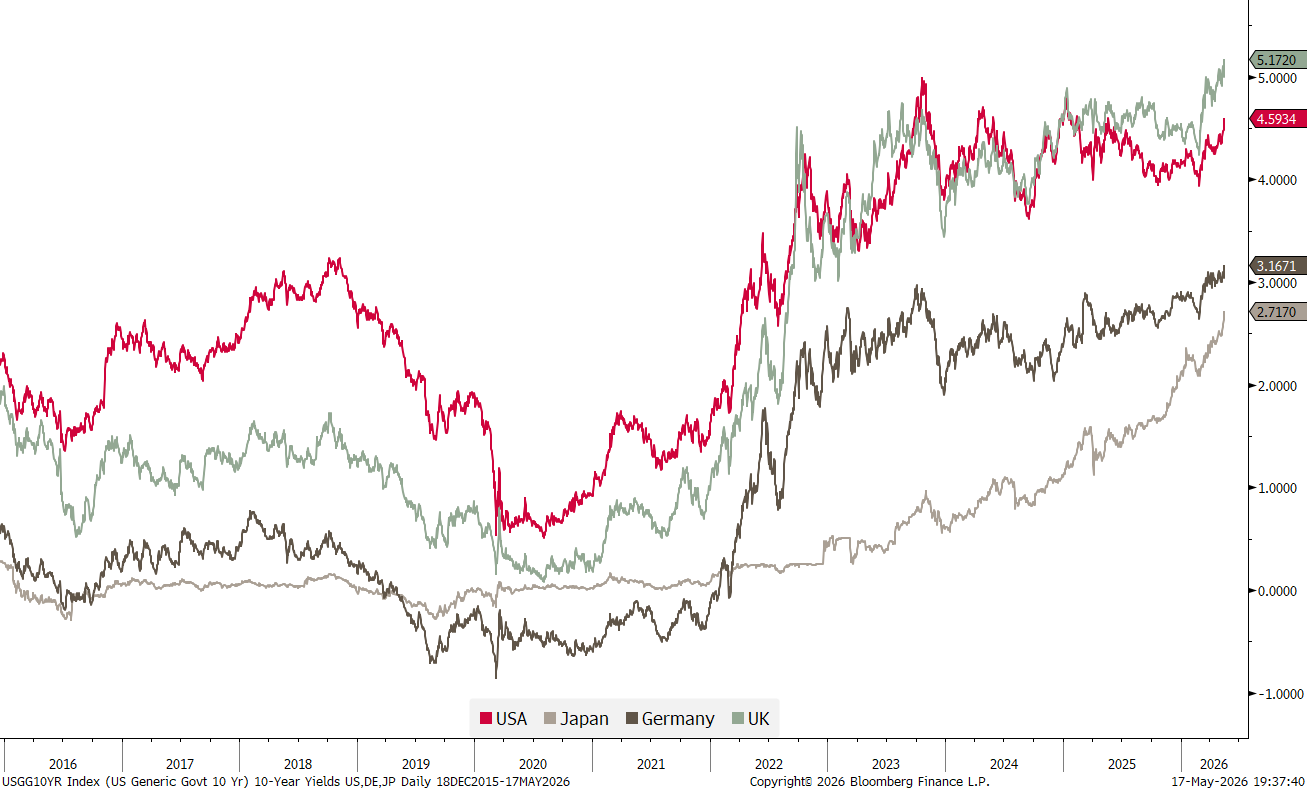
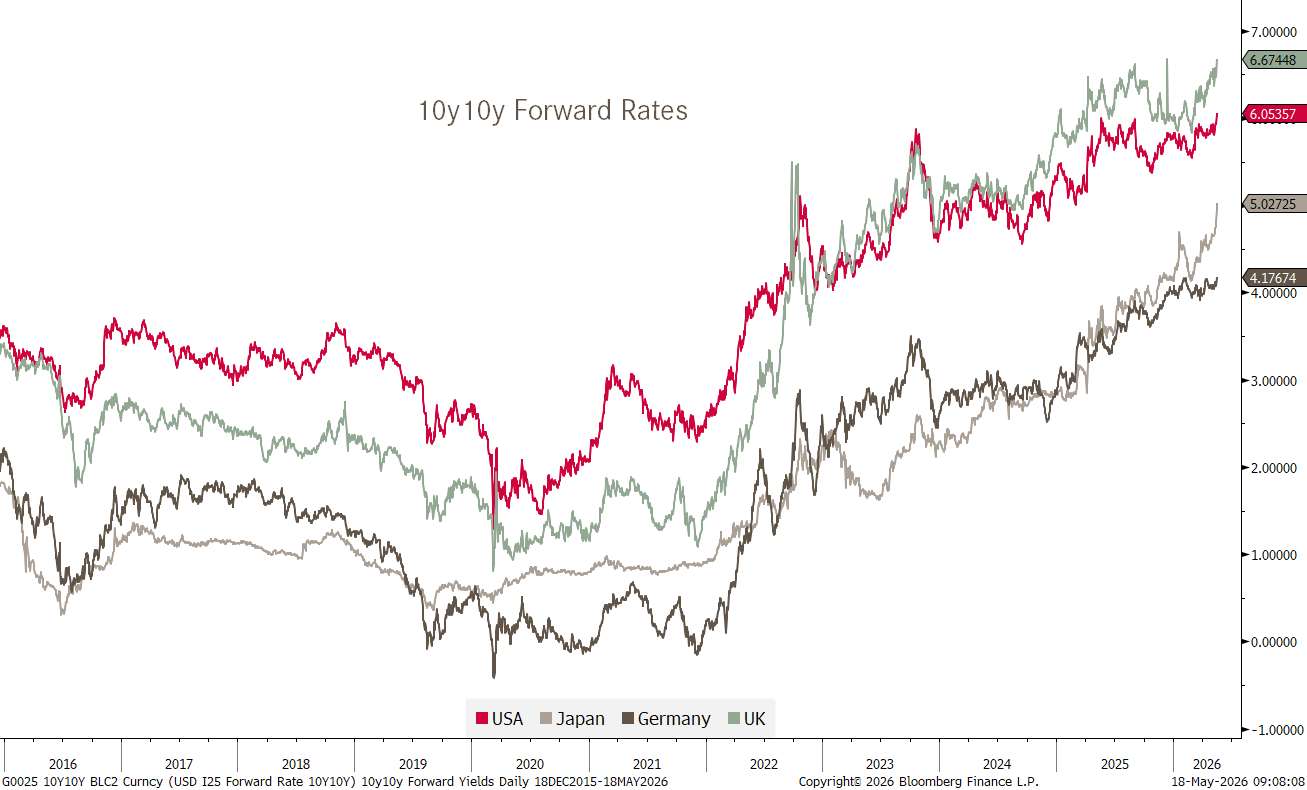
Global yields (10y) are pushing higher,
as the Iran conflict and subsequent ongoing closure of the Strait of Hormuz (SoH) is pushing up inflation expectations:
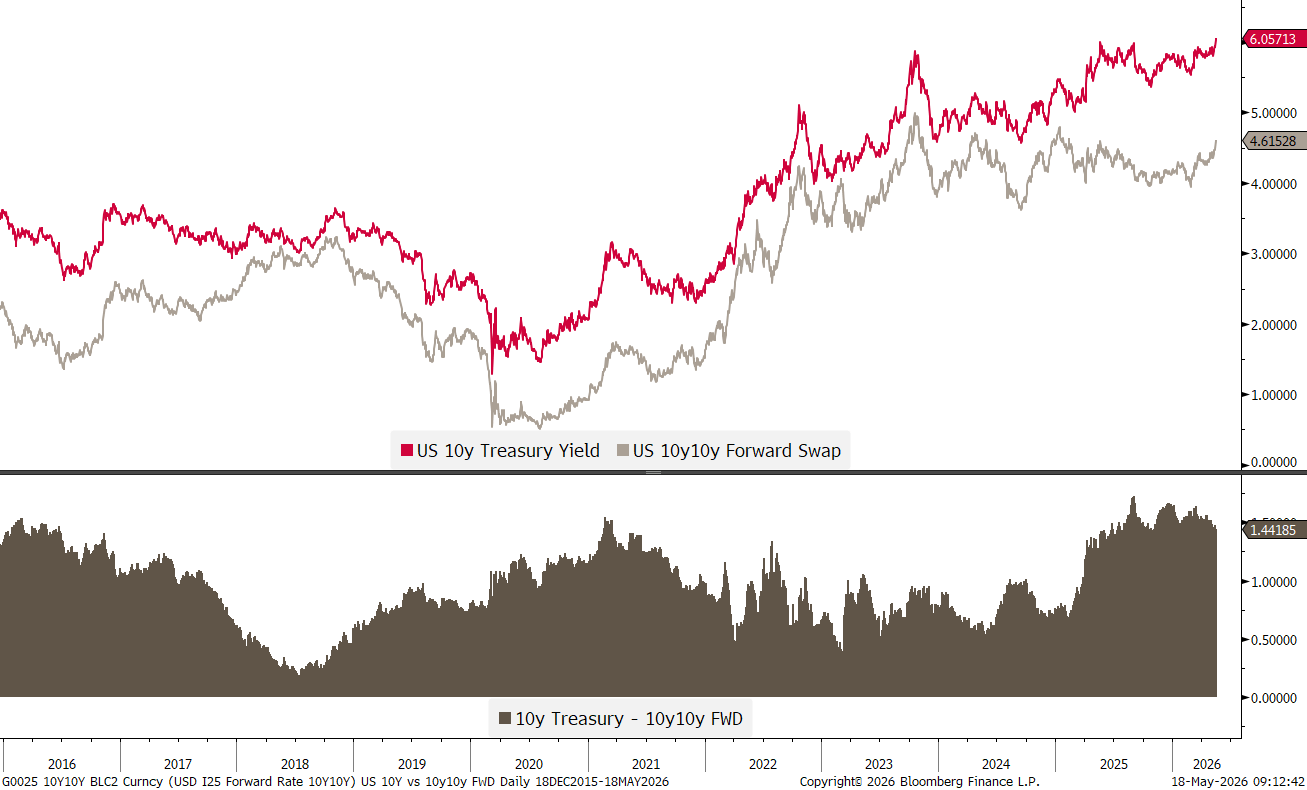
As proxy for all other markets, the spread (bottom clip) between expected 10-year yields in 10-years (red) and the current 10-year yield (grey) is at one of its widest of the past 10 years:
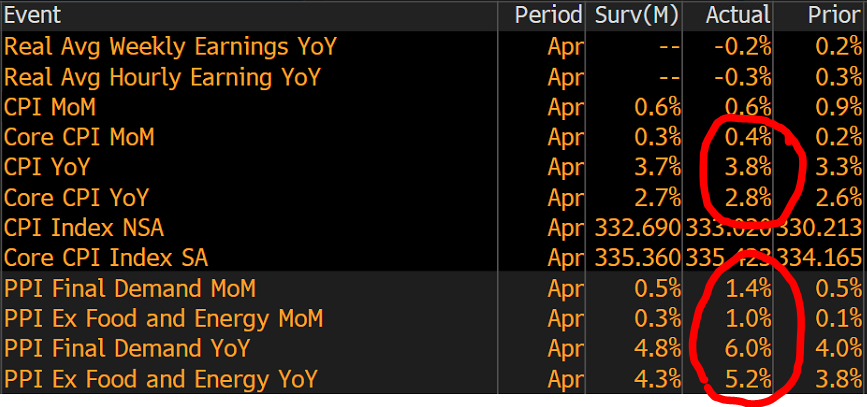
So, what has been lifting inflation expectations so much? Definitely as much consumer as producer price inflation numbers in the US out last week, however much government tries to manipulate those numbers:
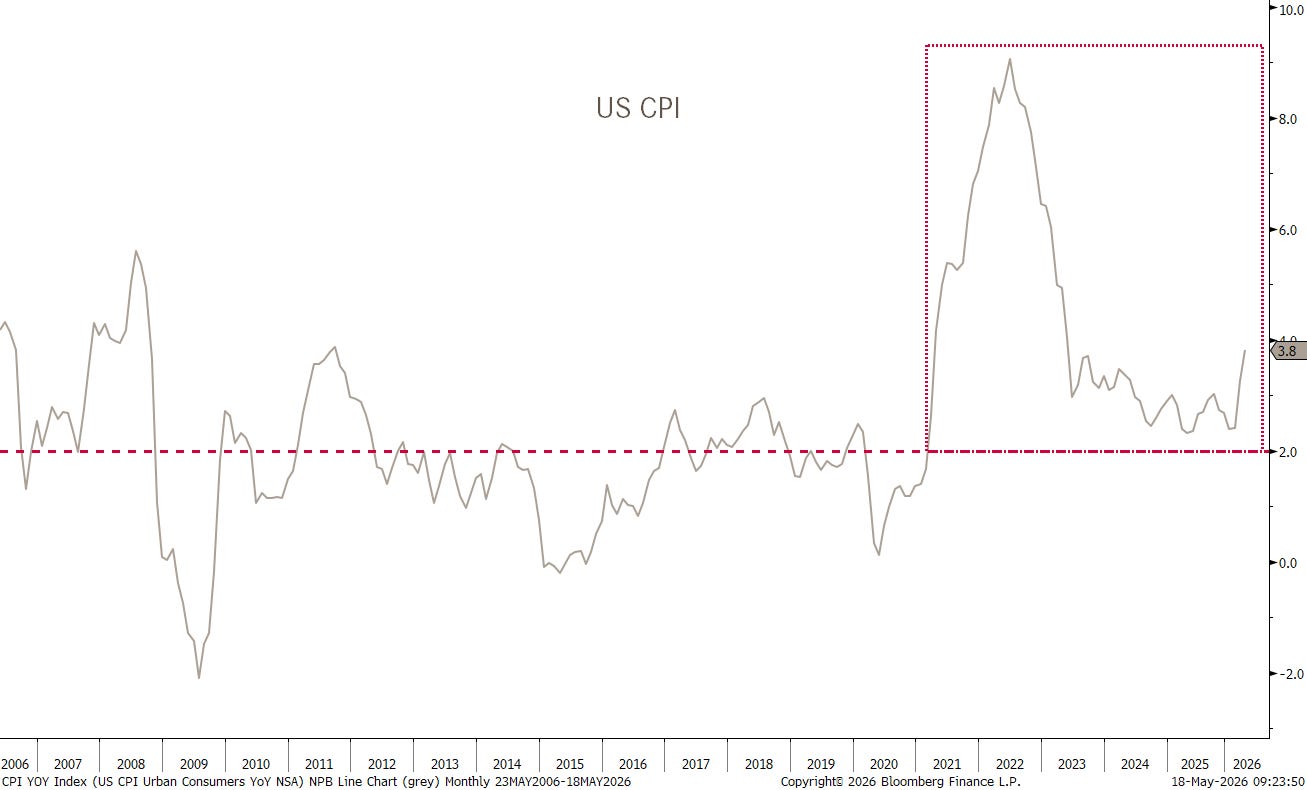
The truth, and nothing but the truth, is that US consumer price inflation (CPI) has now not ‘traded’ at or below the Fed’s self-declared inflation target of two percent for over five years now:
Five years ago is of course also when the secular bond bull (yield bear) market ended:
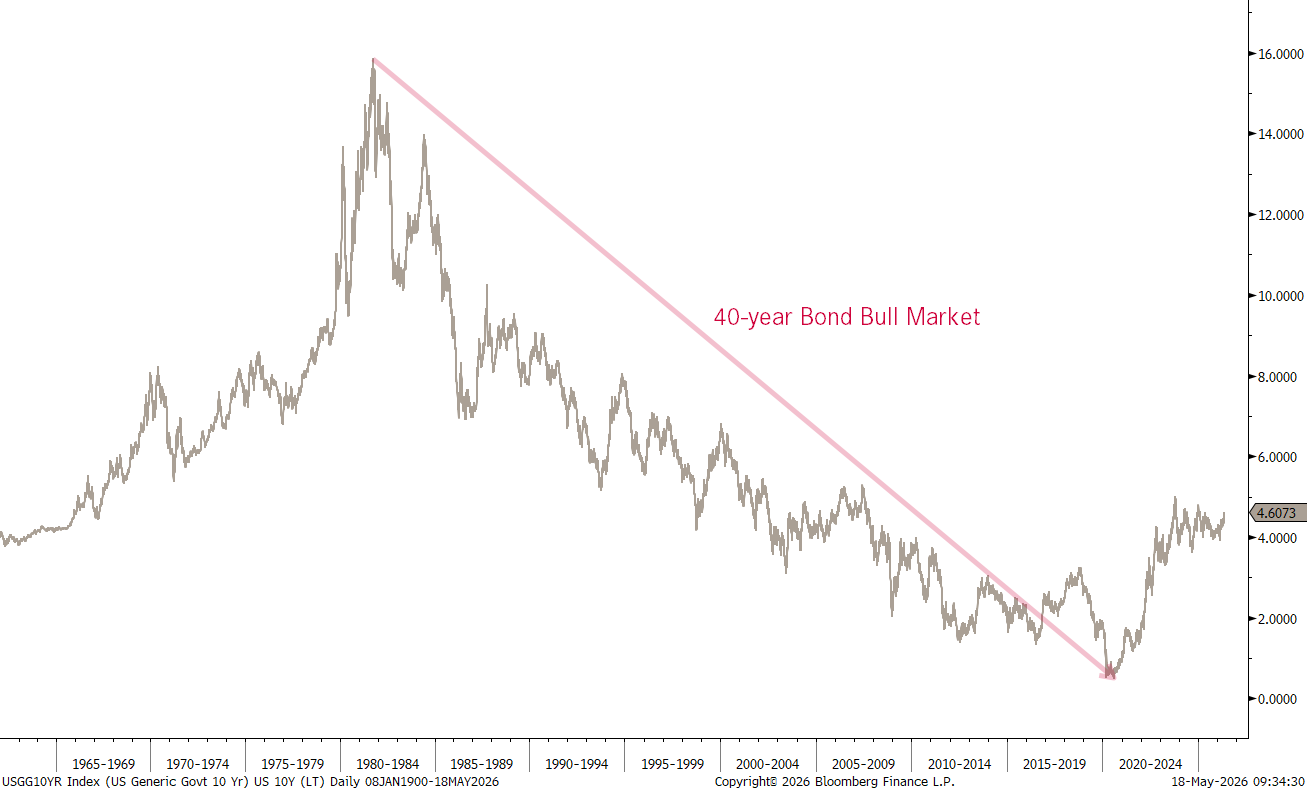
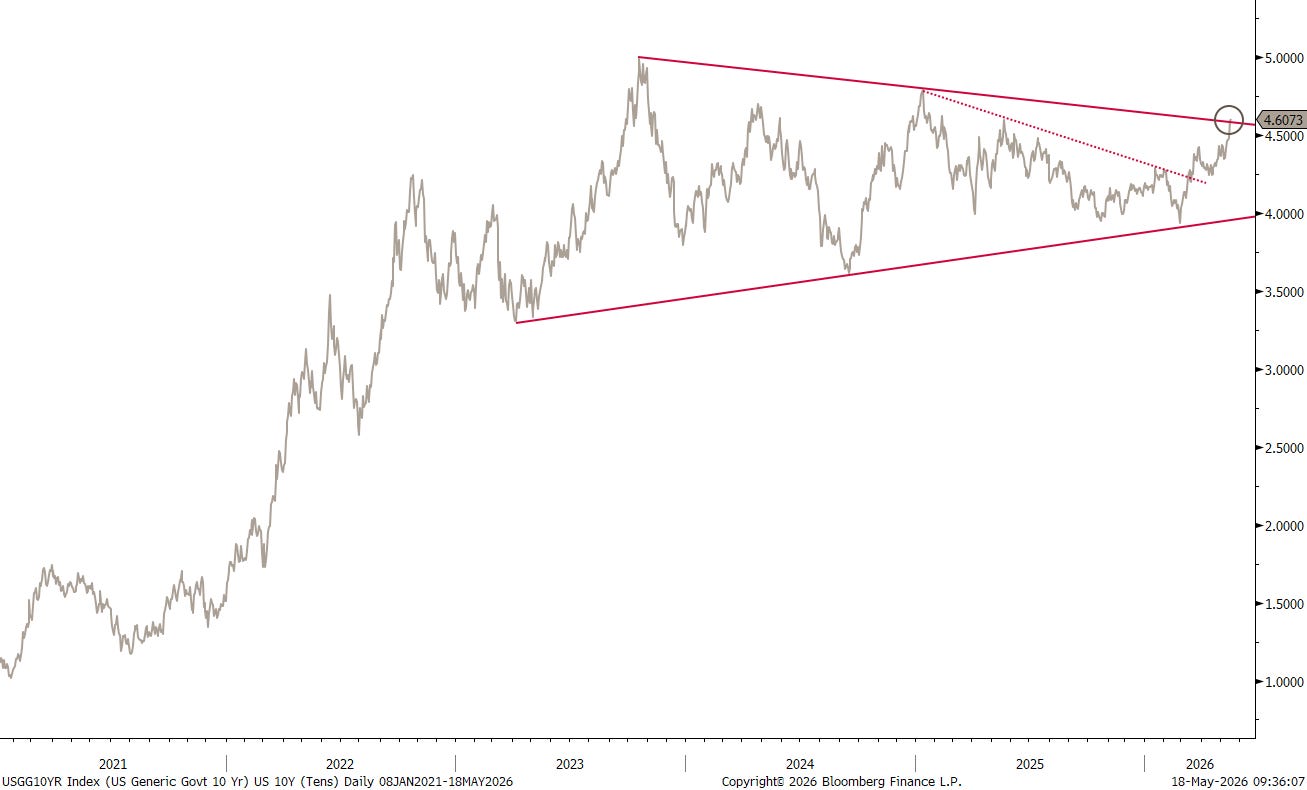
And closing in on the above chart, it now seems that bond yields are now ready for the next upleg, nicely on time with our call for a Q2/Q3 break higher in yields:
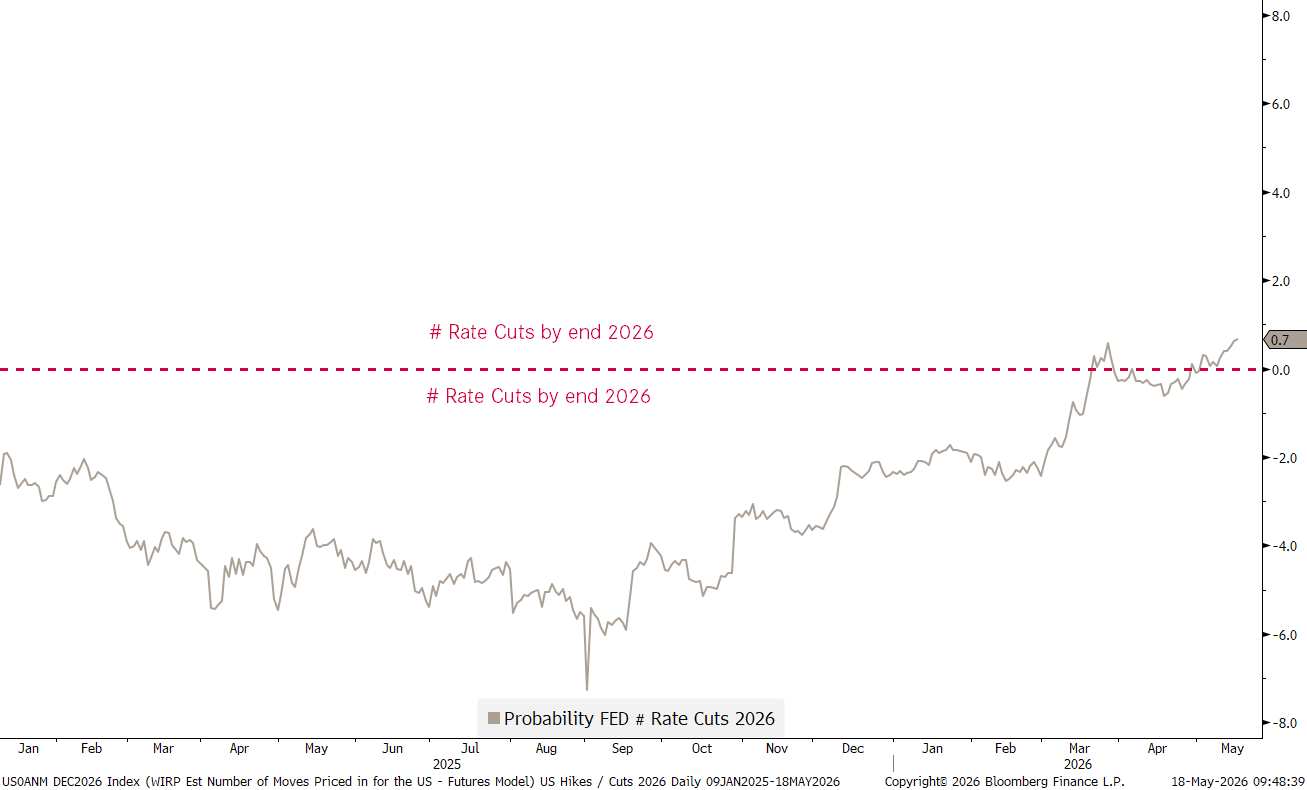
The week before last there was also a strong payrolls (employment) report in the US, further reducing the case for the Fed to cut interest rates any time soon:
And then there is of course that tiny issue with the little Strait somewhere in the Middle East:
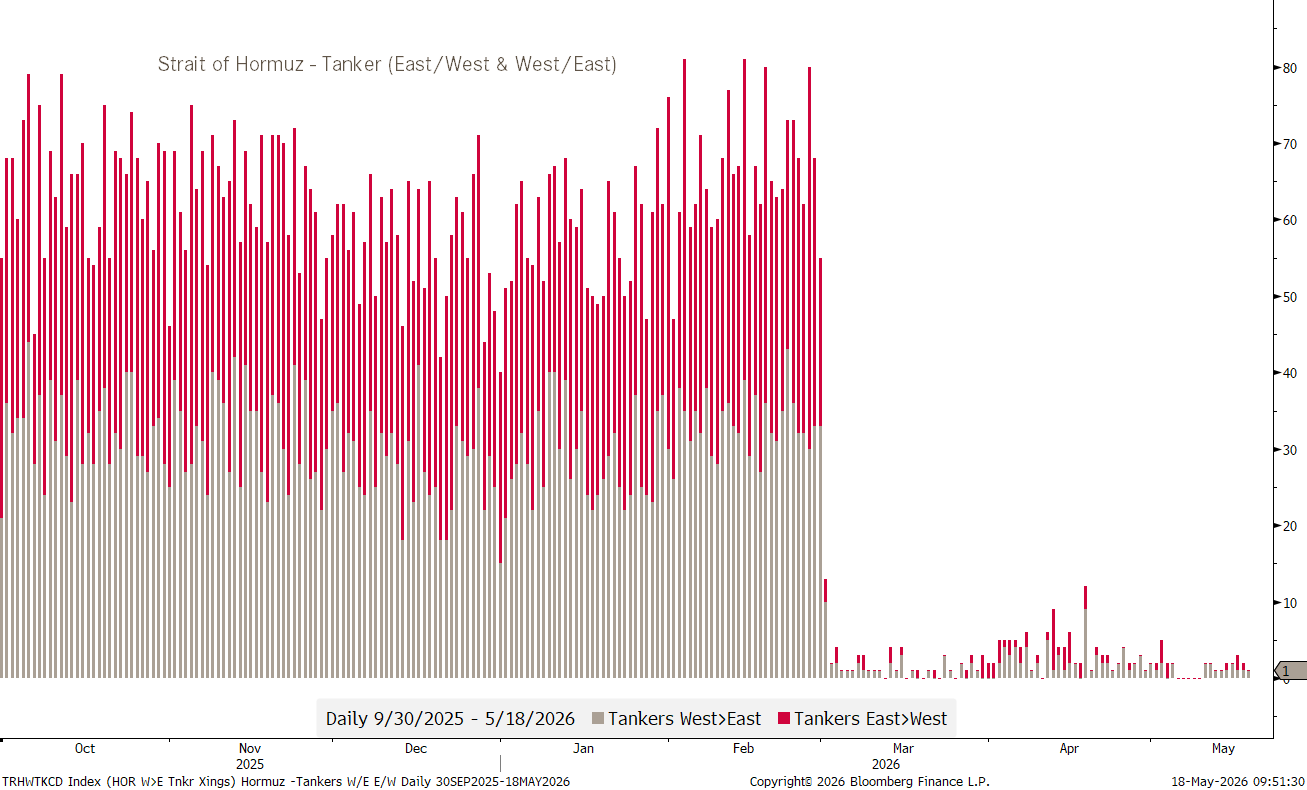
Of course it is difficult to get reliable sources on the number of Tanker crossing the SoH, and indeed some say the number is higher than that shown in the graph above. But those same sources also say that nearly all of them are ‘flying’ under the Chinese flag…
At least one person in the US is getting increasingly nervous:
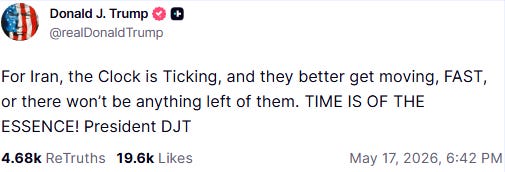
But then, maybe and just maybe, and you may call me crazy for even suggesting that, we should not take too serious a dude who posts also stuff as this:

In any case, and using this as a segue into the equity section, bond volatility (MOVE - grey) has been increasing:
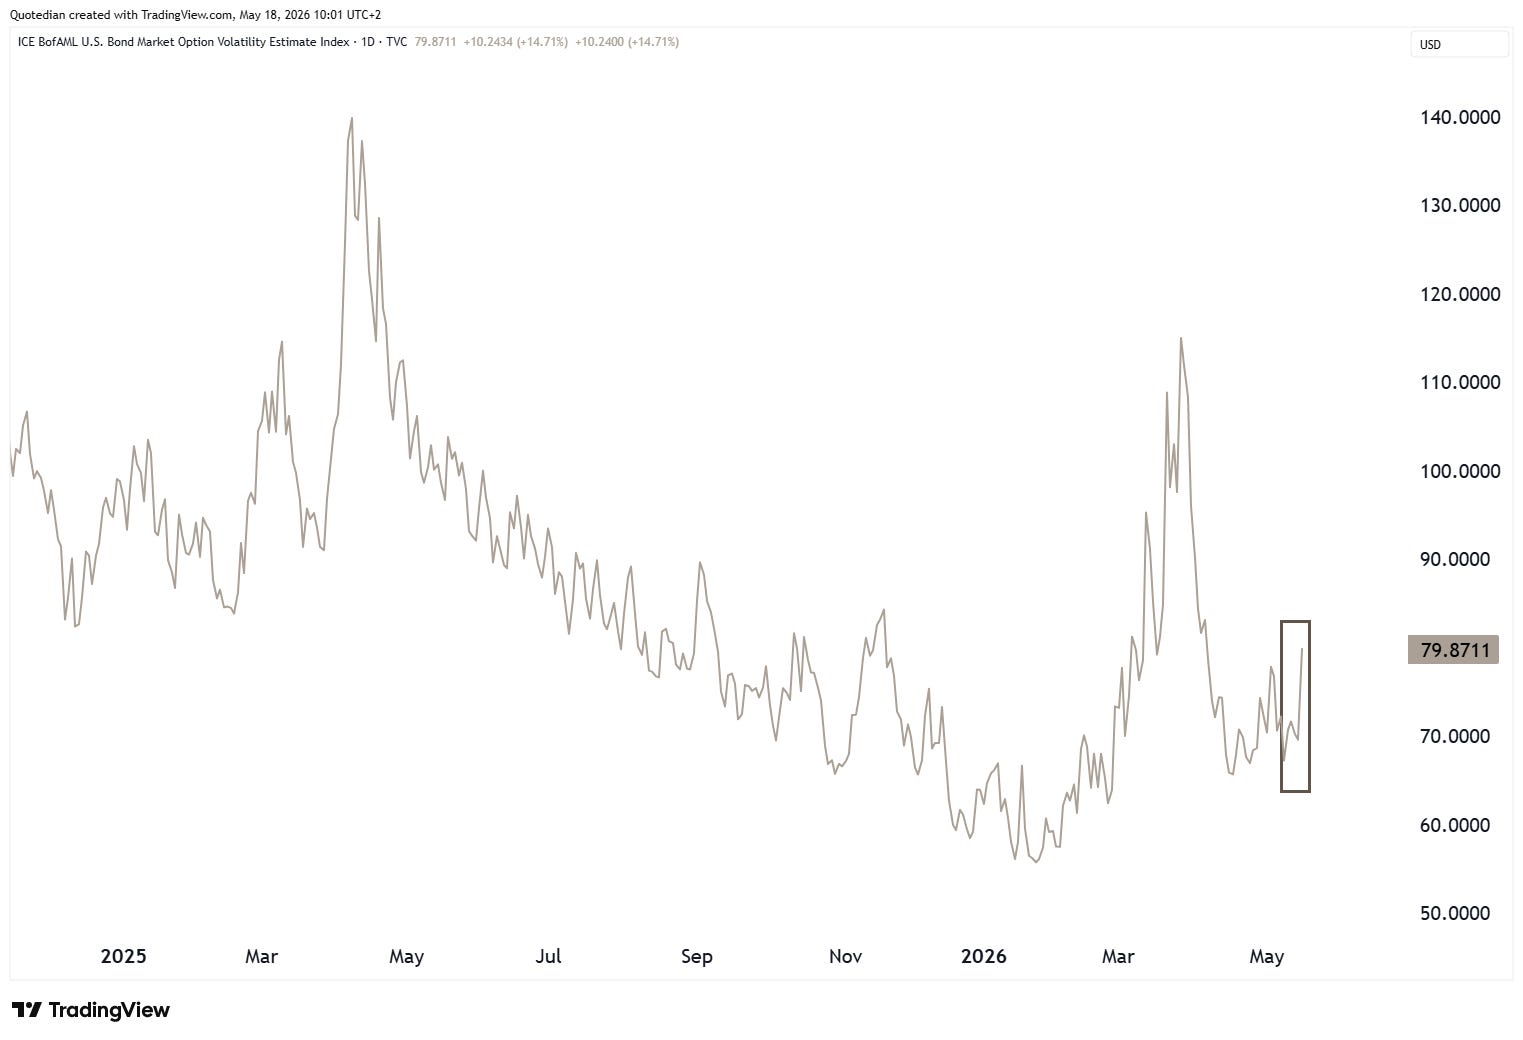
And stocks (SPX - red) have started to react on Friday to that uptick in the MOVE (now inverted - grey):
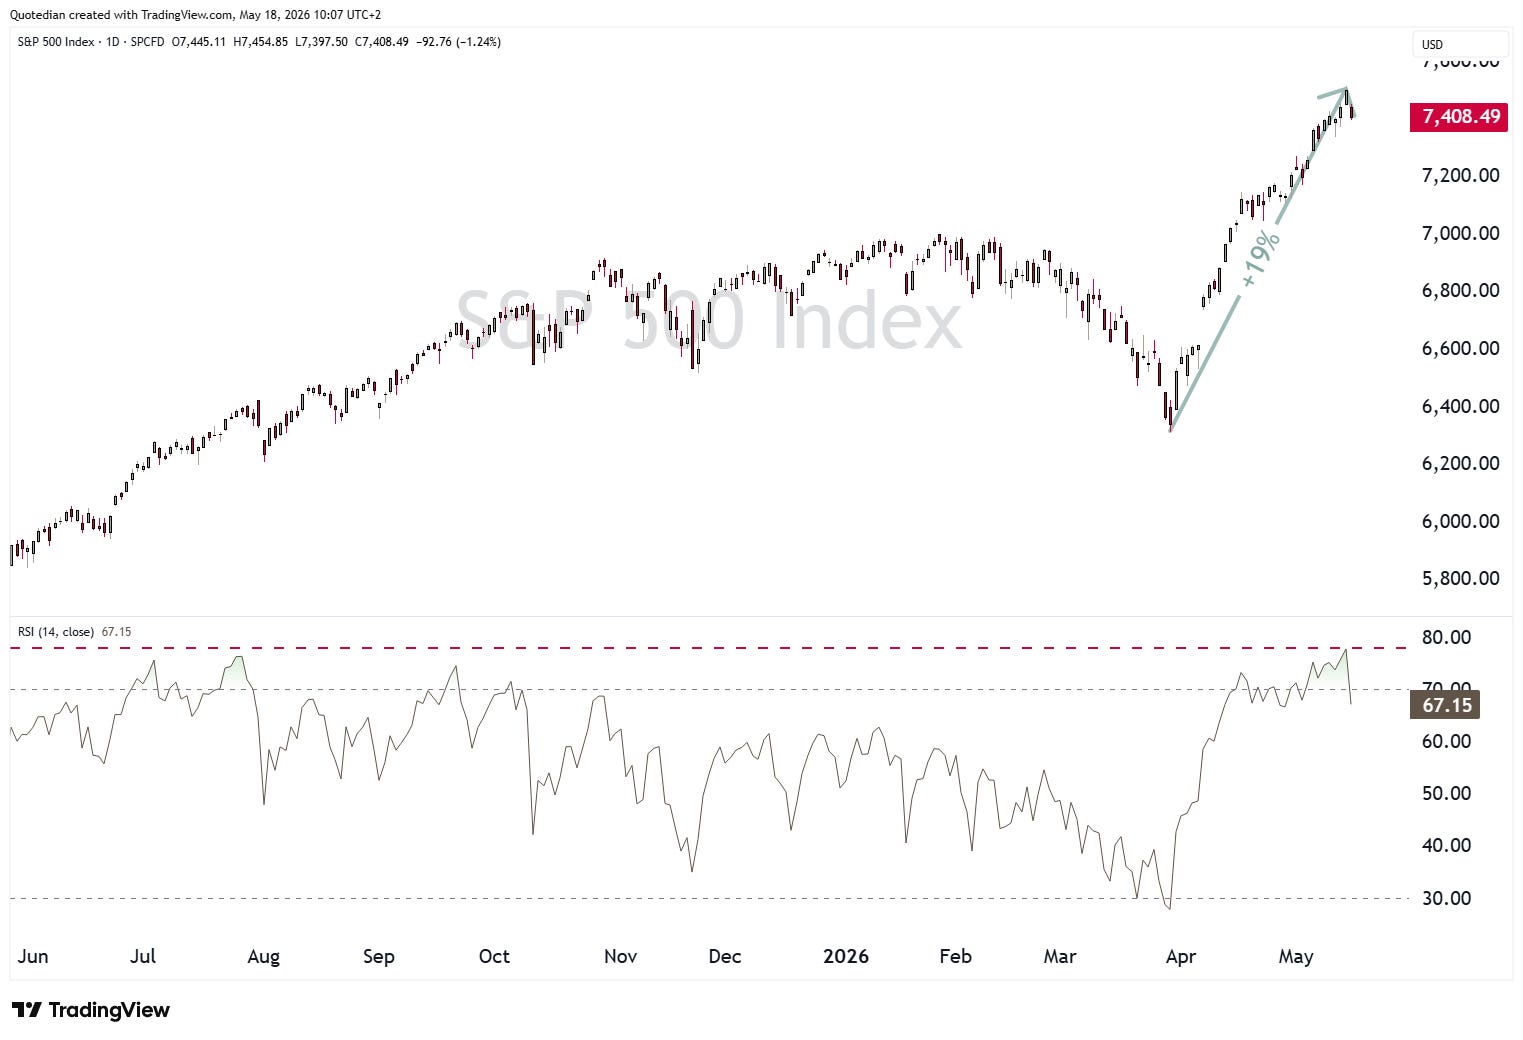
A pause on the S&P 500 would definitely not be untimely, after an epic nearly 20% run in just one and a half months, which pushed the RSI (lower clip) to its most overbought reading in over a year:
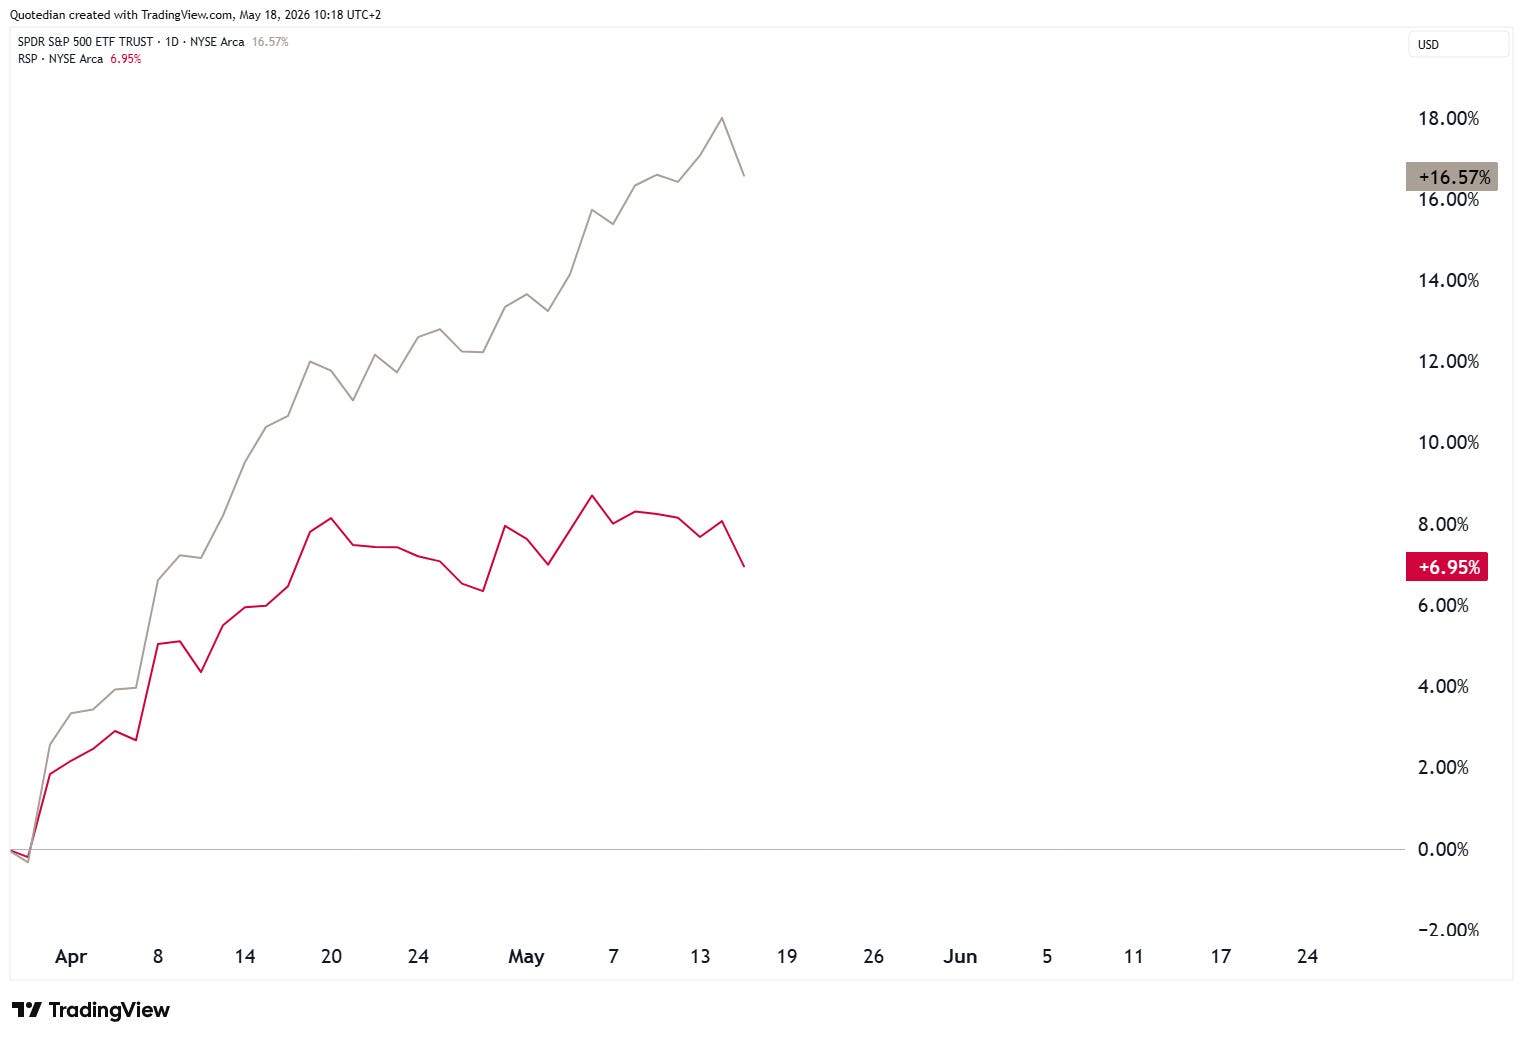
If a consolidation/correction does indeed ensue, it could be more meaningful on the ‘normal’ market cap weight version of the S&P 500 (SPY - grey), which has been strongly outperforming the equal-weight version (RSP - red) not only since the most recent market bottom back in late March,
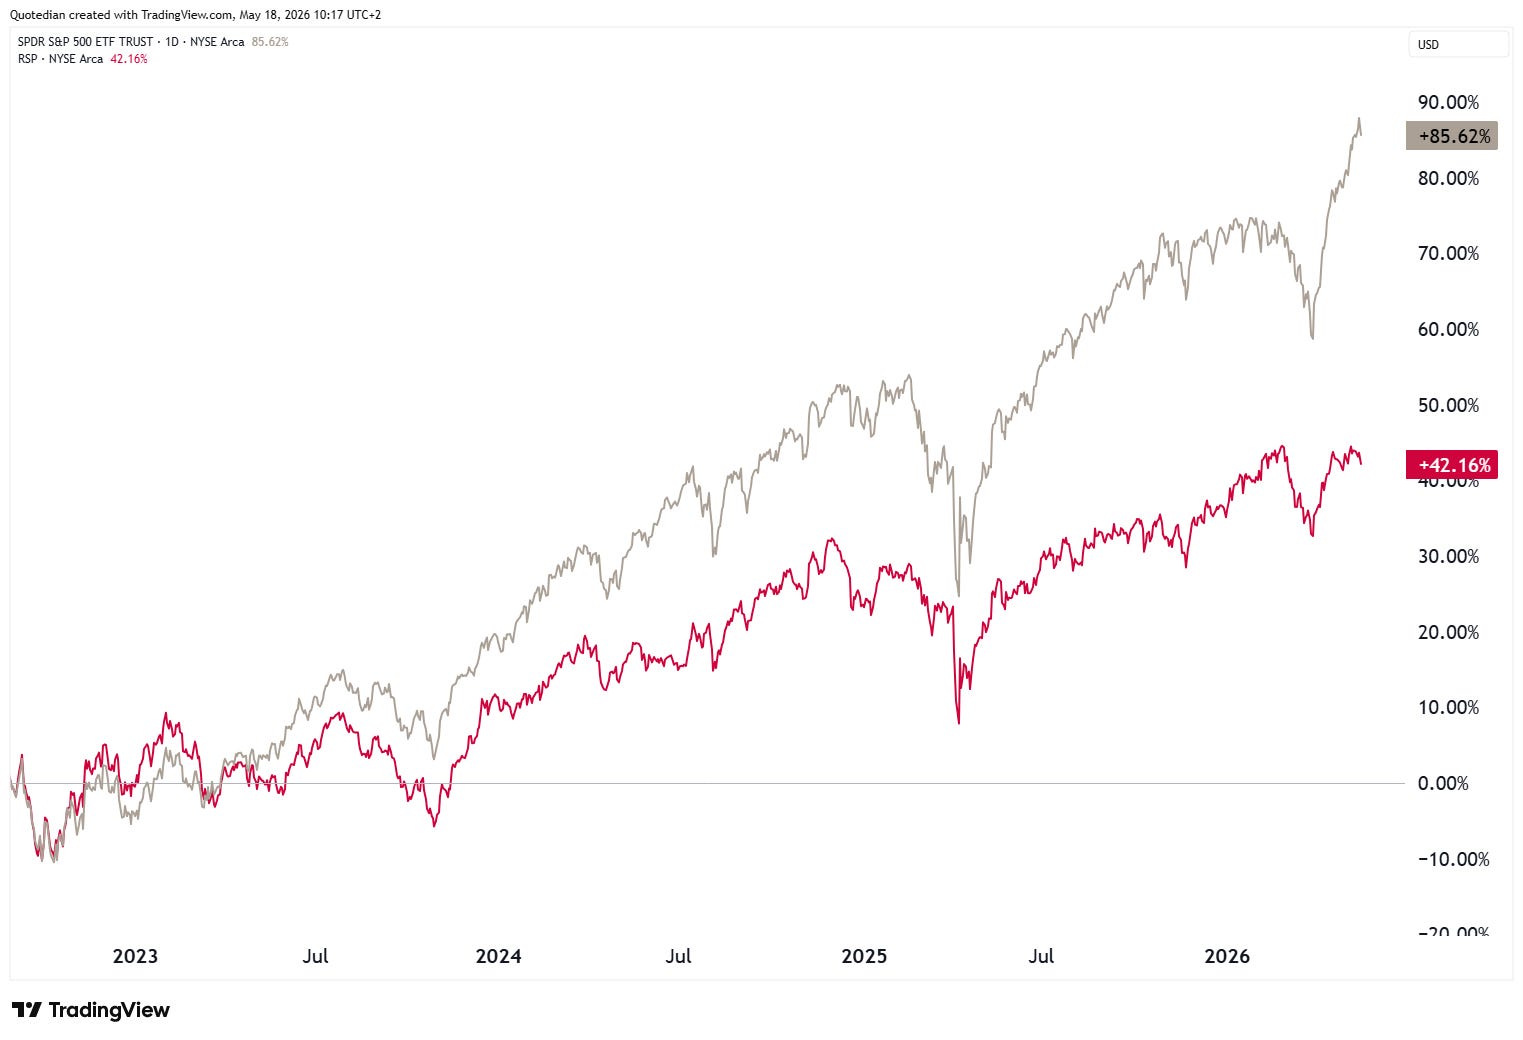
but also since the 2022 bear market ended late that year:
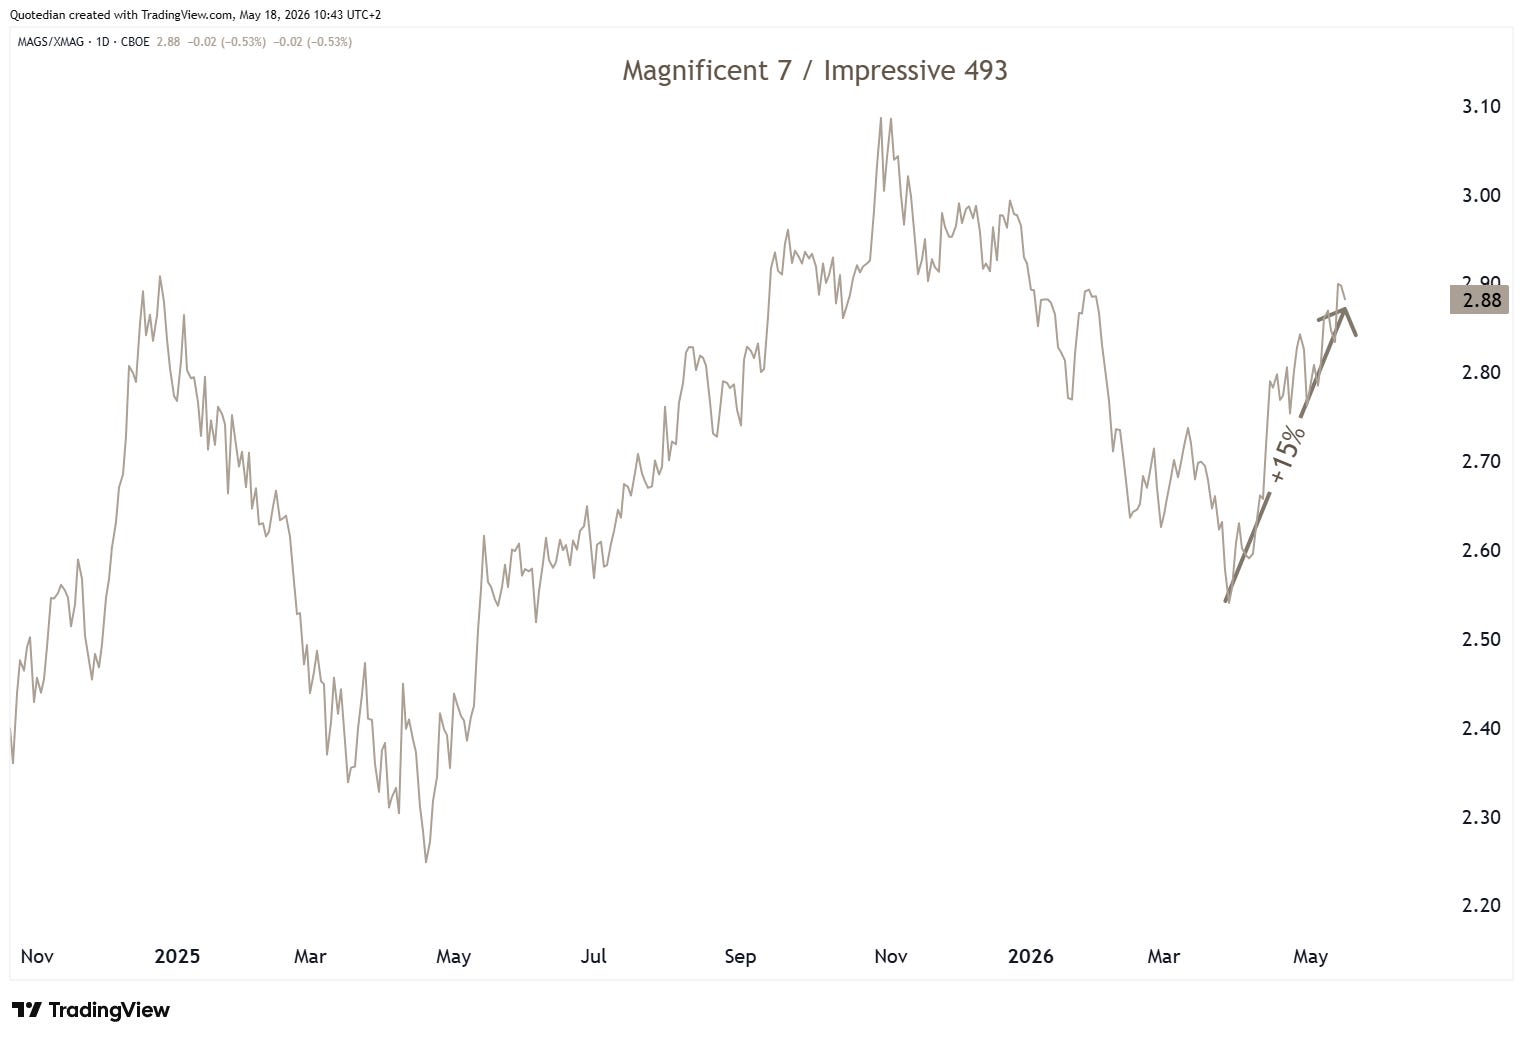
This outperformance of the biggest weight stocks in the S&P 500 is of course also depicted in the ratio of the Magnificent 7 (MAGS) to the Impressive 493 (XMAG):
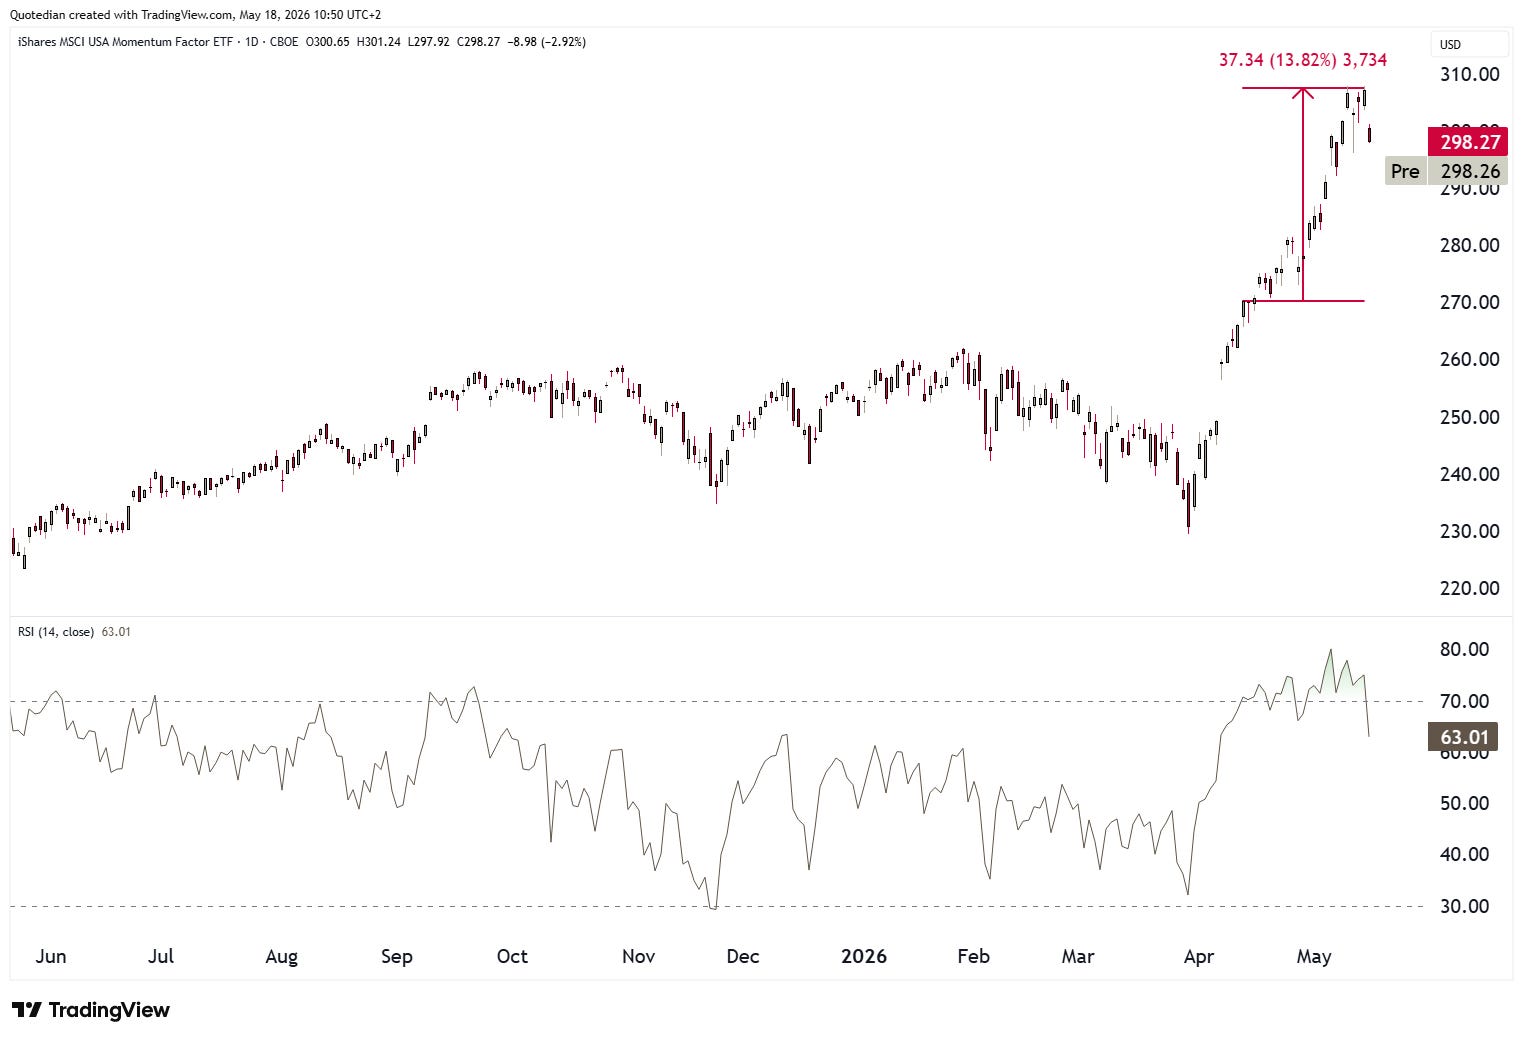
Similarly, should, and as you can see we emphasise should, a correction/consolidation ensue, then momentum stocks may get hit hard. Friday’s nearly three percent drop in the iShares MSCI USA Momentum ETF would be only a small pre-taste of what could happen:
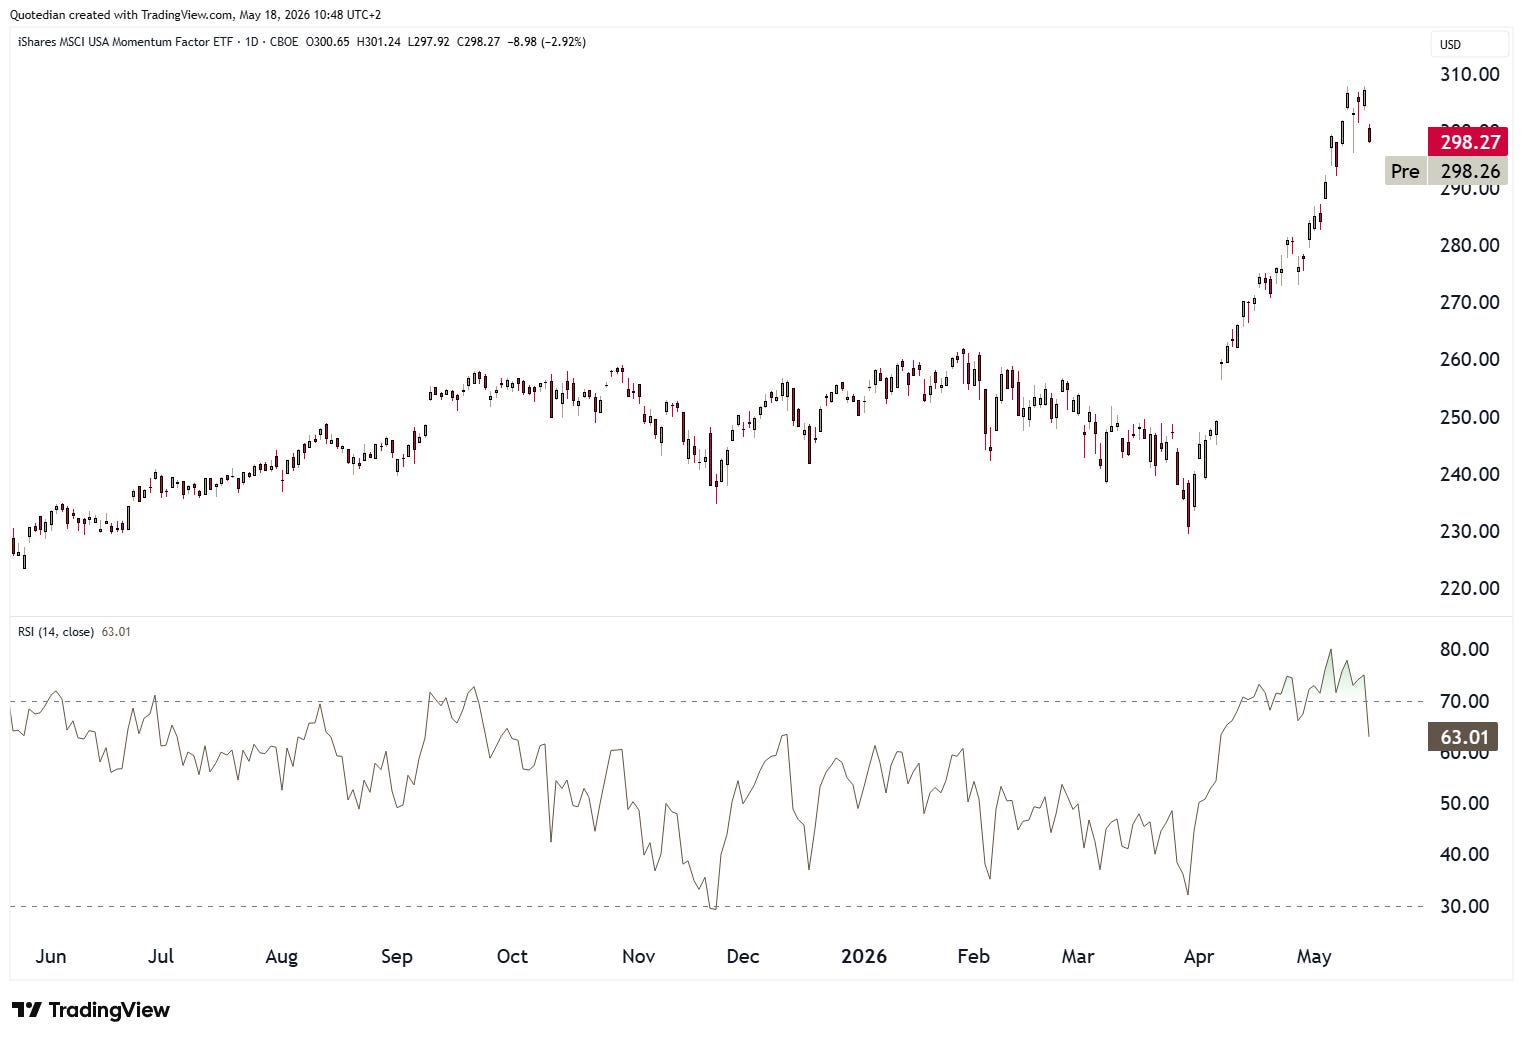
But the chart above also serves as a powerful reminder on how persistent strong trends can be. Consider this, the RSI on the MTUM EFT went into overbought territory (>70) on April 14th. The index added another nearly 14 percent until Thursday’s all-time high (ATH), with the RSI just becoming ‘richer’:
However, when comparing the momentum factor to a minimum volatility factor on the US stock market, as the fantastic chart below from Alpine shows, it is easy to get dizzy (and ‘cautious’ on momentum stocks):
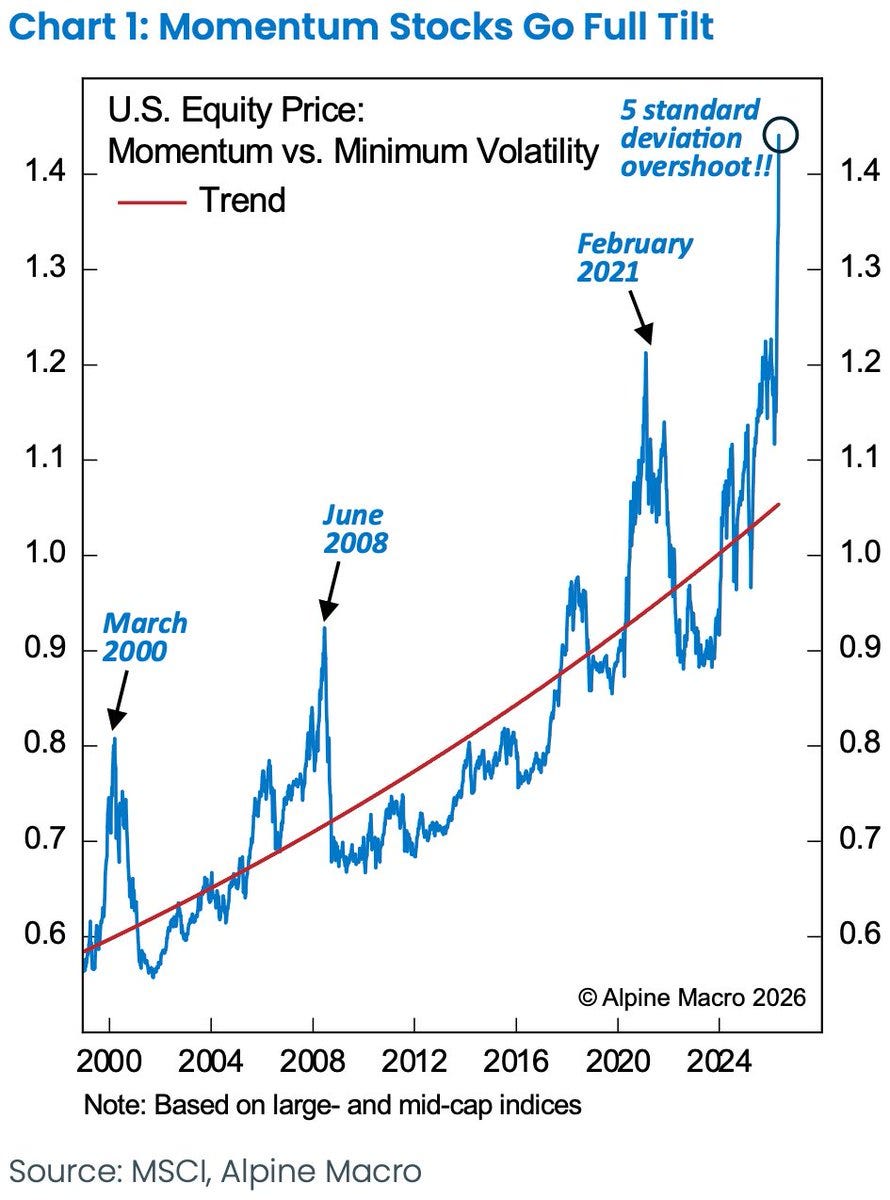
Maybe time to listen to that U2 ‘Vertigo’ track?
And here’s another ‘external’ statistic worth sharing. The table below from Yardeni Research show the S&P 500 end of year targets of many well-know firms across Wall Street:
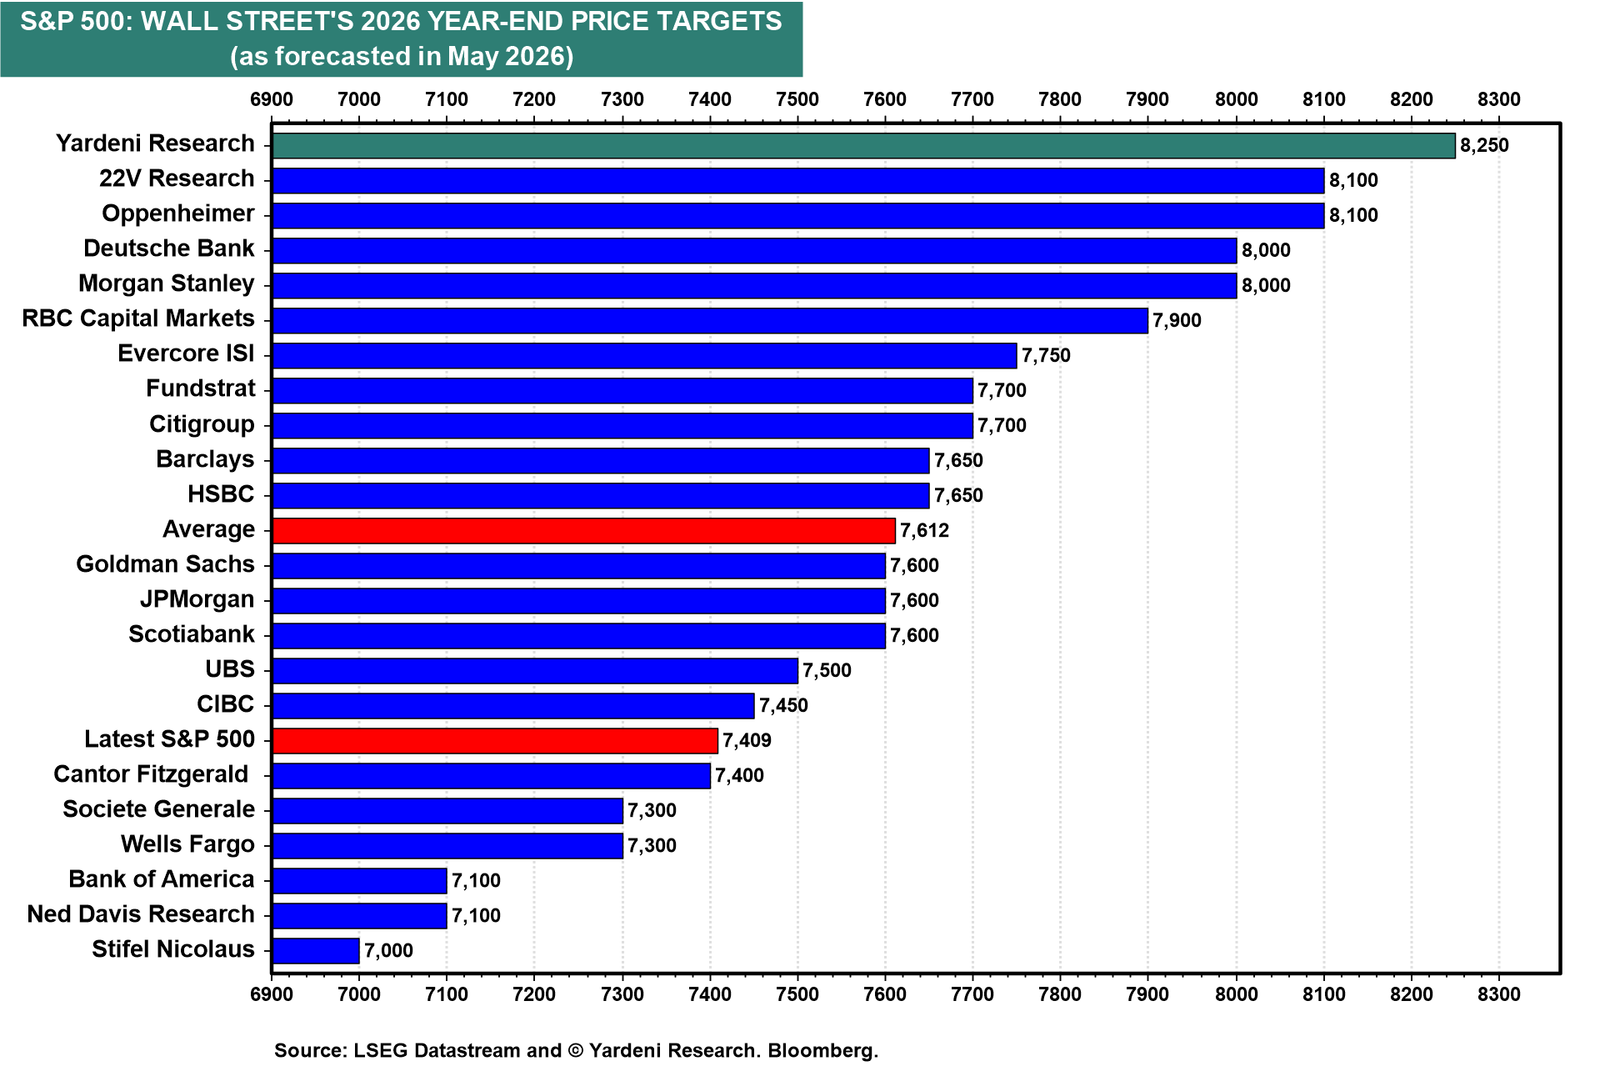
To note: 1) Yardeni themselves are the most constructive (+11%) and the average forecast is now only 2.7% away from Friday’s close…FWIW
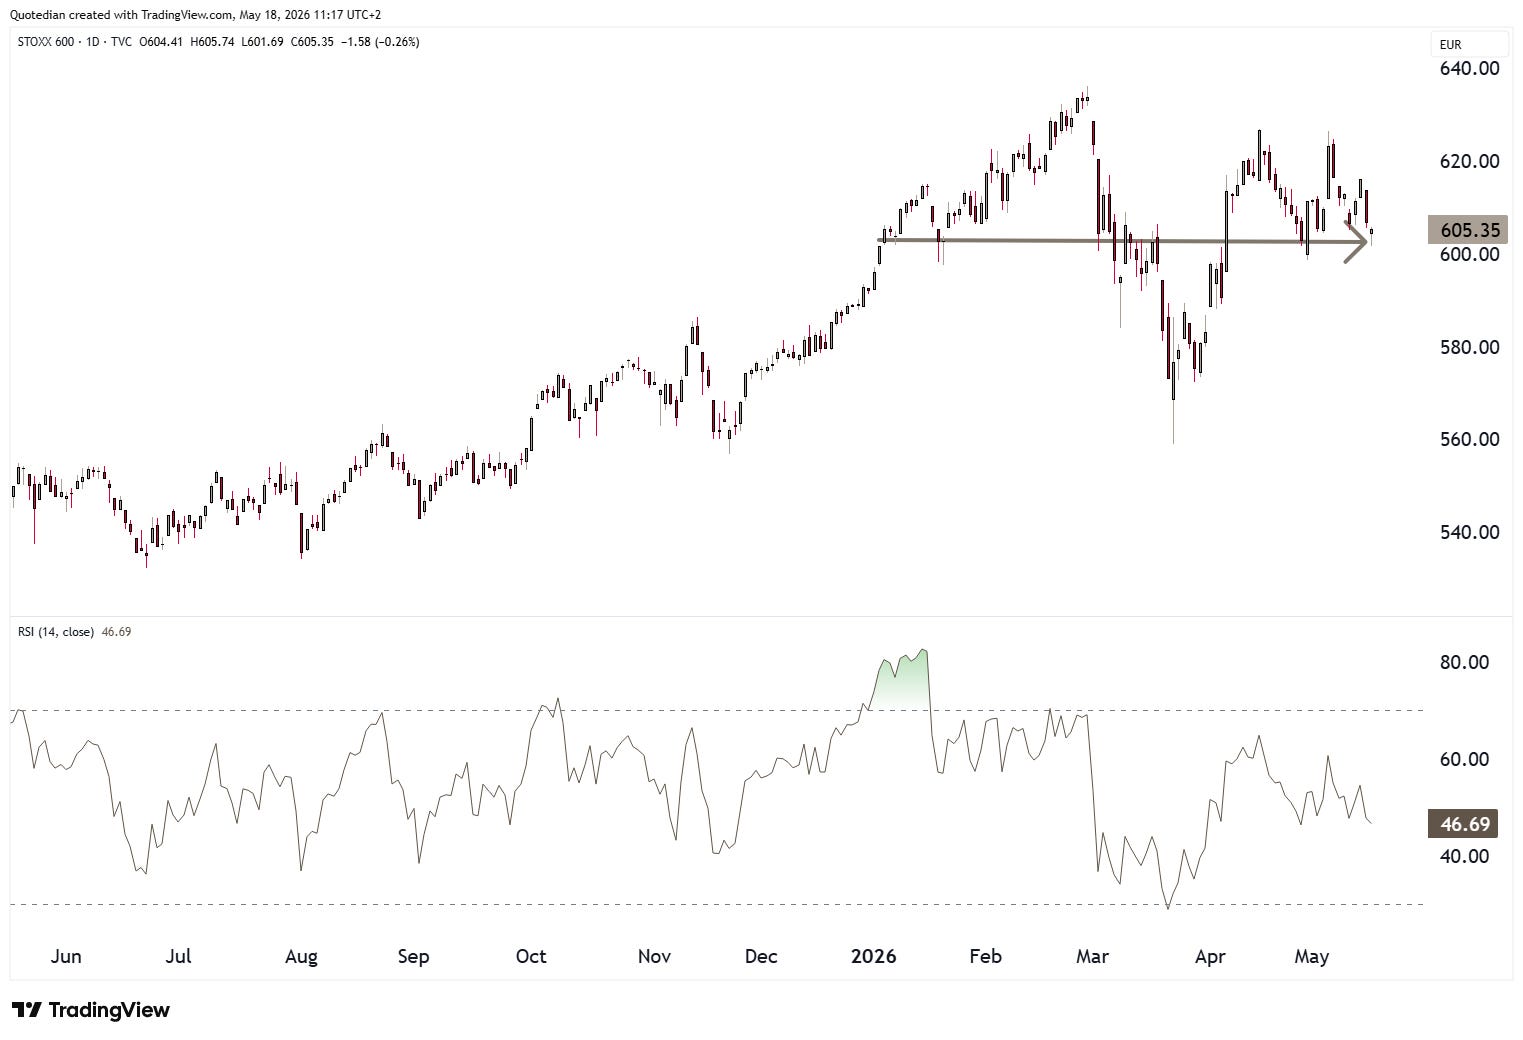
In Europe, dizziness or vertigo are less of an issue, mildly put, as stocks have not gone anywhere since the beginning of the year:
Here’s a YTD performance overview of some of Europe’s more important local markets:
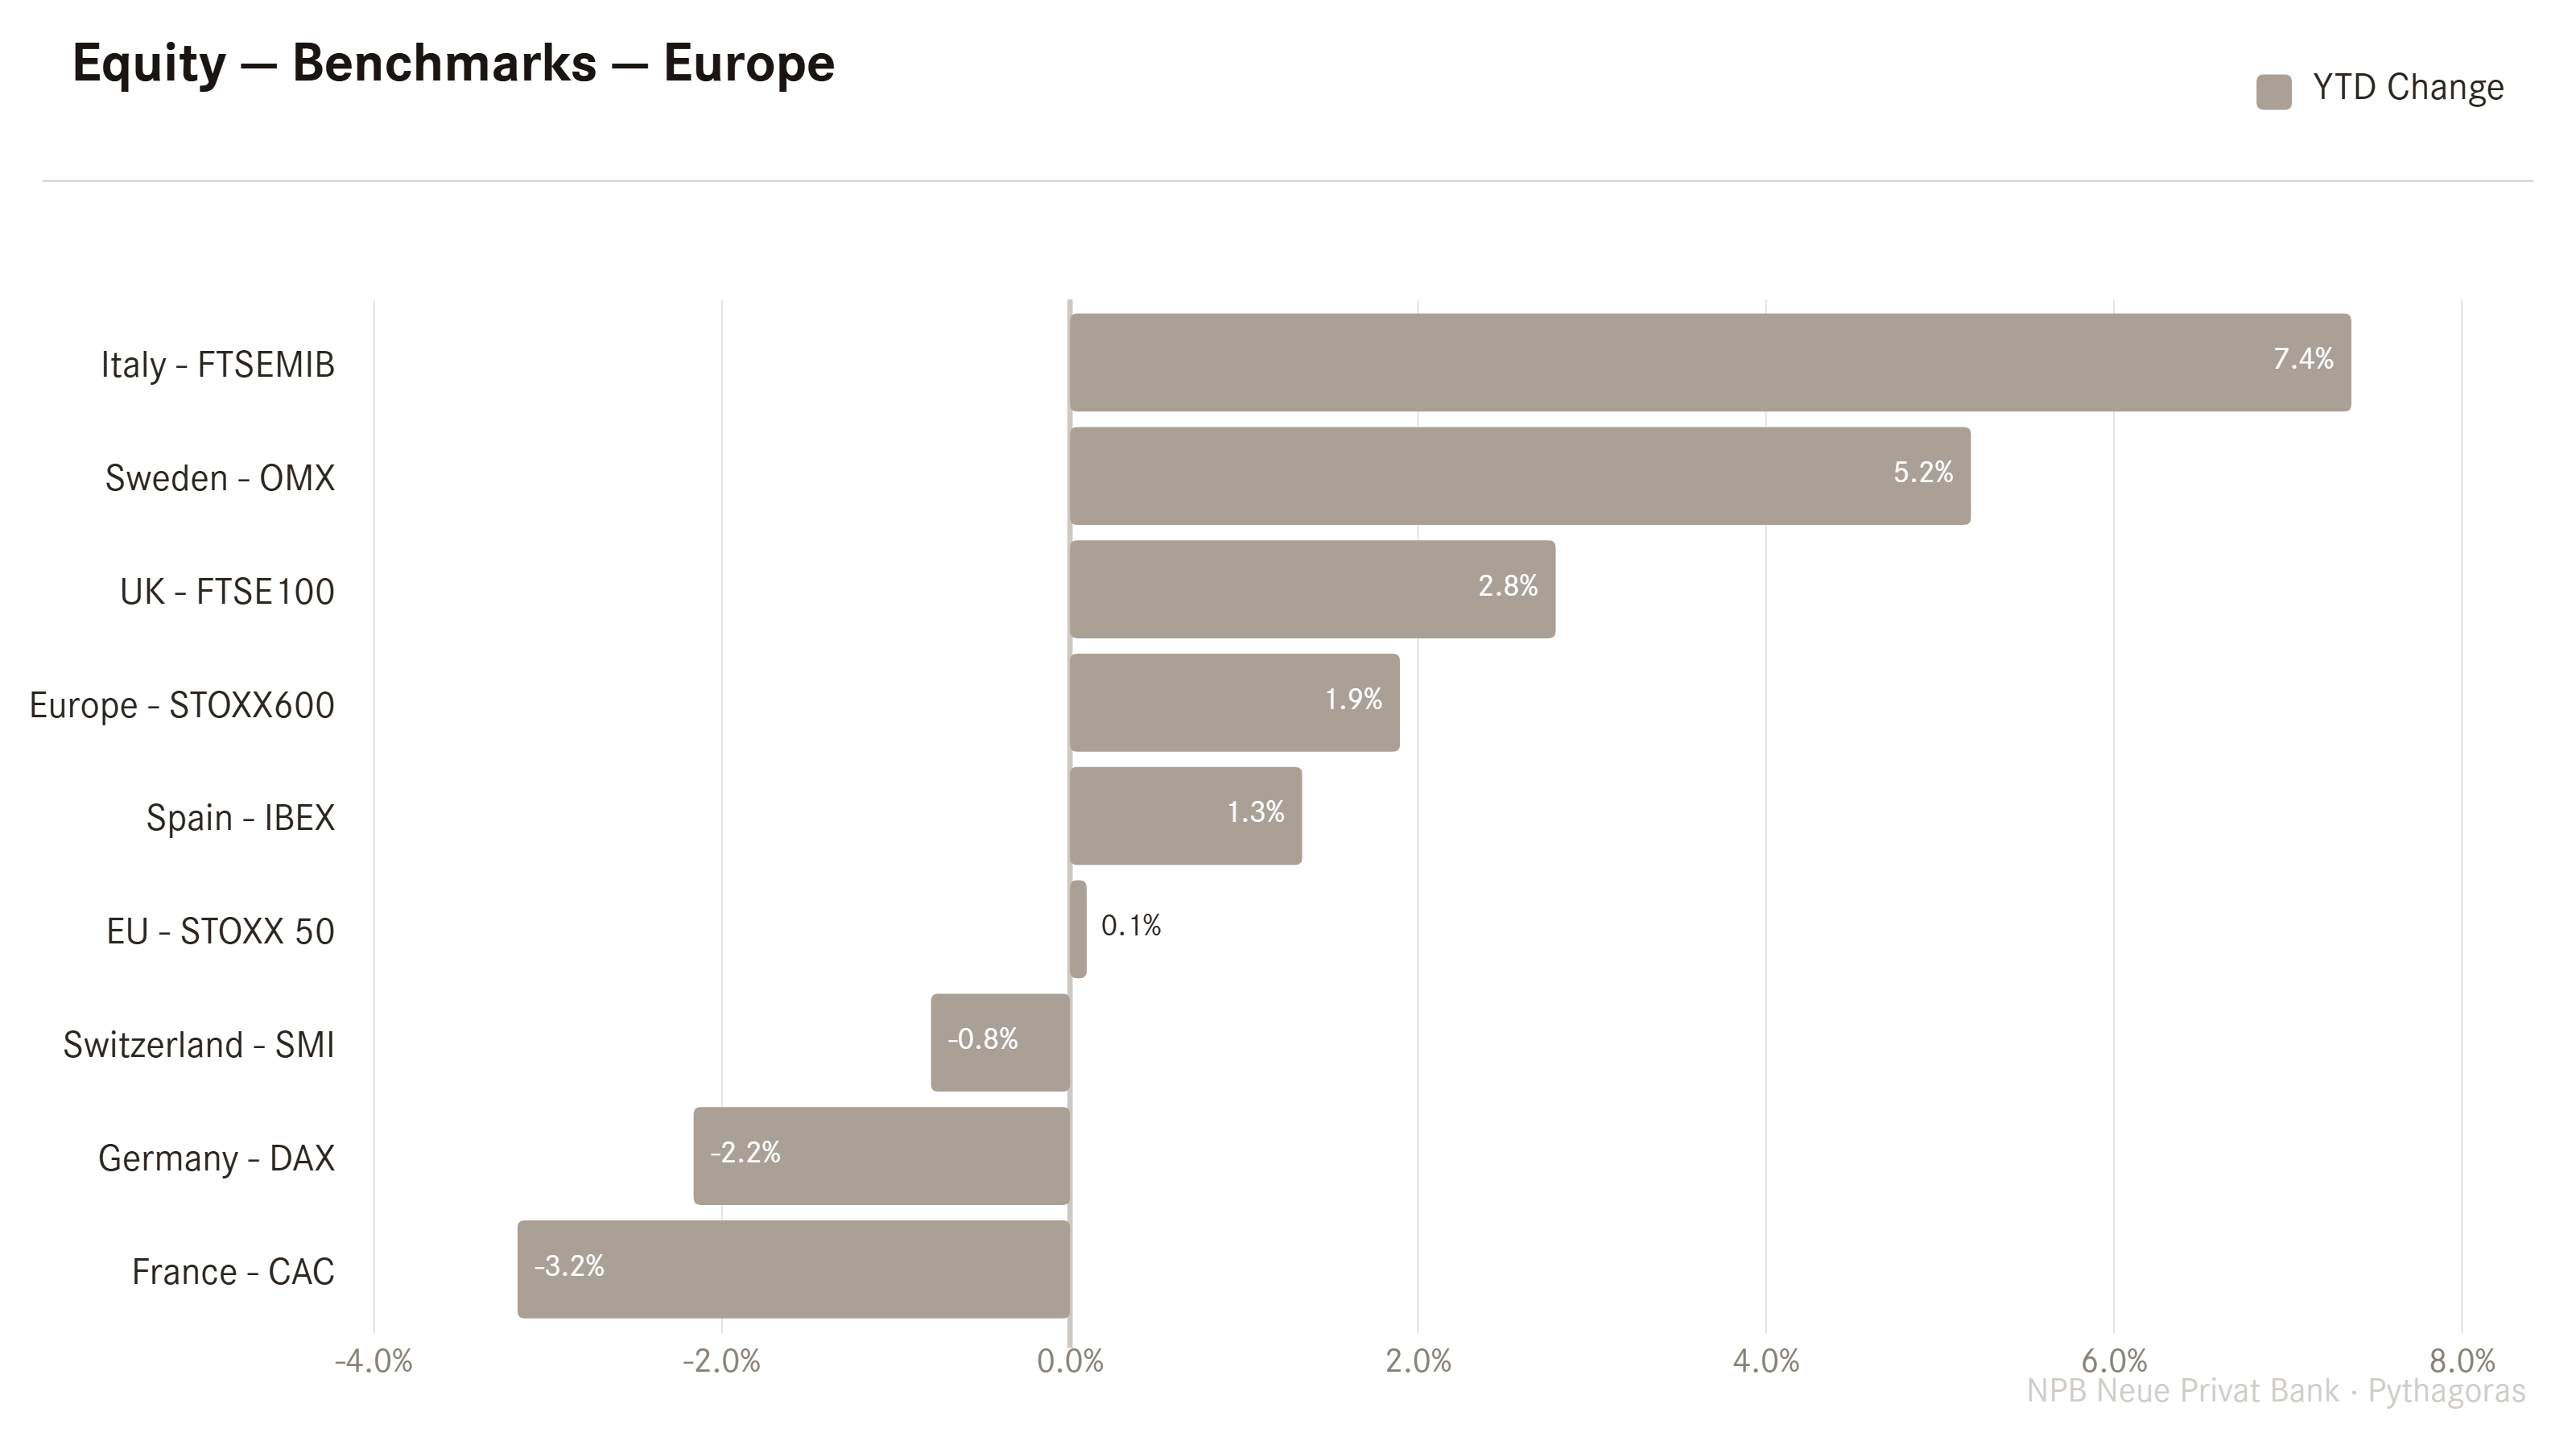
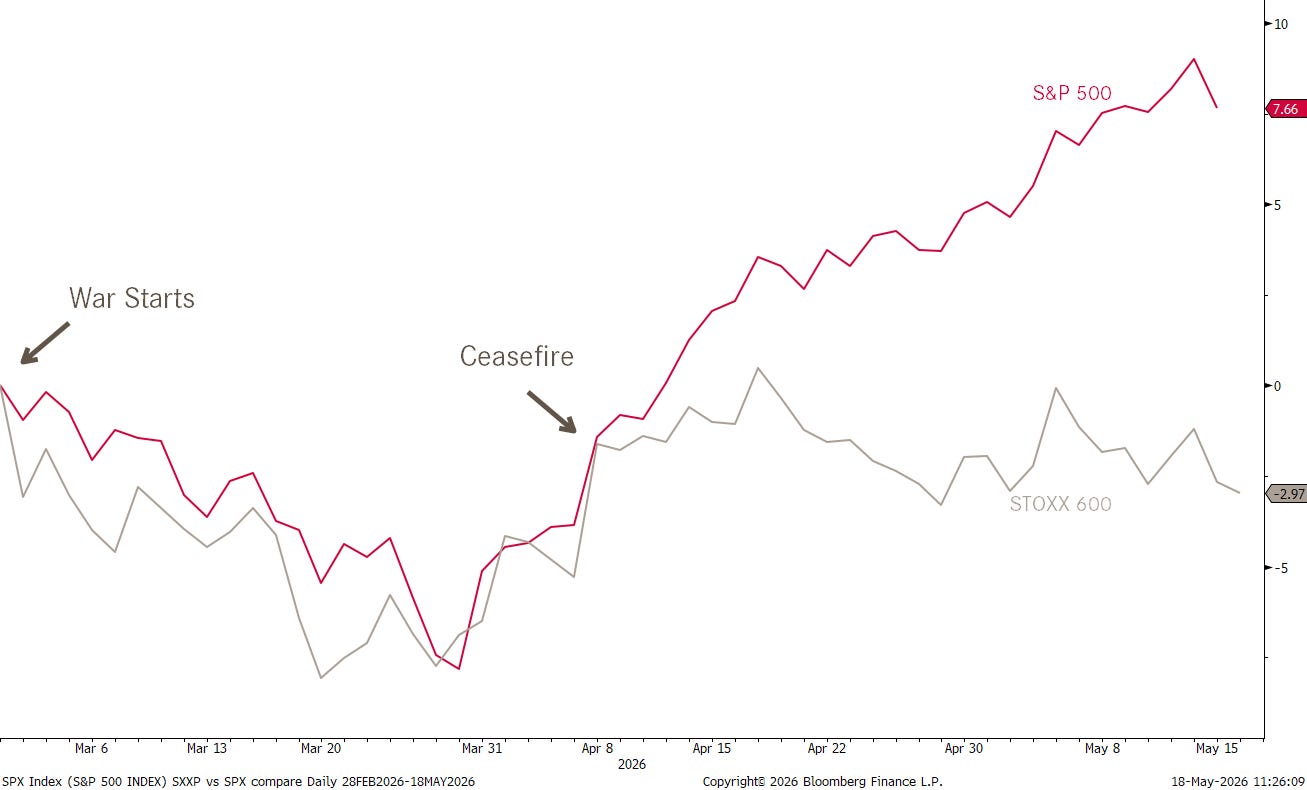
Overall a mixed and sad picture, with the post-ceasefire divergence between US (red) and European (grey) stocks continuing:
Let’s speed things up a bit and hurry over into the equity sector section. While Energy stocks continue to be the best performing sector on a global level,
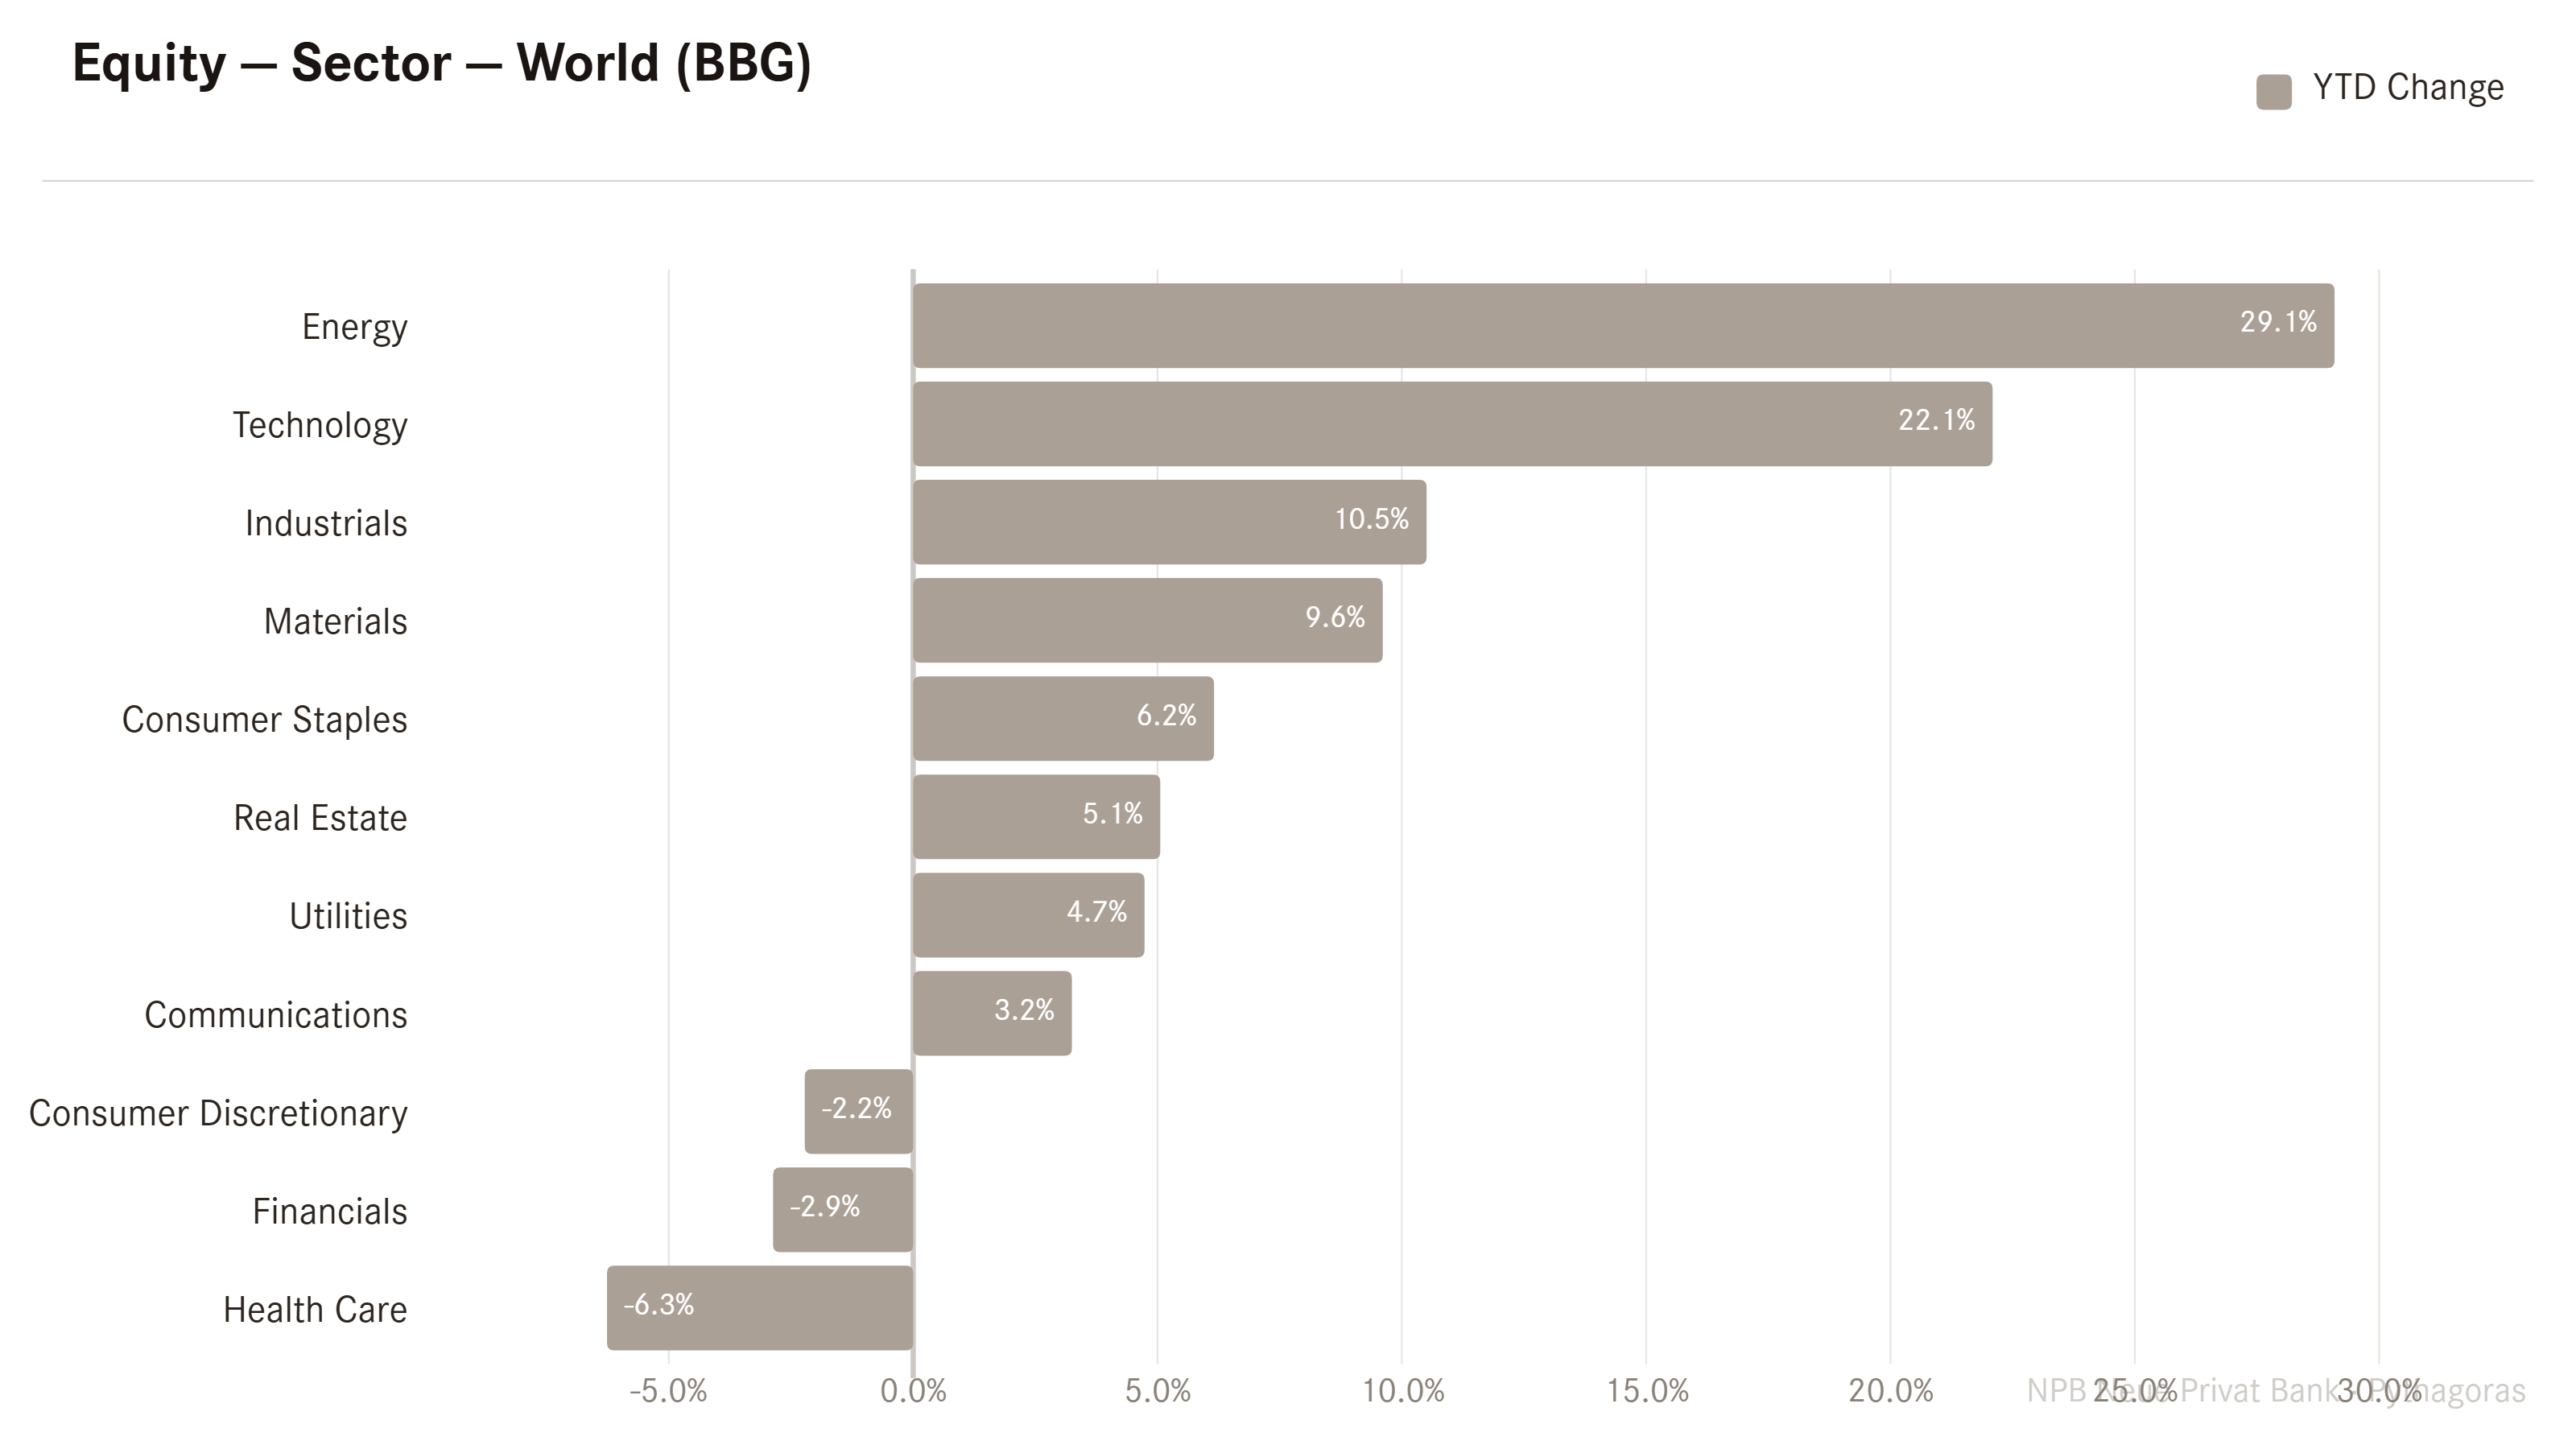
momentum in Technology stocks has been so strong over the past weeks that this sector was catapulted to the top spot in our relative strength tournament:
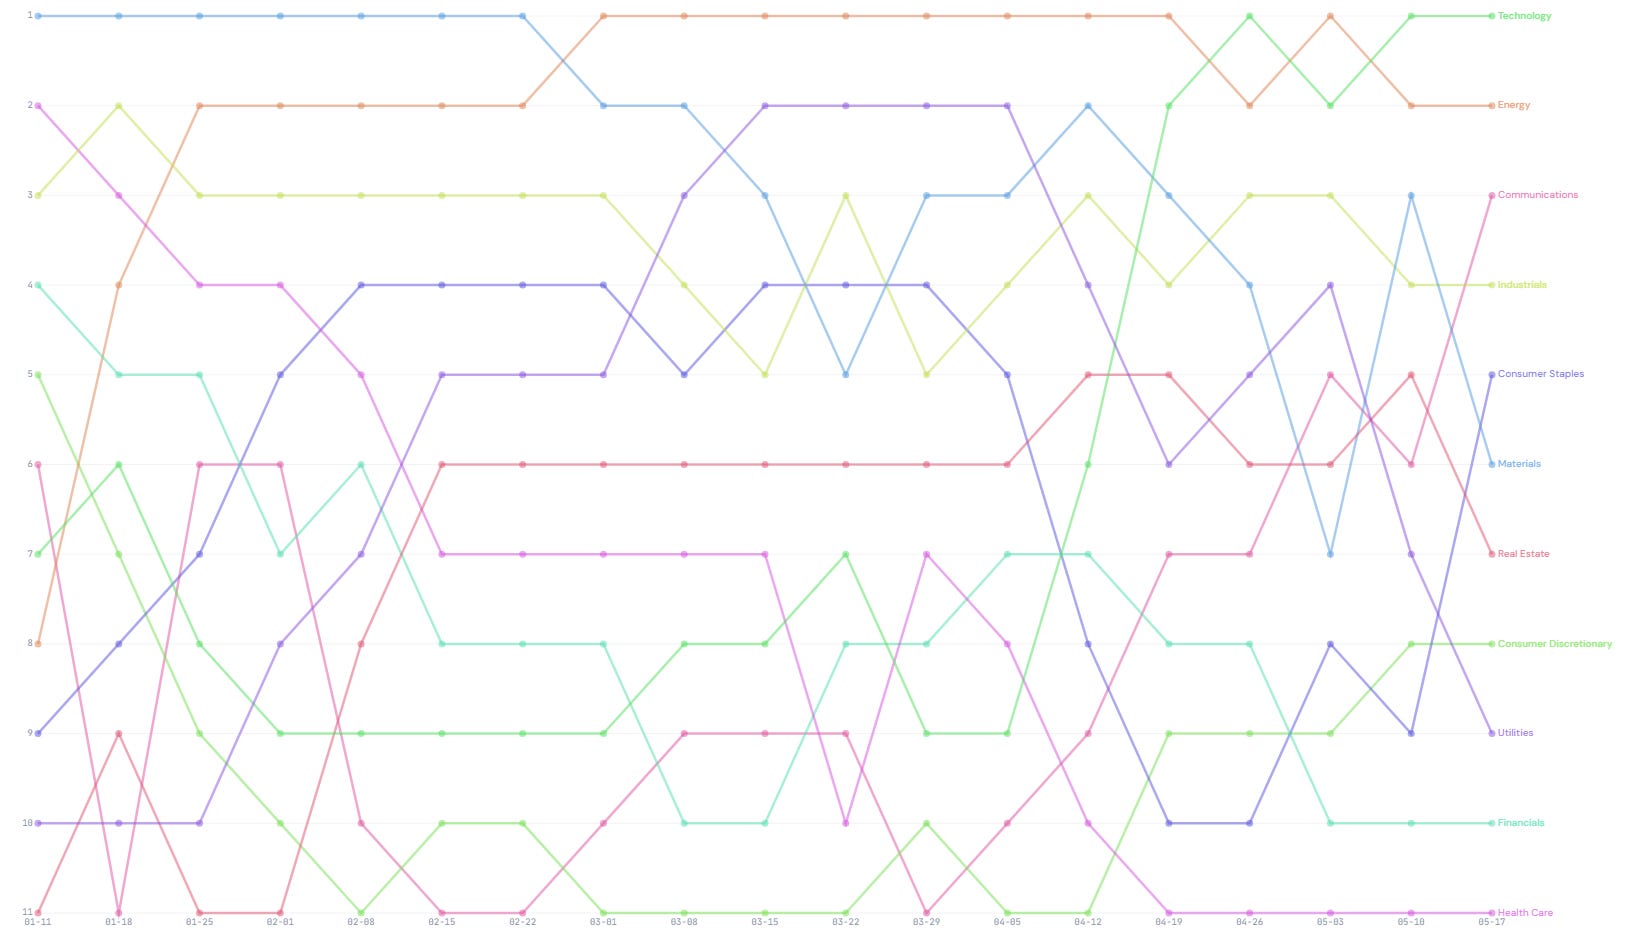
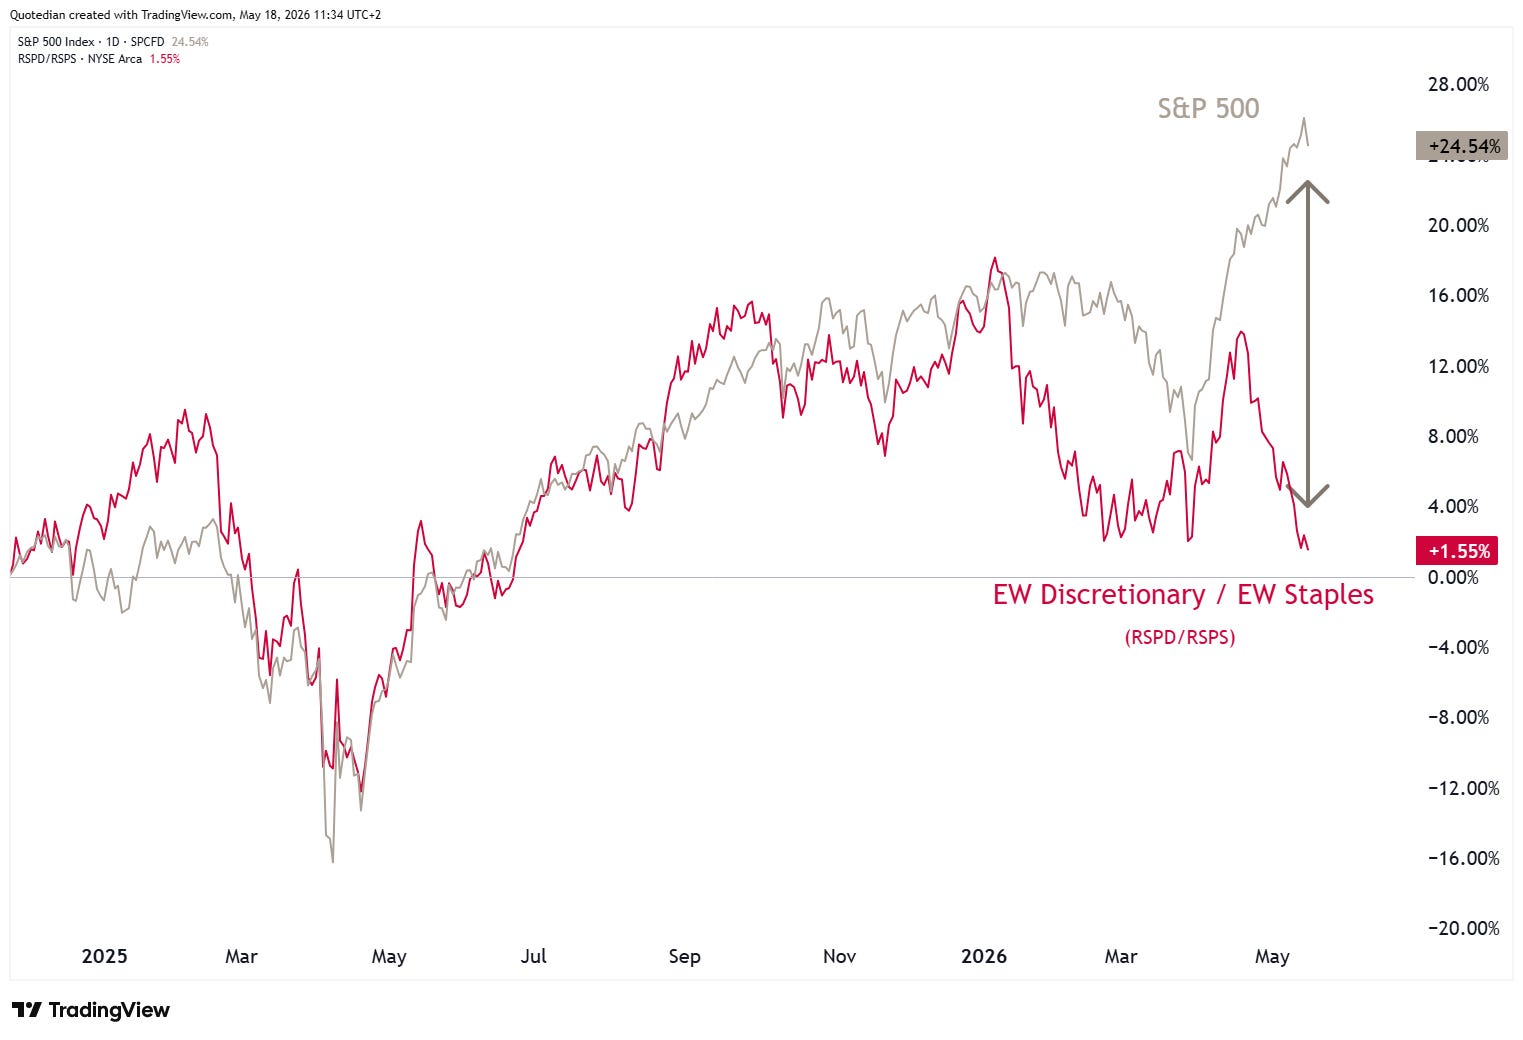
One interesting sector observation, and maybe an early warning sign to the overall market, has been the recent underperformance of discretionary to staples stocks:
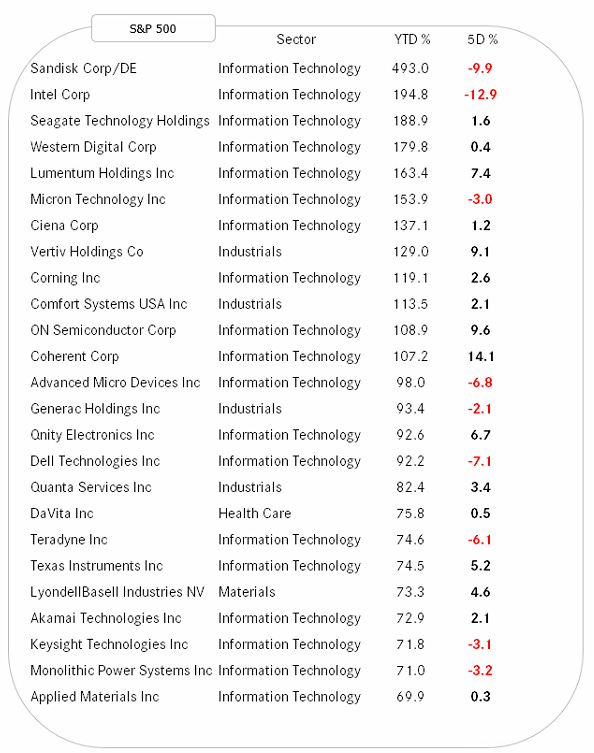
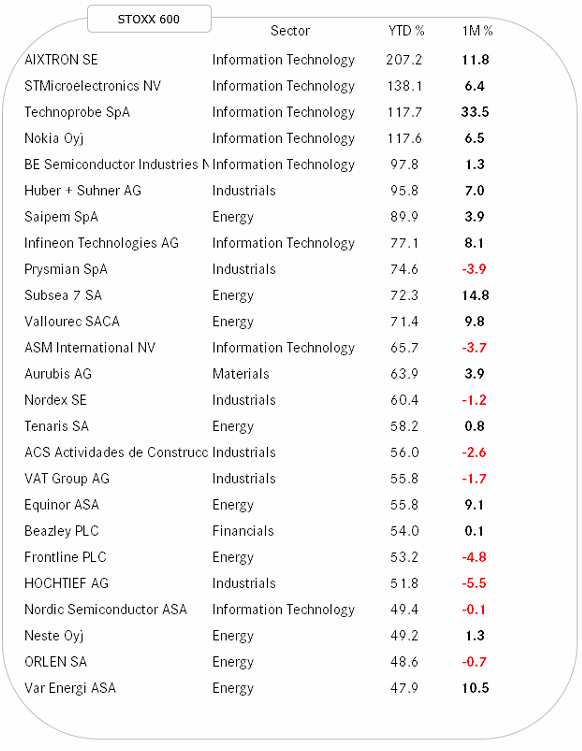
Finally, to complete the equity section, our usual look at the best performing stocks in the US and Europe on a year-to-date basis and how they have performed over the past week.
Starting with the US leaderboard, we note that the two highest flying Ikarus stocks have seen a small correction (small in the context of their preceding gains), but most stocks continued to drive up north:
This overall positive picture also prevails for the European “Top of the Pops” list:
In foreign exchange (currency) markets, the US Dollar suddenly has shown firmness against every other currency in the expanded table below, bar one (non-tradable) exception:
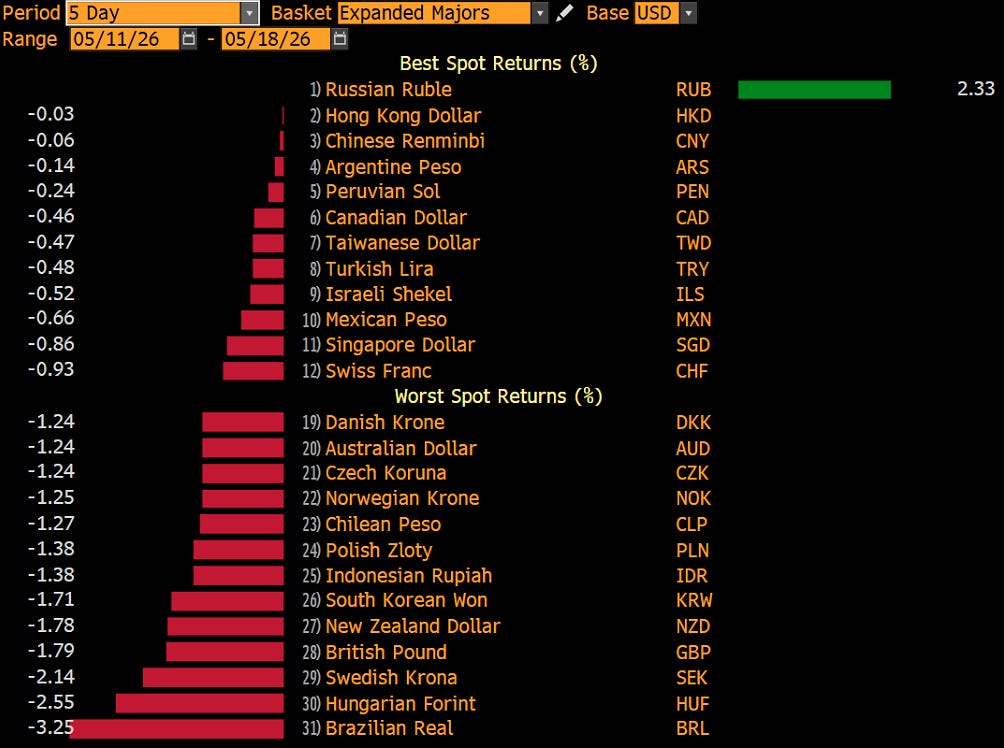
We Sherlock Homes-like then conclude that the US Dollar Index (DXY) should also have moved higher over the past week:
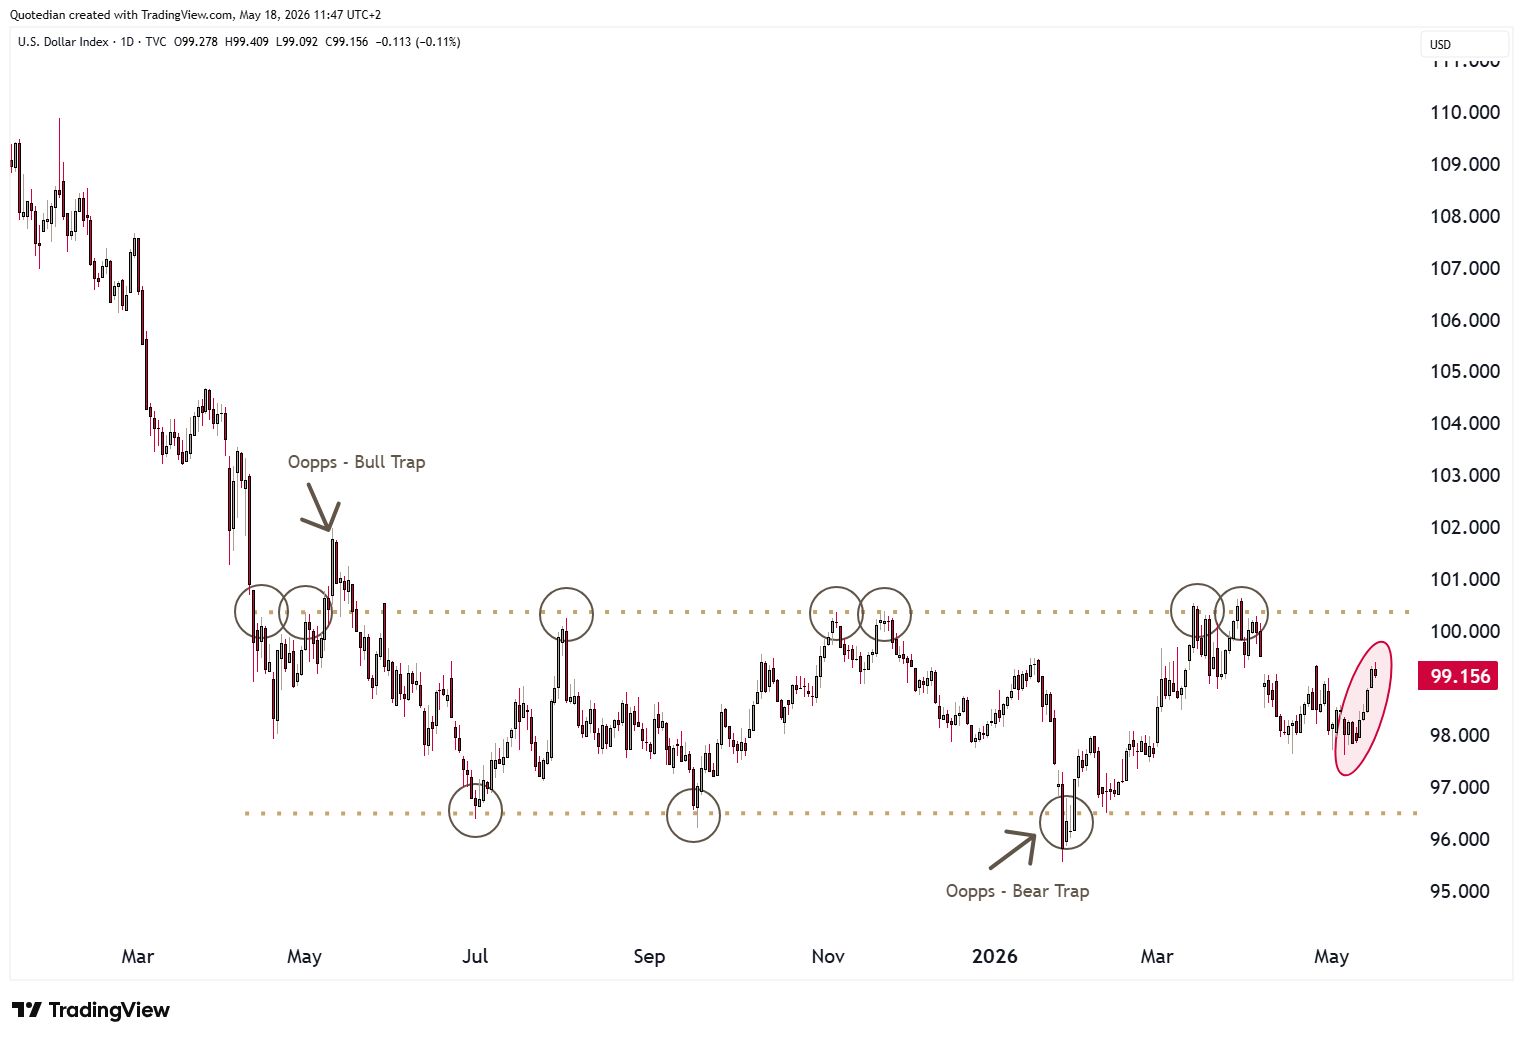
Geniuses, aren’t we?!
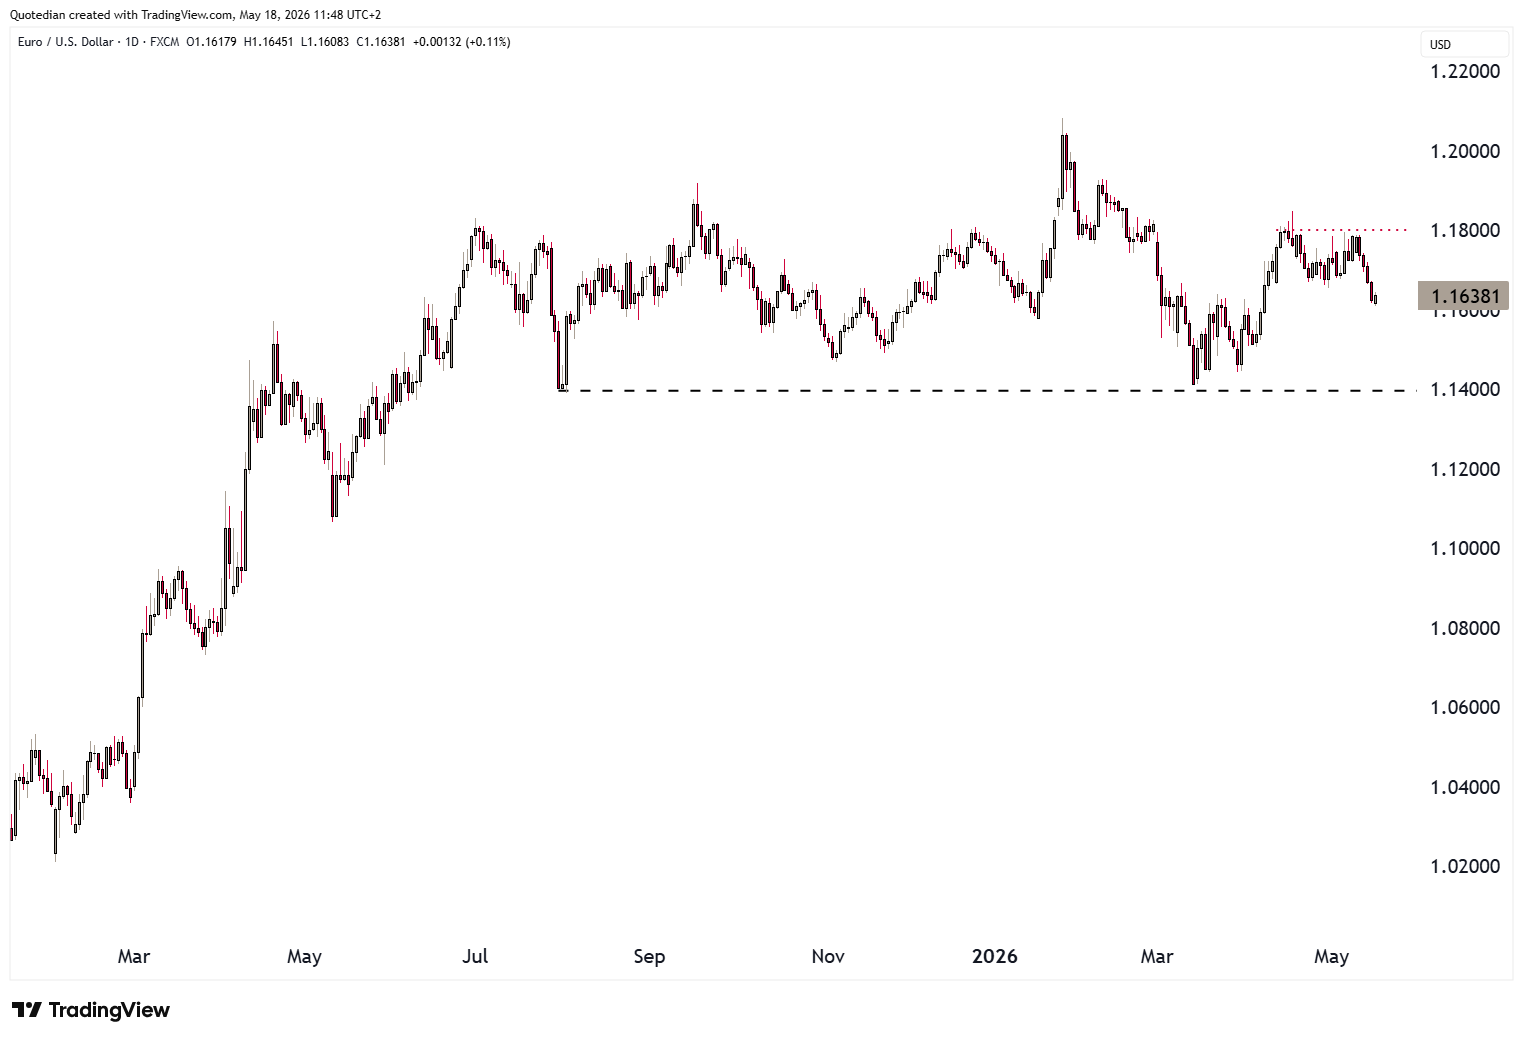
The EUR/USD upside breakout (red, dotted) failed and we are now dropping back towards key support at 1.14:
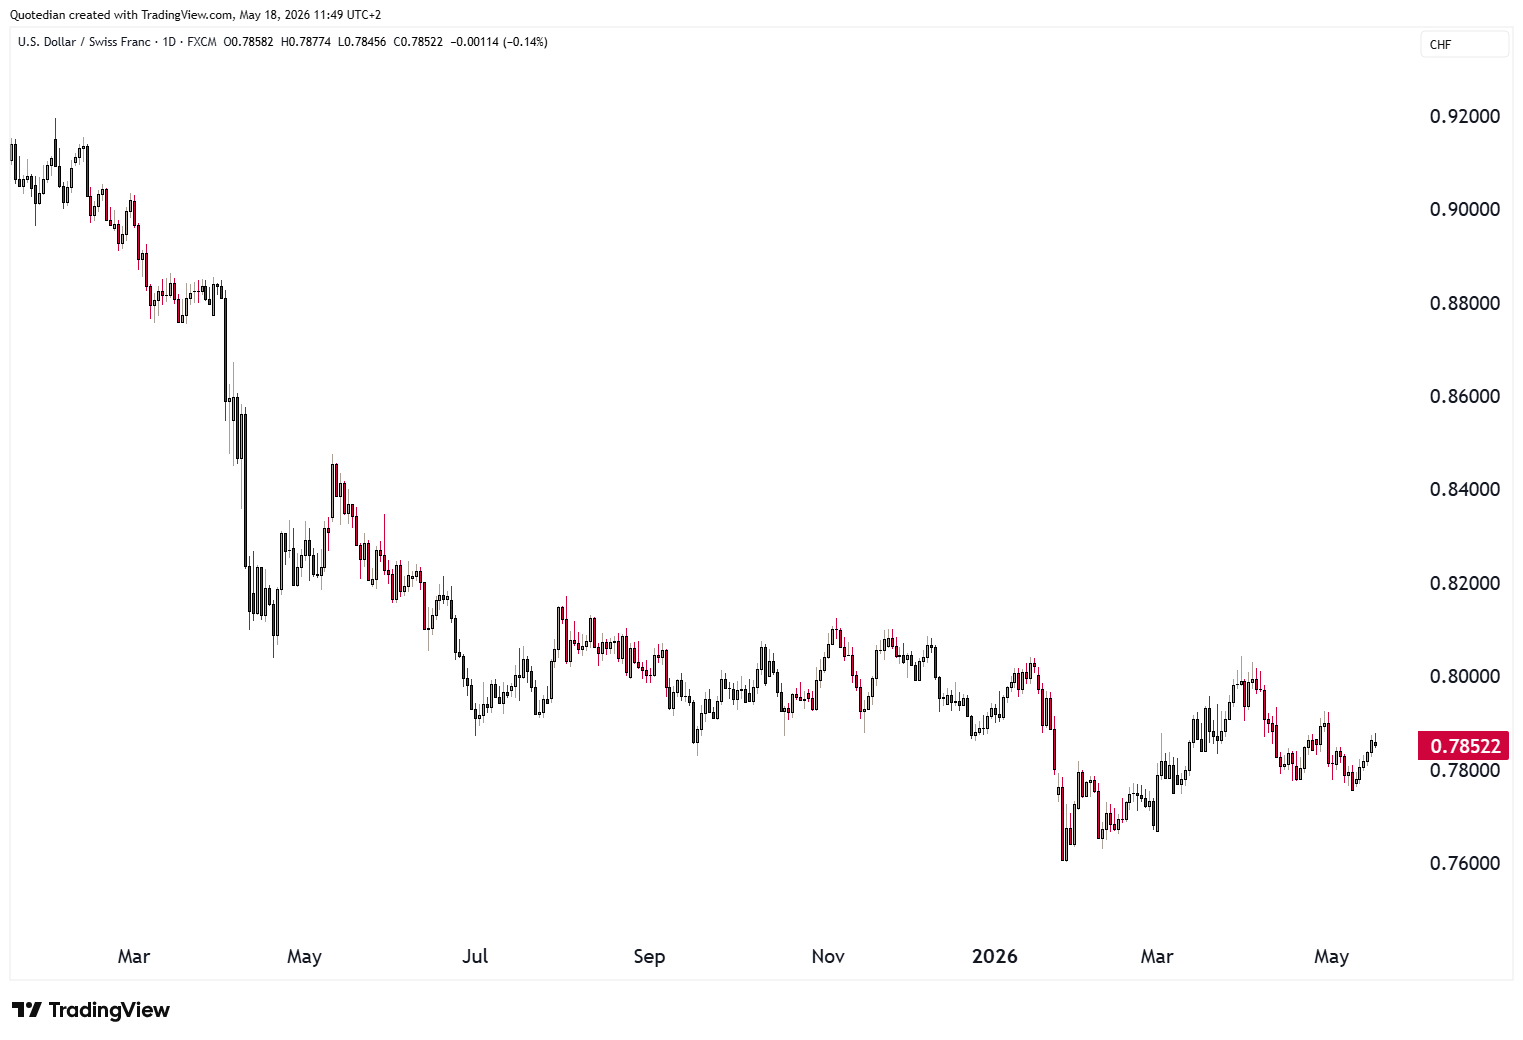
One central bank (SNB) will be happy to see their currency a bit less strong,
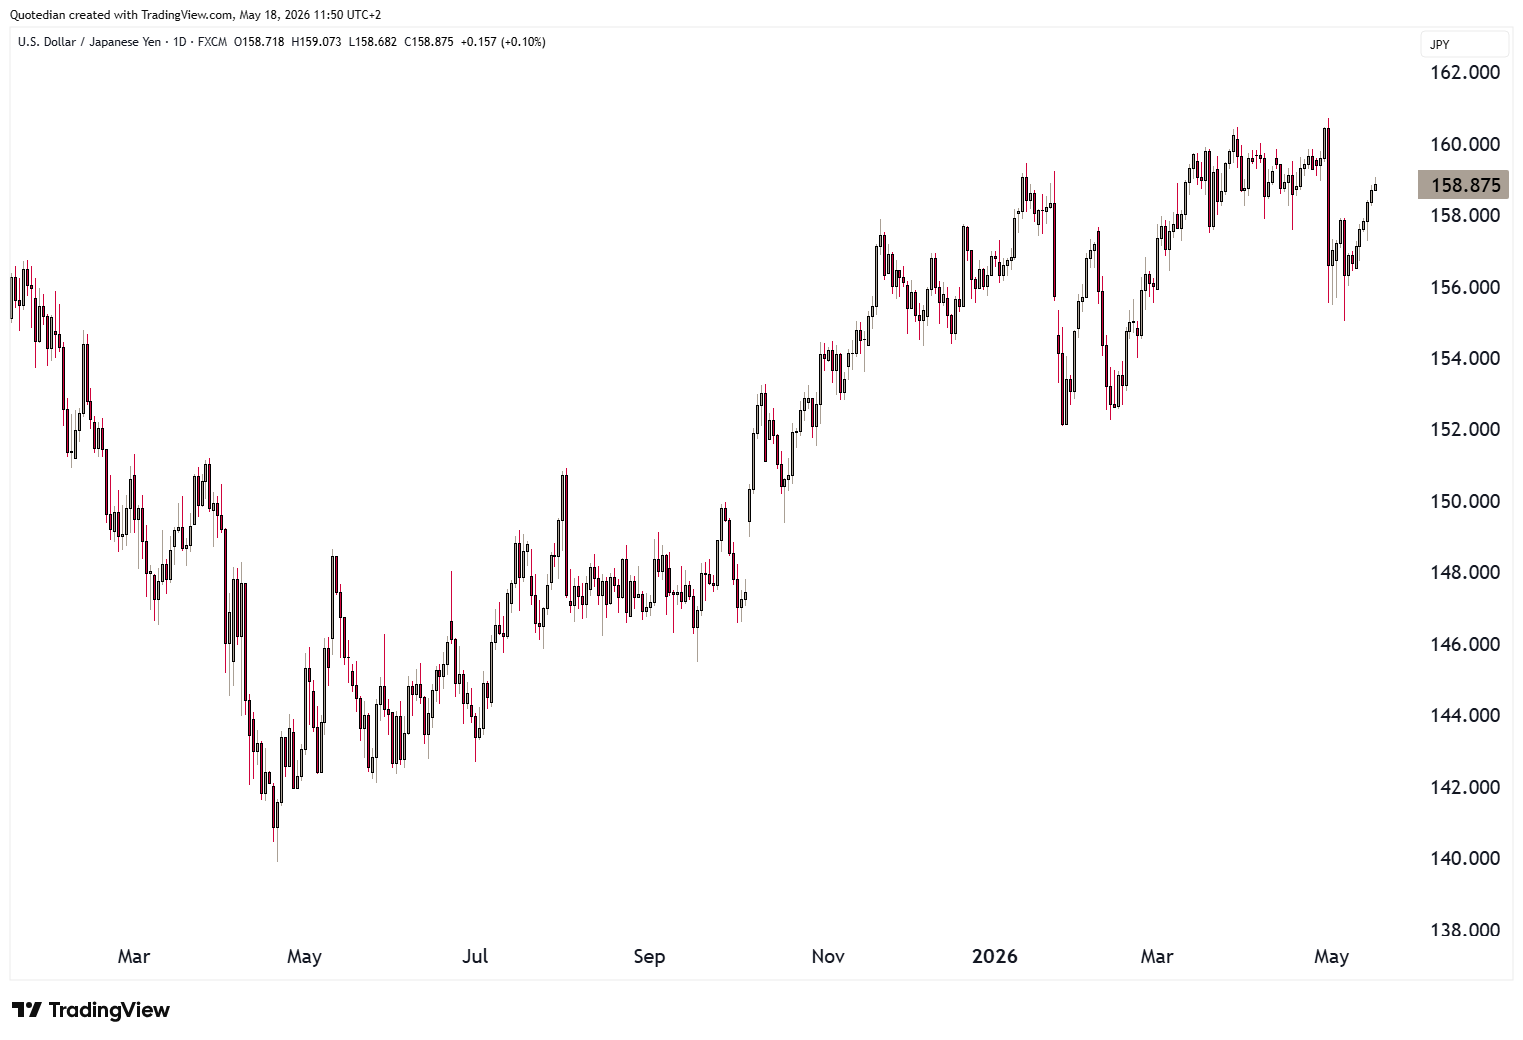
whilst another (BOJ) quite au-contraire:
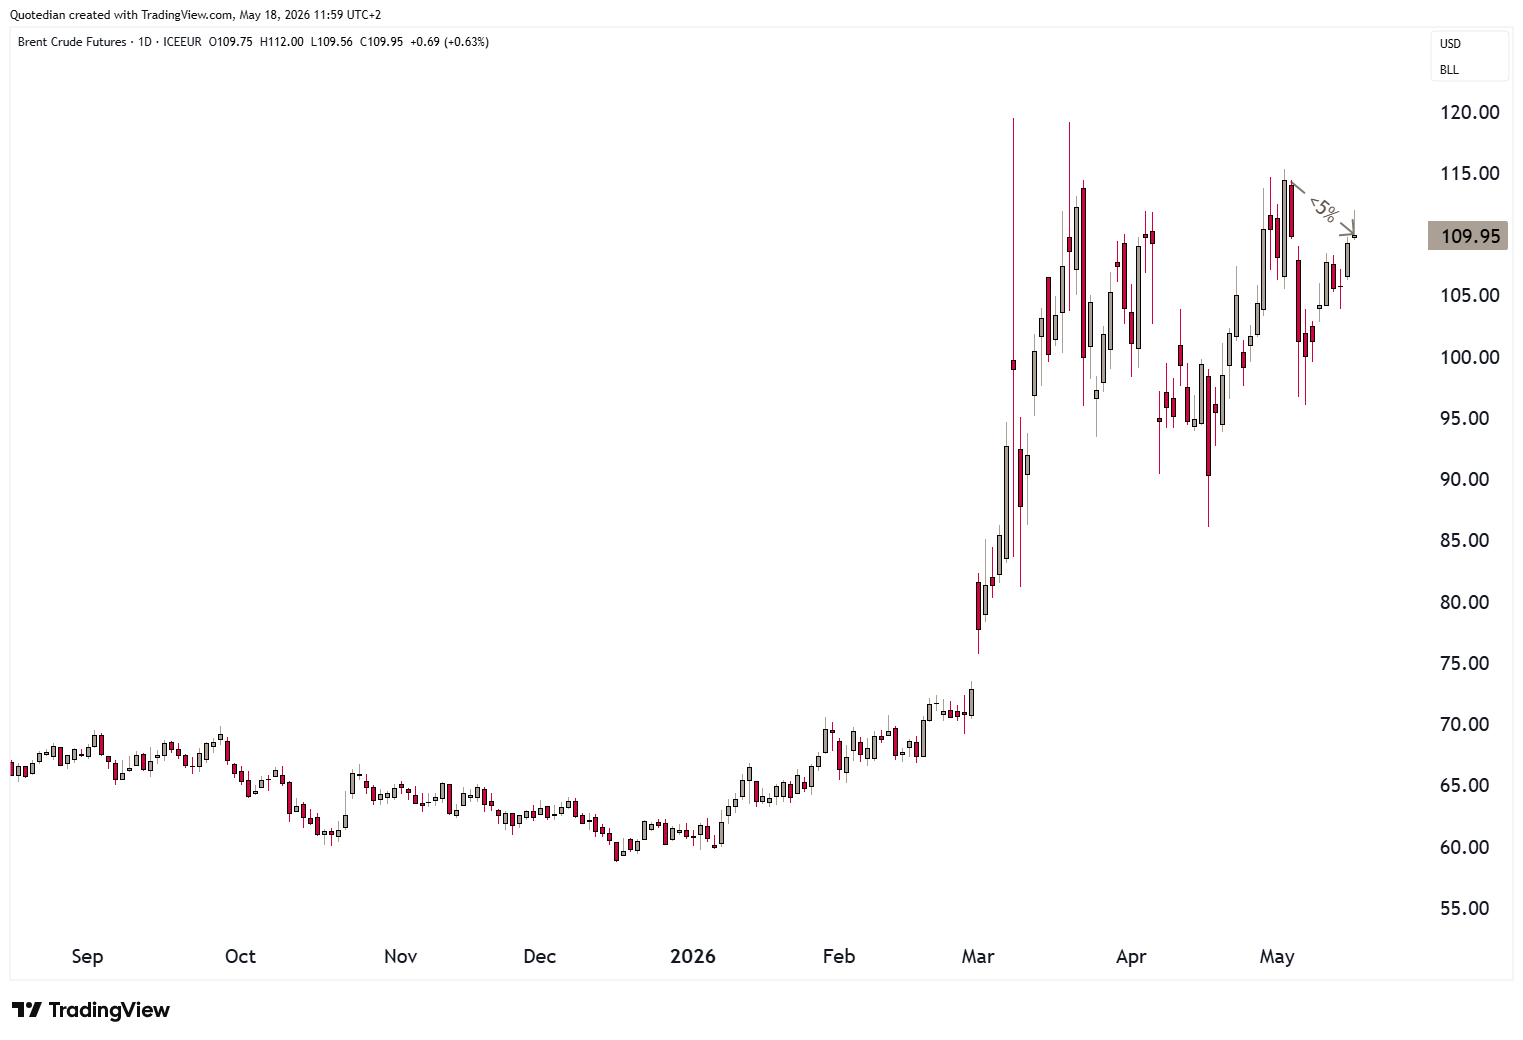
In the commodity space, oil (Brent) refuses to trade lower and is this morning (18.5.) trading less than 5% away from its highest close this cycle so far:
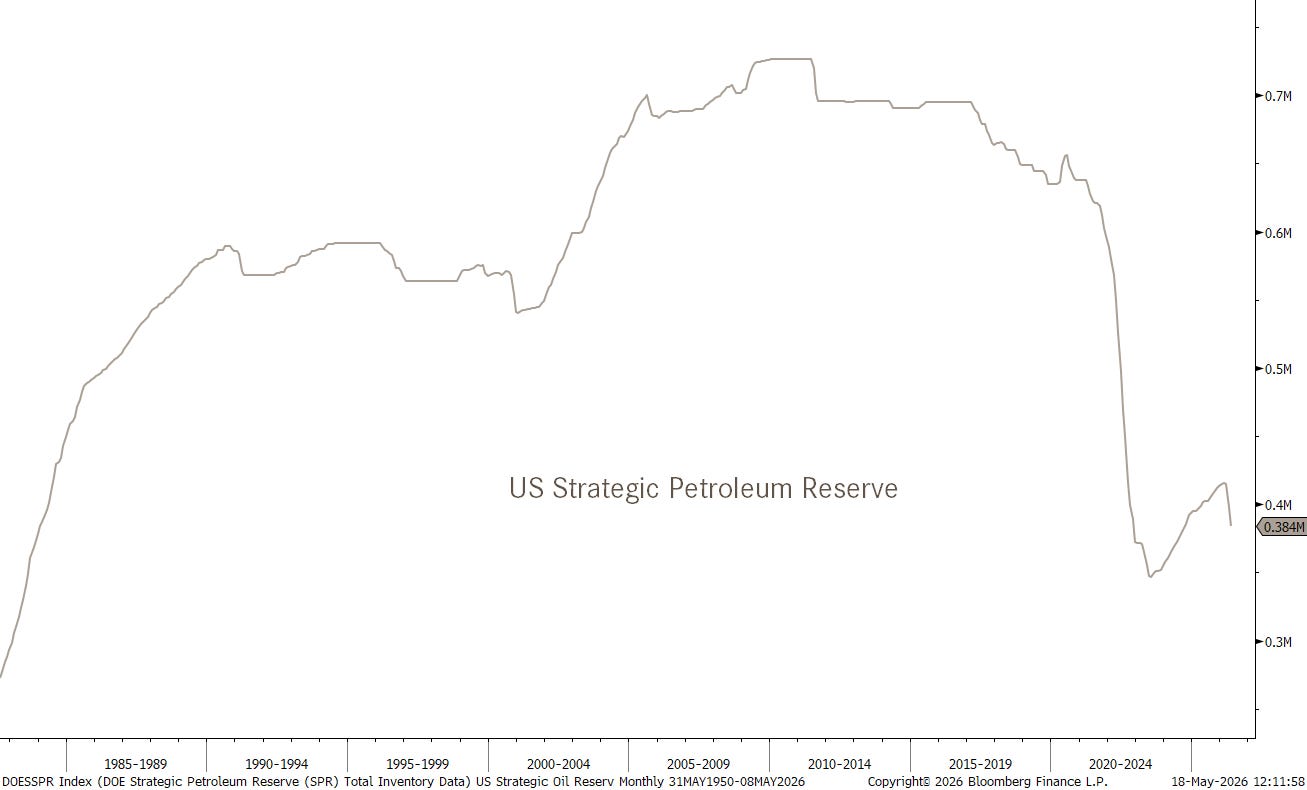
In the US (and elsewhere) strategic reserves are being deployed again:
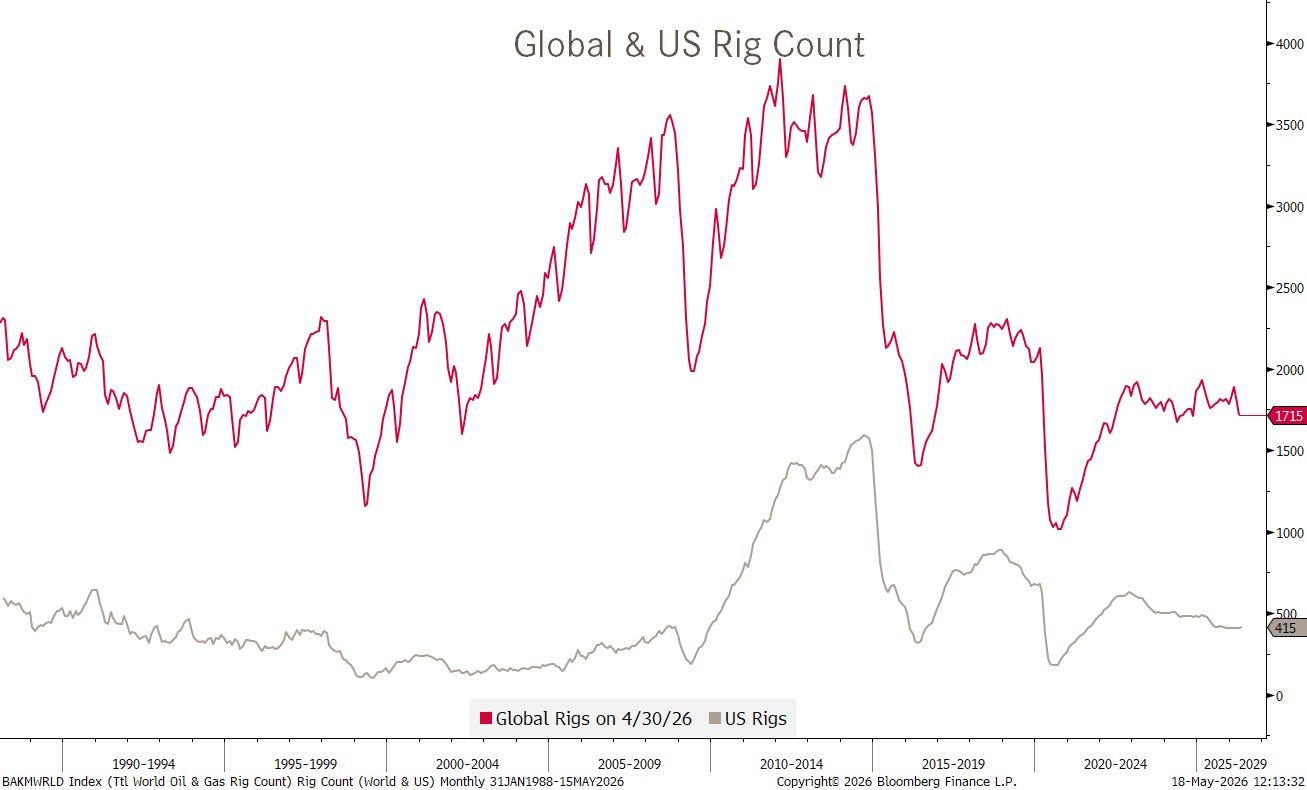
Surprisingly enough though, are oil rigs not being reopened aggressively:
Our long Copper trade worked well last week … until it stopped doing so during Friday’s higher yields induced sell-off:
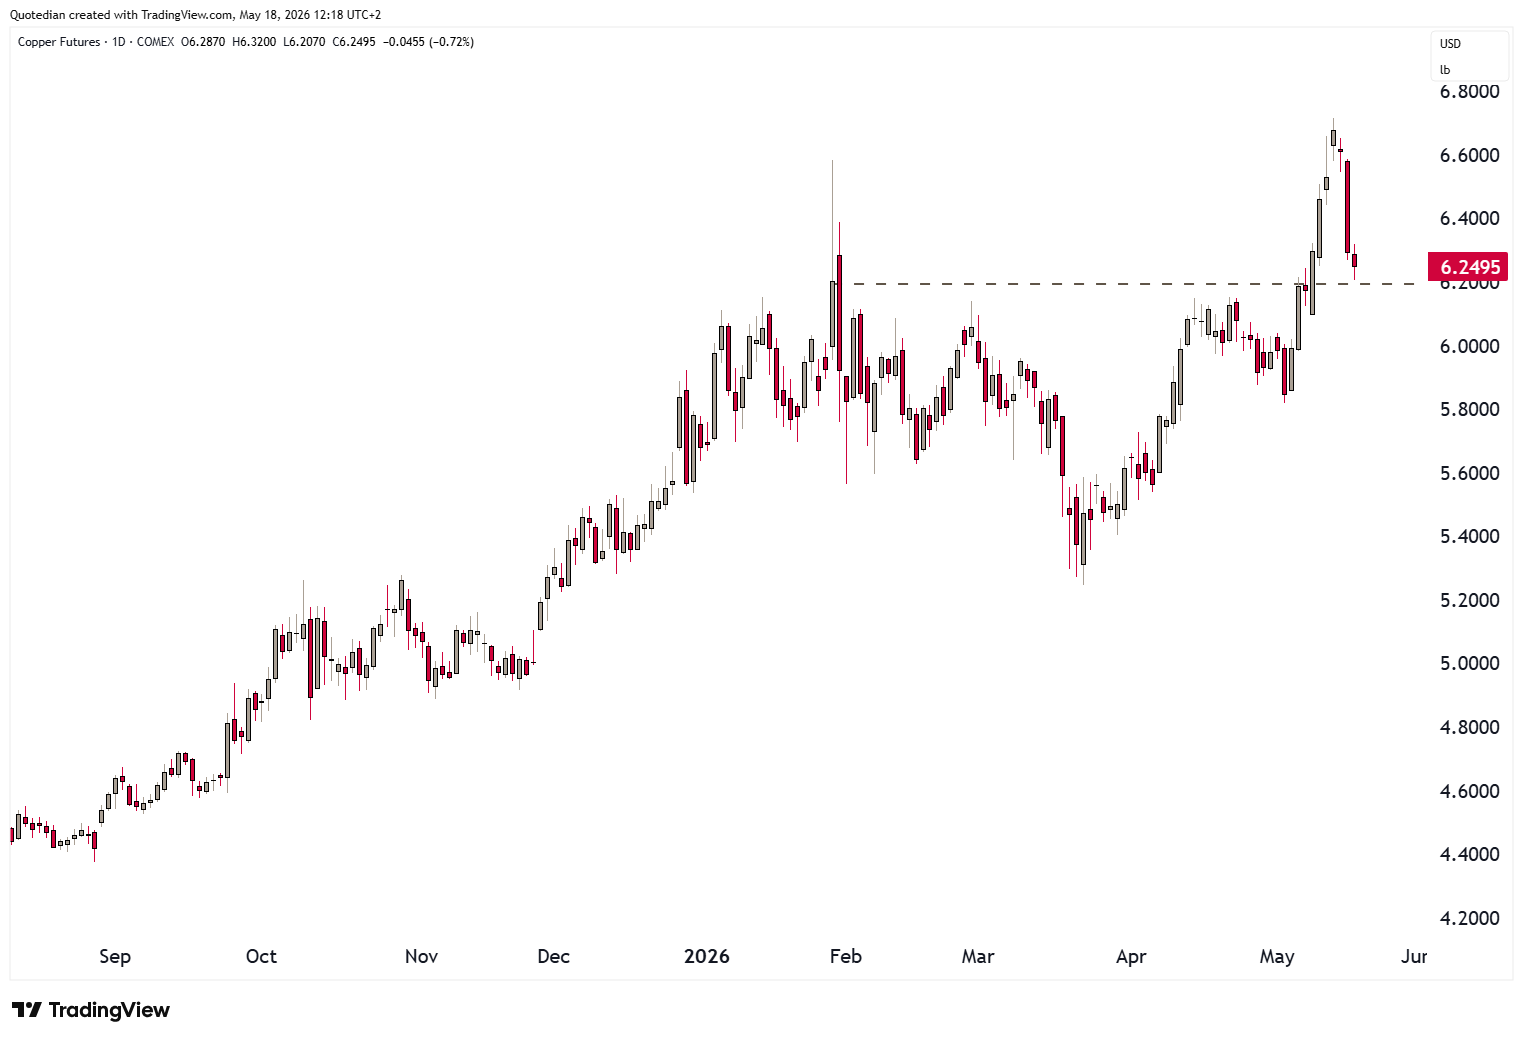
Which does not make complete sense, so re-entry at 6.20 be worth a try.
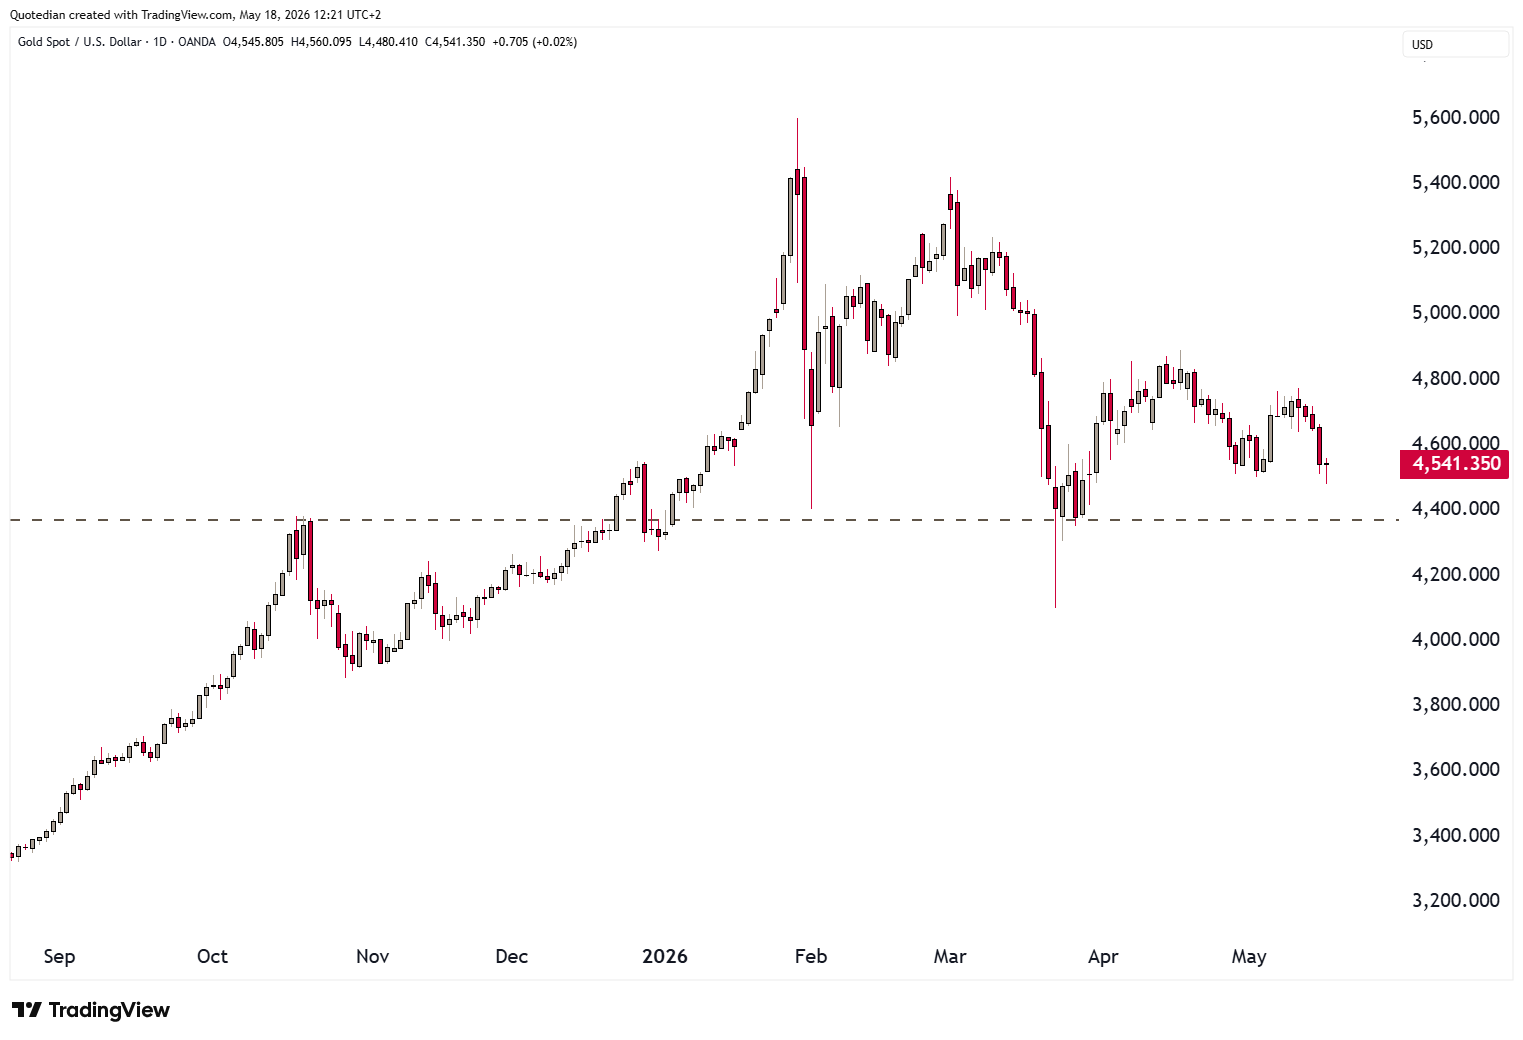
And as highlighted over the past few weeks, we do not expect Gold to be a strong performance contributor (or detractor) over the coming period:

For this week, the most important issues to watch are Nvidia’s earnings numbers (Wed, after market close), the FOMC Minutes and the UK CPI (both Wednesday), and US Flash PMIs (Thursday).
This week will be interesting to see whether the uptrend in stocks continues (30%) or if we get a sideways consolidation (20%) or outright corrective price action (50%).
Bond prices are likely to continue to push lower (yields higher) if equities correct in an orderly fashion.
Other than that … May the Trend be with You!
André

Everything in this document is for educational purposes only (FEPO)
Nothing in this document should be considered investment advice
Investing real money can be costly; don’t do stupid shit
Leave politics at the door—markets don’t care.
Past performance is hopefully no indication of future performance
The views expressed in this document may differ from the views published by NPB Neue Privat Bank AG