

A Silver Lining
Vol VIII, Issue 30 | Powered by NPB Neue Privat Bank AG

“Every cloud has its silver lining, but it is sometimes a little difficult to get it to the mint.”
— Don Marquis
Enjoying The Quotedian but not yet signed up for The QuiCQ? What are you waiting for?!!

As I highlighted in last Wednesday’s QuiCQ (click here), Gold (futures) had its largest one-day decline in over twelve years last week:
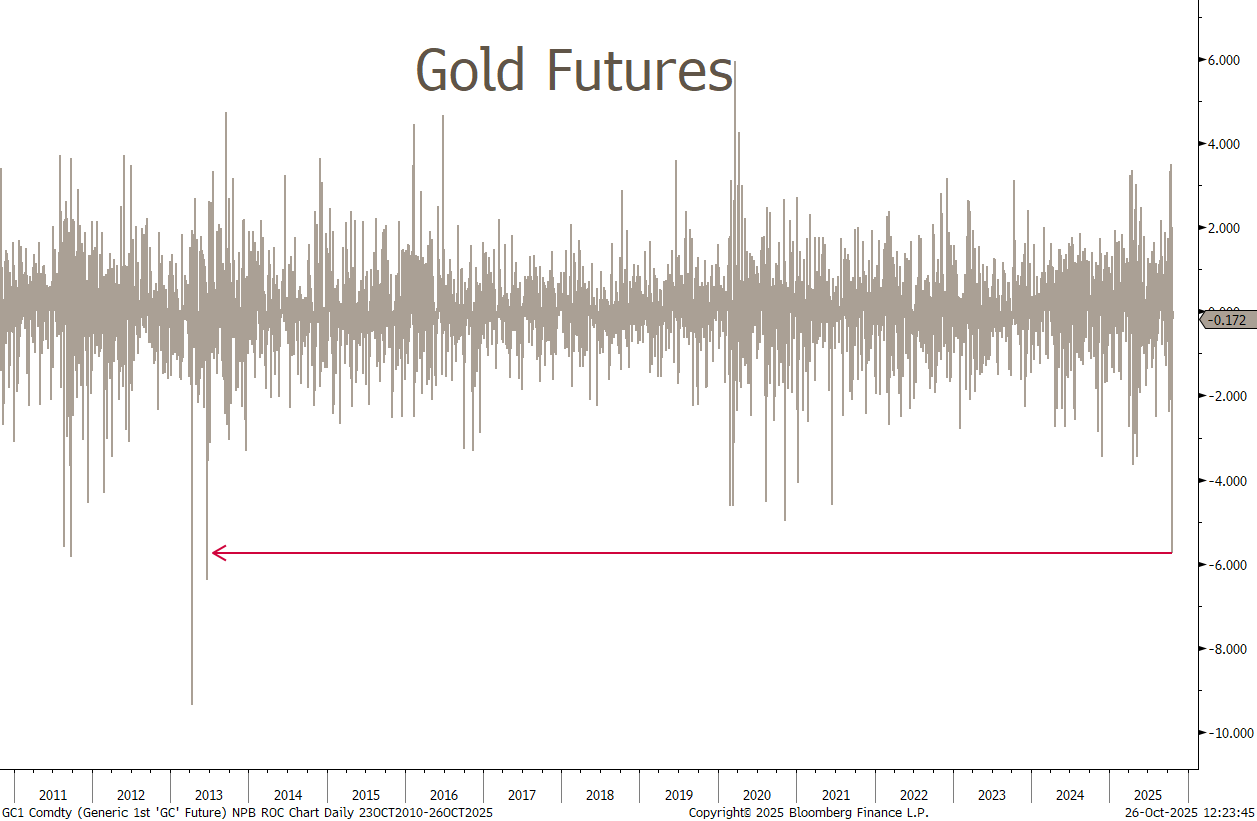
The only thing that comes to mind is: So what?
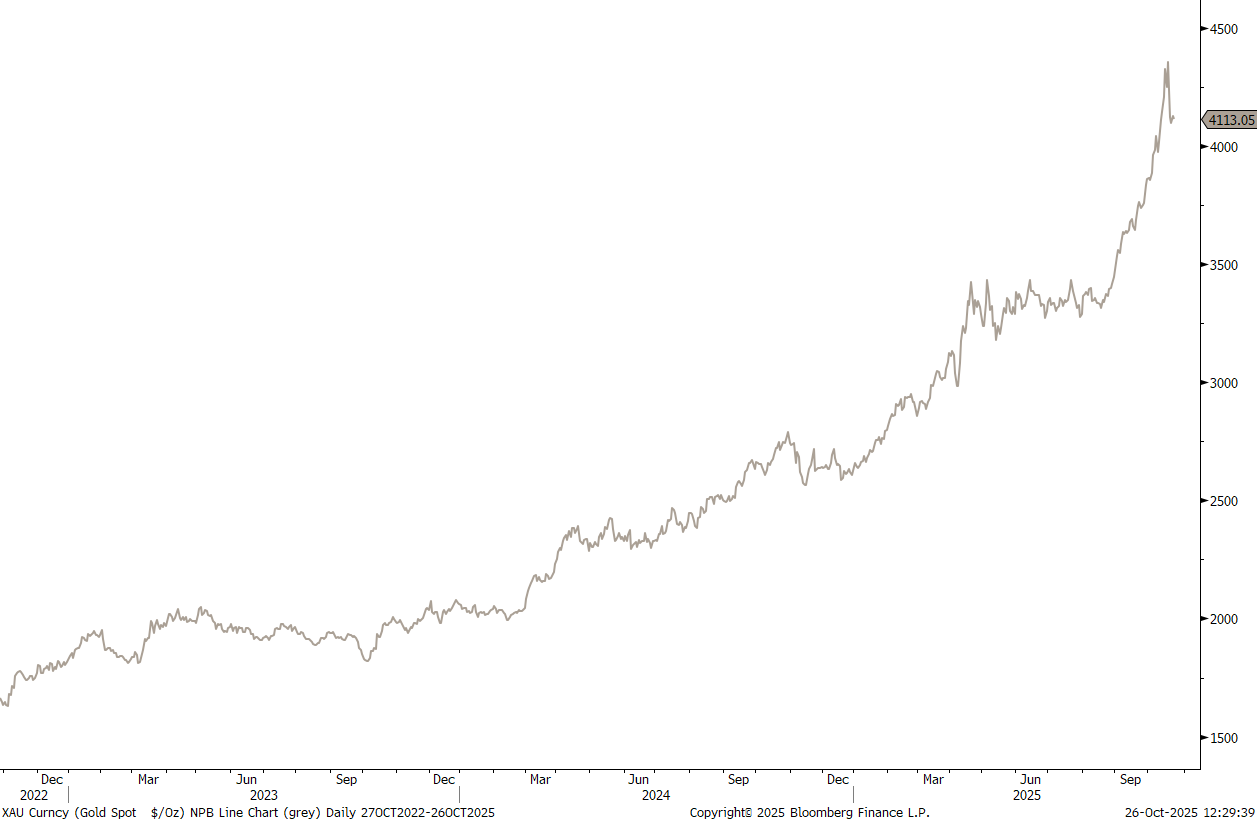
Here’s the chart of Gold over the past three years:
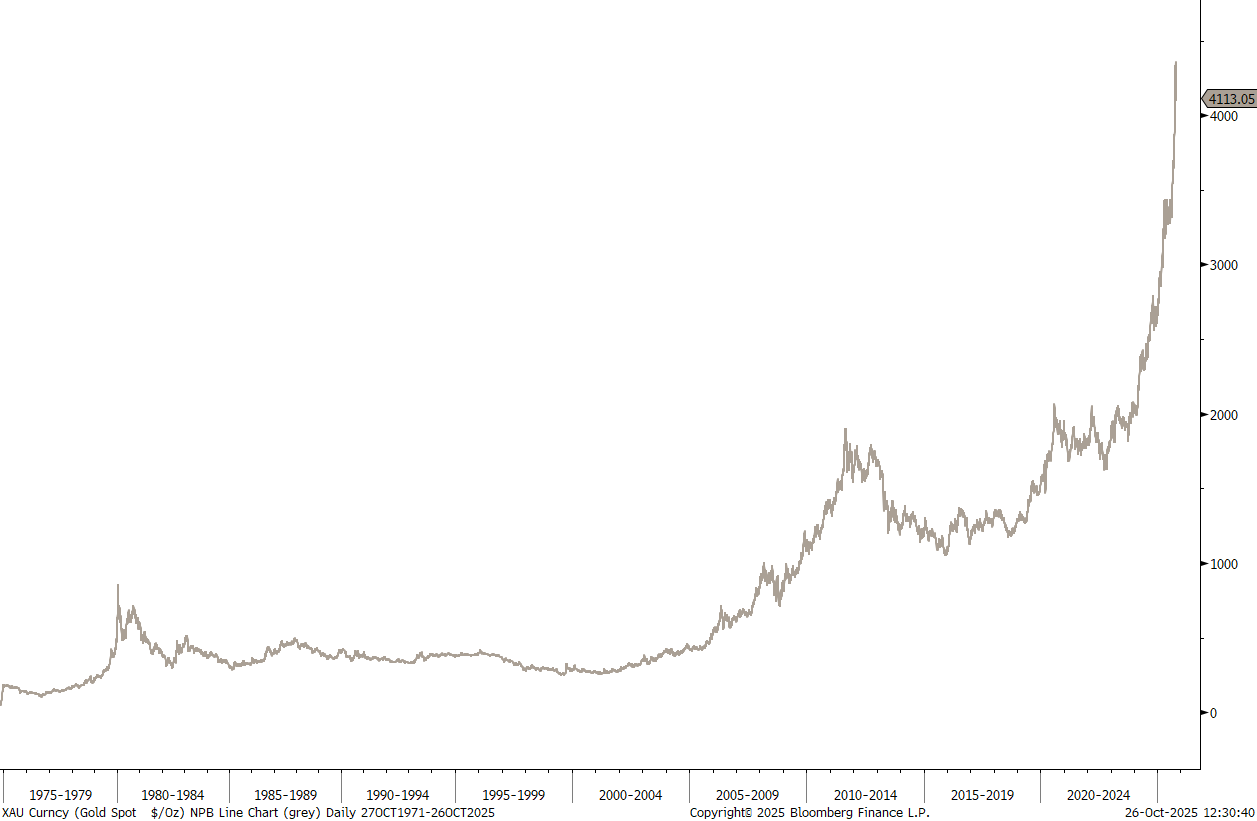
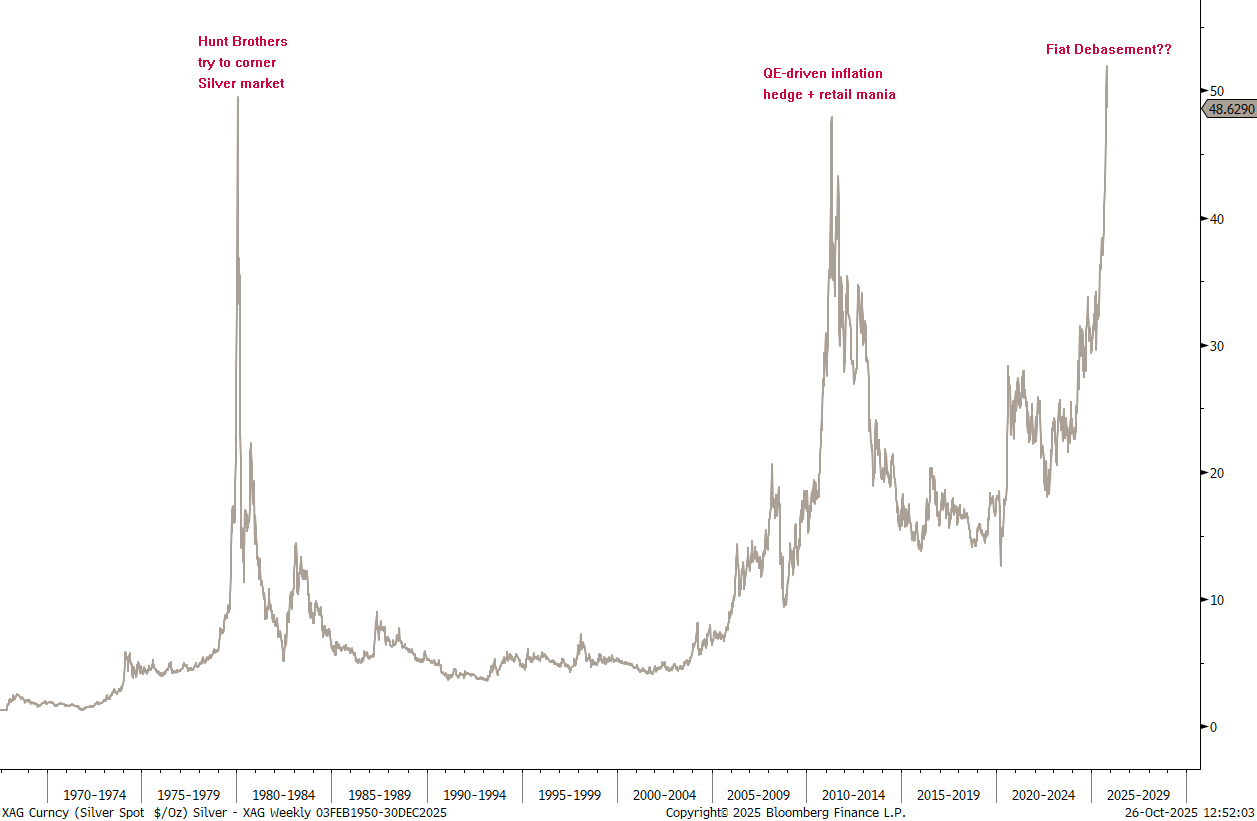
And here the same chart but since the Nixon “Gold Standard” shock back in 1972:
I truly think we can take nearly six percent, one-day drawdown bravely on the chin.
More so, because there’s A SILVER LINING.
Many would argue that the blow-off top in Silver has happened already and given the following chart, I can understand:
BUT…
if the past is any guide (and you know it is), then we note on the chart below that when Silver broke its relative downtrend versus Gold the blow-off top was just at its earliest stages:
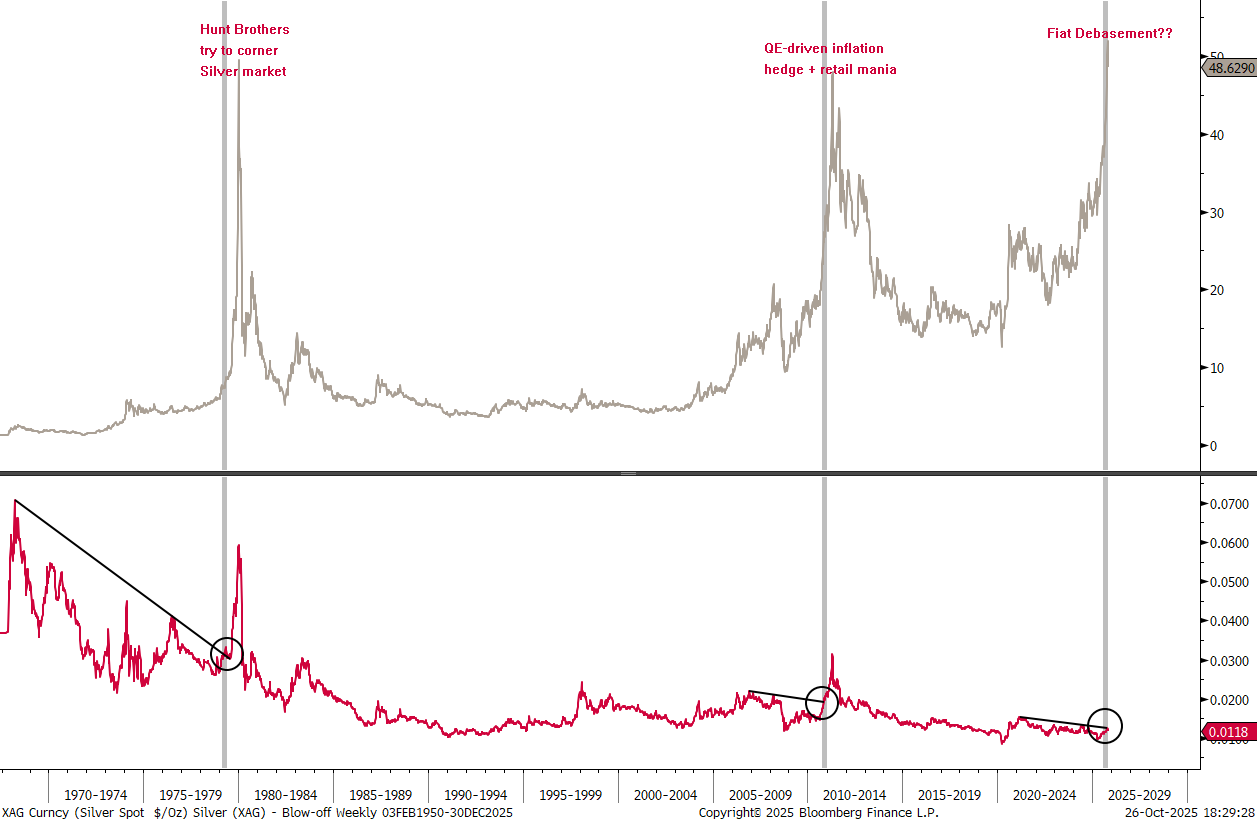
Hence, what’s the chance for the Silver versus Gold ratio to continue to move higher?
High.
(pun intended)
First, something’s cooking, as the bid/ask spread for silver has been widening noticeably in October:

Simultaneously, borrowing costs for silver have been exploding, indicating a short squeeze in supply, as demand for this precious metal increases:
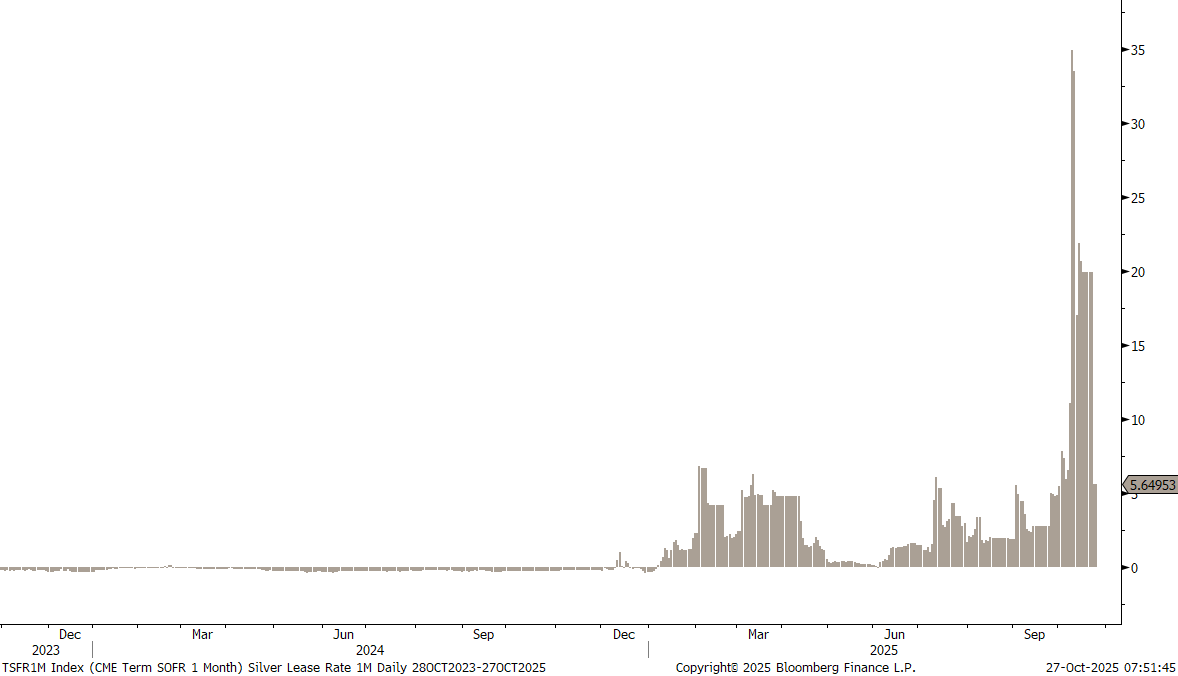
Even though the 1-month implied lease rate has come down from a panic 35% to ‘only’ five percent, it continues to be at levels well above the norm.
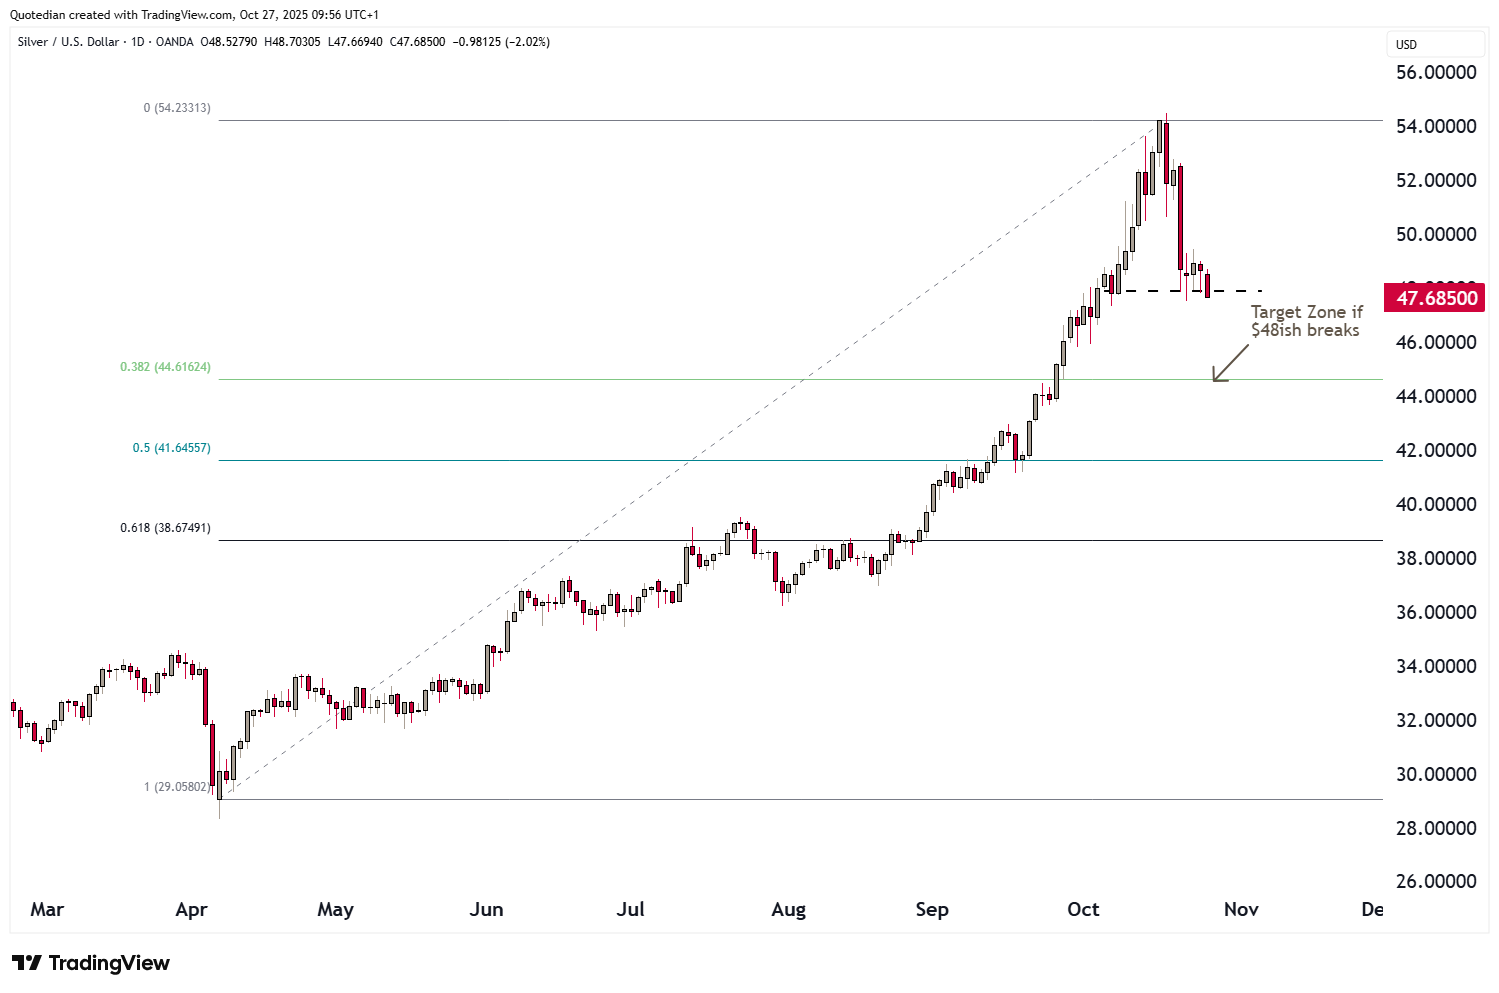
Now, a shorter-term assessment shows that Silver is sitting right on top of a key support, made up from the 38.2% Fibonacci retracement since the latest rally started in mid-August and a pivot-area just below $48 formed in early October:
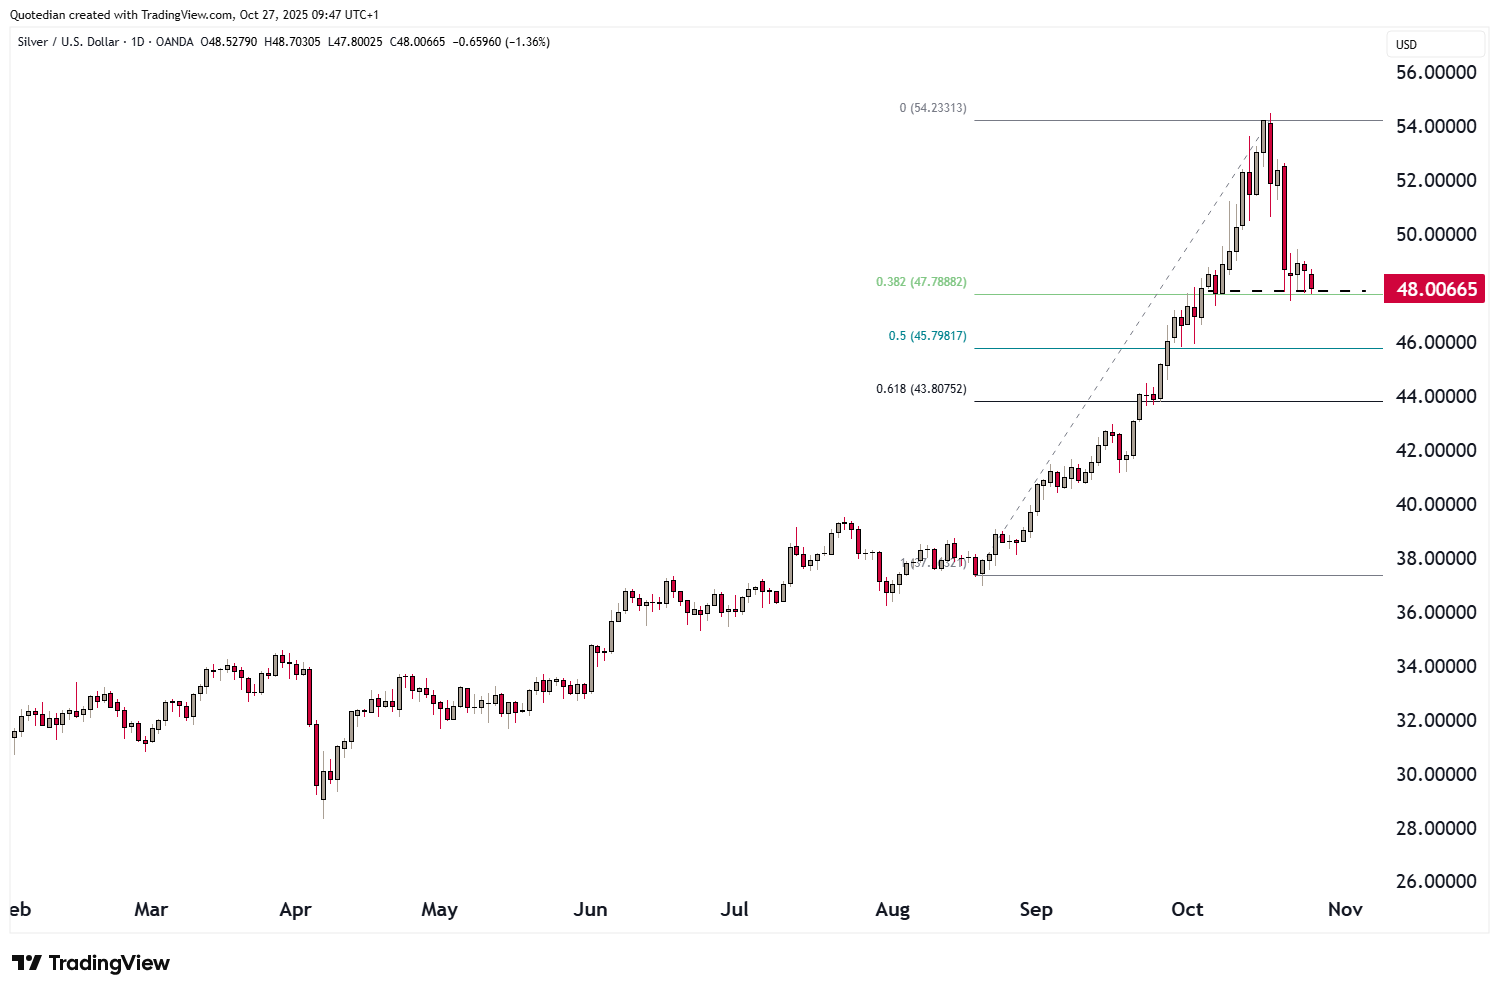
However, should that support give over the coming days, then there is a good chance of further decline to just below $45, which is the first retracement from the entire upmove since the April panic-bottom:
Now, taking the longer-term perspective again to finish off this introductary deliberations, let’s have one last glance at the silver-to-gold ratio, but this time the other way round, i.e. the Gold/Silver ratio:
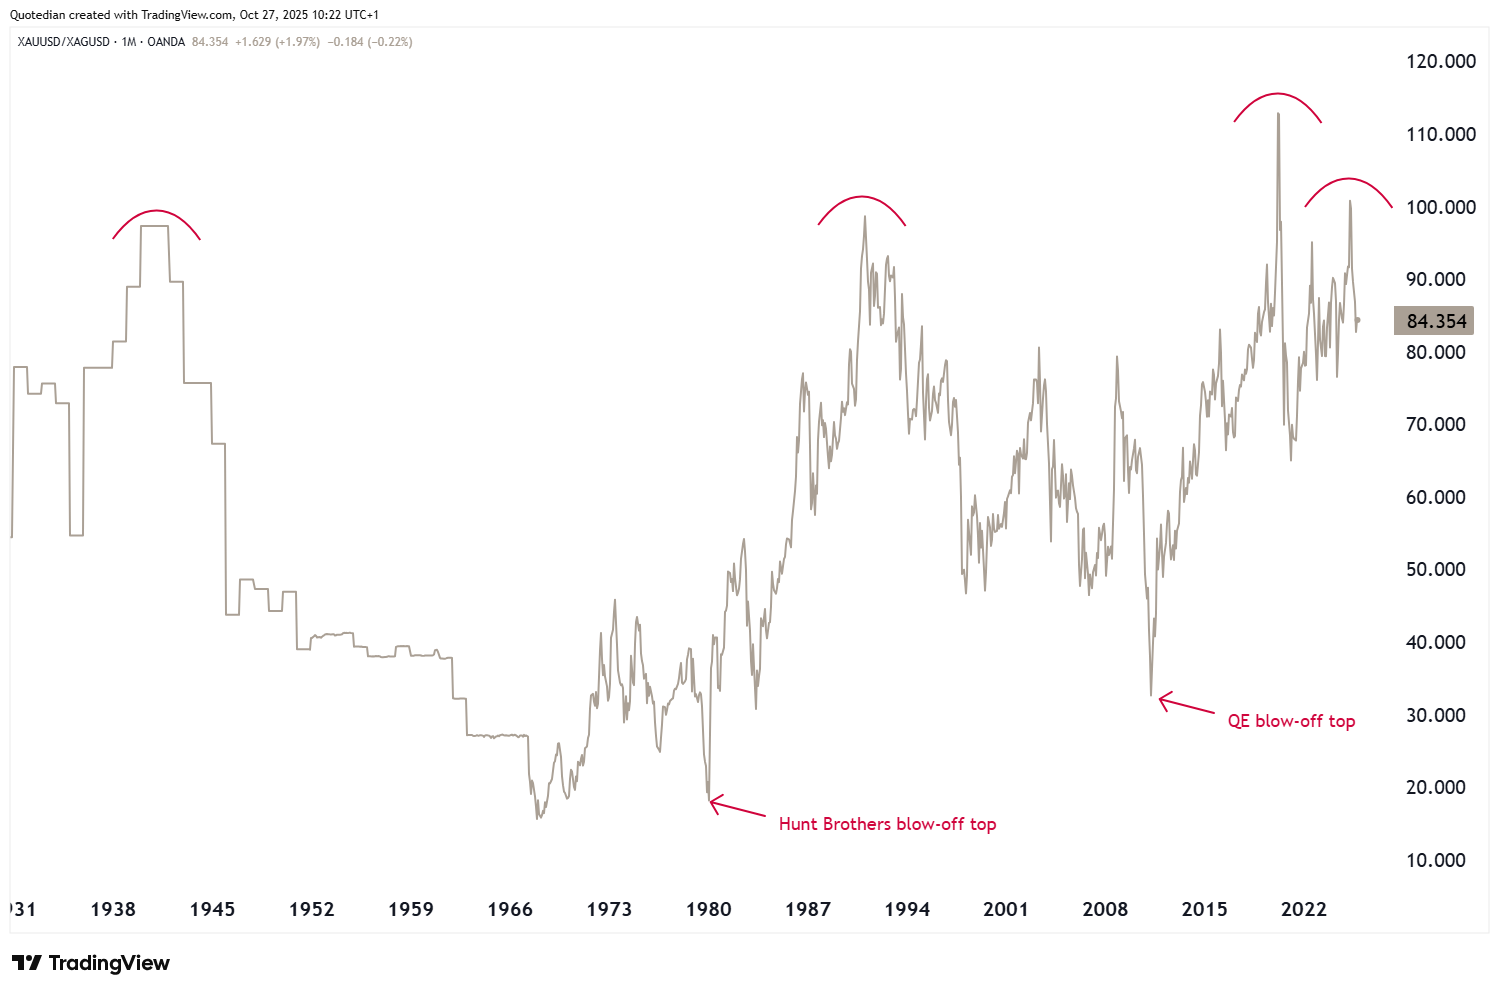
Currently, about 84 ounces of Silver “fit” into an ounce of Gold price-wise. These tends to be levels of a top for the ratio, not a bottom. To summarize this in one meme:


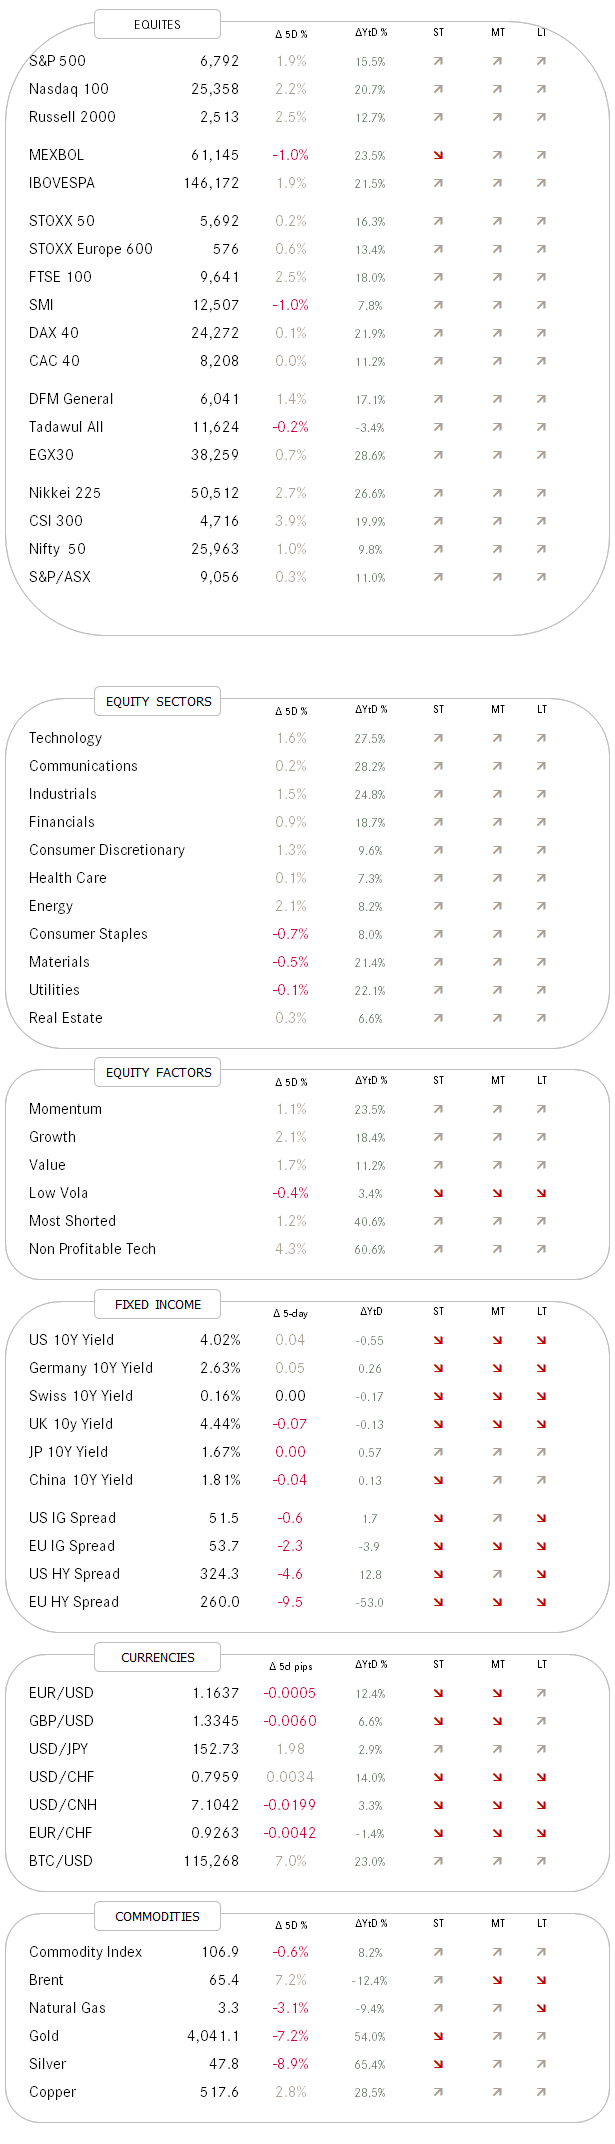
Equity markets are hitting new all-time highs around the globe, with the S&P 500 gaping higher last Friday after a well-cooked benign CPI report removed the latest doubts about a Fed cut later this week:
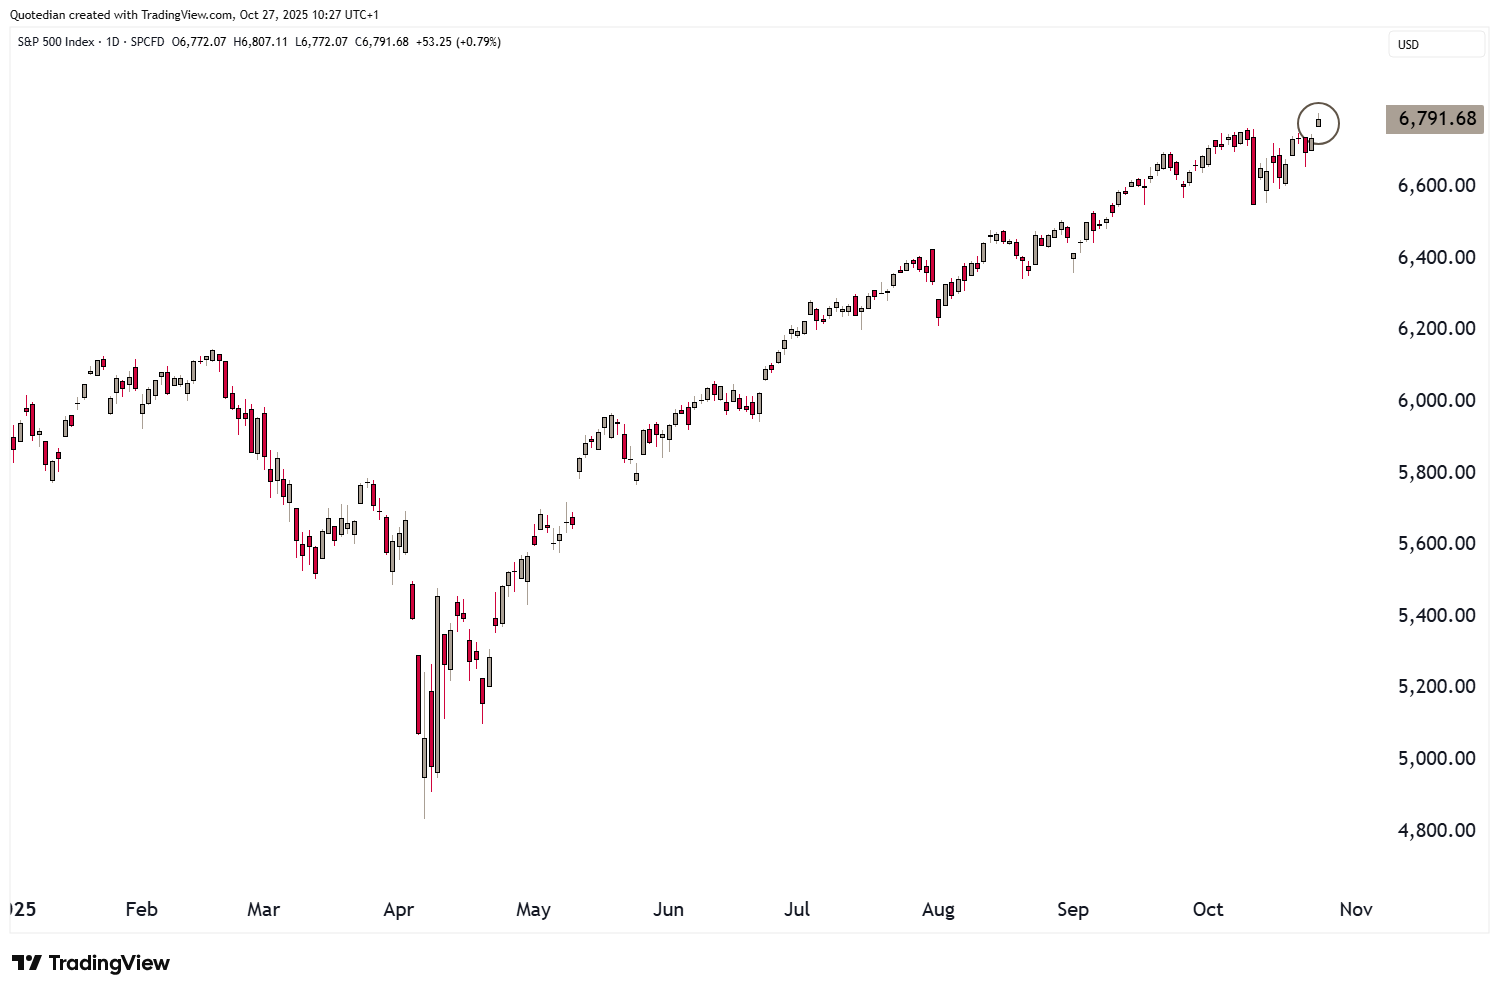
Not only did the S&P hit a new all-time high (ATH), but rather it was in good company joined by the Nasdaq 100,
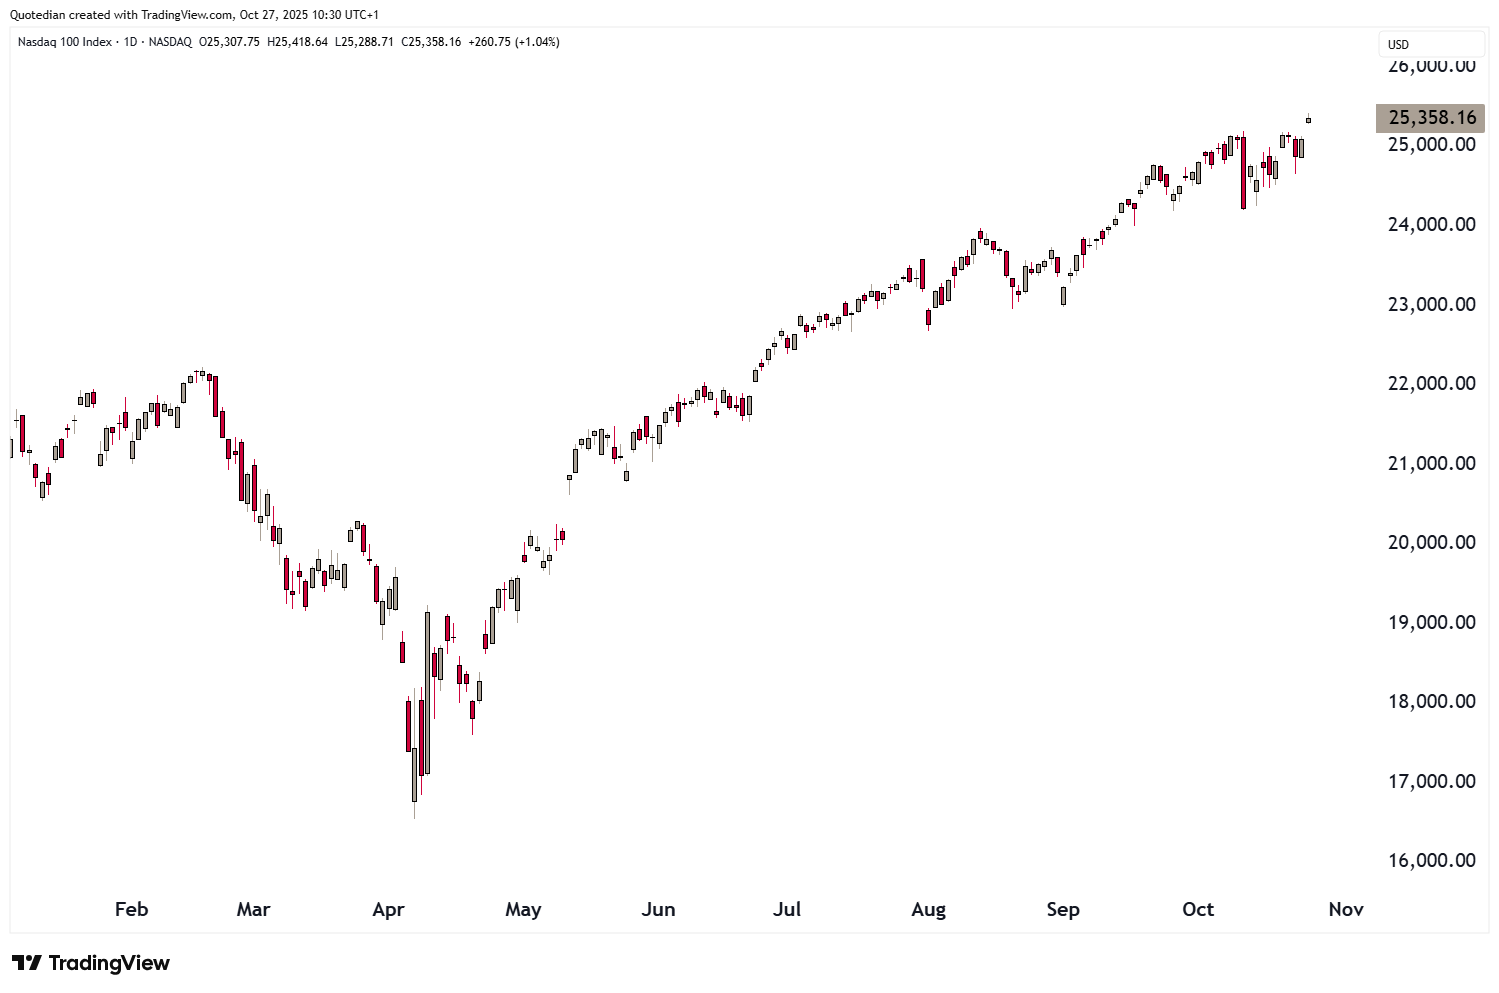
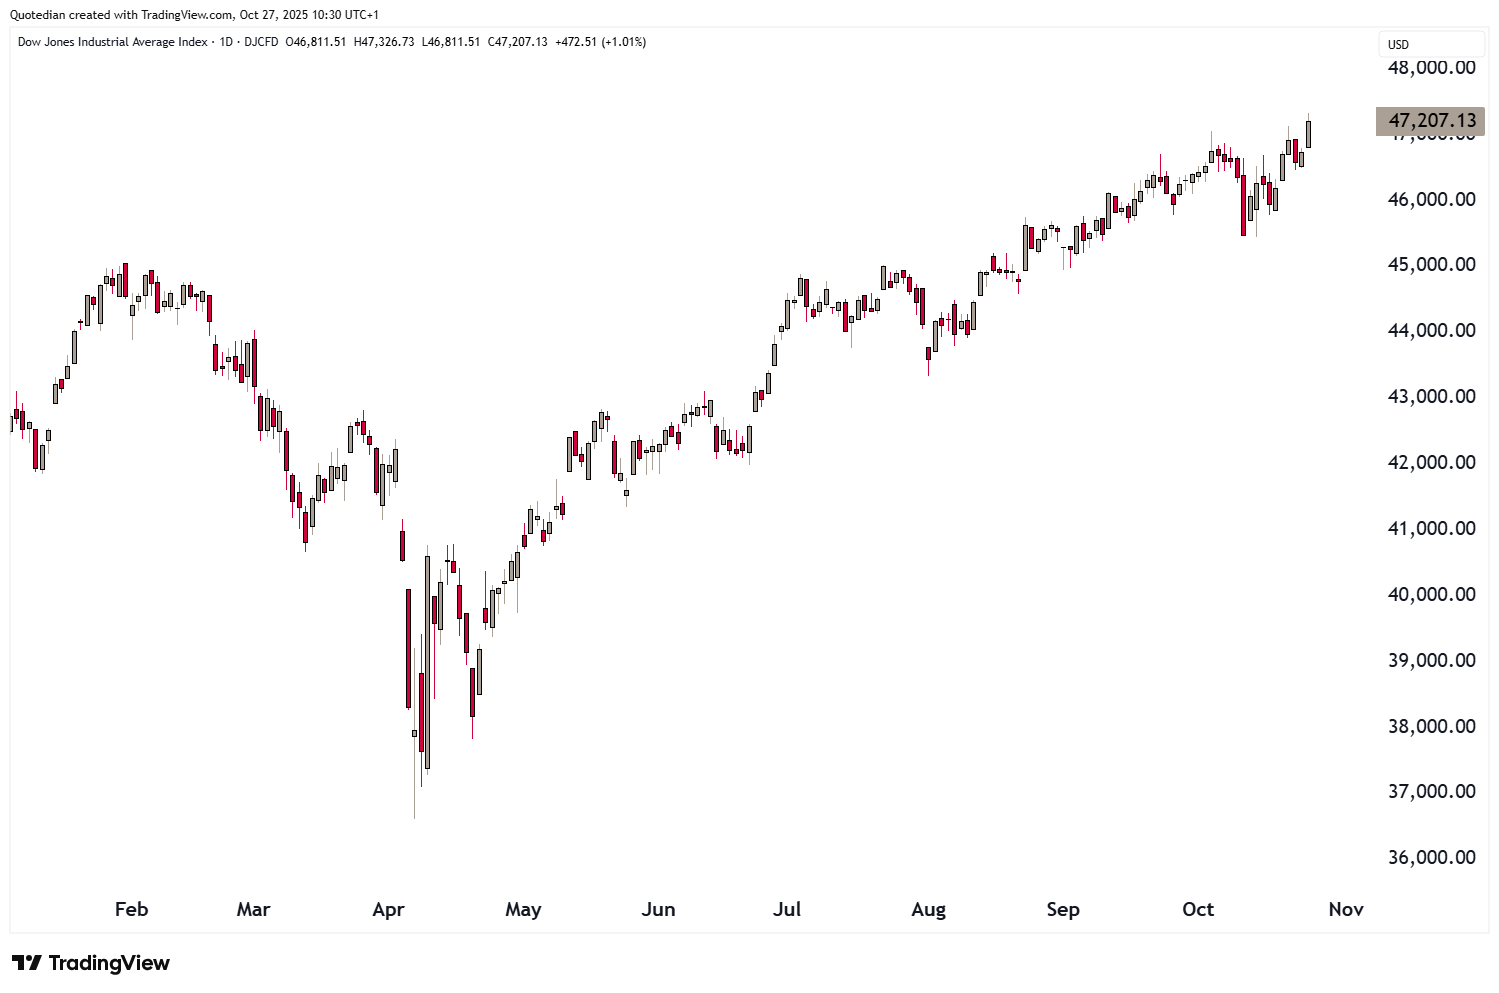
the Dow Jones Industrial,
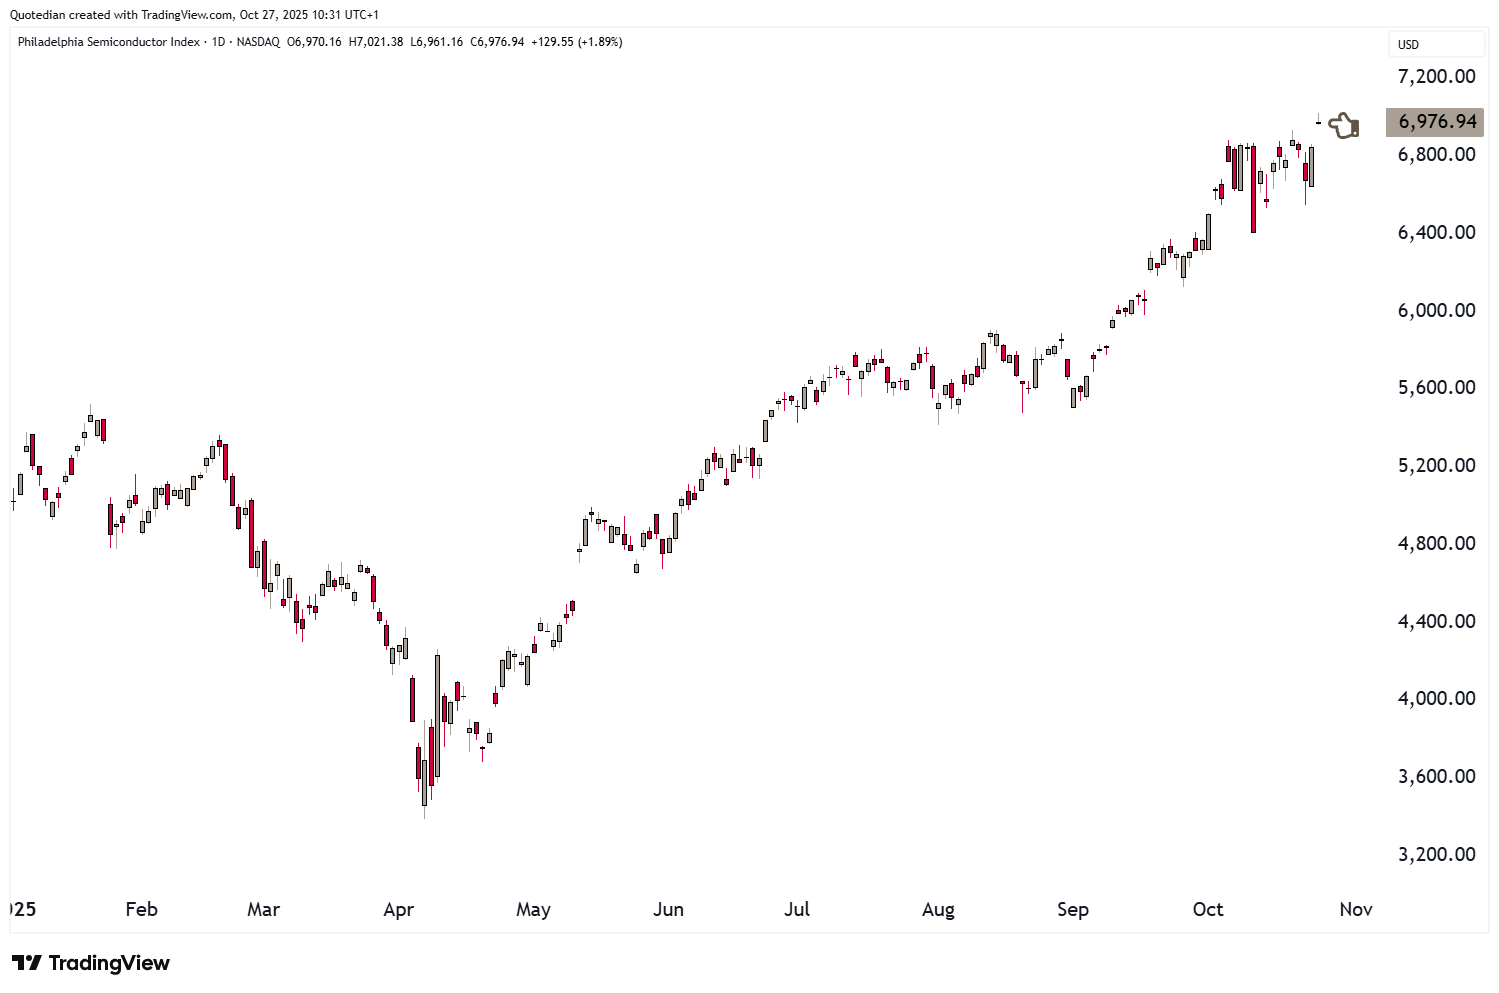
and even the Philadelphia Semiconductor (SOX) index:
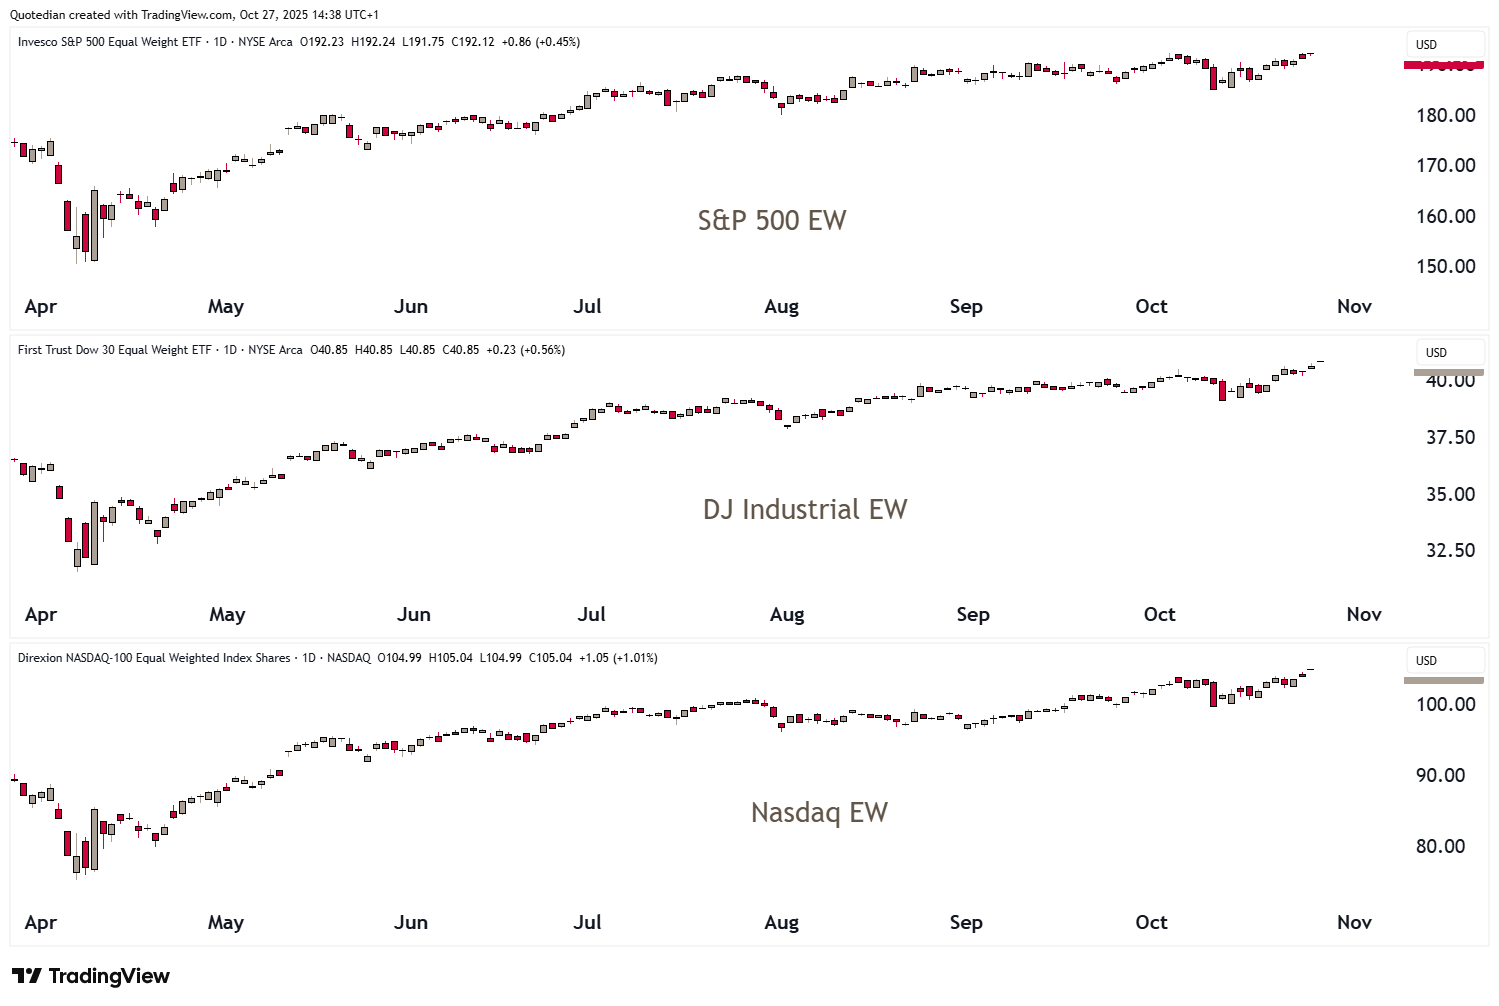
It is also important to note that it is not only the mega caps which are pushing the indices higher, but the participation is broad as witnessed via the equal-weight versions of the S&P 500 (RSP), the DJ Industrial 8EDOW) & the Nasdaq (QQQE) hitting new all-time highs too:
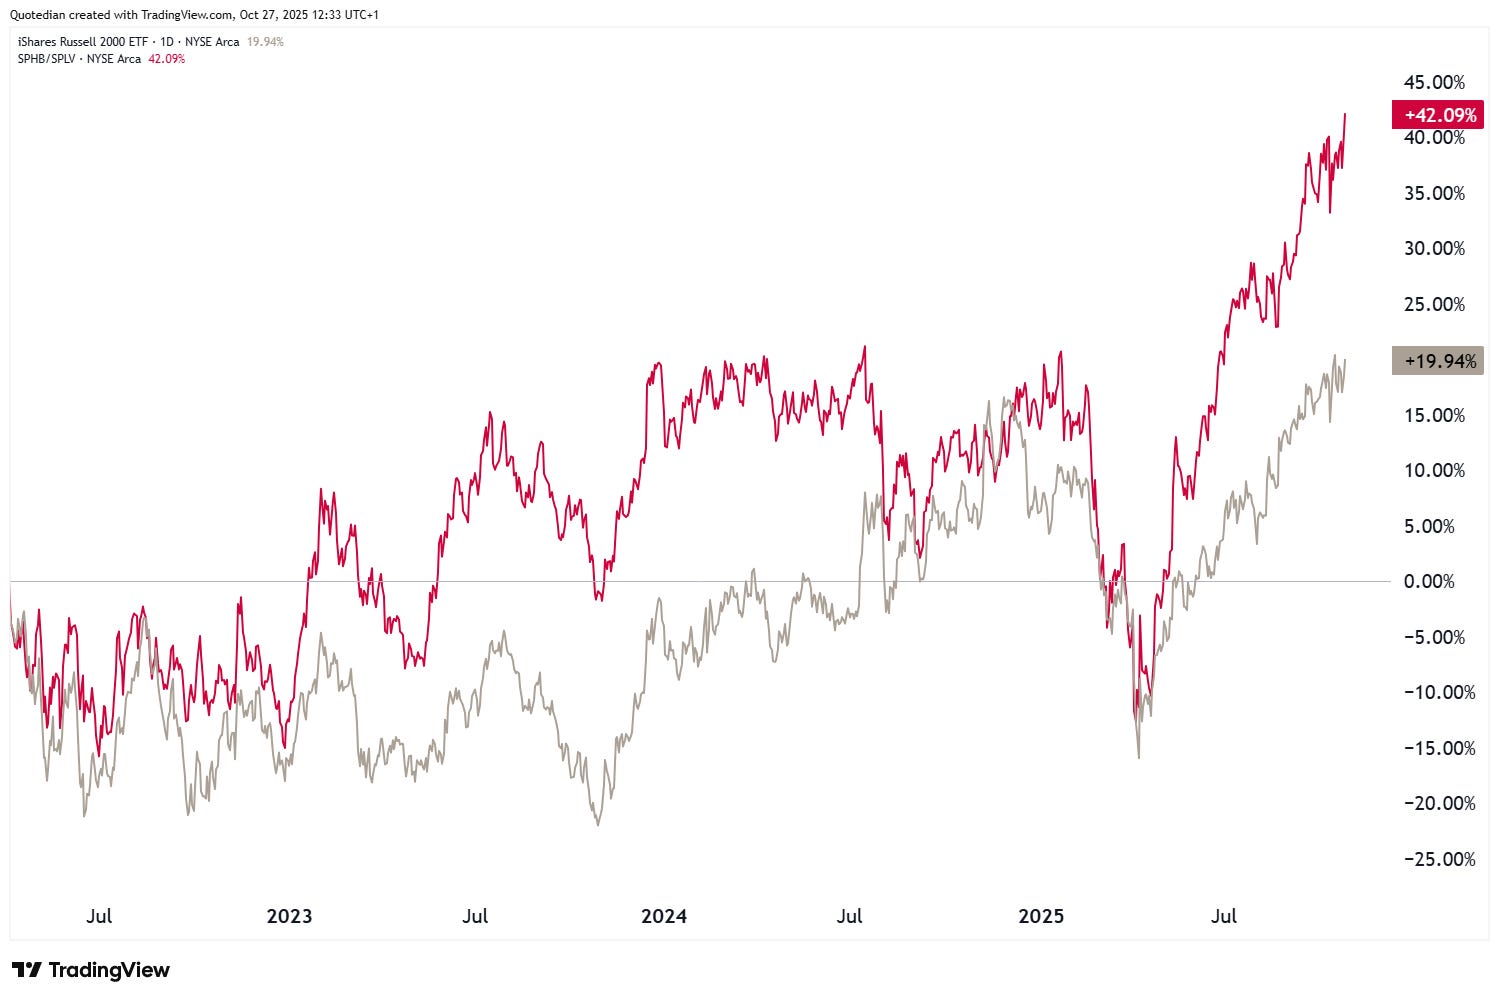
Small cap stocks, as measured by the Russell 2000 (RTY), missed making a new ATH by six basis points, or less than a quarter percentage point:
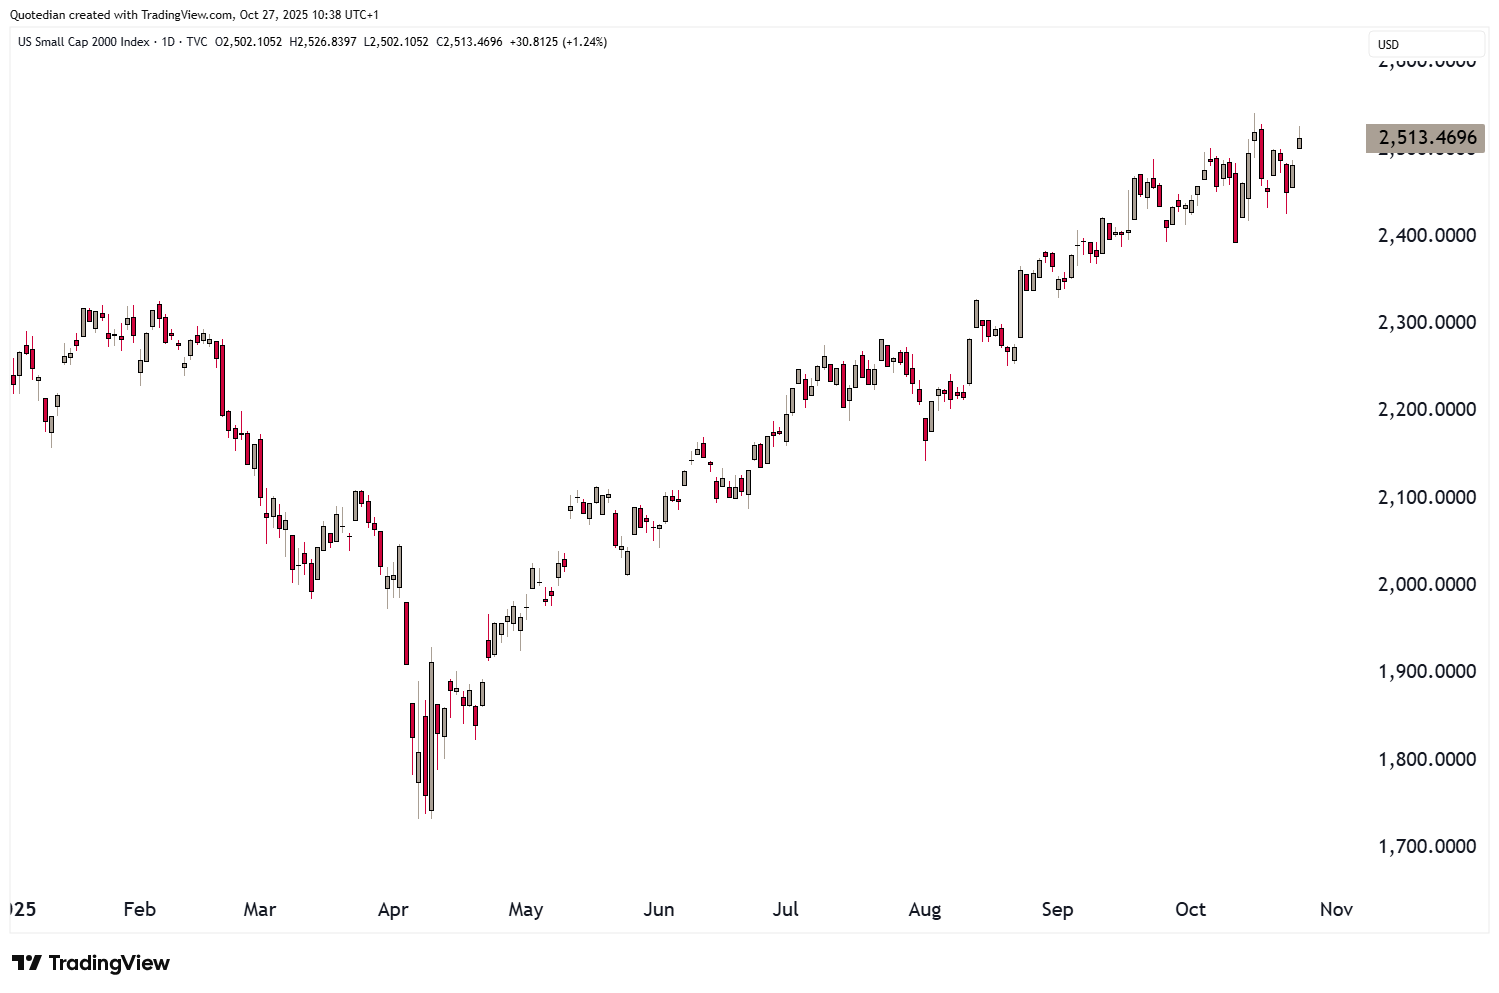
If we take the ratios of high-beta to low-vola stocks (SPHB/SPLV - red line) as a leading “risk on” indicator for small cap stocks, that new ATH should be reached fairly soon in the Russell 2000 (IWM - grey line):
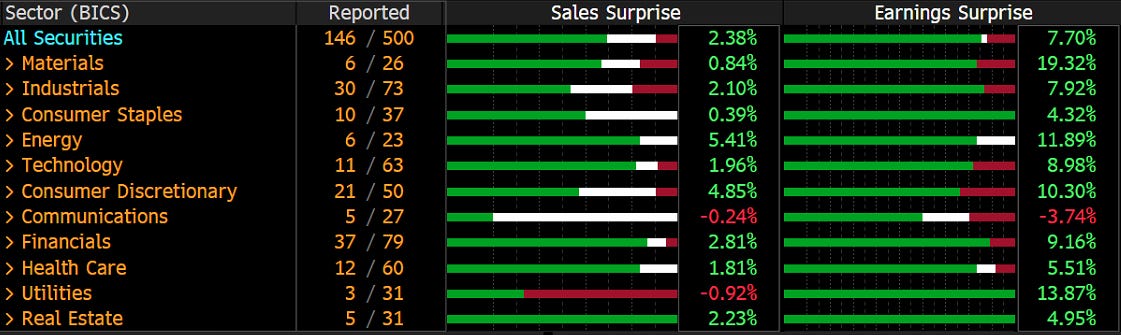
Earnings season is not quite yet half-way done with 146 S&P 500 companies having reported, however, so far, so good:
This week should be interesting from an earnings perspective, not least because five of the Mag 7 are reporting their results:
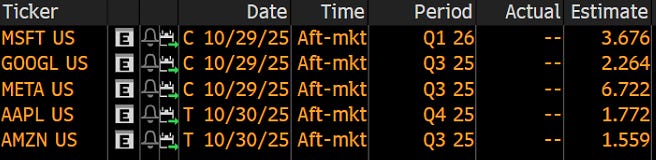
Another 167 S&P 500 companies are also reporting, but no doubt the above will get most attention.
NVIDIA is not due to report until November 19th, however insider selling has been impressive over the past few weeks:
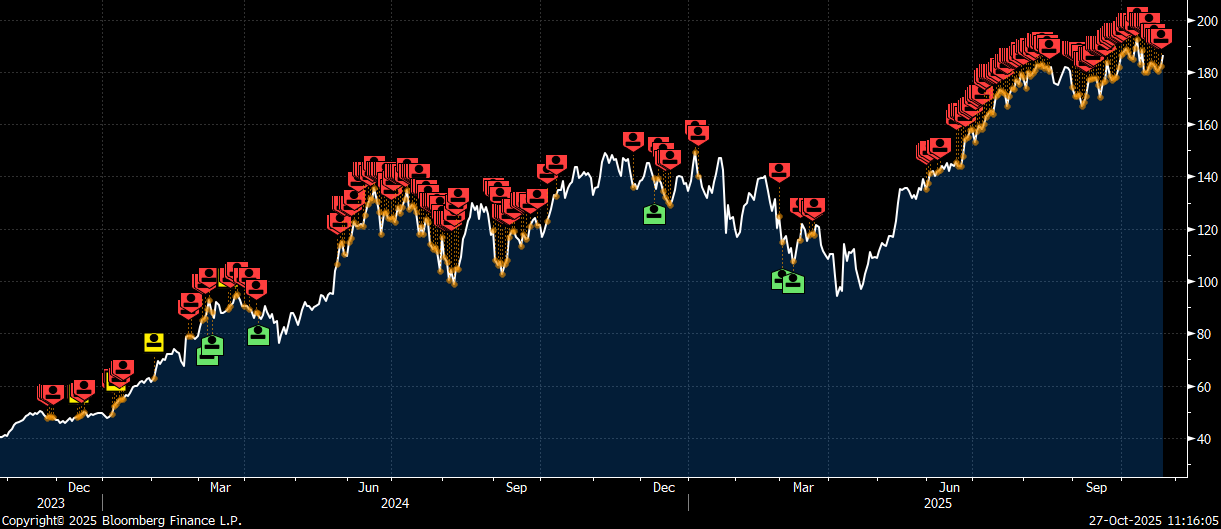
A closer looks shows that seemingly nearly all selling has been done by the company’s founder and CEO, Jen-Hsun Huang:
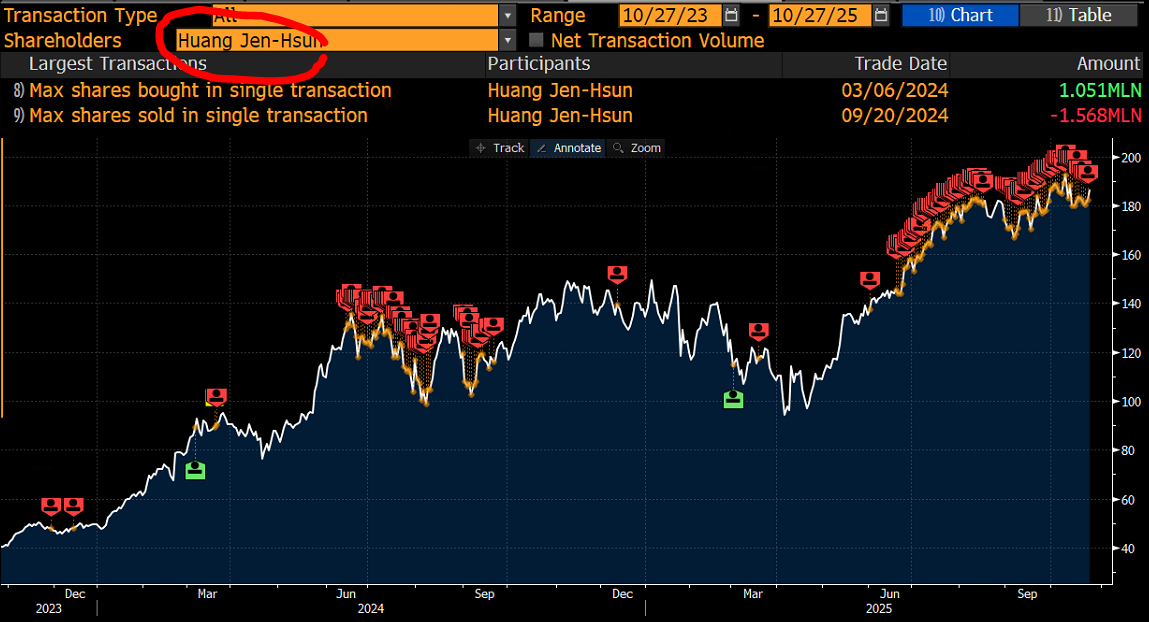
But maybe he’s only buying a new house or car or new top for one of his gruppies…

In Europe, earnings season is a bit more muted underway, or maybe European equity analysts were just a tad too euphoric about MEEGA (Make European Equities Great Again):
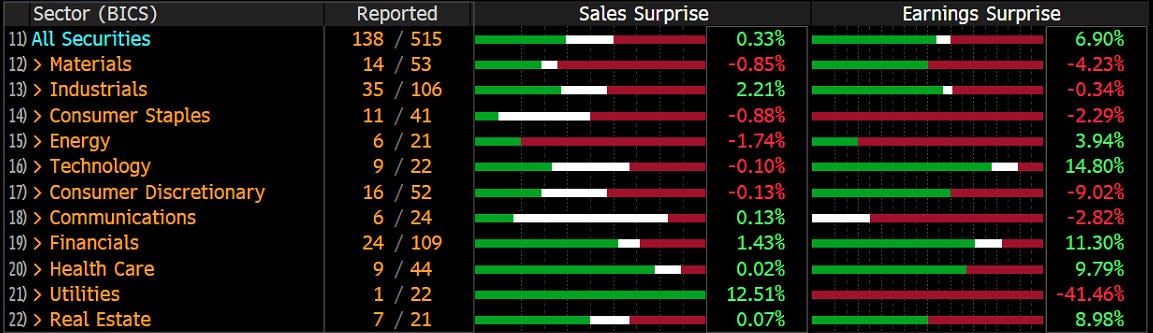
However, price reactions to earnings reports have largely been positive:
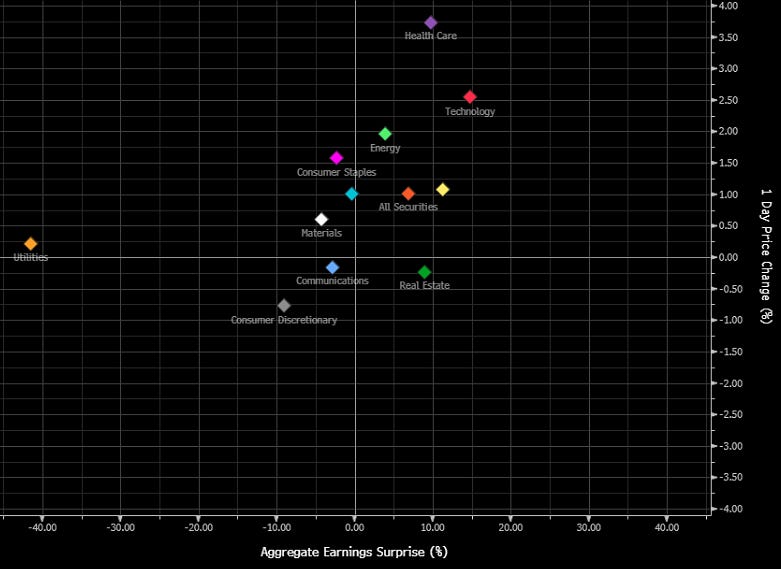
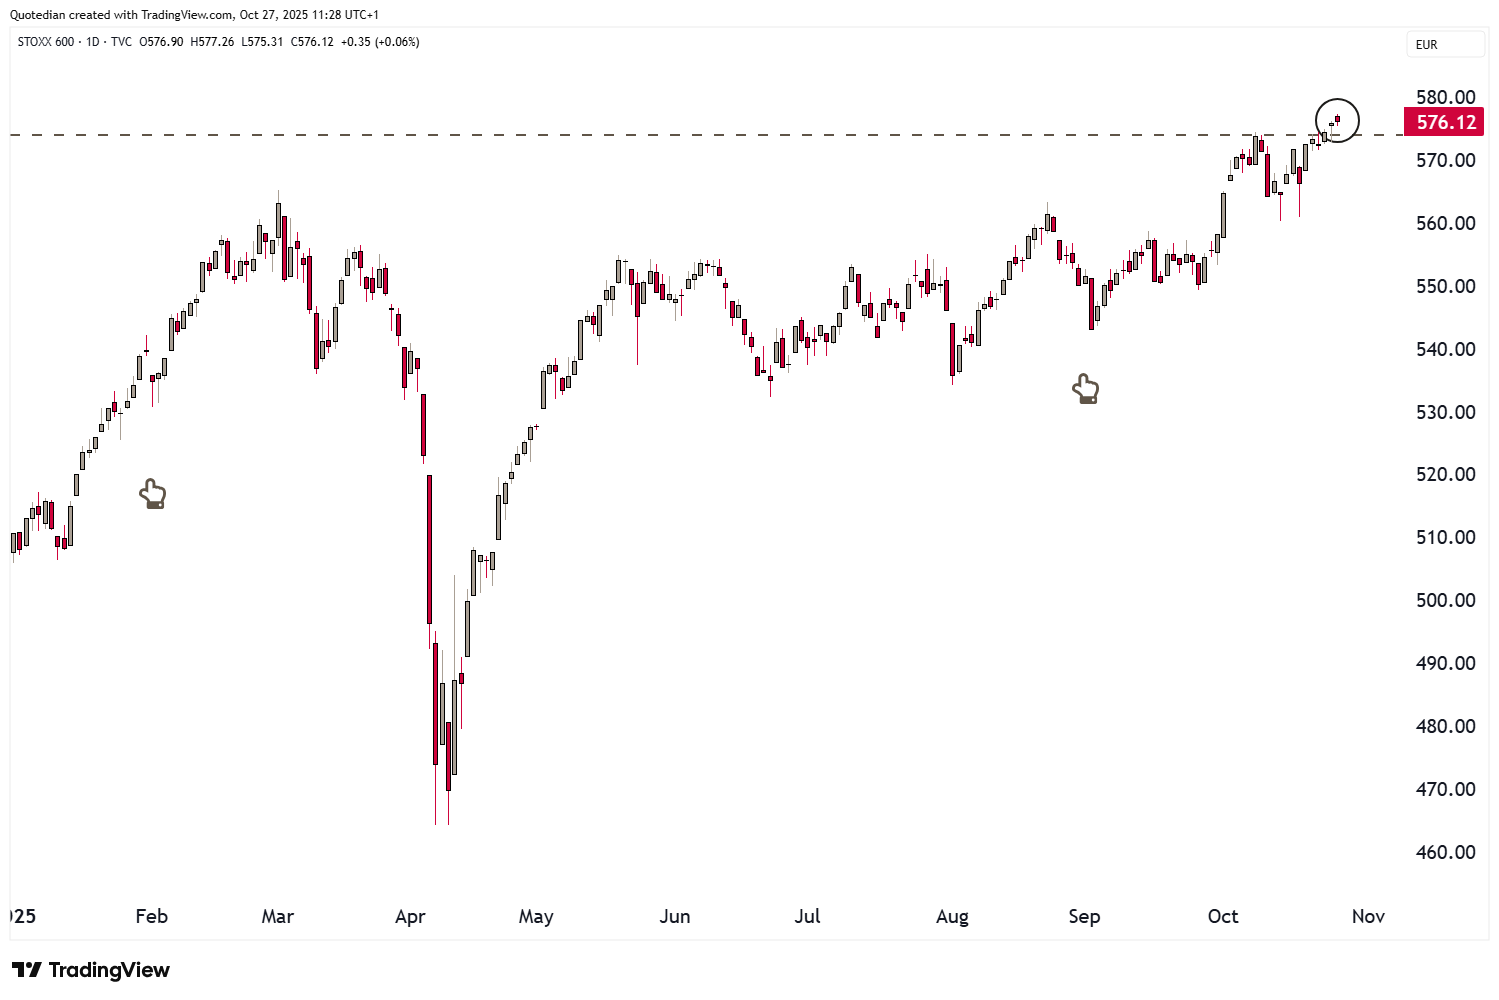
But, of course, is some of that positive price-responsiveness attributable to the overal equity rally, with the STOXX 600 Europe index hitting a new ATH last Friday (and this early Monday morning):
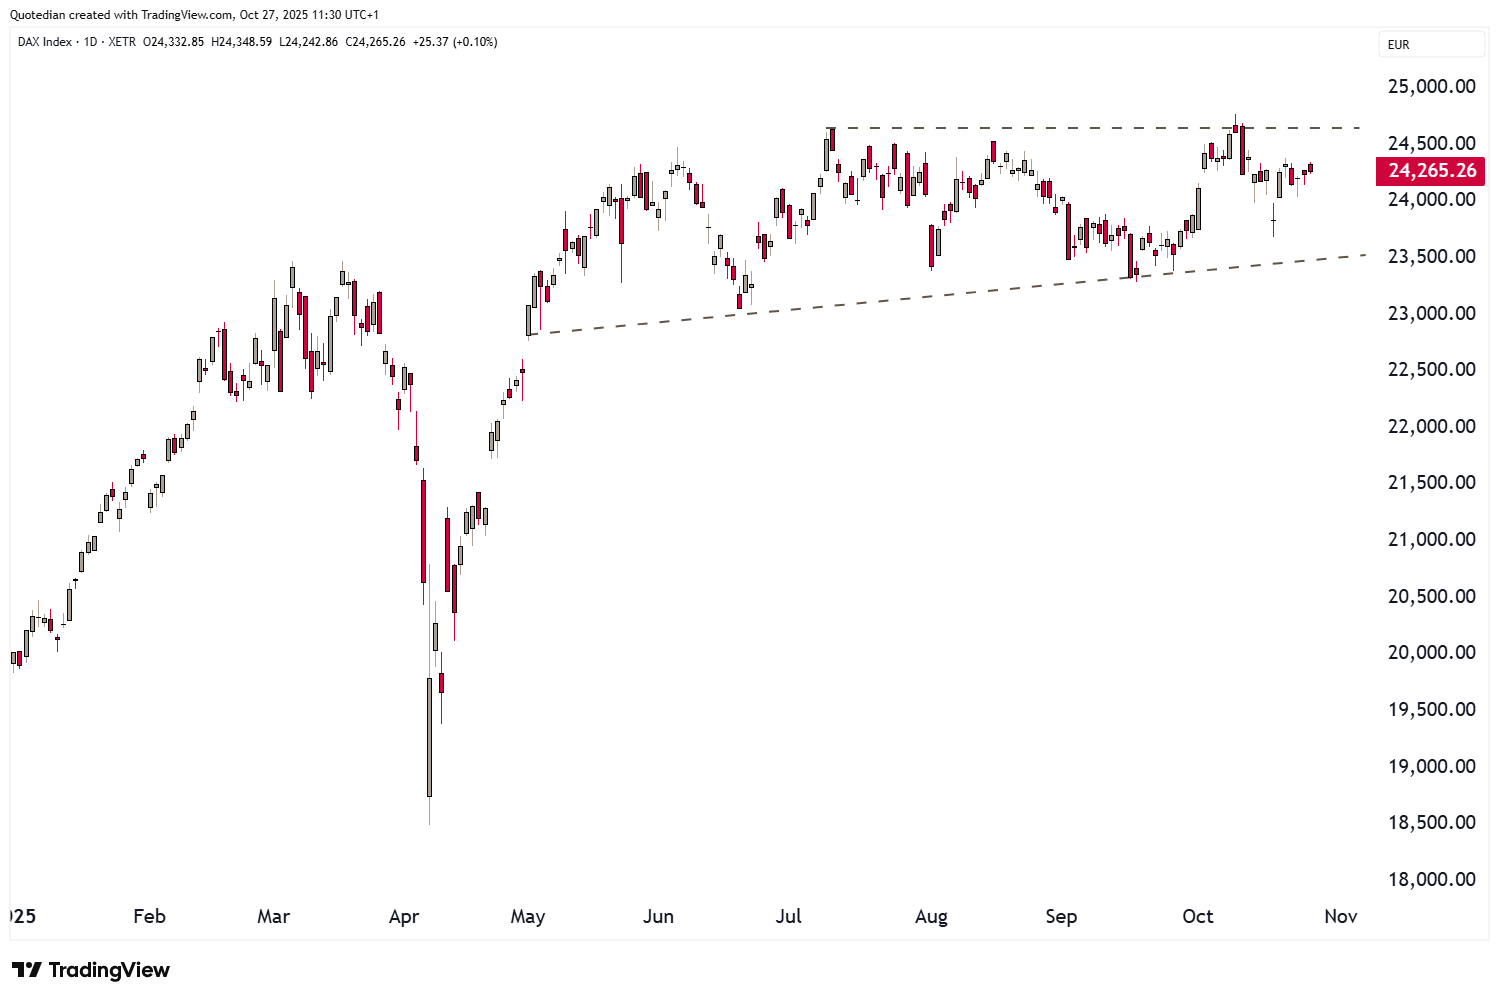
The DAX continues to struggle to move out of its consolidation pattern,
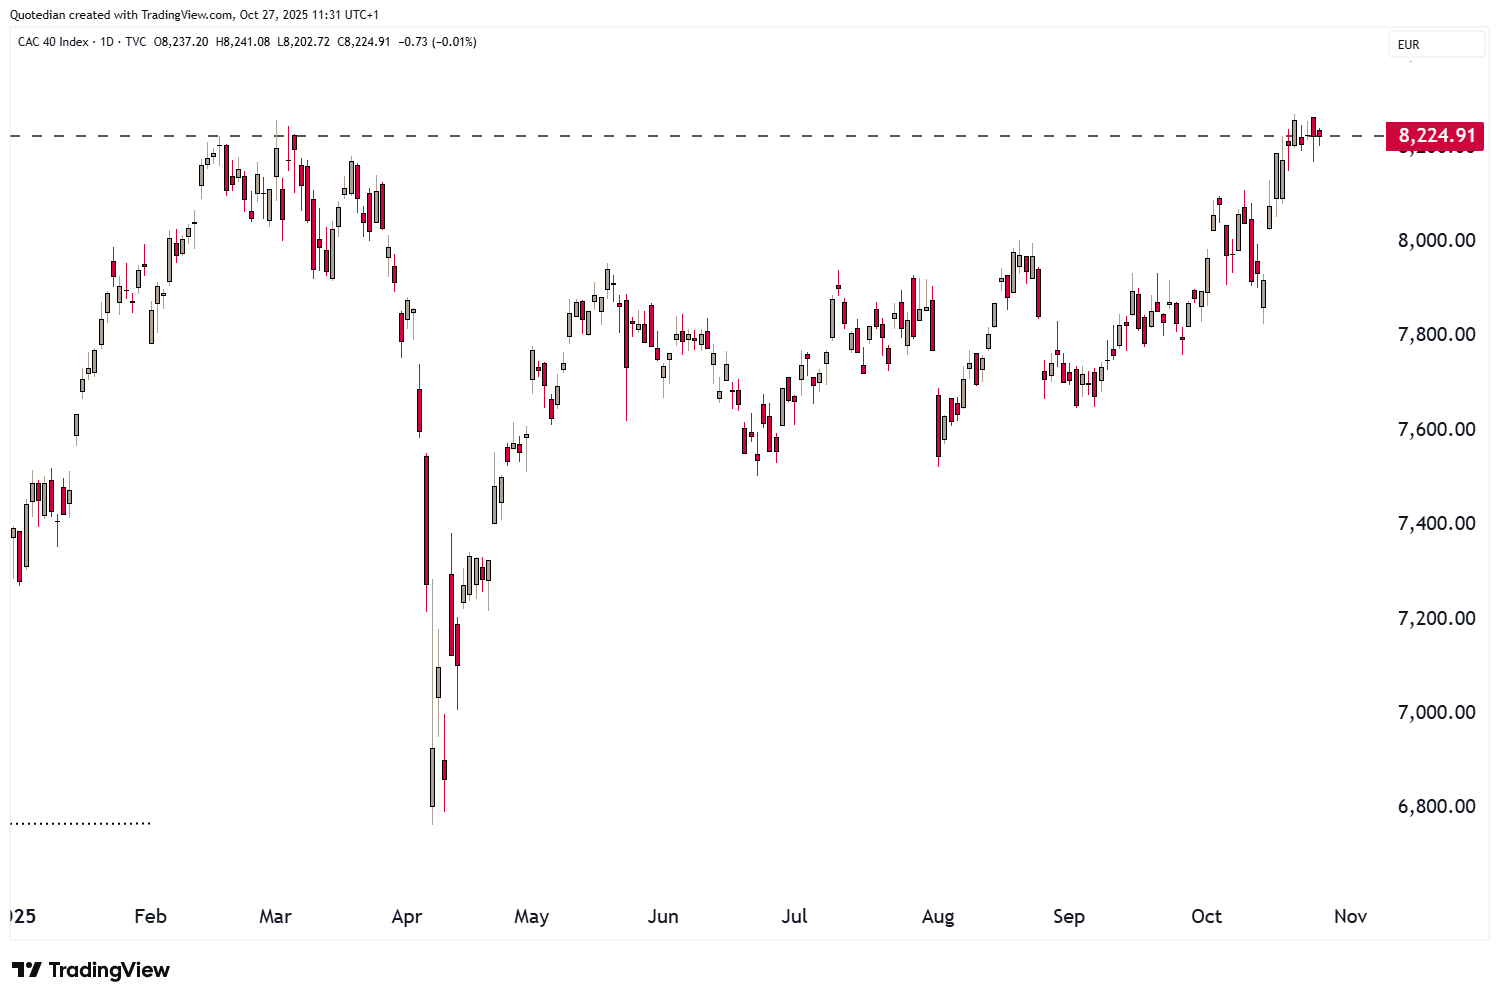
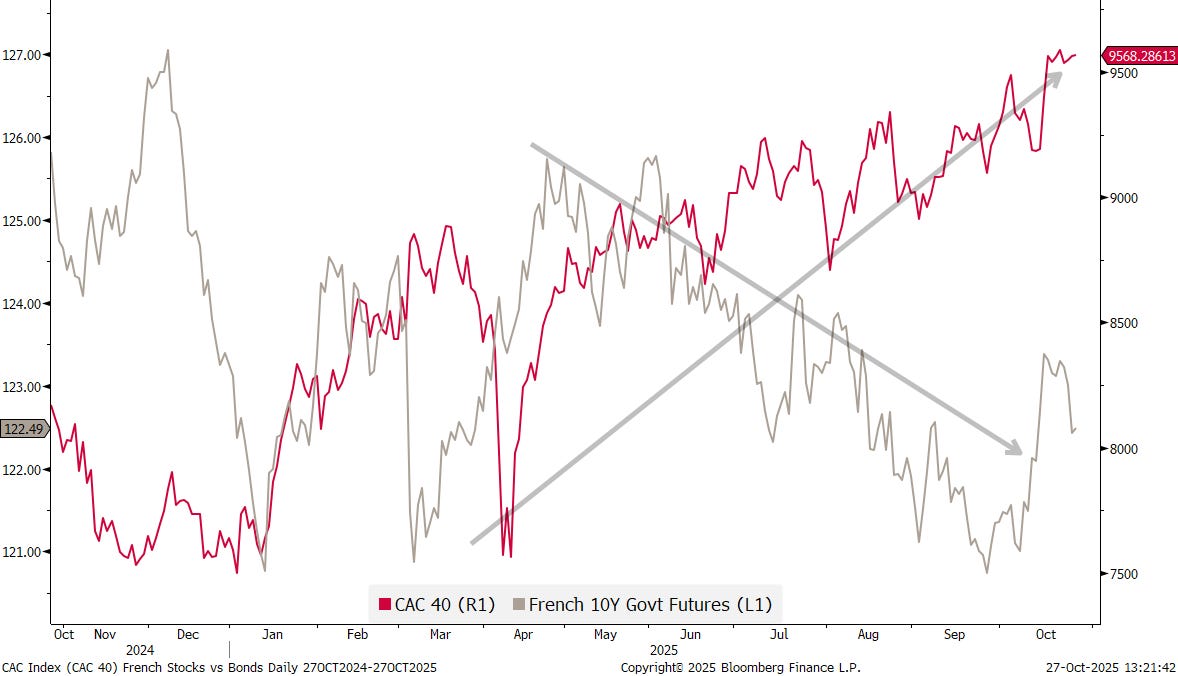
HOWEVER, the CAC-40 in France has now joined in on the party, by making a new ATH last week and helping the broader European index higher:
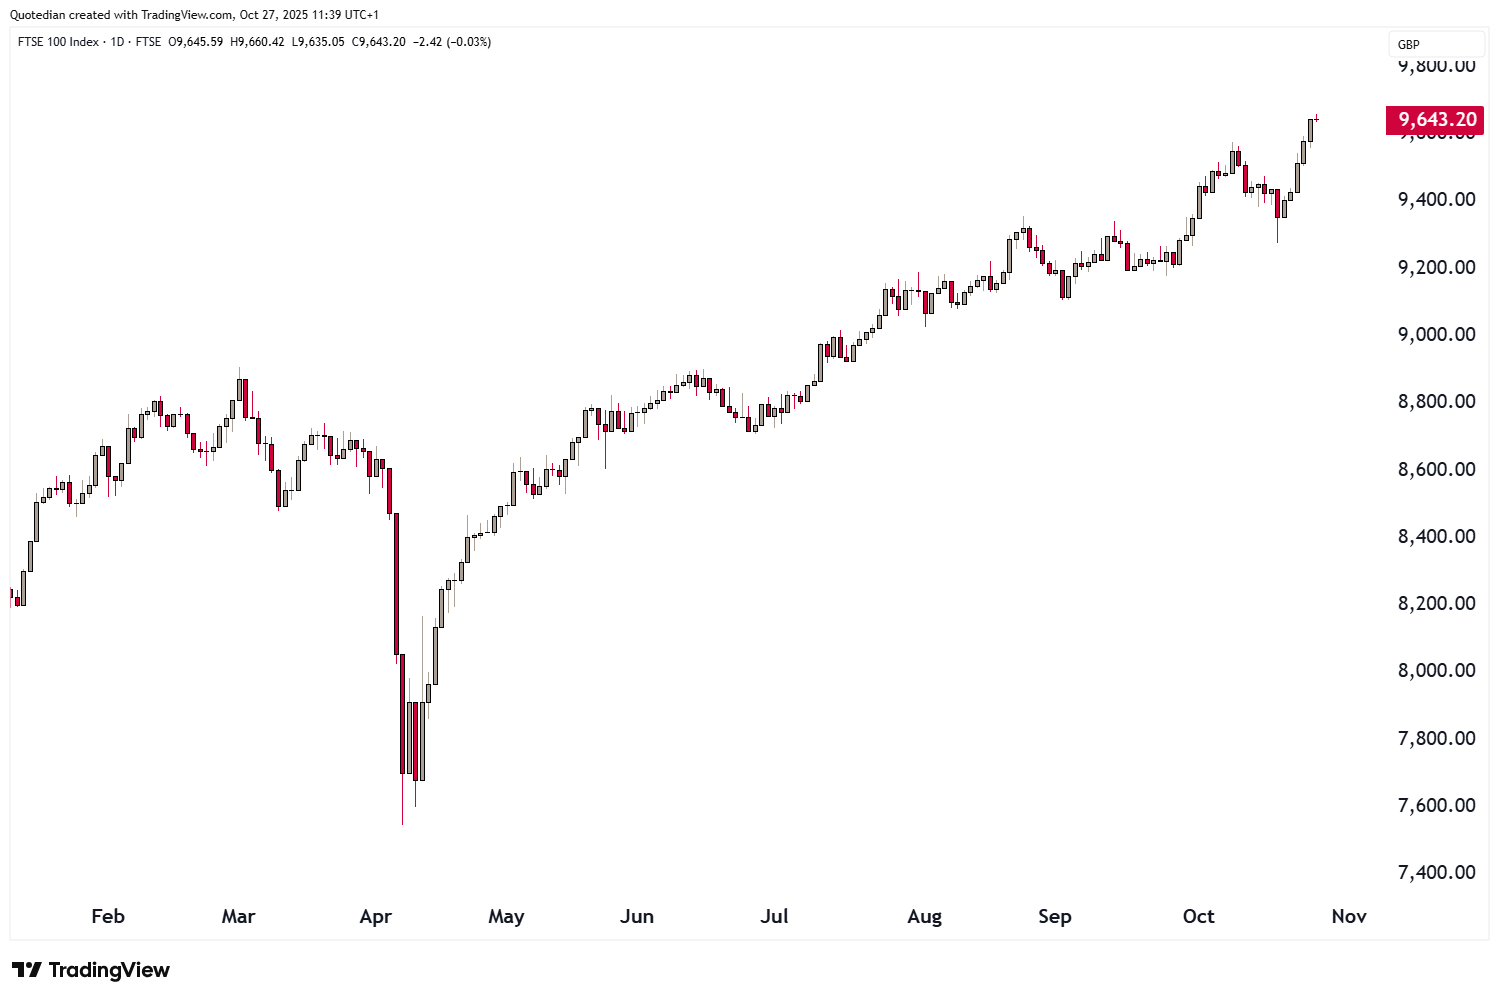
In the UK, the Footsie is less than four percent away from hitting the 10,000 mile-stone:
In Asia in the meantime, Japan’s Nikkei 225 just took out the 50k landmark for the first time:
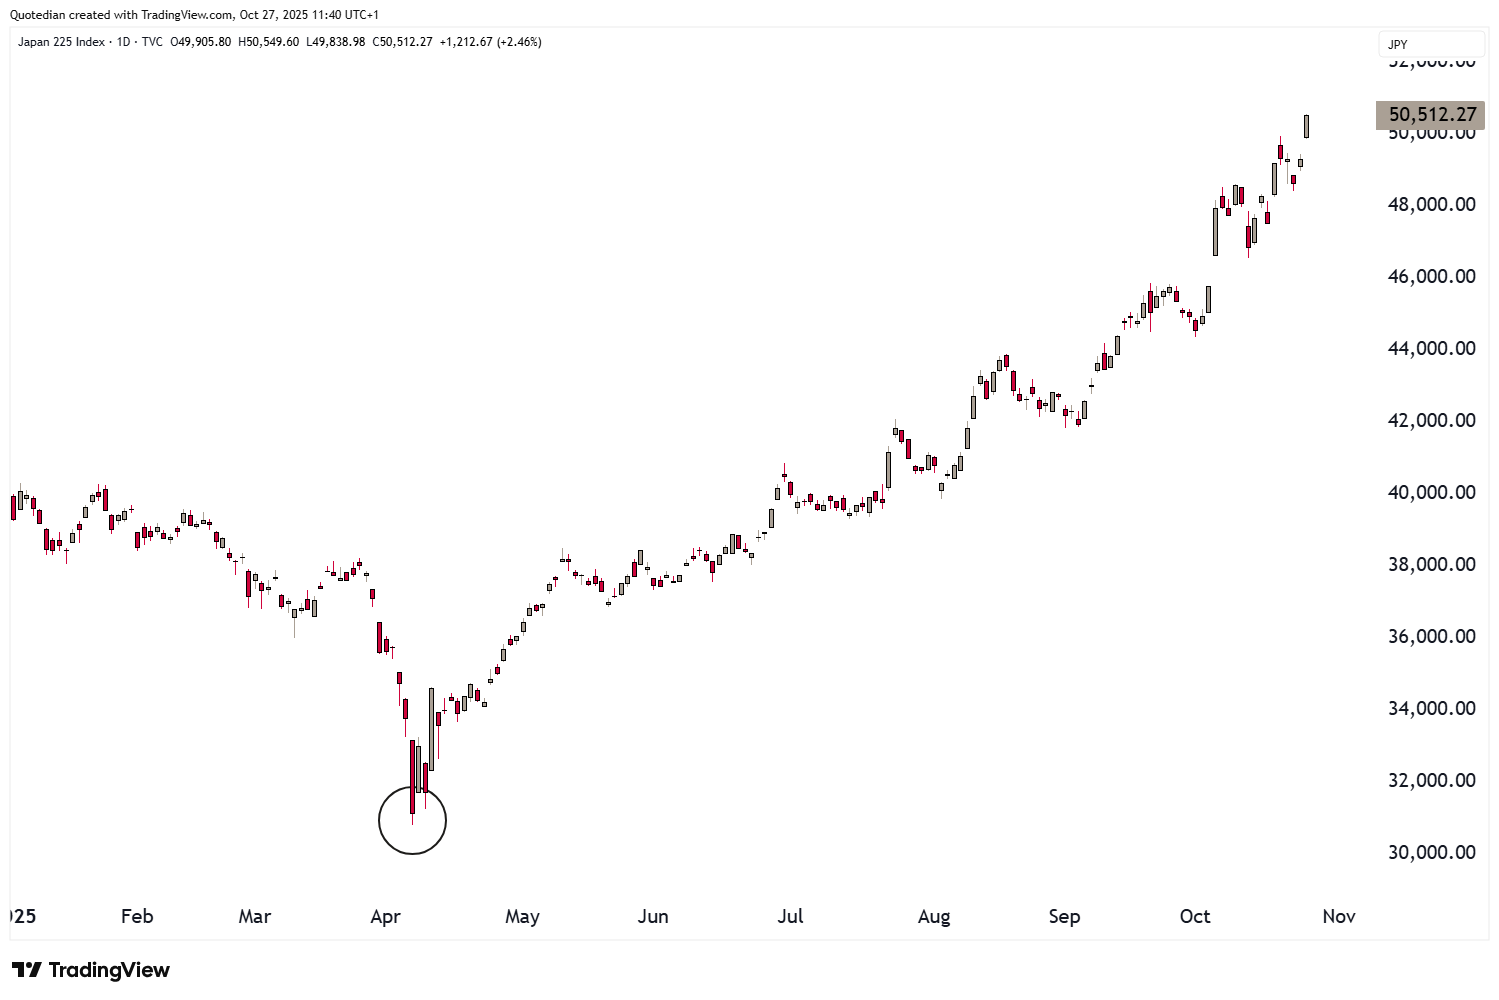
Please note that index nearly touched 30k during the April “Liberation Day” panic low, for a 60%-plus rally since then!
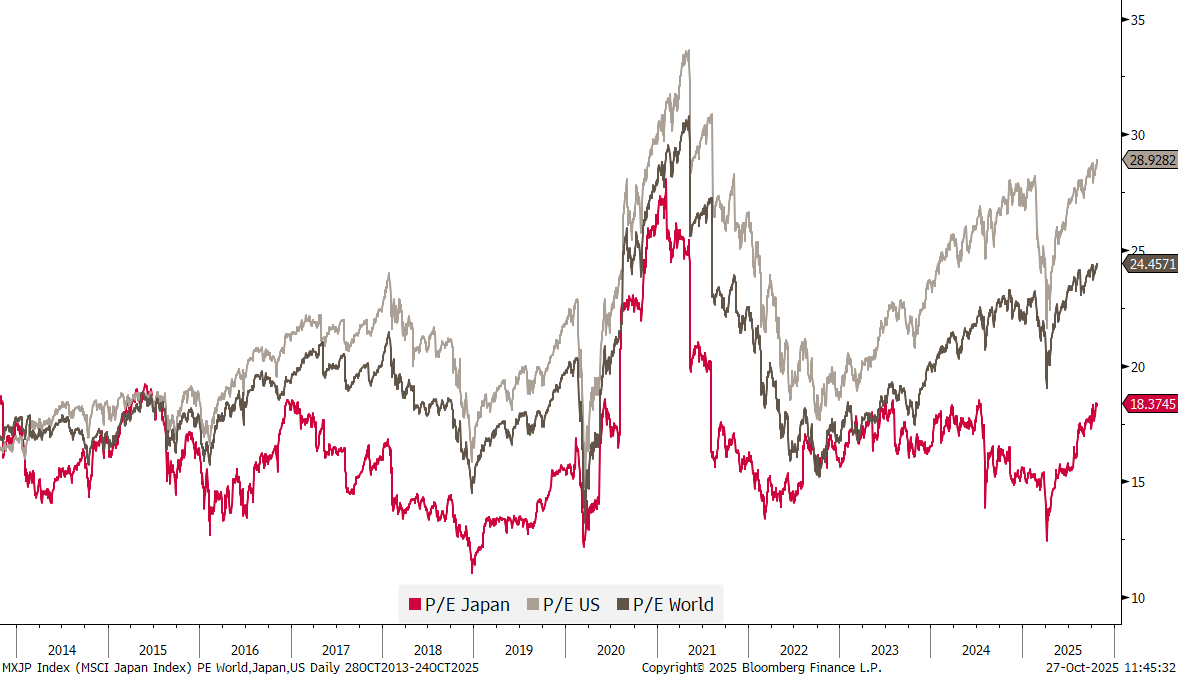
How much further can the rally go for Japanese stocks? Well, keep in mind that valuation (P/E) wise it is not expensive yet to invest in the land of the rising sun:
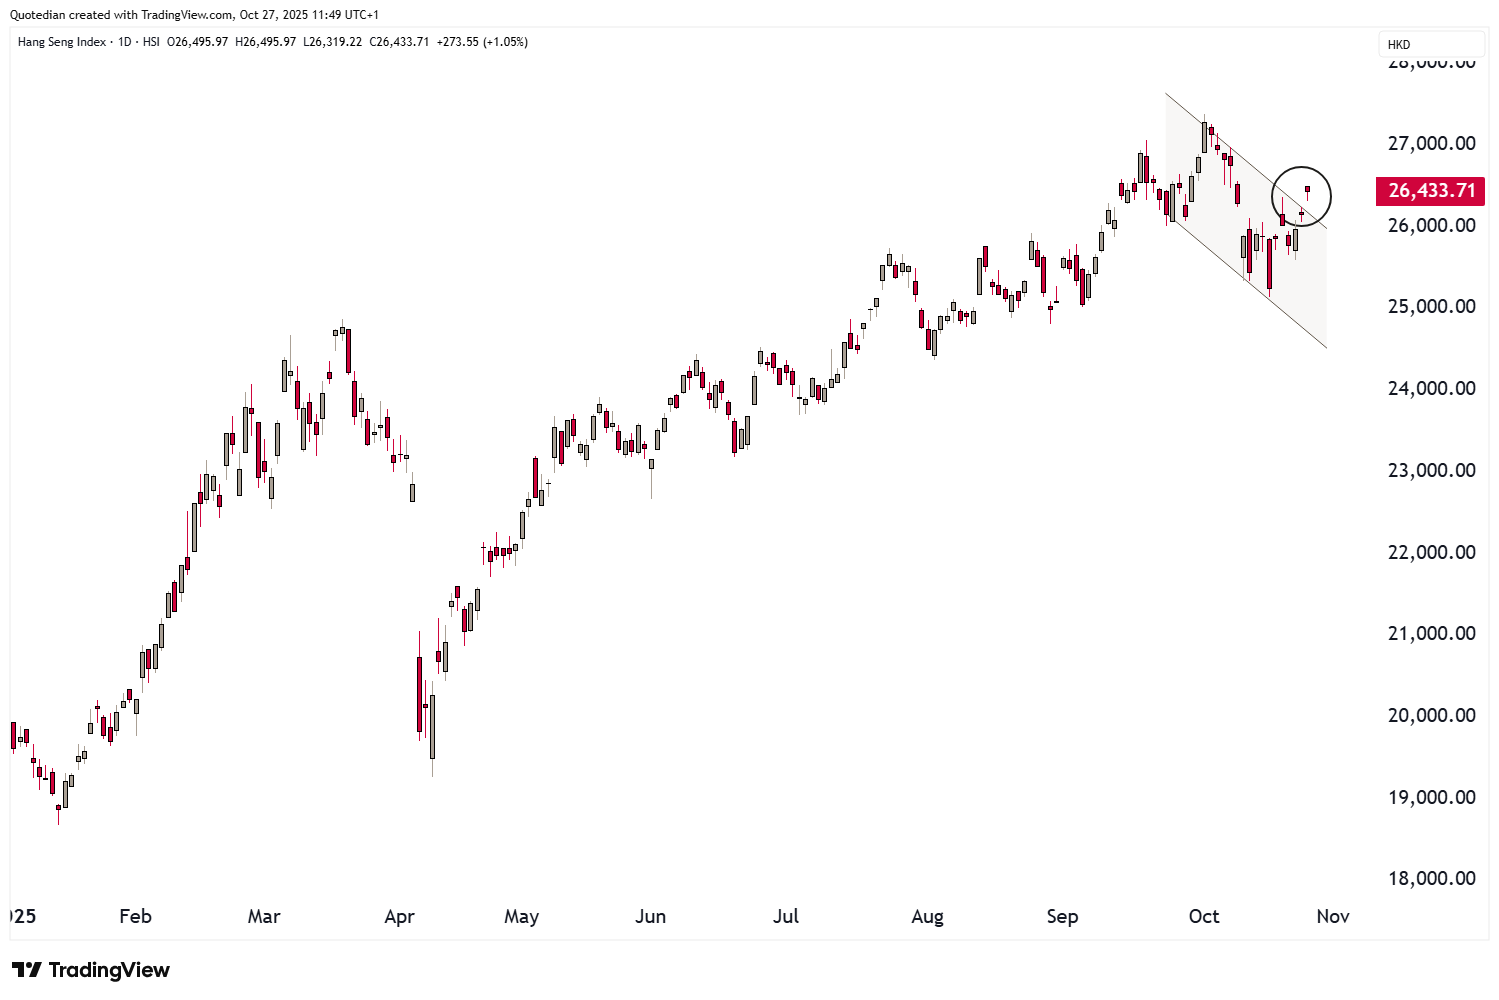
Trump’s on-’n-off tariff tantrum with China is seemingly not affecting the stock market. Hong Kong’s Hang Seng index is moving out of its consolidation phase and seems poised to reach new ATHs soon:
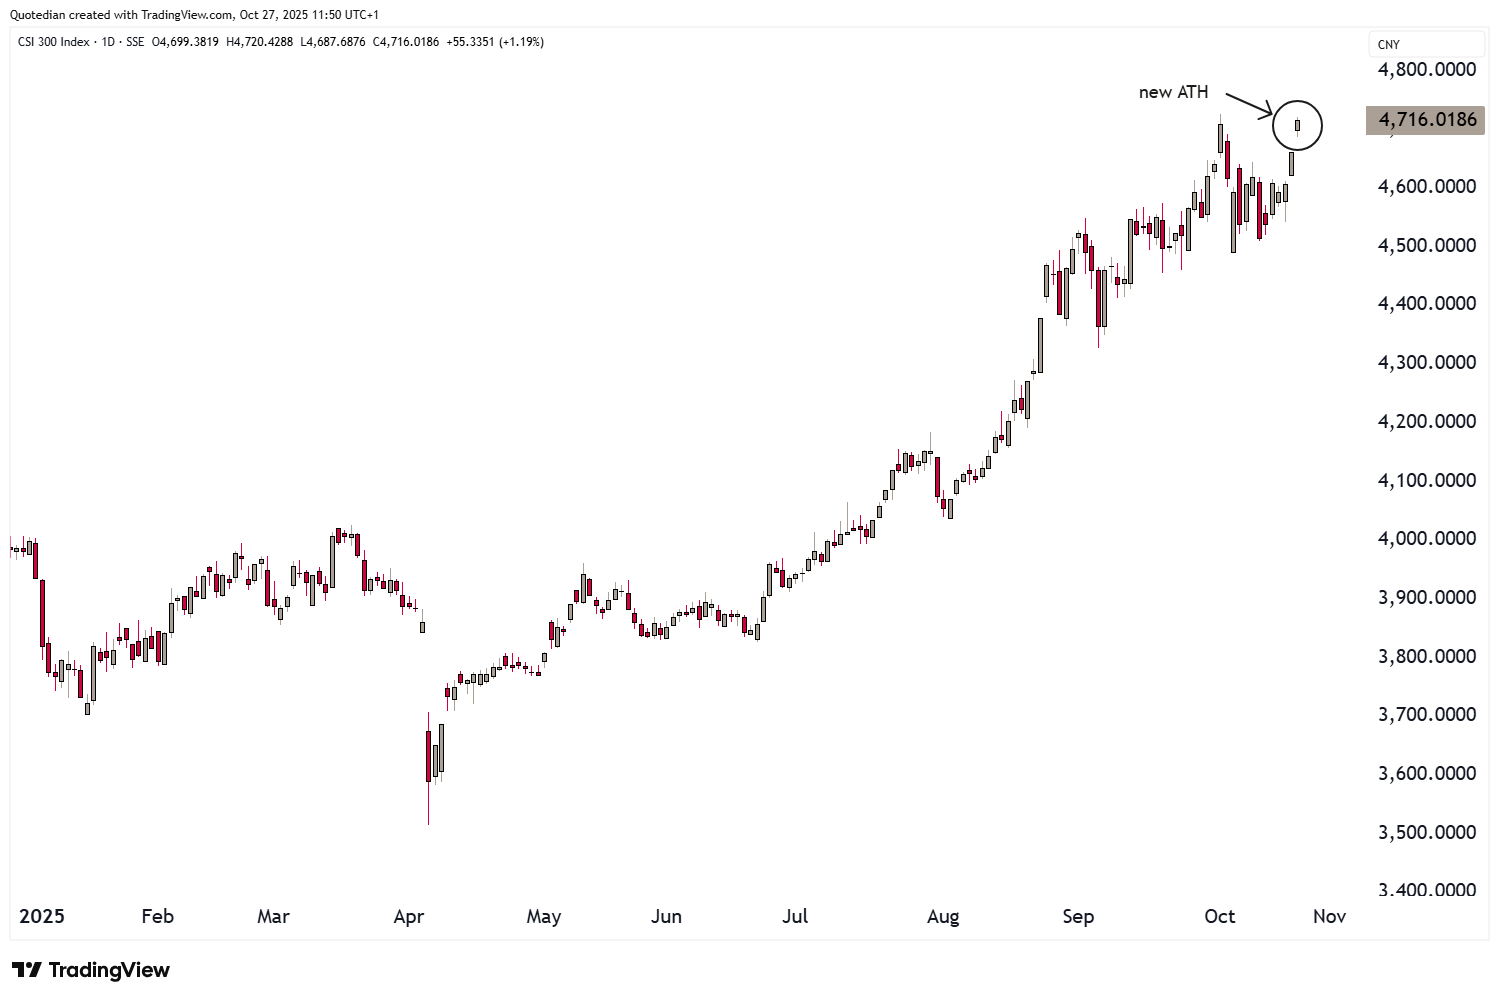
This view is further reinforced with China mainland equities (CSI300) already having reached a new ATH this Monday:
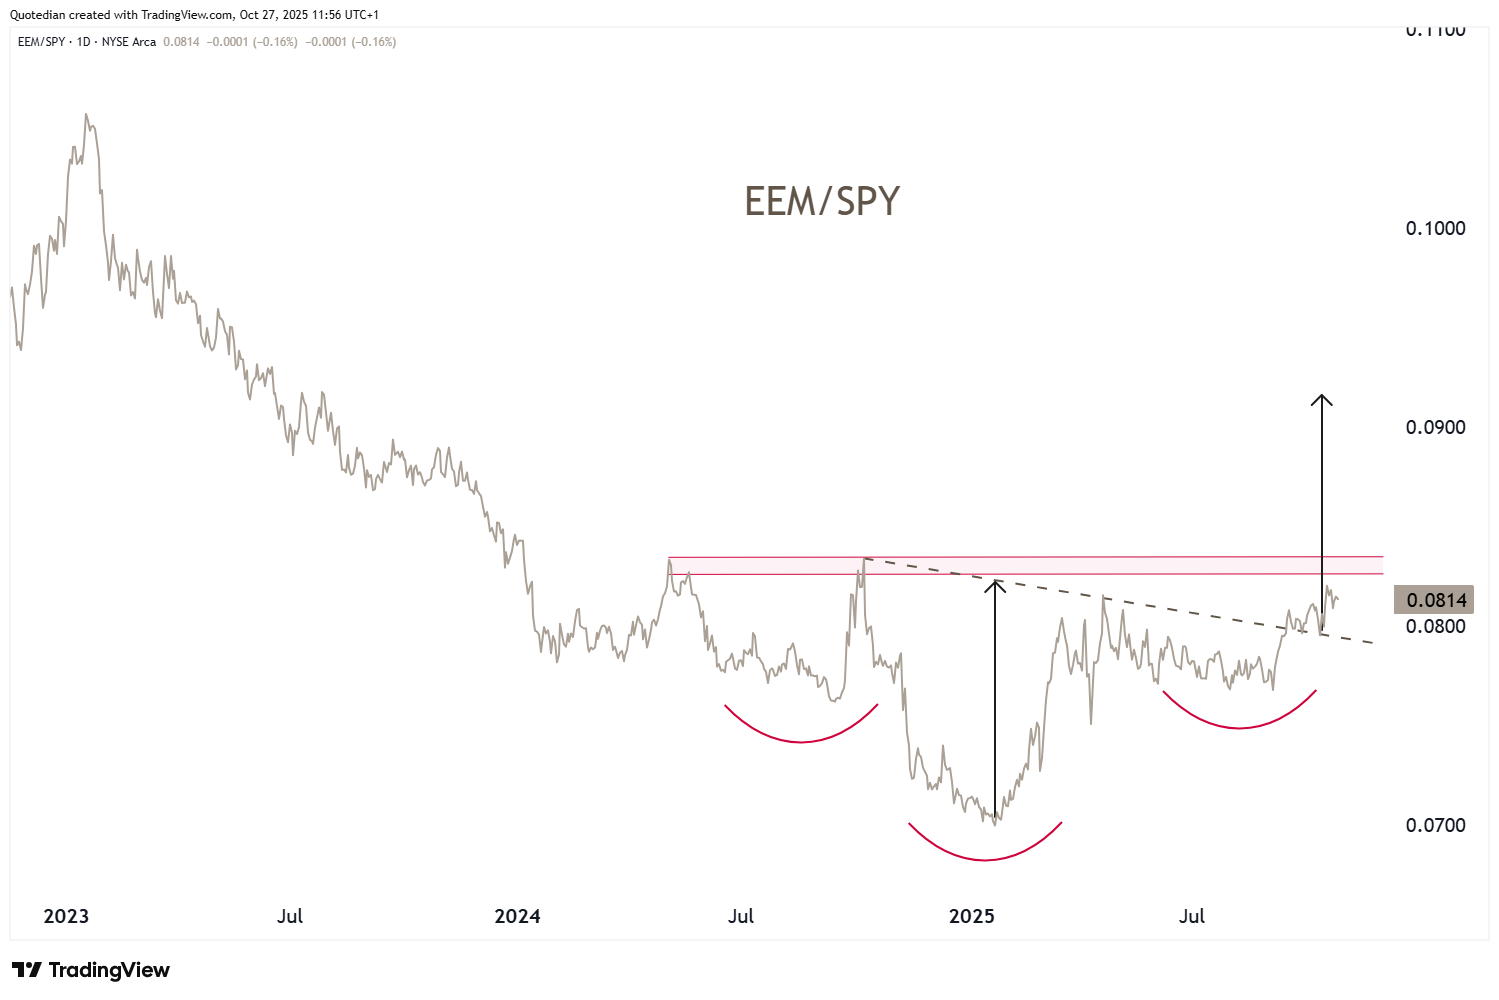
Finally, emerging markets, hereunder proxied via the iShares Emerging Market ETF could be setting up for a tradeable relative breakout versus US stocks (SPY - SPDR S&P 500 Tracker ETF):
In terms of sector performance, on a global level technology and communication stocks continue to dominate the performance table, however, utilities and health care had the steepest climbs over the past few weeks:
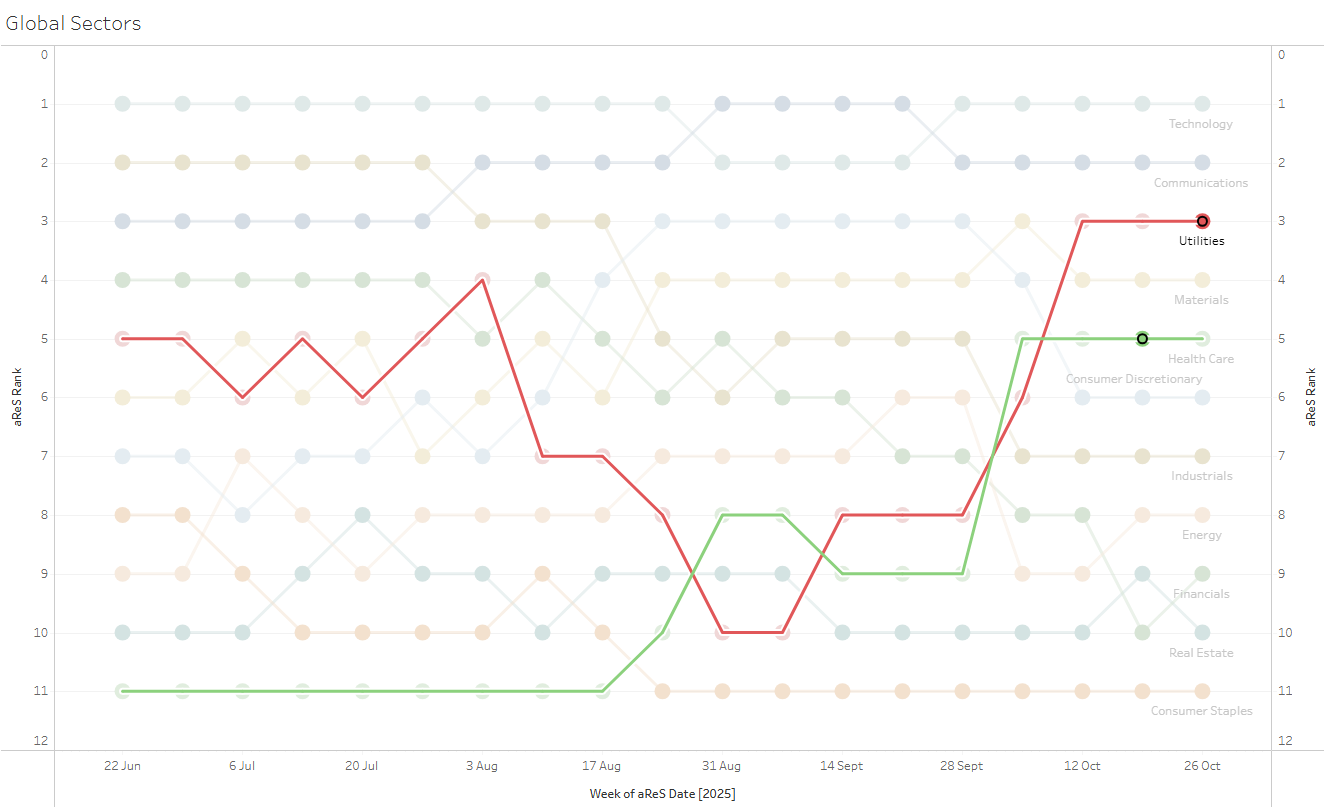
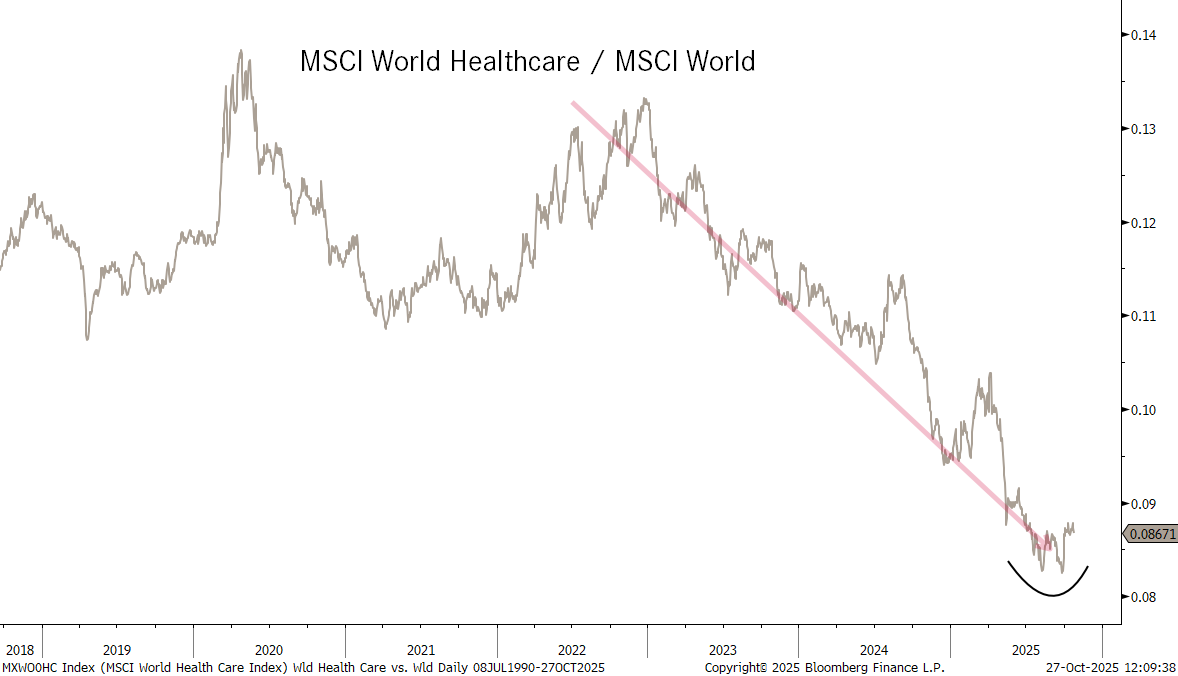
Traditionally, such a strong move up in two defensive sectors should be considered a warning sign. And not to express the five most expensive words in investing “this time it’s different”, but both sectors have been rallying for specific reasons. Utilities are at the forefront of the AI (data center) build out and health care stocks are rebounding from a period of extreme underperformance:
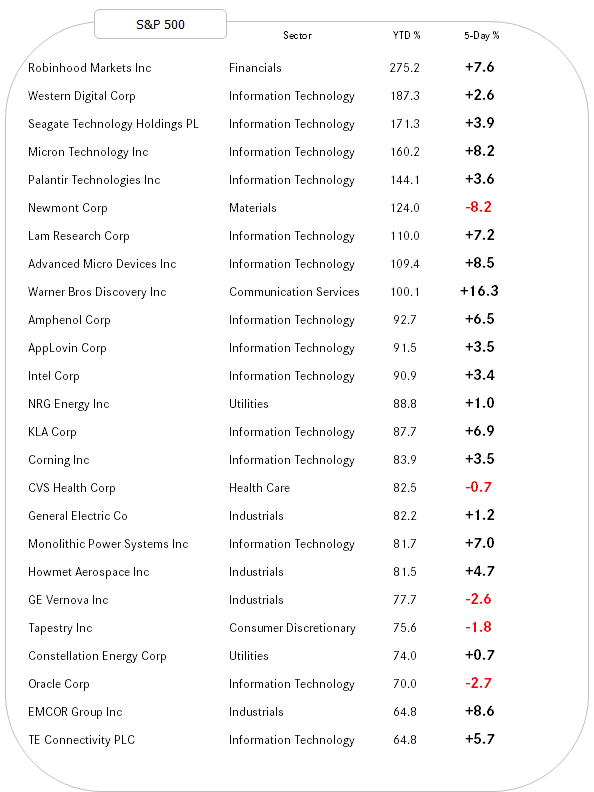
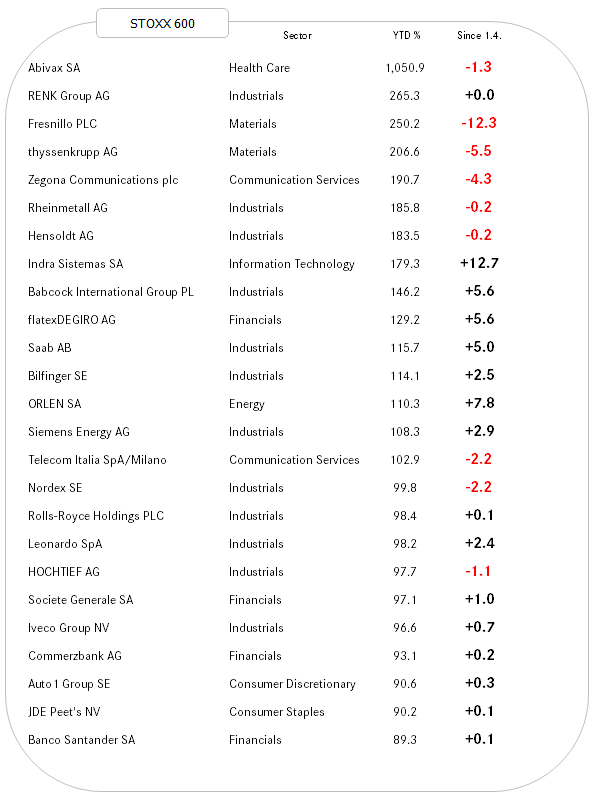
And last but not least, to end the equity section, here are the top-performing stocks in the US (S&P 500) and Europe (STOXX 600) this year and how they have fared over the past week:

As mentioned above, the market assumes a FOMC rate cut a done deal this Wednesday:
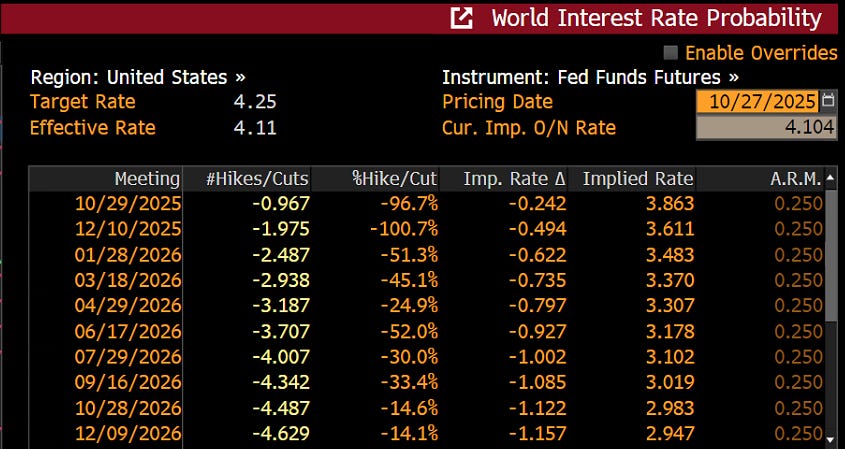
And one more in December and then at least two more in 2026, for a terminal rate around 3-3.25%.
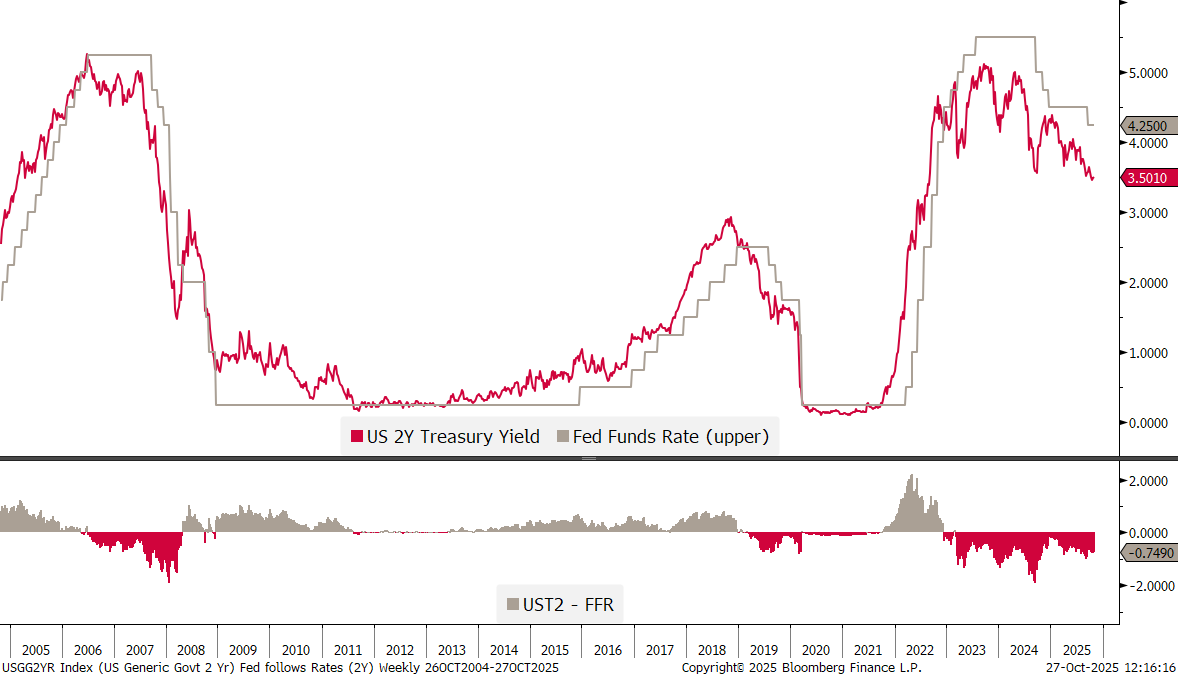
Two year treasury yields point to a 3.5% terminal rate for now:
With the US government shut-down still not resolved, the longer-end of the curve is badly missing most economic data and seems a bit “rudderless” at the moment:
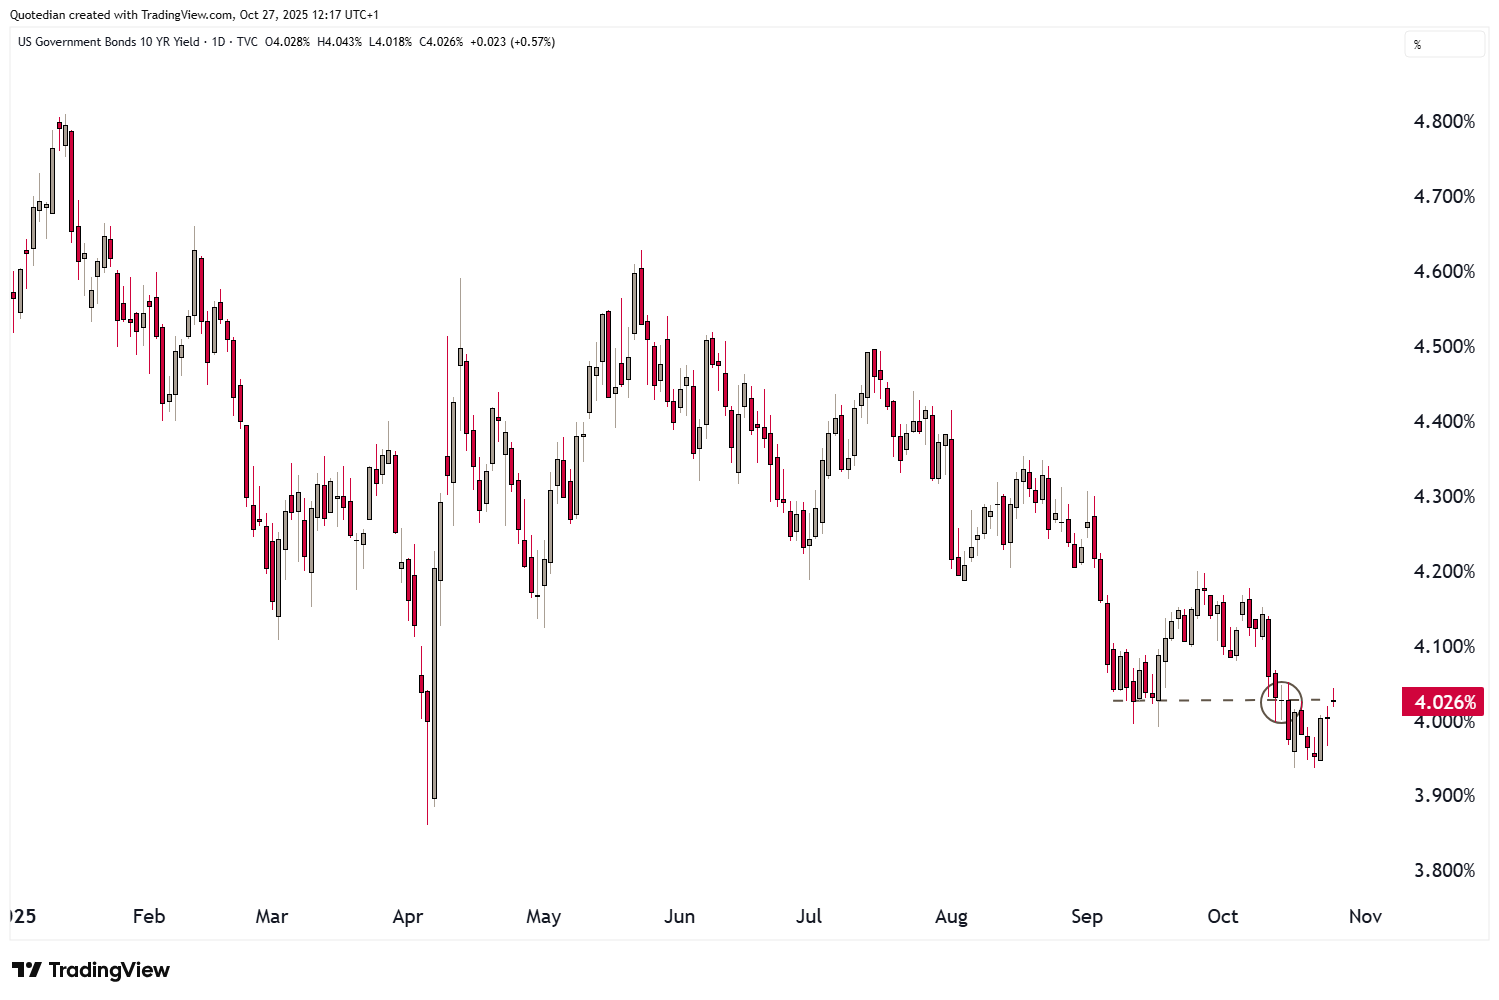
Still hovering around the 4% level, I continue to expect it to drop to 3.70-3.60 over the coming weeks. All bets off if the yields moves above 4.20.
In Europe, little to write about other than that the French-German 10-year yield spread has been widening again:
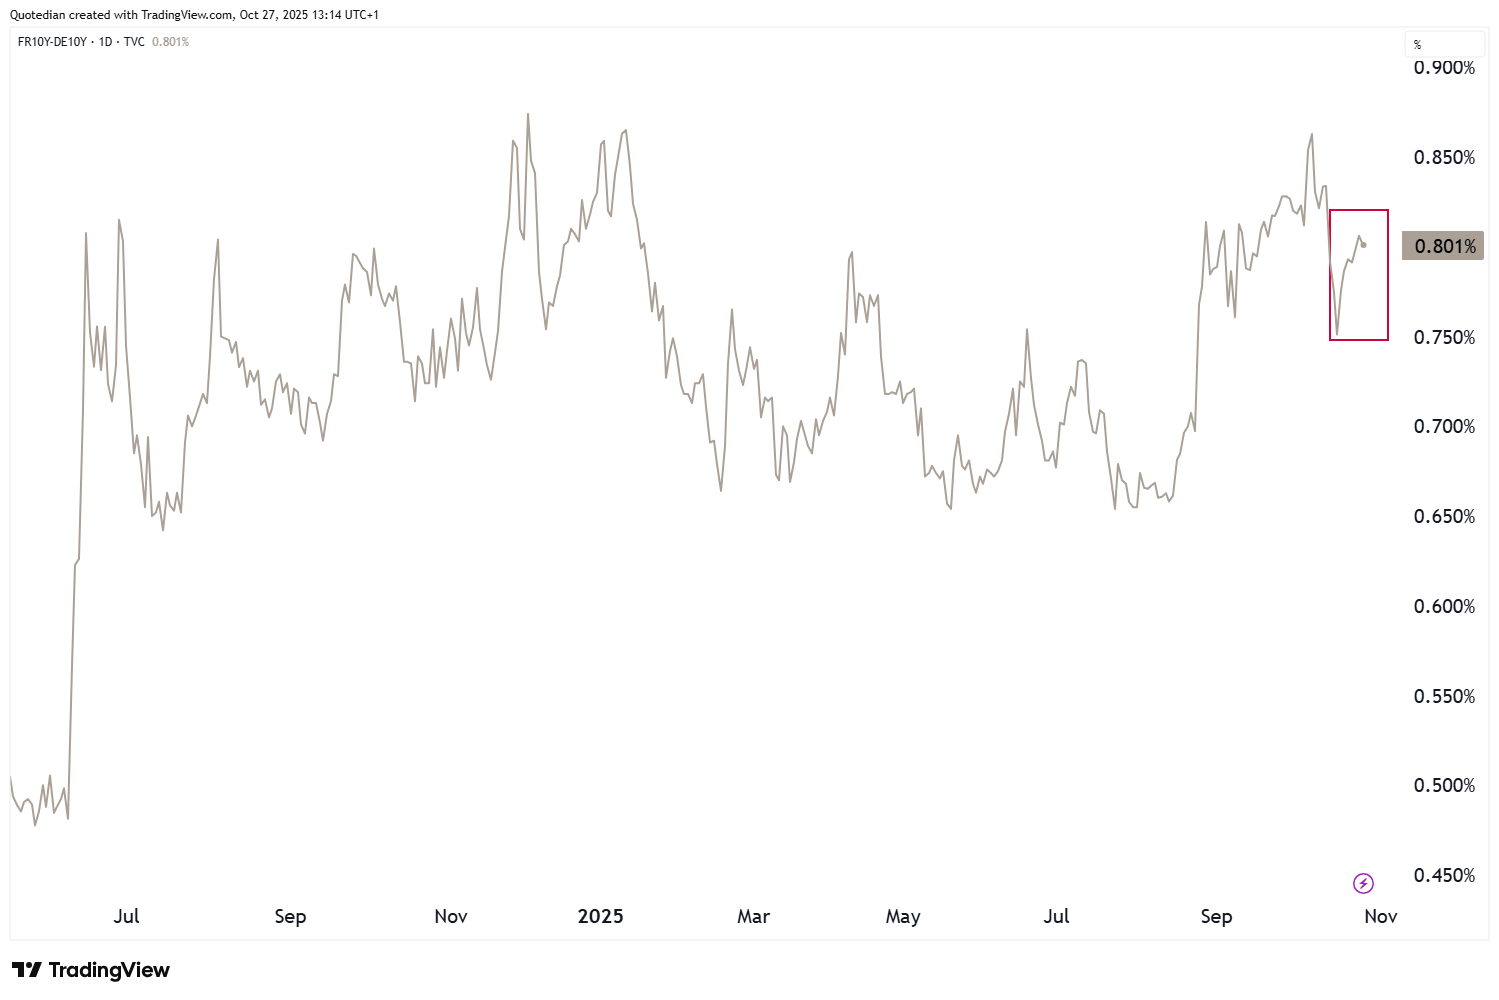
Given the good performance of the CAC40 discussed above, maybe investors in France are turning their back on the bond market (grey line) in favour of the stock market (red line)?
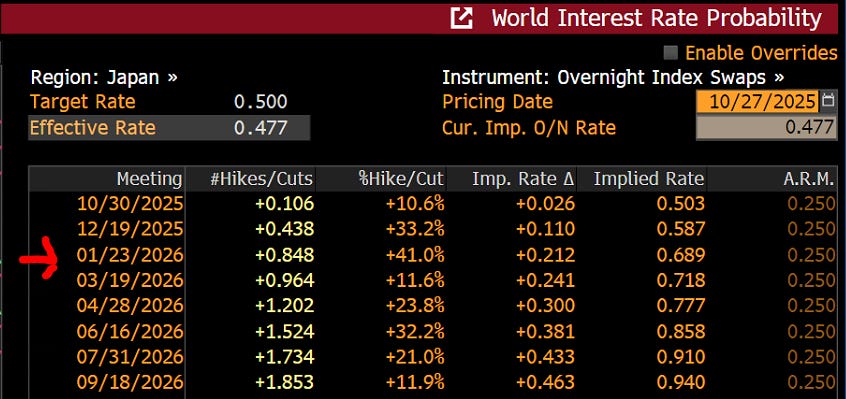
A (bond) market to watch this week could be Japanese JGBs, as not only will PM Takaichi meet President Trump for the first time in person, but it is hoped that the October 30 BoJ policy meeting will provide some clues as to when interest rates may next be raised.
Markets are pricing in a 25 rate hike over the next three months,
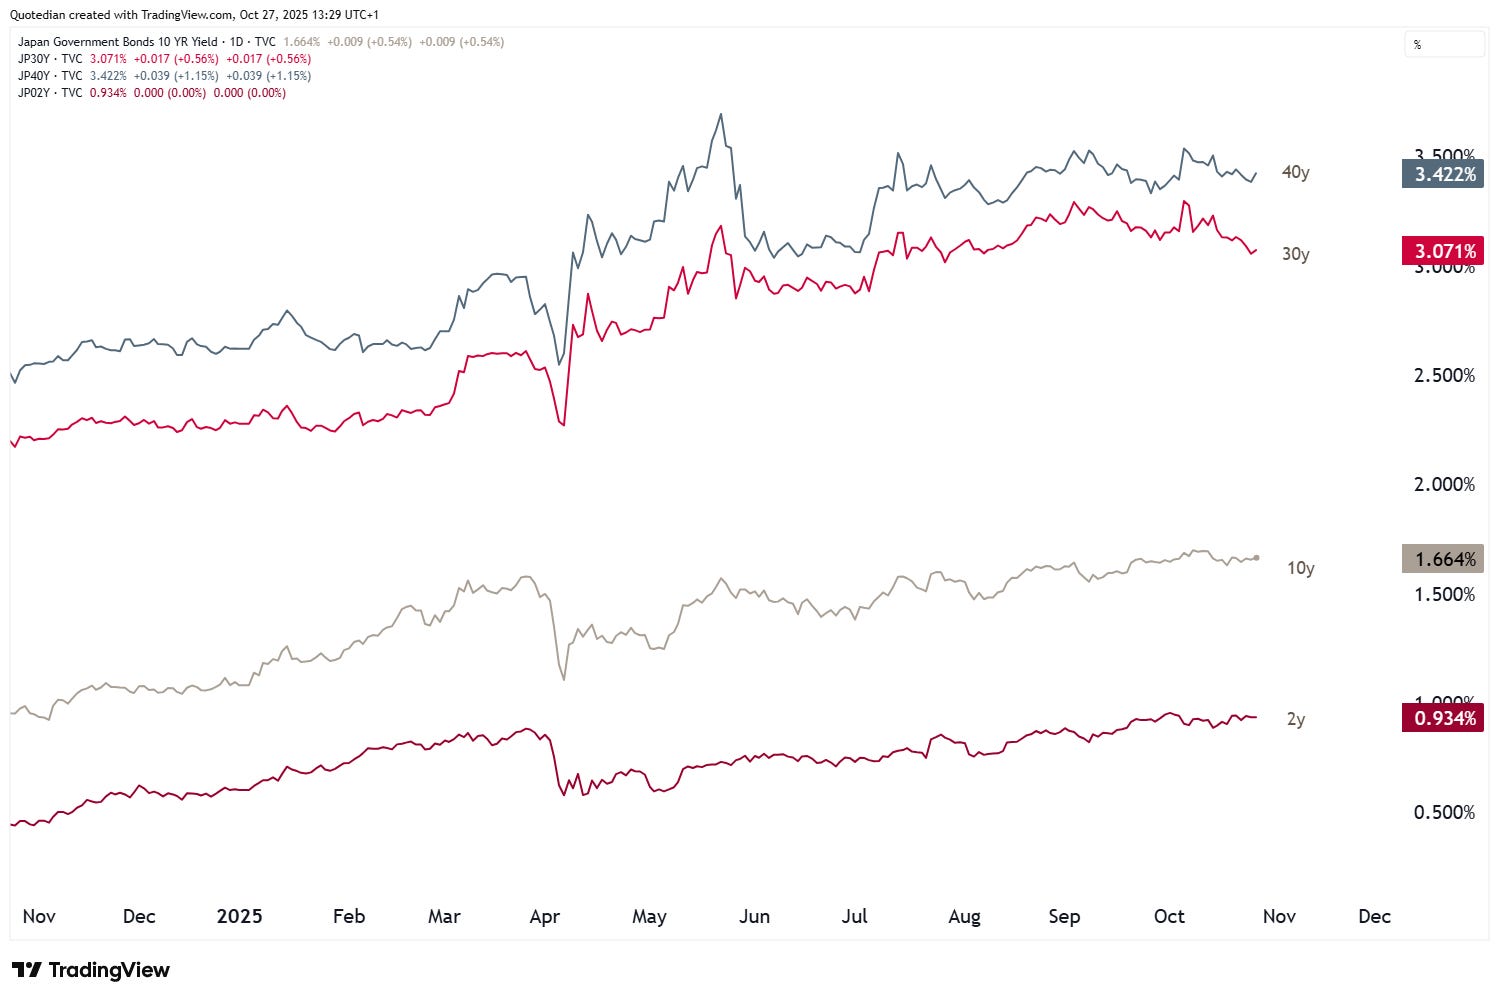
The 40- and 30-year JGB yields trade substantially above the current policy rate of 0.50%, but if the 2-year rate is nearly double the policy rate:

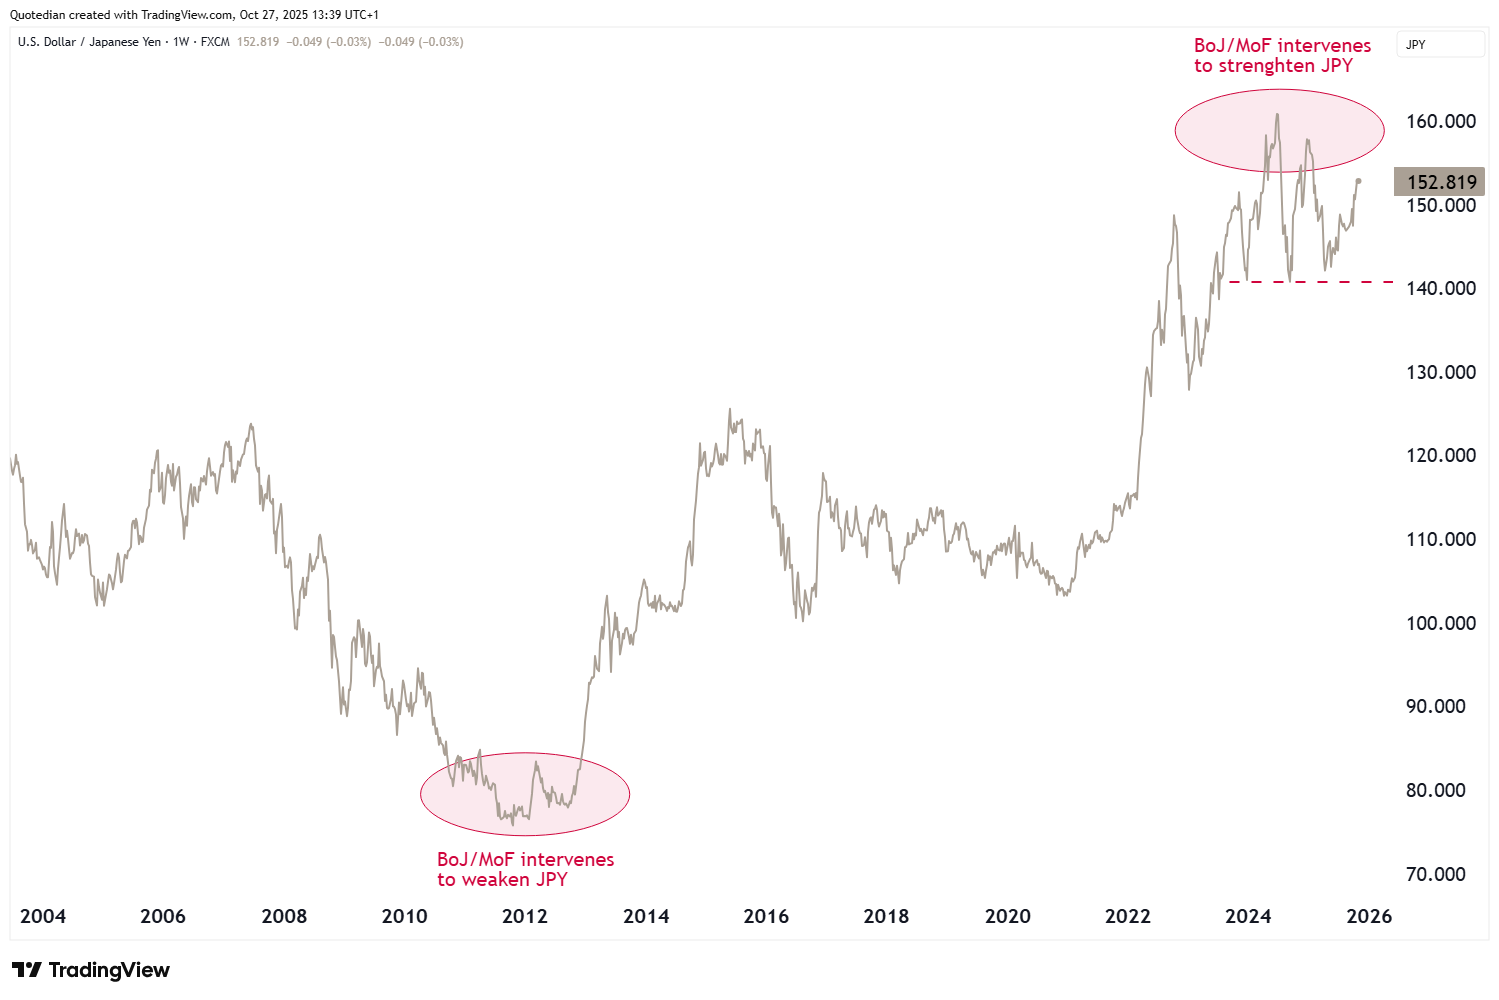
Using the JGB observation as a segue into the currency section, we note that the continued low policy rate policy (hhhmmmm) by the BoJ continues to pressure the Japanese Yen, which is so far the weakest G10 currency in October:
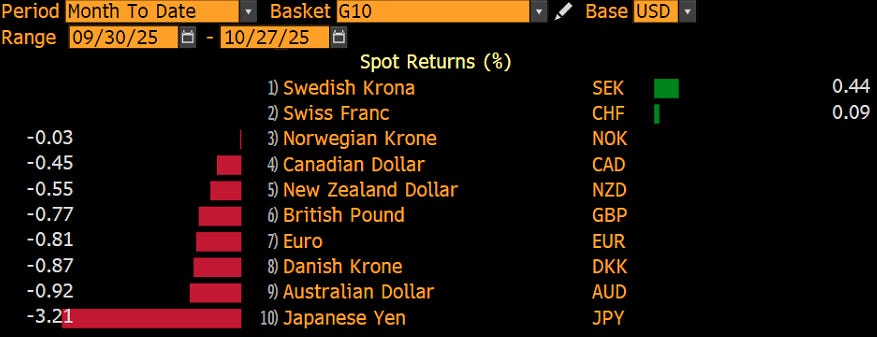
I continue to think the Yen will eventually (be forced) to trade much higher, but patience is needed. Here’s our longer-term thesis on USD/JPY:
Zooming in on the same currency pair, the short-term picture is extremely intriguing:
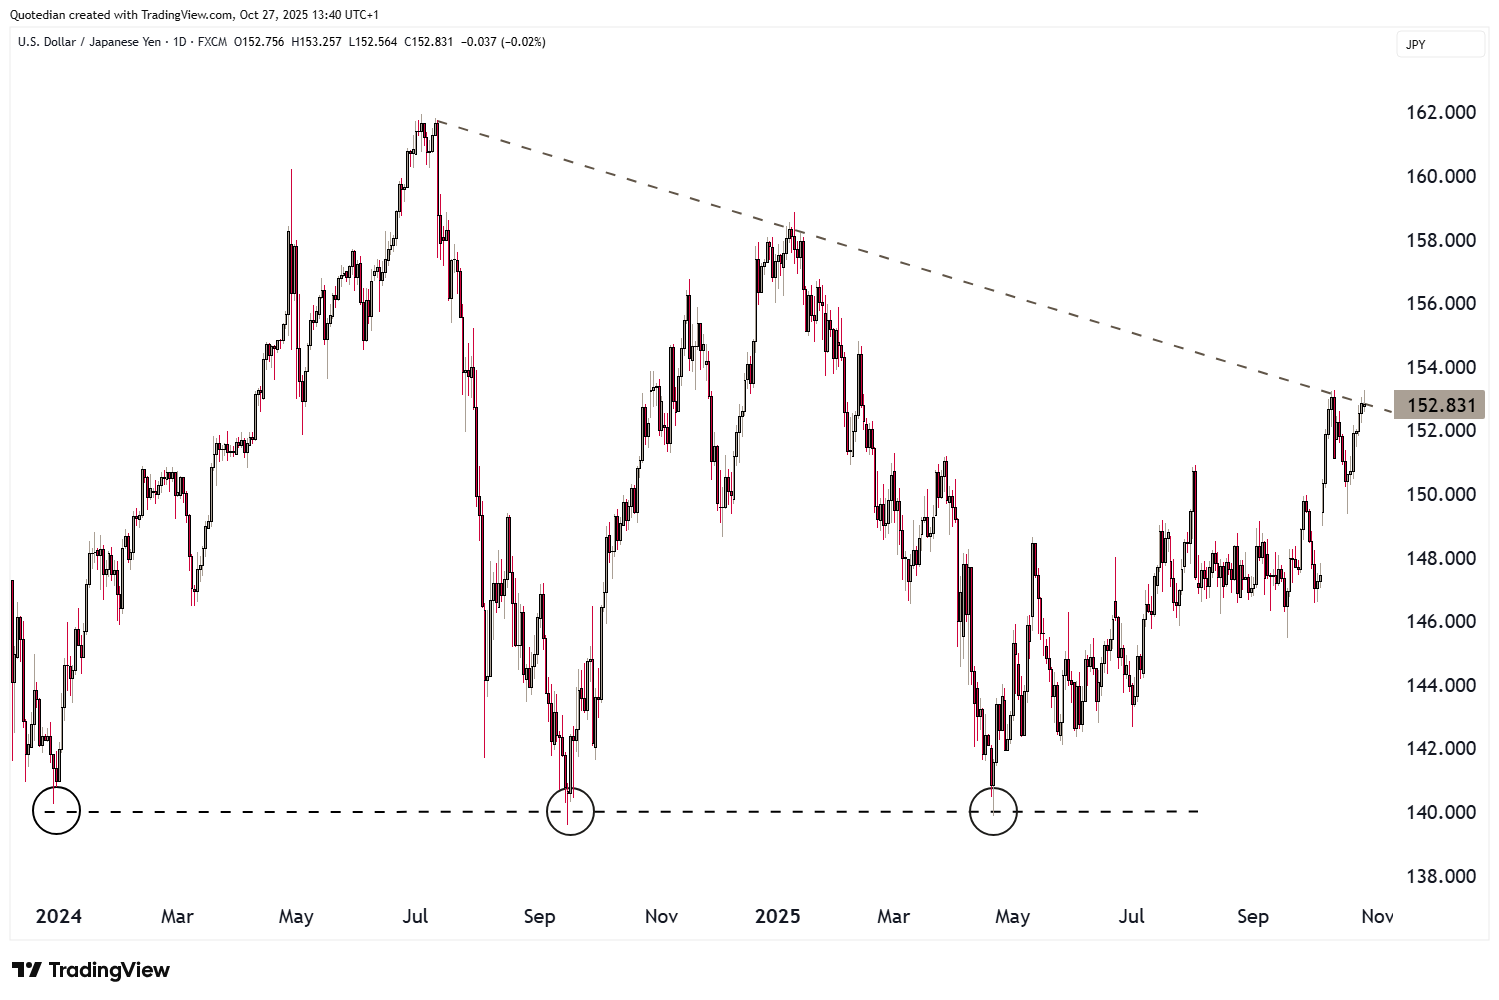
A low-risk (i.e. limited cost risk) trade here would be to go short USD, long JPY at the current level, with a tight stop loss above 154.00 and a price target of 146 or lower.
The Dollar itself has been one of the stronger G10 currencies this month, but the Dollar Index continues to be trapped inside its consolidation “box”:
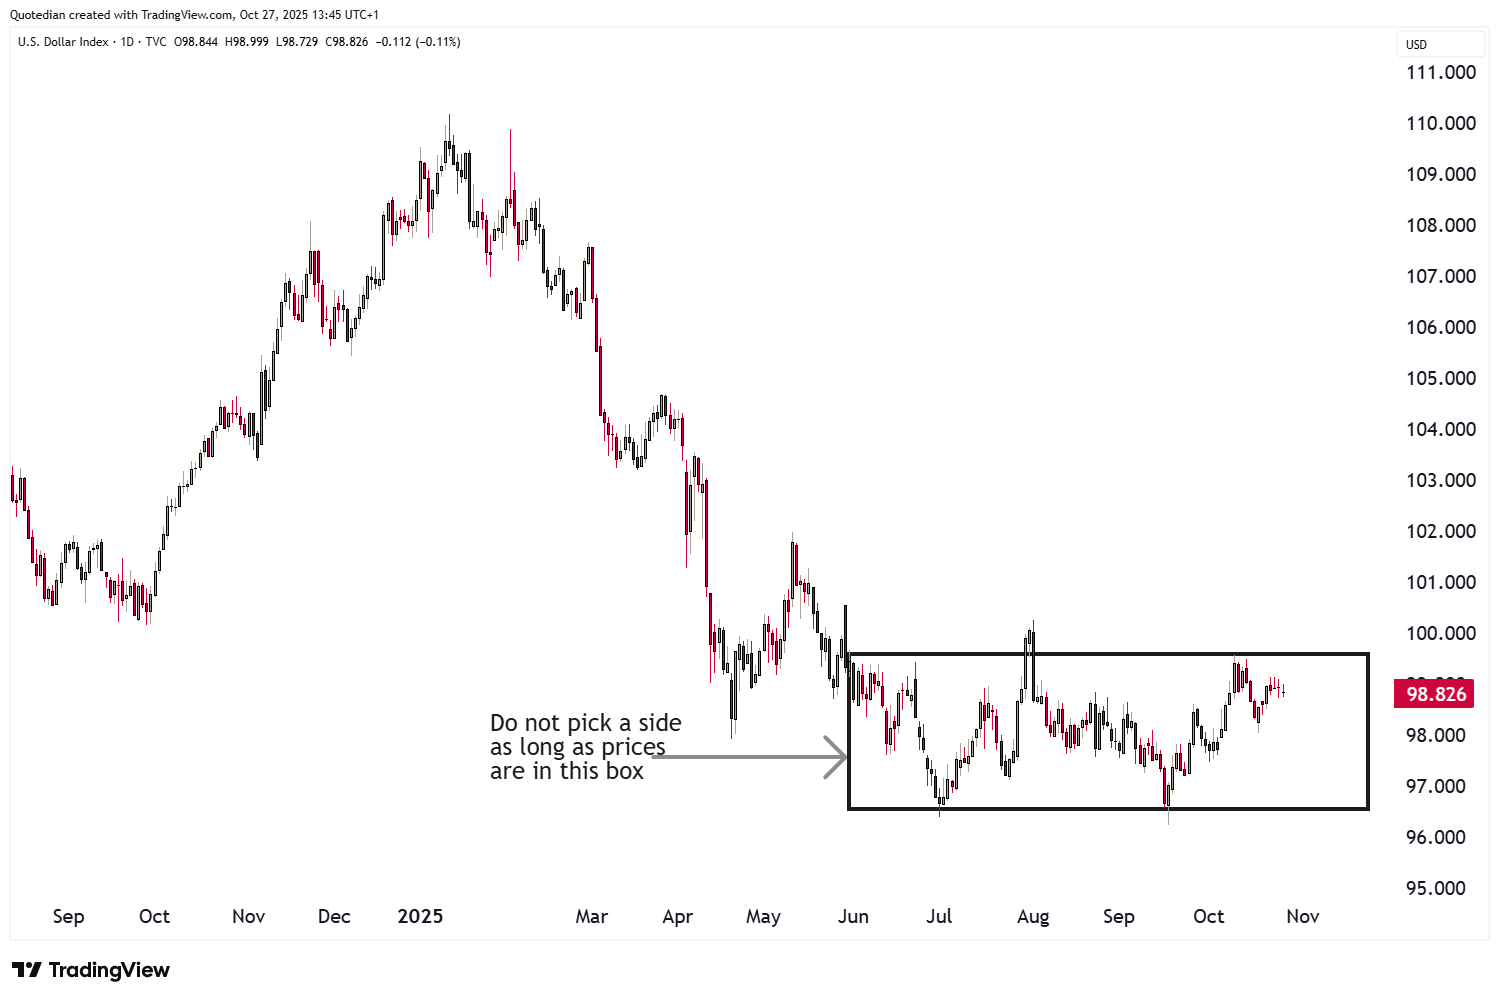
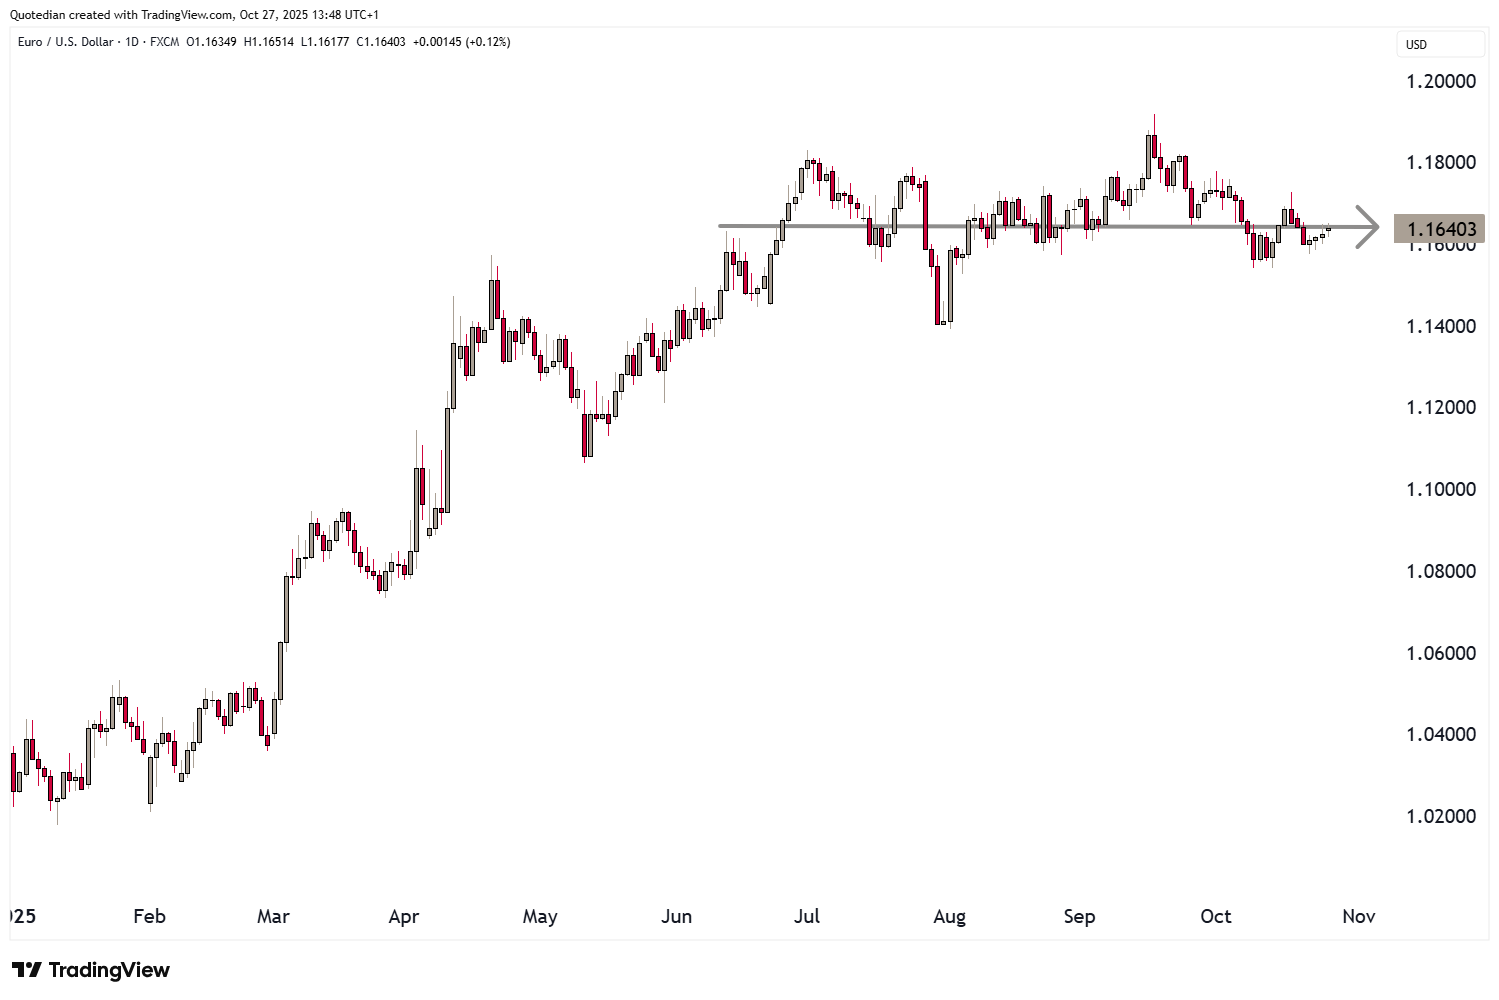
What does this mean for the EUR/USD cross? Notin’:

Finally, in commodity markets, last week’s move in crude oil has taken many (bears) by surprise:
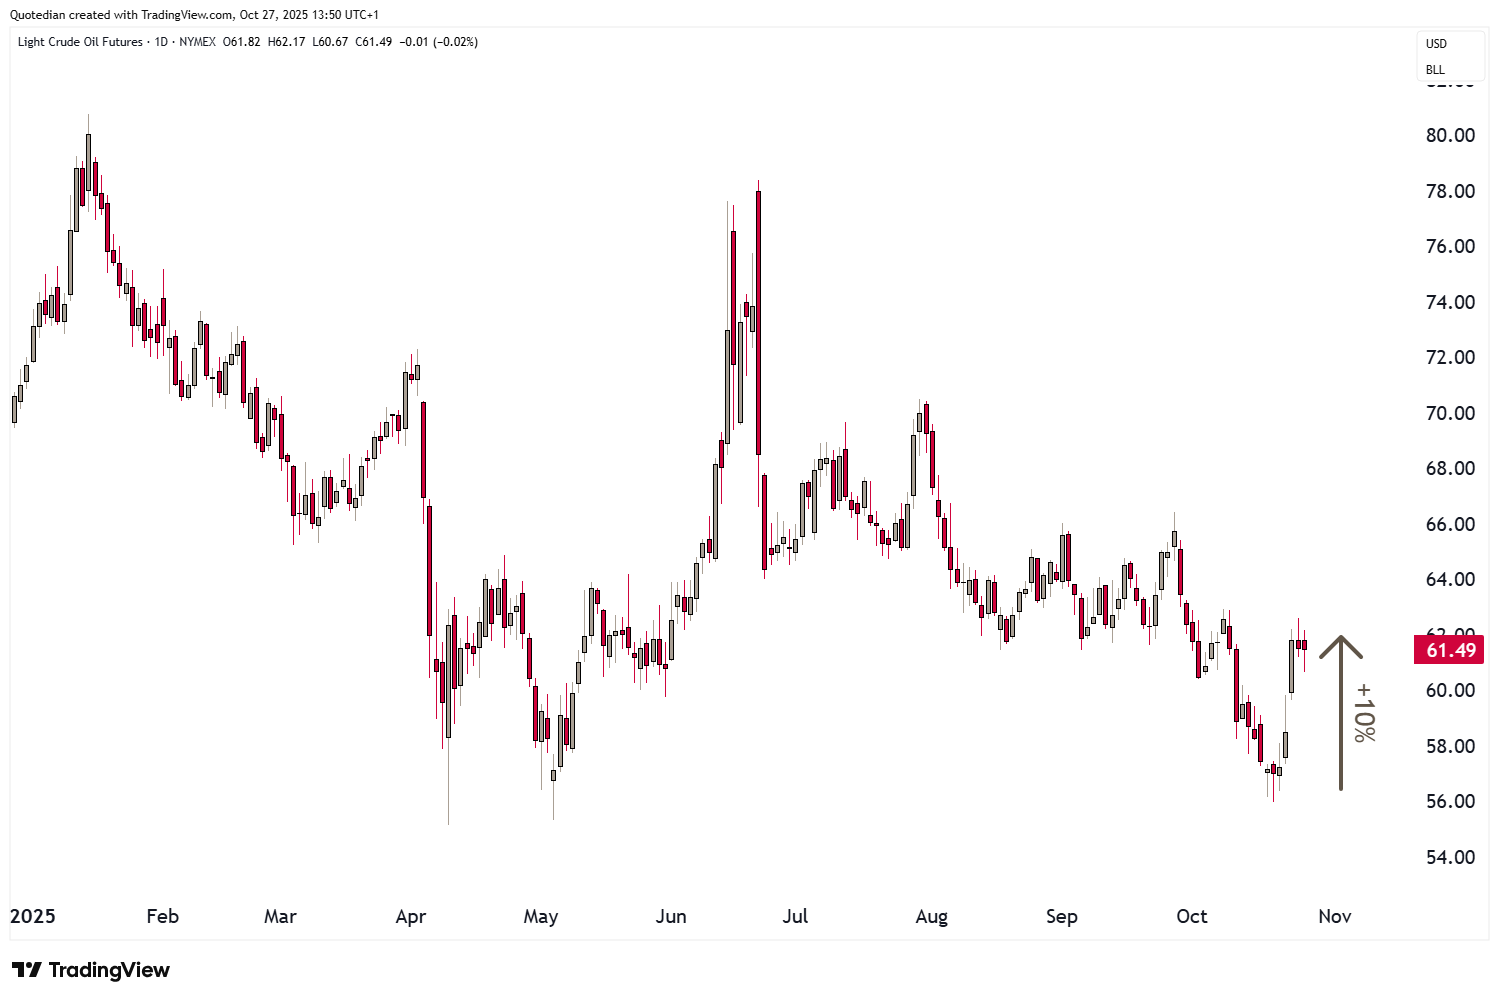
This 10% jump over two sessions came after the US government decided to sanction the two largest Russian oil companies, Rosneft and Lukoil.
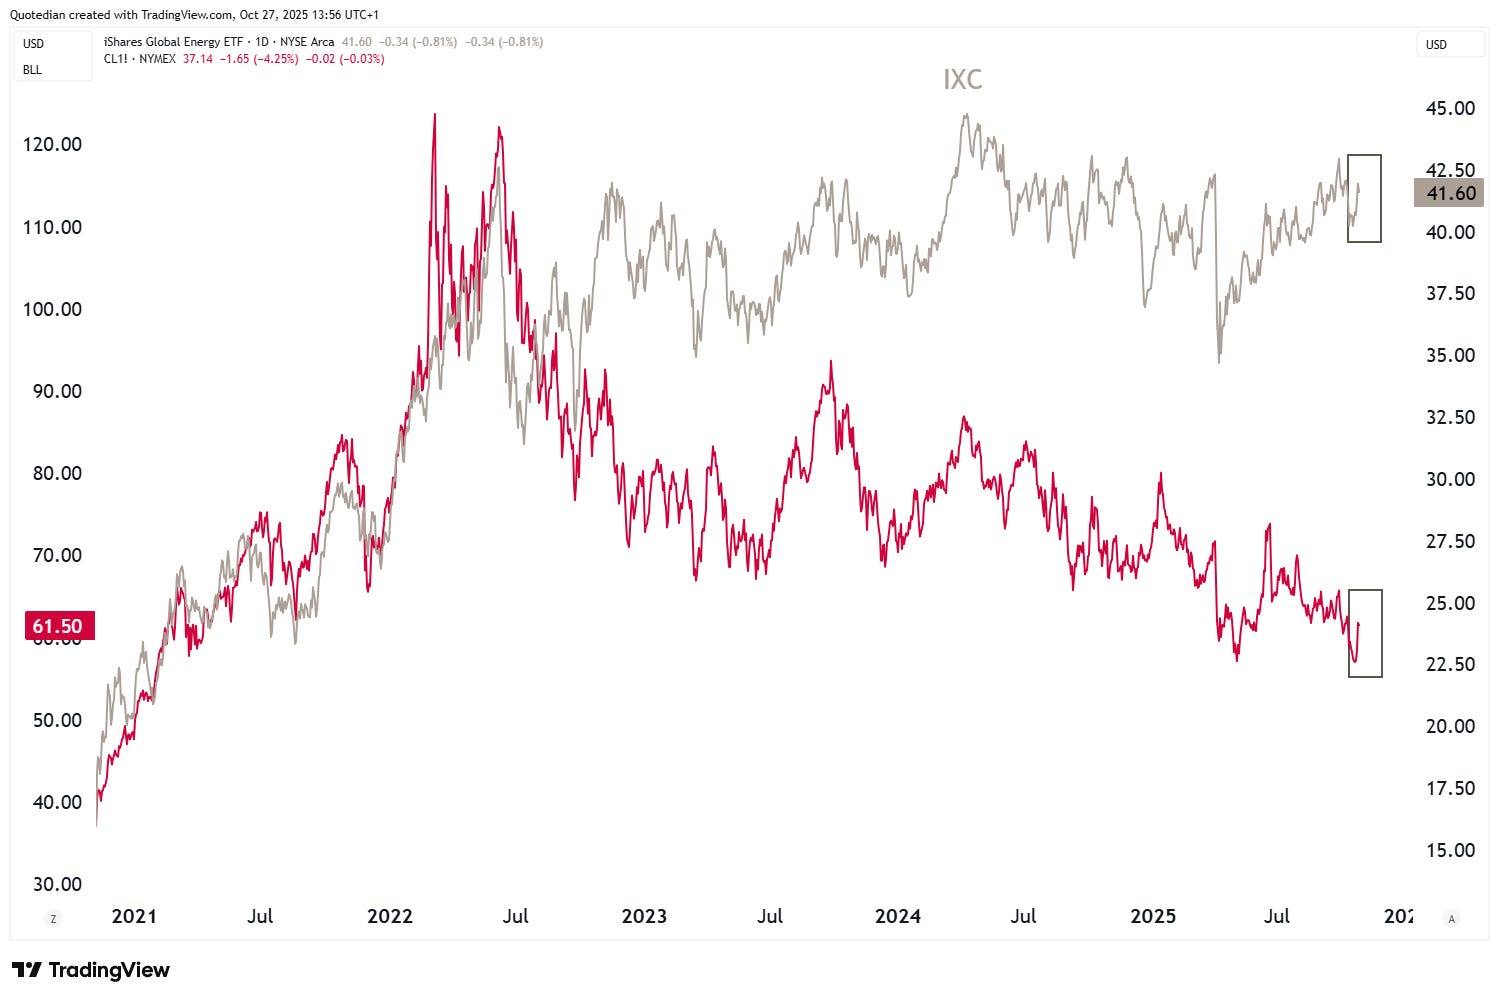
As I highlighted in a post in LinkedIn (click here), for oil companies, which have been holding up pretty decently, despite excessive pessimism, another leg up could develop if the price of crude can hold up:
"Alright, that’s it for this week. Same time, same place, next week. And don’t say I didn’t warn you."
André

In reality, you need no other Disclaimer than the one above, but just in case:
Everything in this document is for educational purposes only (FEPO)
Nothing in this document should be considered investment advice
Investing real money can be costly; don’t do stupid shit
Leave politics at the door—markets don’t care.
Past performance is hopefully no indication of future performance
The views expressed in this document may differ from the views published by Neue Private Bank AG