AD[ios]YEN²
The Quotedian - Vol VI, Issue 59 | Powered by NPB Neue Privat Bank AG
“If you find yourself in a hole, stop digging.”
— Will Rogers
DASHBOARD
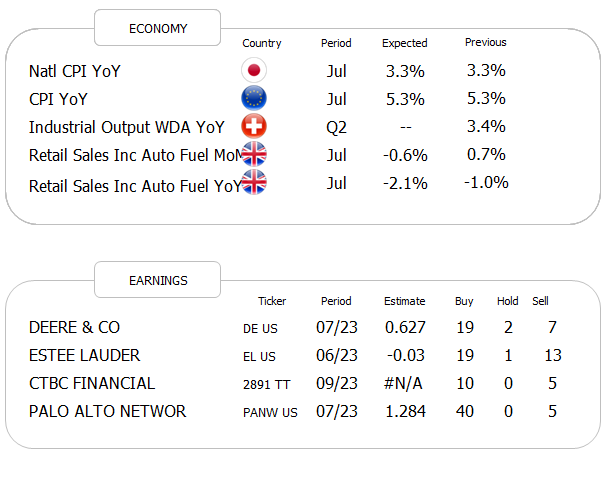
AGENDA
CROSS-ASSET DELIBERATIONS
No, today’s title is not a complex math formula; that stuff is far above my paygrade (hhmmmm, like many other things too). For complex math, you need guys like him:
Anyway, we will resolve this ‘formula’ in today’s letter and generally try to keep it short and light, as it is TGIF!
The good old Quotedian, now powered by NPB Neue Privat Bank AG
Need help in a complex investment world?
Contact us at info@npb-bank.ch
This starts feeling a bit like groundhog day
or as Yogi Berra would have said:
“It's like déjà vu all over again.”
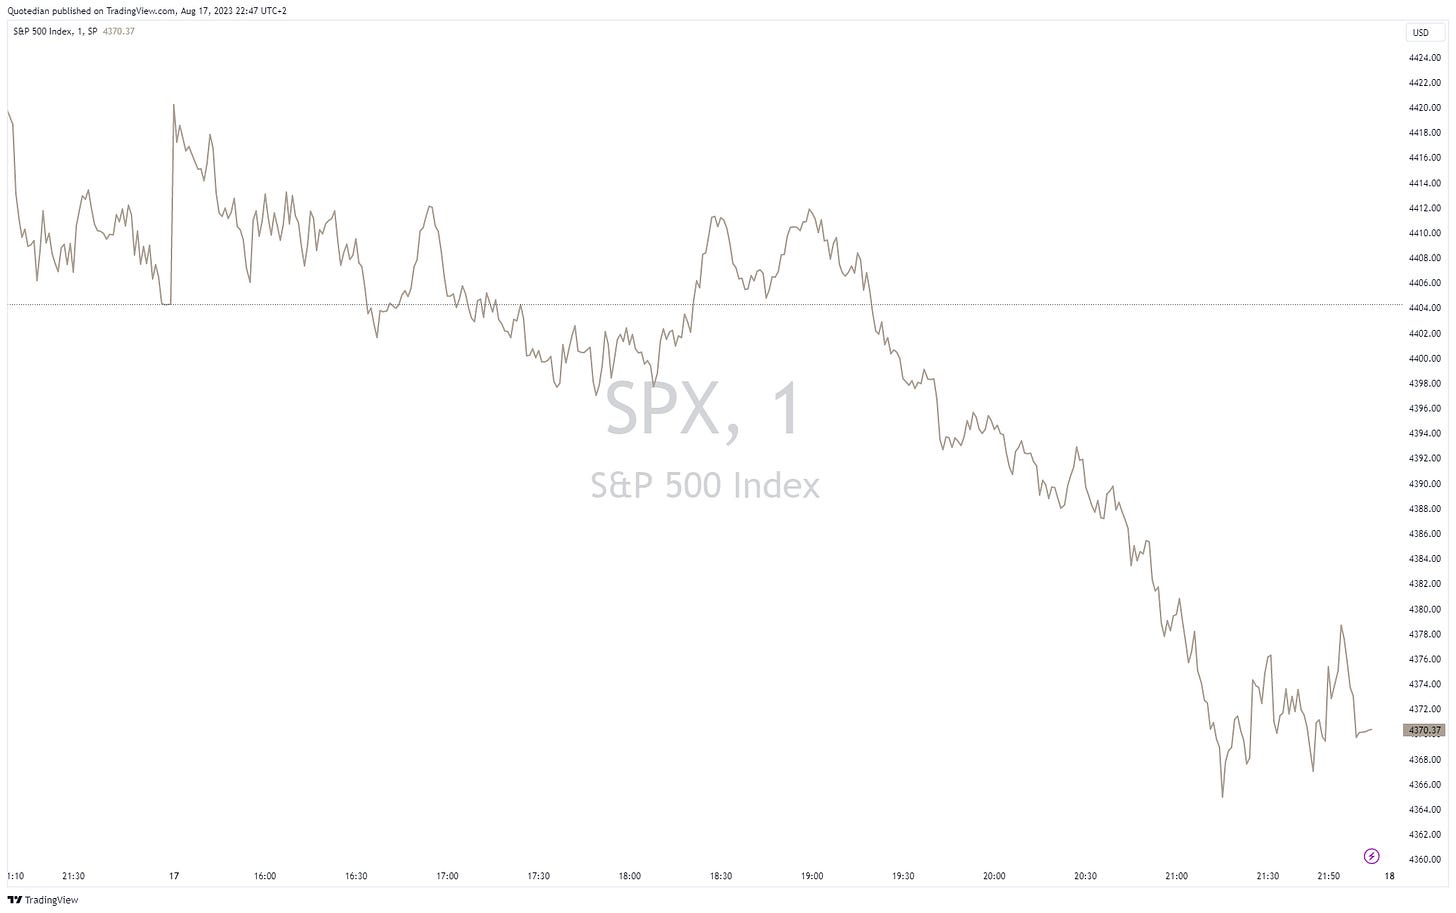
US equities held their ground more or less until the European market close, at which point they started heading south with acceleration towards the end of the session. And no, I did not copy/paste the preceding text from yesterday’s or even Tuesday’s Quotedian . Here’s the intraday chart of the S&P 500:
One important thing to keep in mind is that for the overall trend picture, selling in the later half of the session is seldom a positive sign. This as is it widely assumed that the hot-headed, emotional non-pros set their orders at the beginning of the session, whilst institutional investors tend to place the orders in the second half of the trading session.
And there’s even an index to measure that!
The Smart Money Flow index is calculated according to a proprietary formula by taking the action of the Dow in two time periods: shortly after the opening and within the last hour. The first minutes represent emotional buying, driven by greed and fear of the crowd based on good and bad news. Smart money waits until the end and they very often test the market before by shorting heavily just to see how the market reacts. Then they move in the big way. These heavy hitters also have the best possible information available to them and they do have the edge on all the other market participants.
See what happened recently:
Whilst the Dow Jones was still ticking happily higher, the Smart MF index started signaling during the entire latter half of July that a trend change may be coming! I know, powerful stuff ;-)
So, we continue to go lower from here? Perhaps.
However, for now an at least rebound could be on the books, as indicated by a pretty oversold McClellan Oscillator:
But back to a couple of things about yesterday’s session … Breadth was again weak, but to give it a positive spin, the least weak of the past three sessions were stocks ‘tanked’.
As in the previous session, only one sector closed up on the day, but this time it was not utility but rather energy stocks:
This is what the heatmap looked like for the S&P 500:
And by the way, this is what it looked like for the EuroSTOXX 50:
Asian markets continue to feel some heat this Friday morning, with Hong Kong’s Hang Seng index at 1.3% down most. The ‘best’ performing market is Australia’s ASX, up 0.03% as I type.
Turning to fixed income markets, which together with FX markets have been the real deal over the past two or three weeks.
Here one not-so-small detail could be important and short-term bullish (giving more validity to the potential McClellan buy-signal discussed above) for stocks. US yields, measured by the Tens in the graph below, reached a new multi-decade high at 4.33% yesterday, but then reverted on a pin’s head and dropped 10bp until now, whilst stocks continued to fall…
Anyway…
Bonds have many risk, but I think everybody would agree that the two most important ones are interest rate risk and credit risk. That’s why we usually look at the charts of yields and credit spreads in this section.
However, I understand that to some newer investors, this may all seem a bit over the head, so today, let’s look at two ETFs, which represent the two discussed risks.
The first is the iShares 20+ Year Treasury Bond ETF, better known as the TLT, and it largely represents (US) interest rate movements, expressed in price:
As yields have risen as per late, this ETF saw its price drop, but has now arrived at an area of possible (short-term?) support.
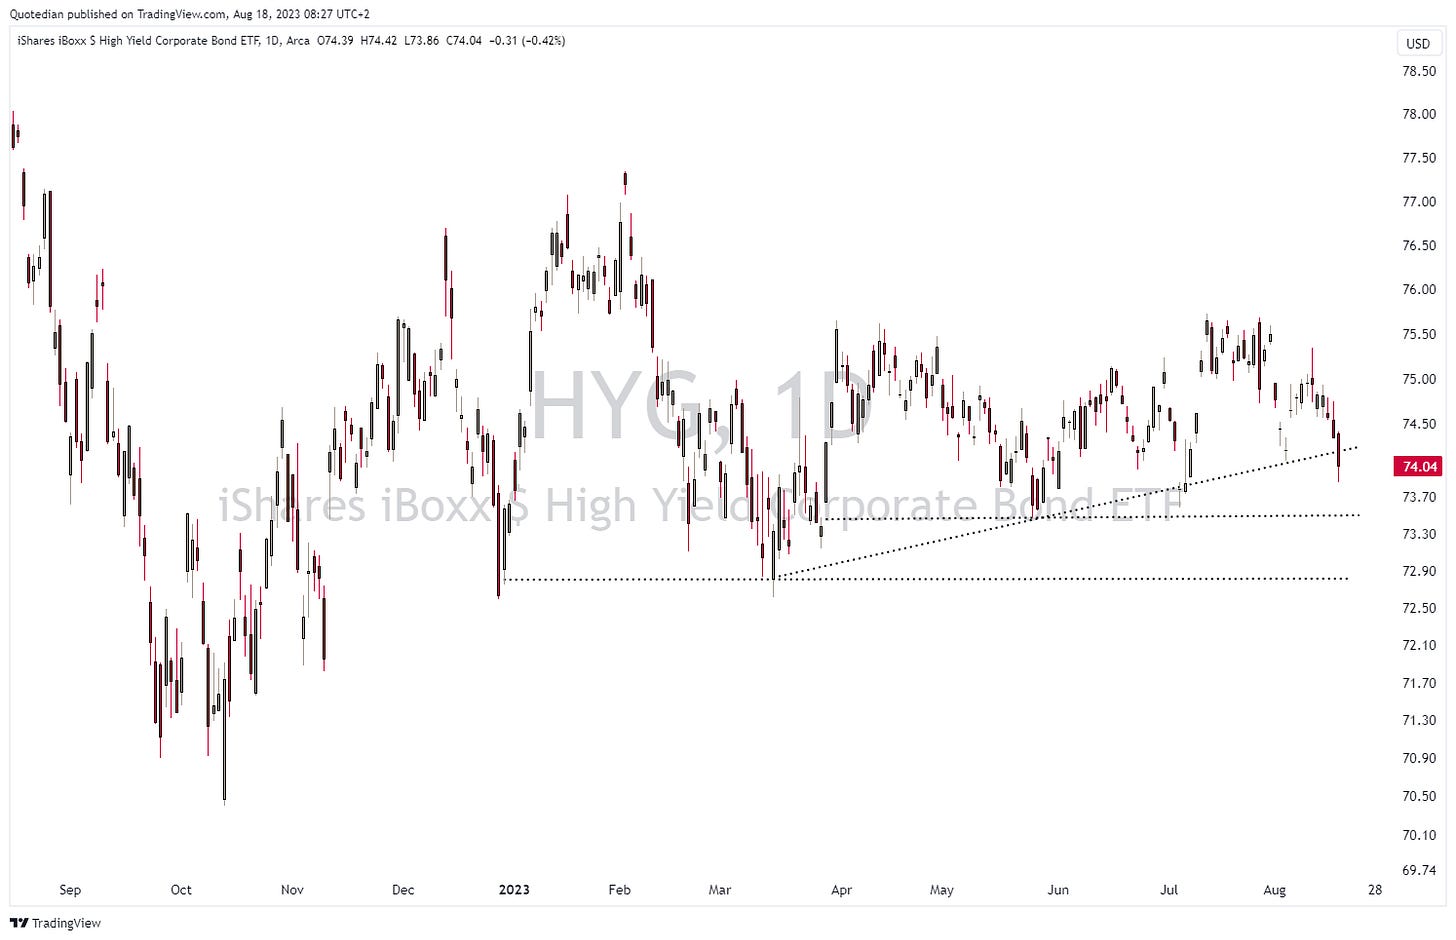
The other ETF under discussion, and representing credit risk, is the iShares iBoxx High Yield Corporate Bond ETF, aka HYG:
Despite yesterday’s sell-off represented via the last candle on the chart above, high yield bonds (credit spreads) have held up pretty decently actually and plenty of support levels seem to be in vicinity.
Which brings us to our first title-riddle resolution. The Japanese YEN as been in ADios mode for a while now. After all, a 14% rise in the USD/JPY since the beginning of the year translates into an annualized 26% - massive!
However, that reversal in the last two candles on the chart above fit well with the potential reversal in rates and stocks as discussed above. Definitely “stay tuned” on this one ….
Favourite ways to play a Yen rebound would be either long JPY/CHF (that’s long the least expensive versus the most expensive currency),
or, short GBP/JPY, which could be another cool tactical play:
In other FX news, China is getting more aggressive on supporting the Yuan, via fixings and direct market interventions. Here’s the Dollar to Renmimbi rate, inverted for better illustration:
In the commodity space, Gold seemingly can’t find a footing, ticking lower session by session,
however, maybe the recent small downtick (uptick in reverted chart below), will finally prepare some support:
Ok, that’s all folks! Make sure:
To tune in again next week when I intend to introduce a new exciting section
To enjoy your weekend, which I promise you, will be much too short.
Take care,
André
CHART OF THE DAY
And finally, here’s the second resolve to today’s title. AD[ios]YEN, a Dutch company that offers a platform that enable merchants and businesses to process payments online, mobile, and point-of-sale systems, disappointed with their earnings yesterday and gave the old Wall Street adage “never catch a falling knife” a whole new dimension:
And the 39% share price drop is probably not even the most astonishing fact, but rather that this translates into 1-day EUR20 billion market cap wipeout!
The company had a P/E of 82 on Wednesday and ended Tuesday with a P/E of 49x “only”. The question arises:
“Have interest rates now maybe risen enough to bring an end to these ridiculous valuations we have been witnessing over the past three years or so?”
Stay tuned …
Thanks for reading The Quotedian! Subscribe for free to receive new posts the moment they are published.
DISCLAIMER
Everything in this document is for educational purposes only (FEPO)
Nothing in this document should be considered investment advice
The views expressed in this document may differ from the views published by Neue Private Bank AG
Past performance is hopefully no indication of future performance


