

Astonishing
The Quotedian - Vol VI, Issue 47 | Powered by NPB Neue Privat Bank AG


“Get your facts first, then you can distort them as you please.”
— Mark Twain
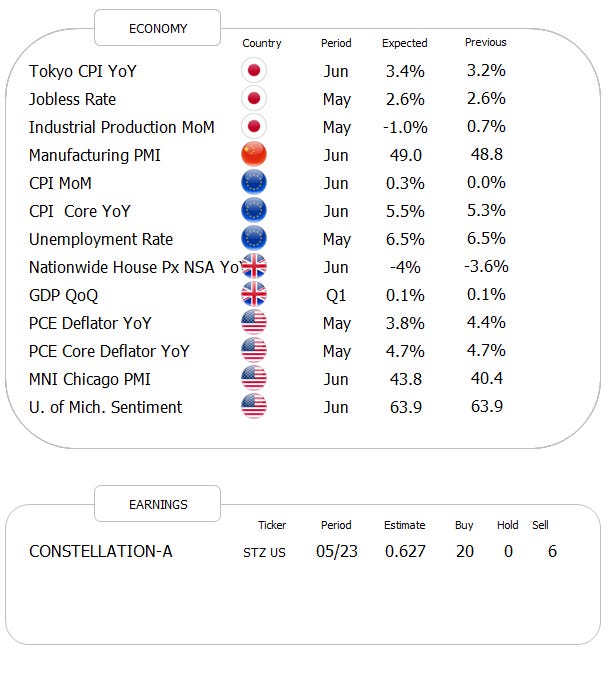
DASHBOARD

AGENDA
CROSS-ASSET DELIBERATIONS
The 10- minus 2-year Treasury Bond spread, as discussed many times in this space over the past months, inverted nearly a year ago, making a recession a “done deal”:
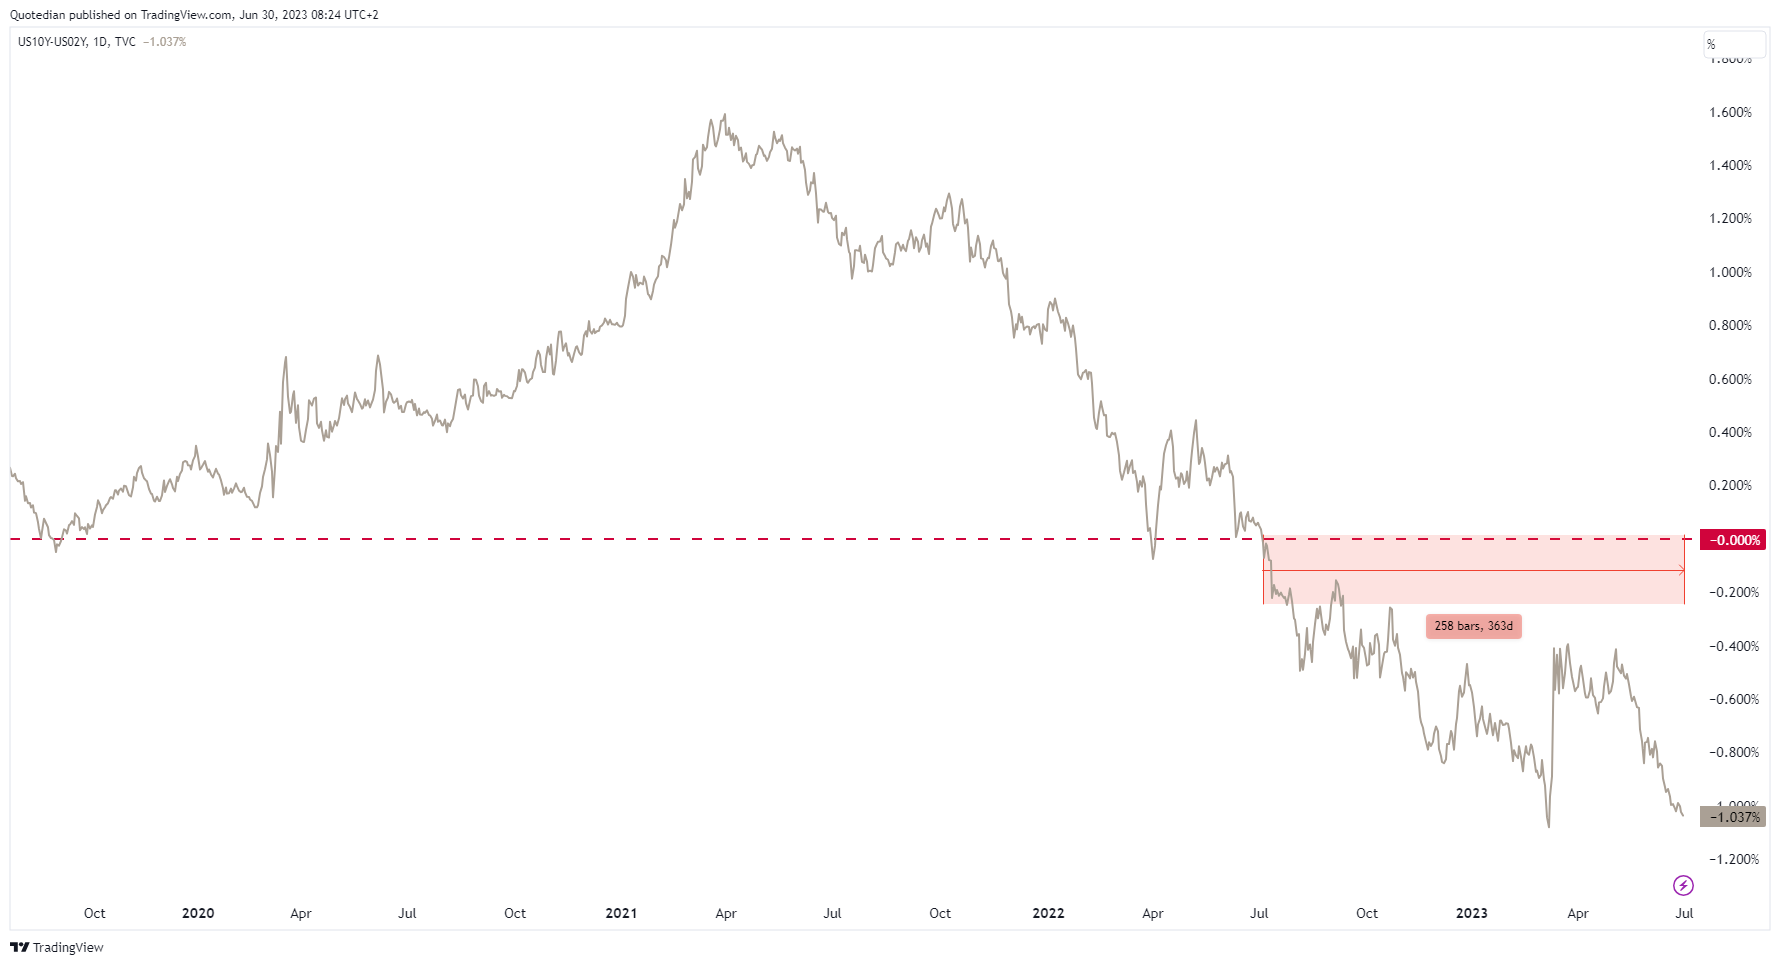
No?
Well, if so, how the heck are we going to explain this US data released yesterday:


Hence, all we can say:
T.G.I.F.
The good old Quotedian, now powered by NPB Neue Privat Bank AG

Contact us at info@npb-bank.ch
Yesterday’s session, the second last of the first half year of 2023, saw mostly decent gains for major US equity indices, with large cap stocks (S&P 500) up half a percentage point and small cap stocks (Russell 2000) ripping nearly one and a half percent higher.
The only exception to this rally was the Nasdaq 100, down some 25 points (-0.16%), which is hardly something to be ashamed of, given that 2-year yields ripped 15 basis points higher on the back of the fore-mentioned stronger-than-expected economic data.
But let’s take it in pieces.
Stocks sputtered at first (black box) on the back of the economic data, but eventually shrugged all fears of higher yields off, and started budging higher the rest of the session:

Indeed, it seems true that stocks are not so worried about the absolute level of interest rates, but rather about the rate-of-change of those (nice phrase, but maybe it turns out to be one for the gallery titled “famous last words”…)
The following chart of the Nasdaq 100 (mini futures) how long-duration stocks had a bit larger (economic data) bone to chew on

This then of course is also reflected in sector performance:

Breadth was excellent, with nearly 80% of stocks in the S&P 500 moving higher. And the heat map shows that gains would have been ever greater, would the index not have been held back by some of the large caps:

Of course, as I said earlier this weak, market-cap weighting an index works both ways …
Asian markets showed overall some less enthusiasm on the last day of June, with gains and losses both contained.
As discussed above, bond yields had nowhere to go but higher given the surprising strength of the GDP data. Here’s the intraday chart of the US 2-year yield,

and here the daily chart of 10-year yields:

It’s getting interesting on this chart would be the understatement of the year, as zooming out shows that a break-out higher, from a TA point of view, would have huge upside implactions on yields:

Technical analysis would dictate a minimum 4.90% yield target upon a breakout…
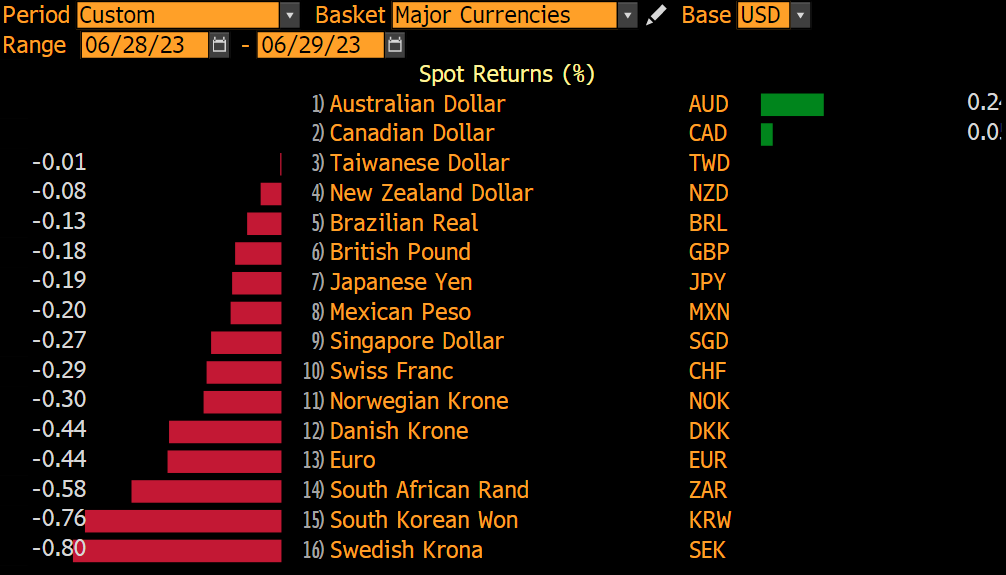
In currency markets, one of the main gainers yesterday was of course the Greenback, given the eco data readings, coupled with Powell’s comments in Madrid of at least two more rate hikes until year end:
This has brought the EUR/USD cross-rate a notch closer to the neckline of the shoulder-head-shoulder pattern we have been observing for a few weeks now:

And finally, in the commodity complex, oil found a bit of a footing over the past two sesssions, but still trades dangerously close to key support levels:

Gold on the other hand is slipping further into oblivion (admittedly a bit a dramatic word):

Quite to the contrary, which earlier today tried (so far unsuccessfully) another upside breakout:

Ok, time to hit the send button.
Keep in mind that it may be quiet over the coming days, with the US heading into a lengthy 4th July weekend.
But more importantly, monitor your inbox on Sunday/Monday for the month-, quarter, and half-year end edition of The Quotedian, where we will share tons of insightful stats and charts.
Stay tuned …
André
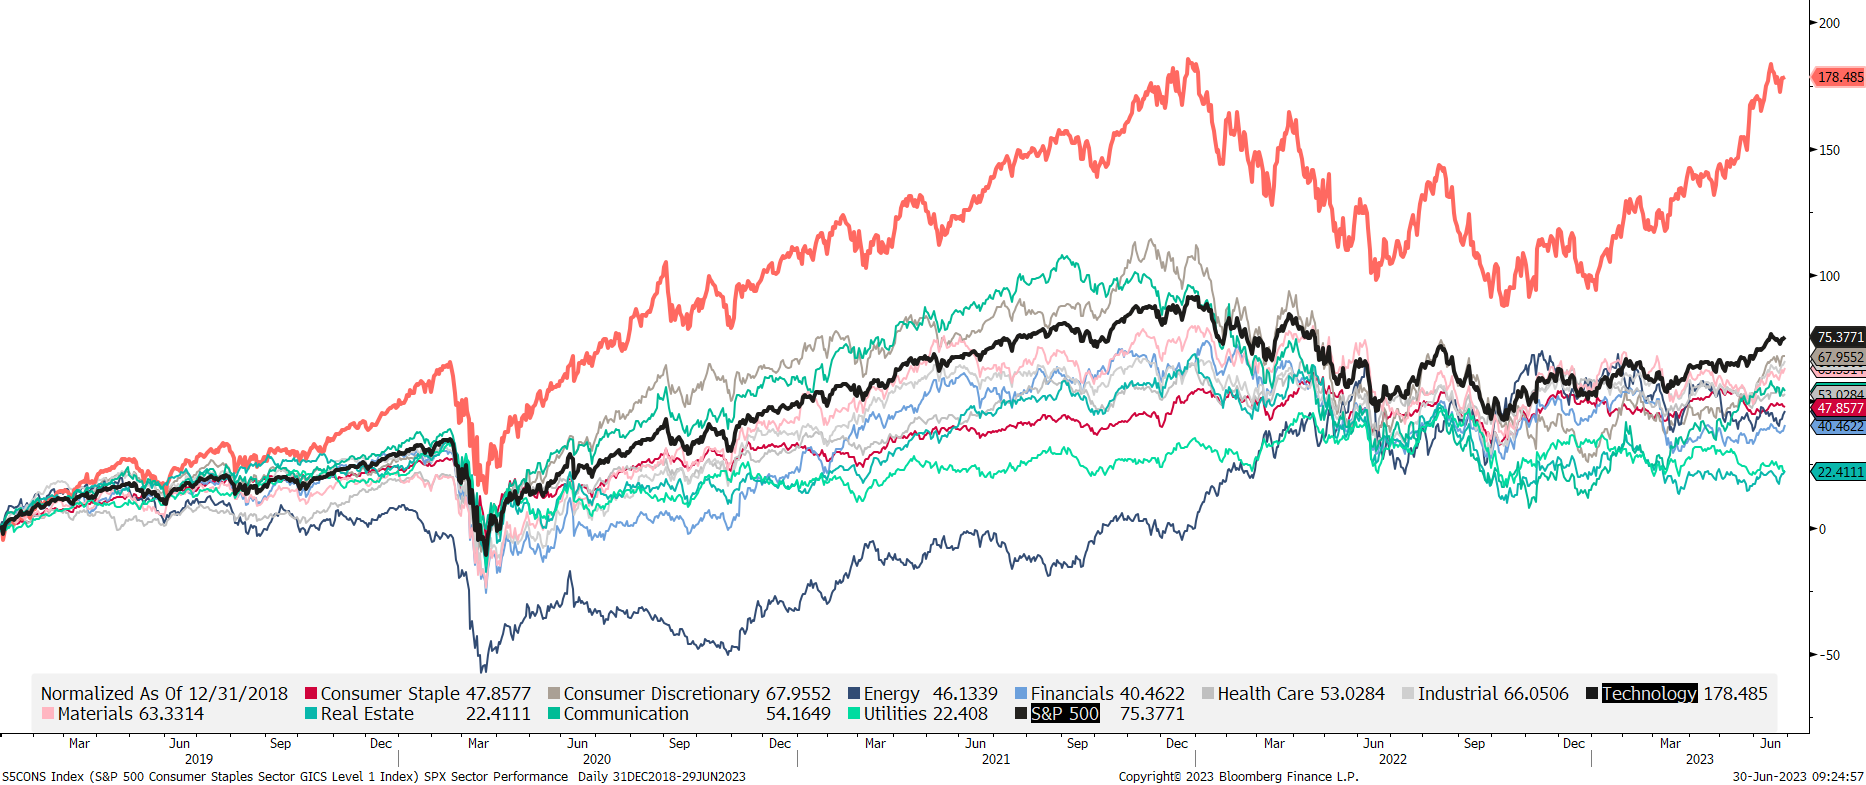
CHART OF THE DAY
One sector to rule them all … the performance of tech stocks has been absolutely astonishing over the past 4 1/2 years, especially keeping in mind that this period includes a 500 basis point rate hike cycle by the US Federal Reserve Bank.
And the other astonishing part on this chart is that no other sector actually beat the S&P 500.
Thanks for reading The Quotedian! Subscribe for free to receive new posts the moment they are published.
DISCLAIMER
Everything in this document is for educational purposes only (FEPO)
Nothing in this document should be considered investment advice
The views expressed in this document may differ from the views published by Neue Private Bank AG
Past performance is hopefully no indication of future performance