


"Bear markets have two components: Price and Time. Price takes your money. Time takes your patience."
— Walter Deemer
DASHBOARD
AGENDA

CROSS-ASSET DELIBERATIONS
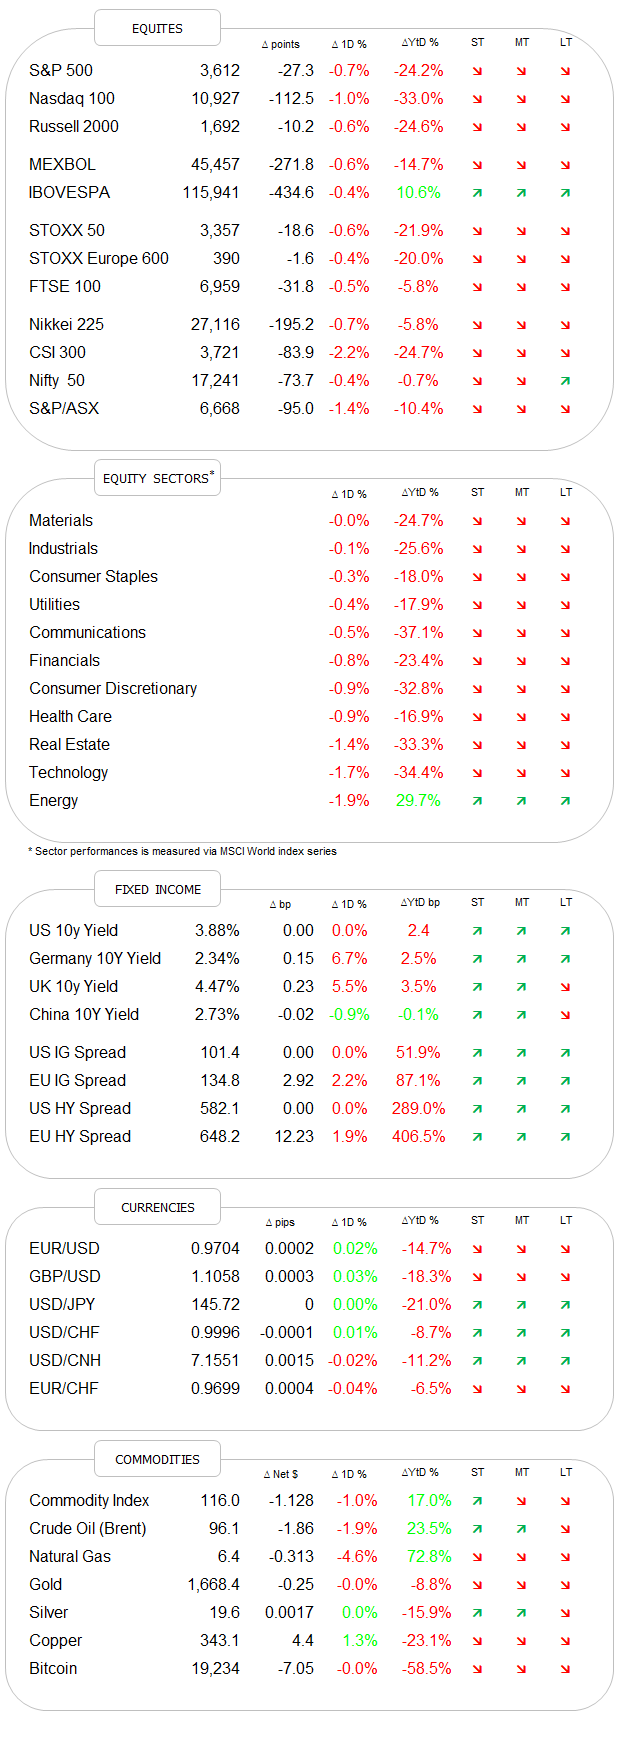
Let’s dive right in, starting with equities, where Friday’s sell-off and yesterday’s continuation thereof are … well … awkward. What started with a 5%-plus rally at the beginning of last week, started to fizzle out on Wednesday and Thursday and turned into an outright selling spree by Friday. After some more follow-through selling yesterday, the chart for recently newly found short-term equity bulls (count me in), looks awkward:

Awkward as the bulls are collectively clutching to the very last straw and we need to use a really thick crayon to draw that line and still have it valid as support.
Mind you, ex-yesterday, last week was still a good week for stocks on an international level,

but technically it feels like we are at the edge of an abyss (and tomorrow we advanced one step - ha ha …). Our more secular inverse traffic light is about to turn full red:
In conclusion, my scenario of a relieve-rally over the next few weeks to months into the year-end, with the secular downtrend resuming again next year, is under clear and present danger. As I keep on repeating:
Nothing ever good happens below the 200-day moving average.
We will have a look at some of the possible stops on the way down in tomorrow’s Quotedian.
What stood out during last week’s truncated rally was the double-digit rally by Energy stocks, as the price of oil recovered on the back of OPEC+ output cuts:

Energy stocks are a good example of how much attention we should pay to relative strength trends once they set in, especially if the asset class/equity group/investment pocket under review remains unloved AND underinvested after a two-year rally:

Yesterday’s session was surprisingly volatile and active given the celebration of a public holiday in the US, with the stock market open but the bond market closed. However, volumes were the lowest of the past few weeks and breadth was not as bad as the index drop may indicate. Four out of eleven sectors were higher on the day and the advancing to declining stock ratio was 2:3, leaving us with the following market carpet (S&P):

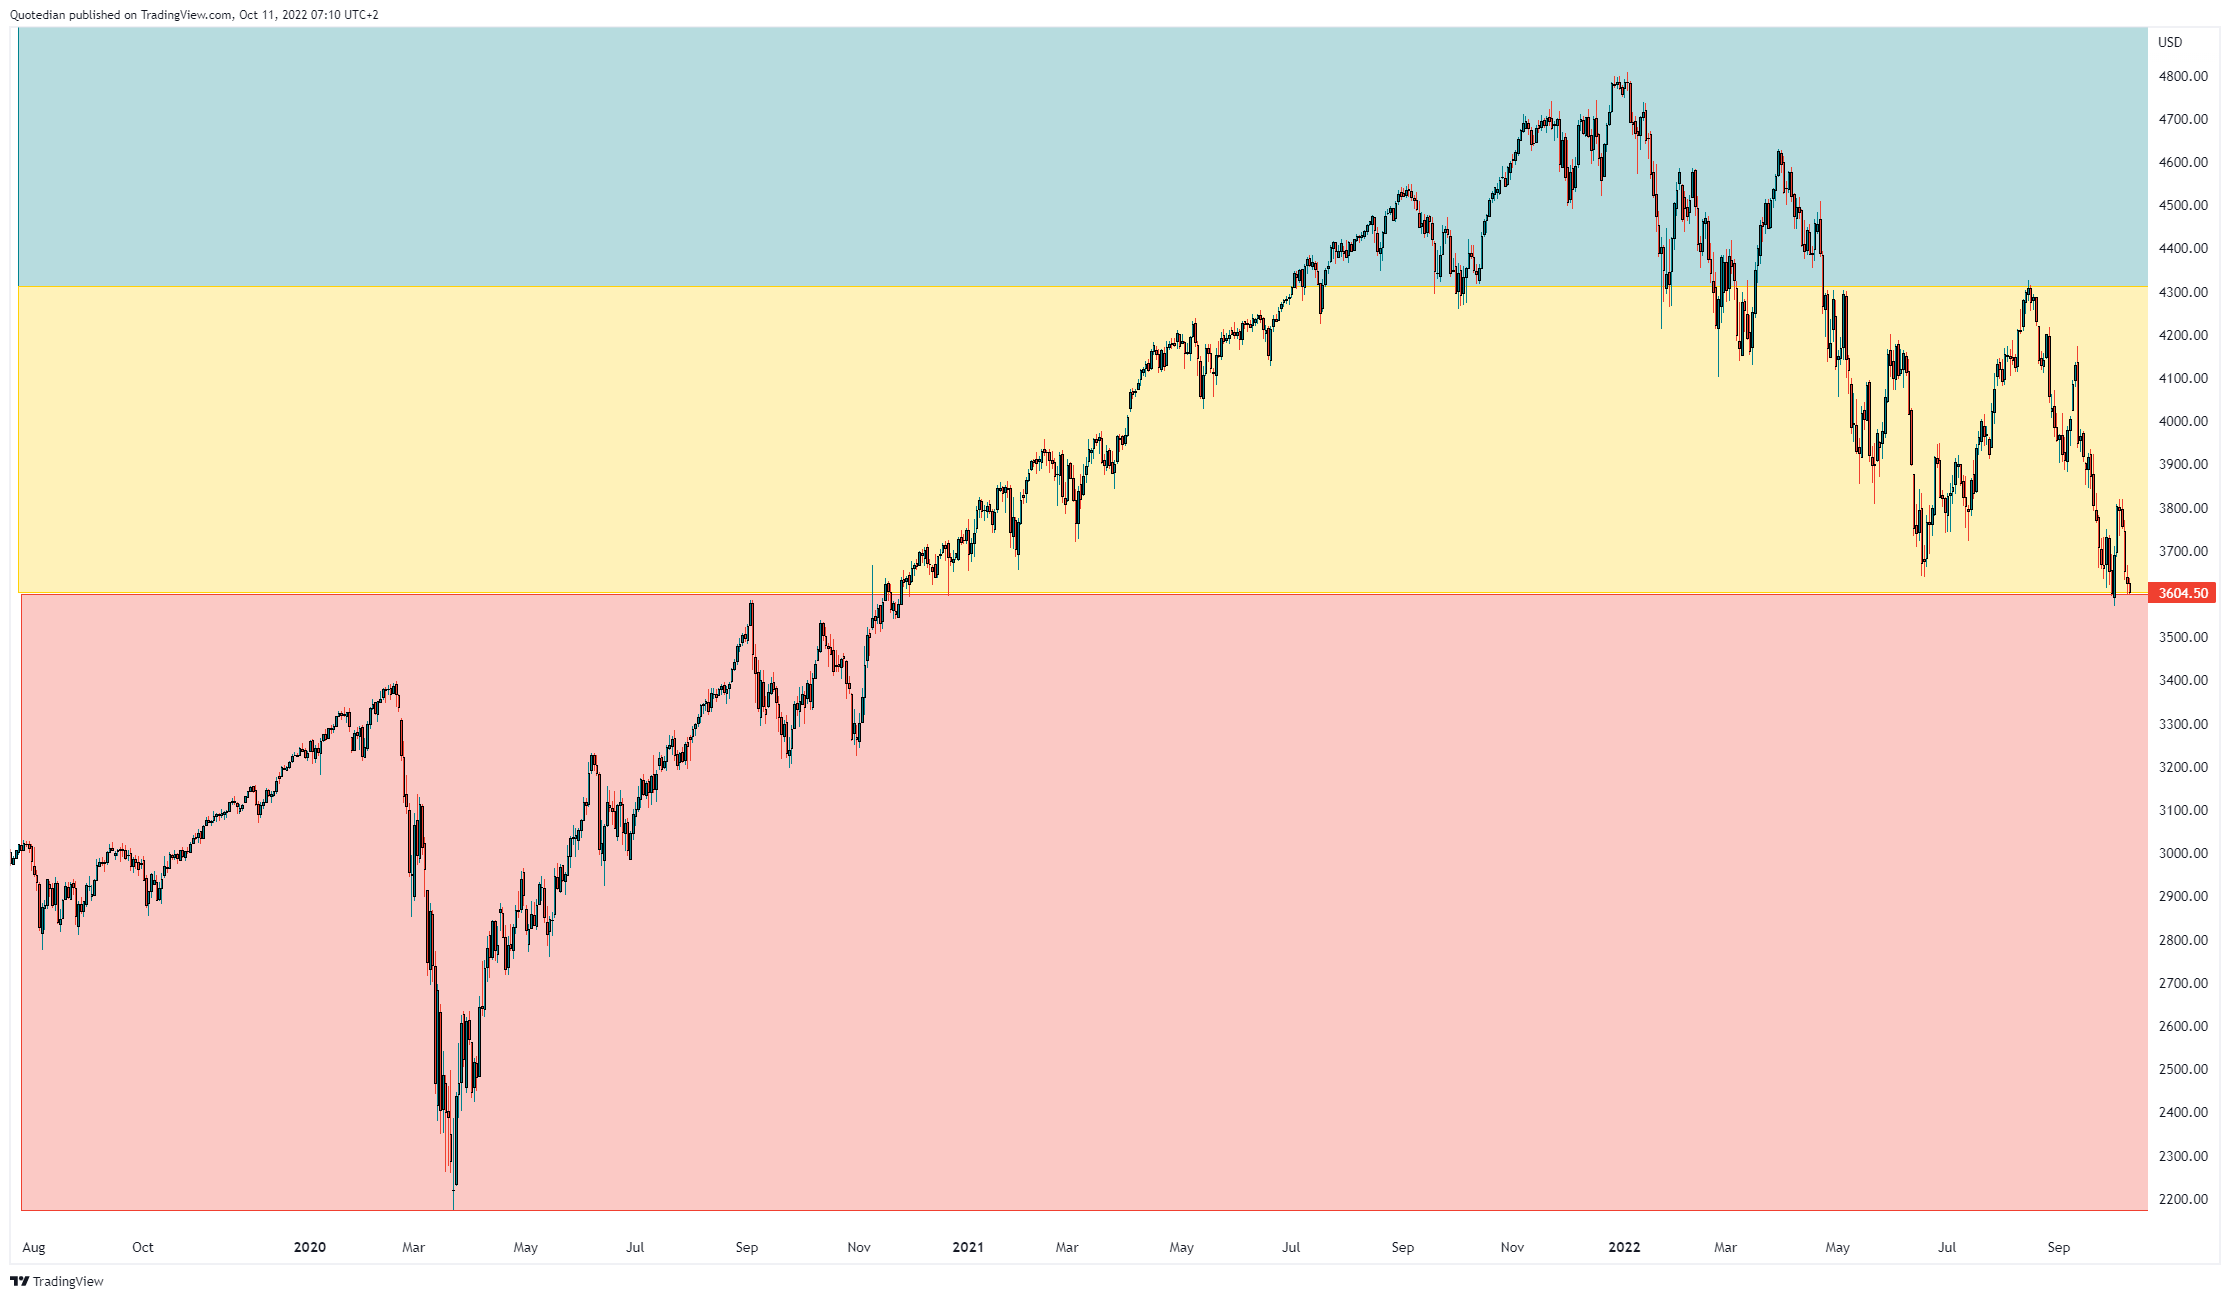
One chart the few remaining equity bulls prefer not to look at (close your eyes now if you are faint at heart) is the one of the SOX, the Philadelphia Semiconductor index:
Often considered a leading indicator, … I’ll just shut up and leave as stands ...
The Asian equity session this early Tuesday is also no pleasant picture to look at, with the Nikkei and the Hang Seng for example down in excess of two percent, and the semiconductor-heavy (see the connection to above) Taiex in Taiwan down over four percent.
Turning to fixed income, the chart currently making the rounds is the one of TLT (iShares 20+ Year Treasury Bond ETF), breaking through the 2014 lows:

This of course as yields are pushing higher, with the 10-year US version scratching at the 4%-mark:

In the UK, it seems that the short-term pressure relief from the BoE intervention is already largely over again. Here’s the 30-year Gilt yield:

There’s much more to say and look at, but working under some time constraint today, let’s turn to currency markets.
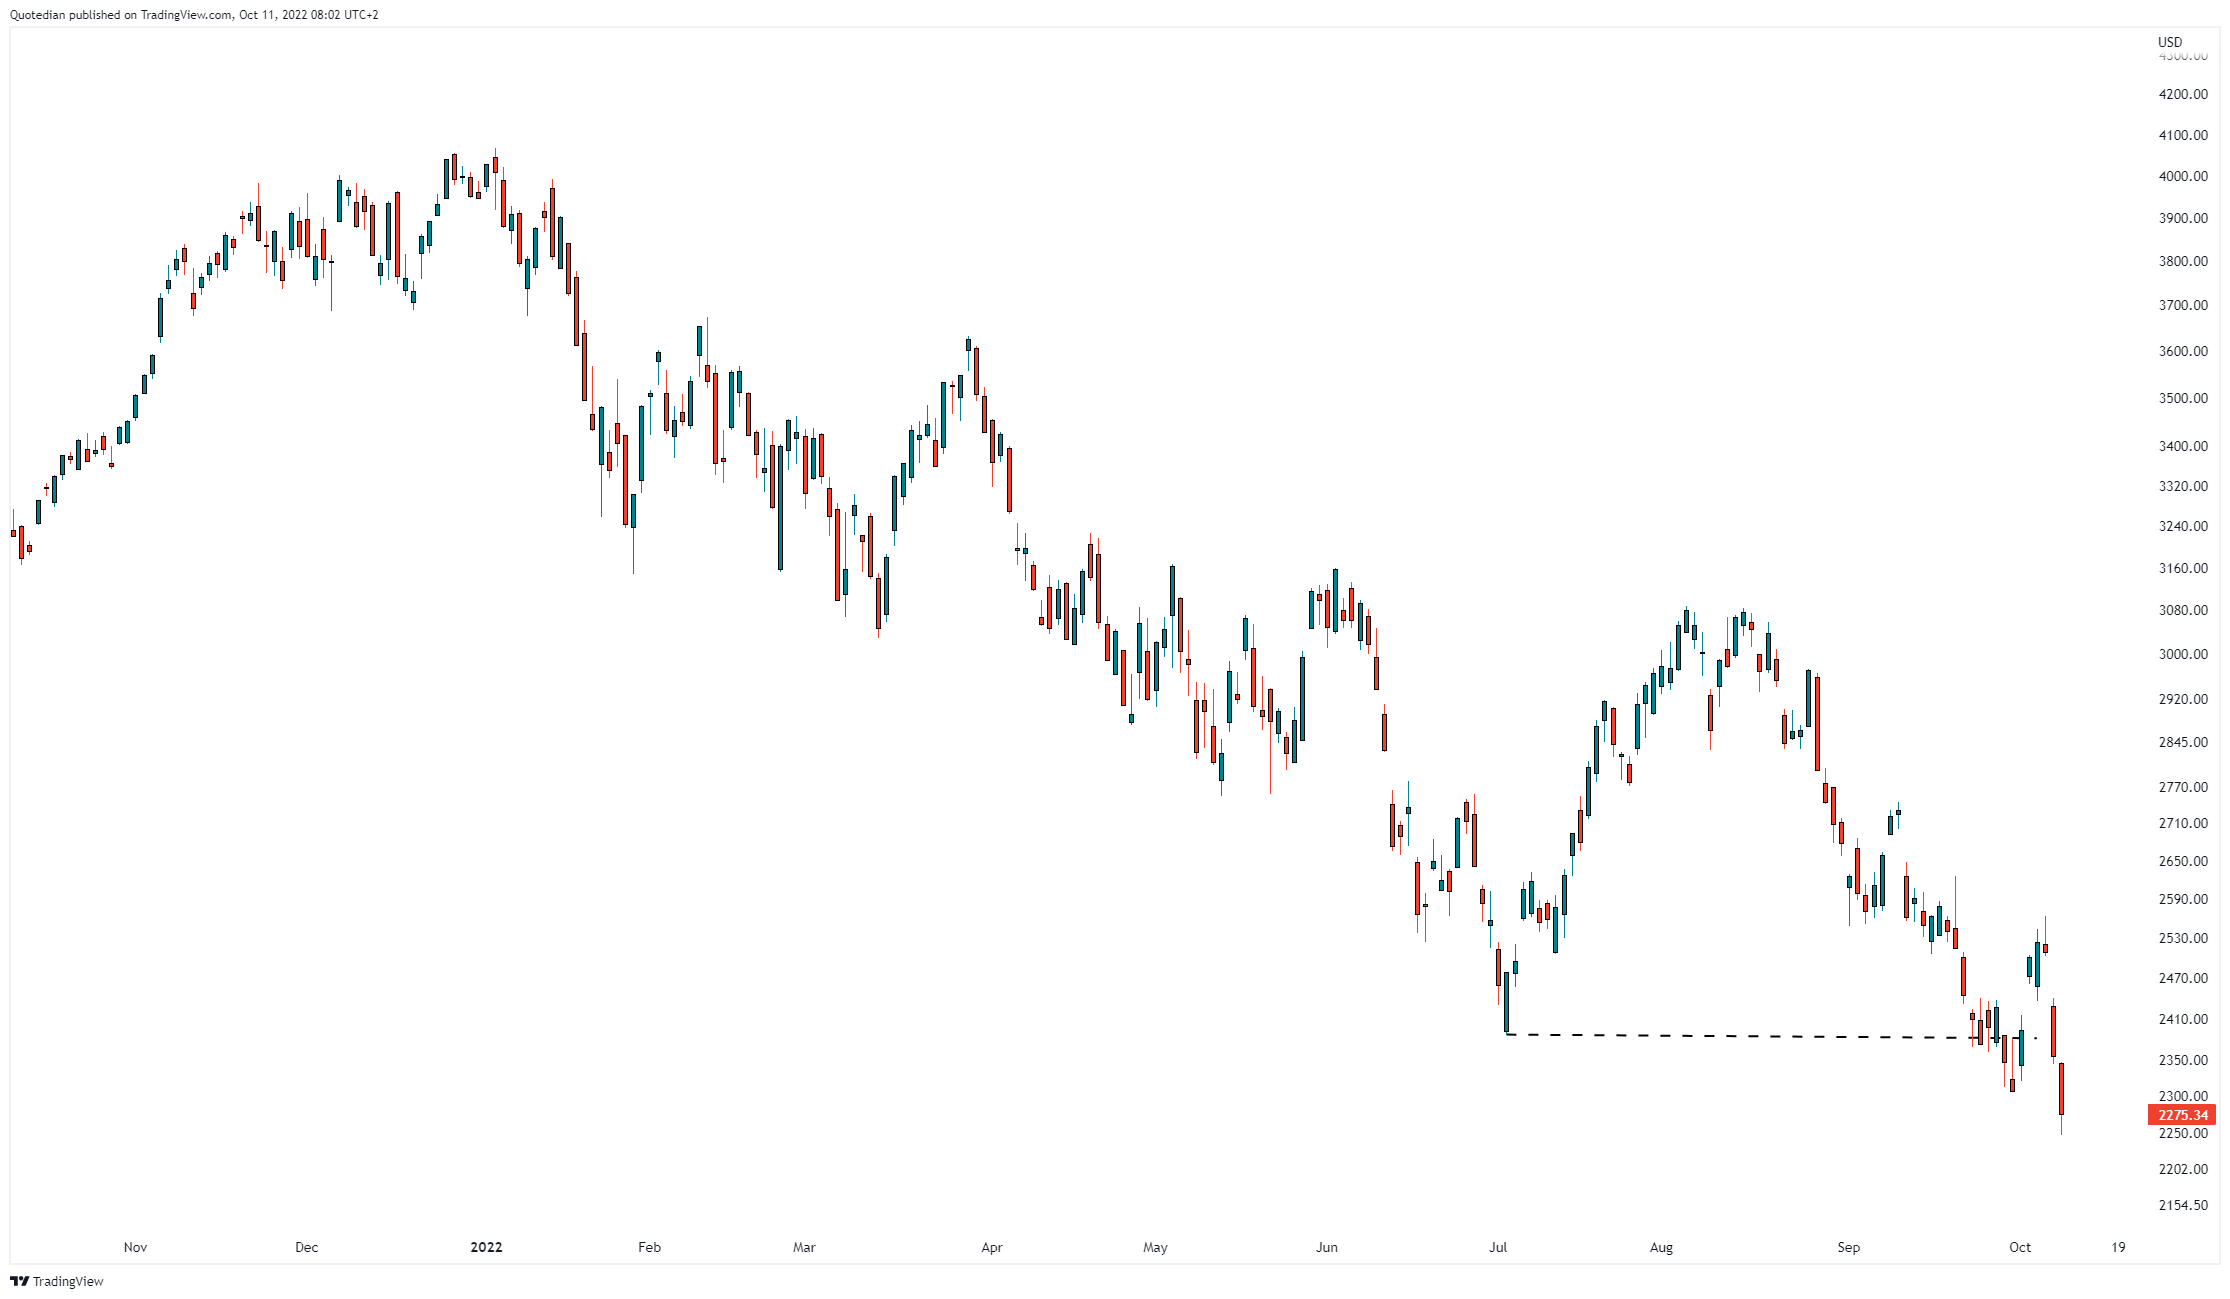
We have spoken several times about the contrarian magazine front-page indicator and how on many occasions an extremely bullish or bearish cover has lead to a move into the opposite direction. The “Mighty Dollar” Economist front page in December 2016 is an all-time favourite:

About a week ago I highlighted a similar bullish dollar front page by Bloomberg’s Businessweek, which marked a short-term top. However, the Dollar started recovering again last week, so maybe a second front page (see chart below), this time from the weekly Barron’s magazine will be helpful.
Unfortunately it is already time to hit the send button - back tomorrow with more!
André
CHART OF THE DAY
It’s a relative (strength) world, or, there’s always a bull market somewhere. EM FX has been such a pocket of strength:

Thanks for reading The Quotedian! Subscribe for free to receive new posts and support my work.
DISCLAIMER
Everything in this document is for educational purposes only (FEPO)
Nothing in this document should be considered investment advice
Past performance is hopefully no indication of future performance