


“Interest rates are to asset prices, sort of like gravity is to the apple.”
— Warren Buffett

Stop complaining - Interest rates are just about getting back to their old normal
Equities seem to be in short-term topping process and suggest lower before higher, which fits well the usual mid-term election pattern
Energy stocks continue to crush it, whilst utilities suffer together with bonds
Bonds investors are getting hurt and we may not be at the end yet
Be mindful of the happenings in France
Commodities should continue to thrive in a multipolar world.

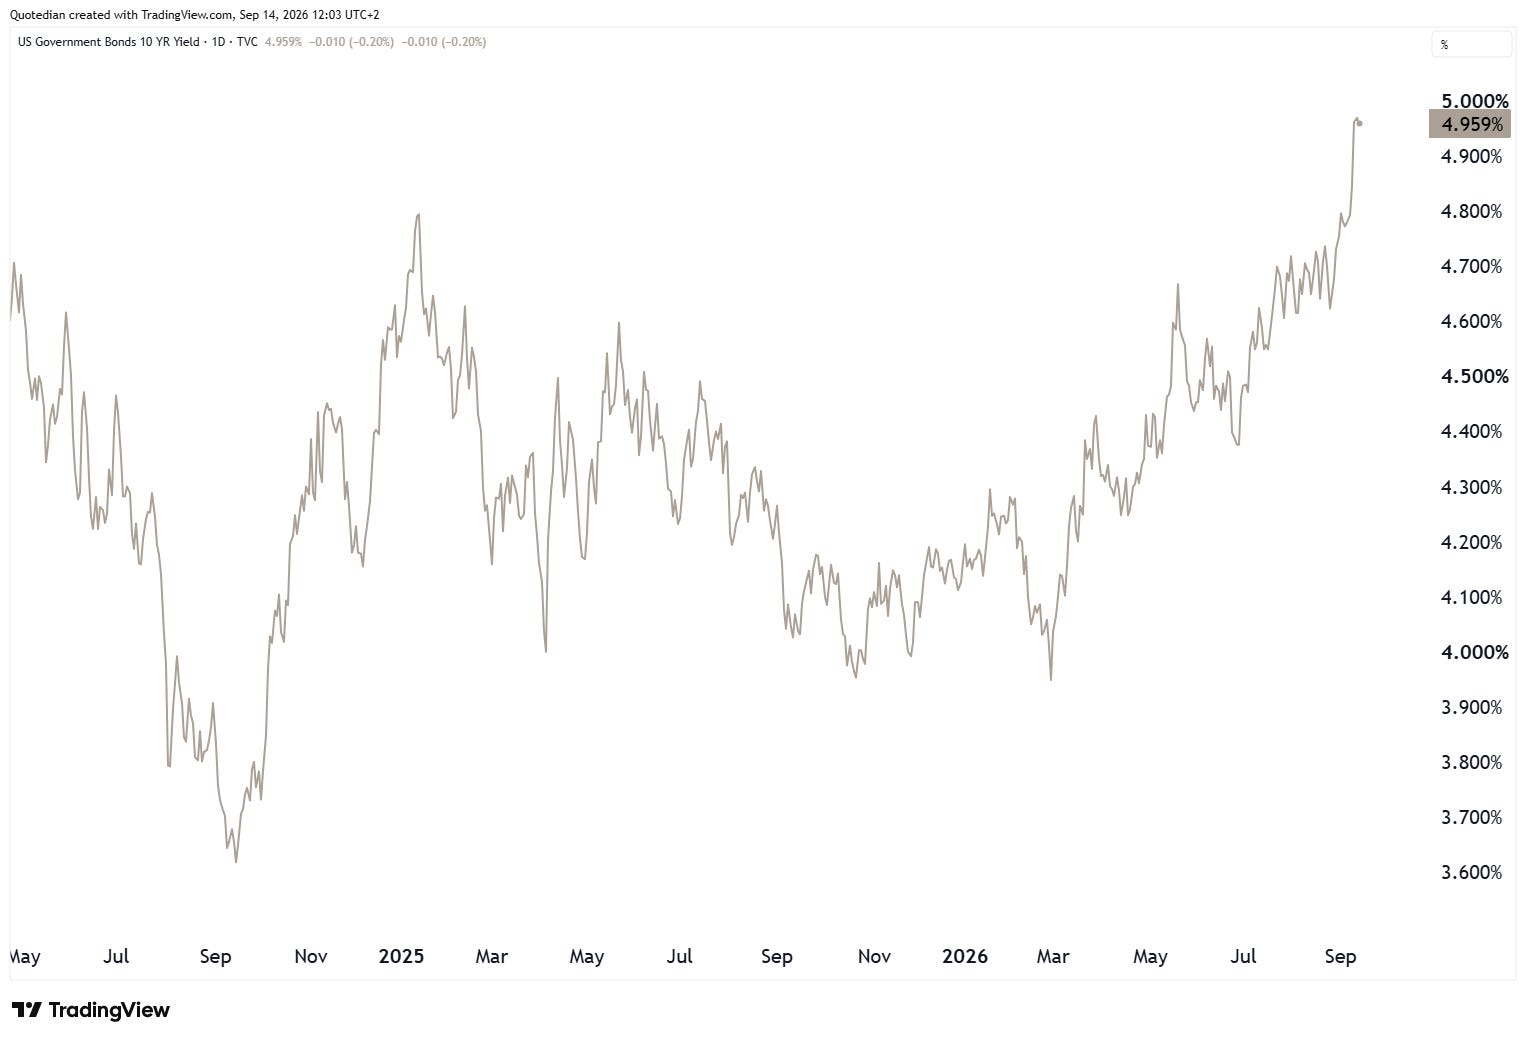
4.992%!!
That was the print high of the 10-year US Treasury yield last Friday.
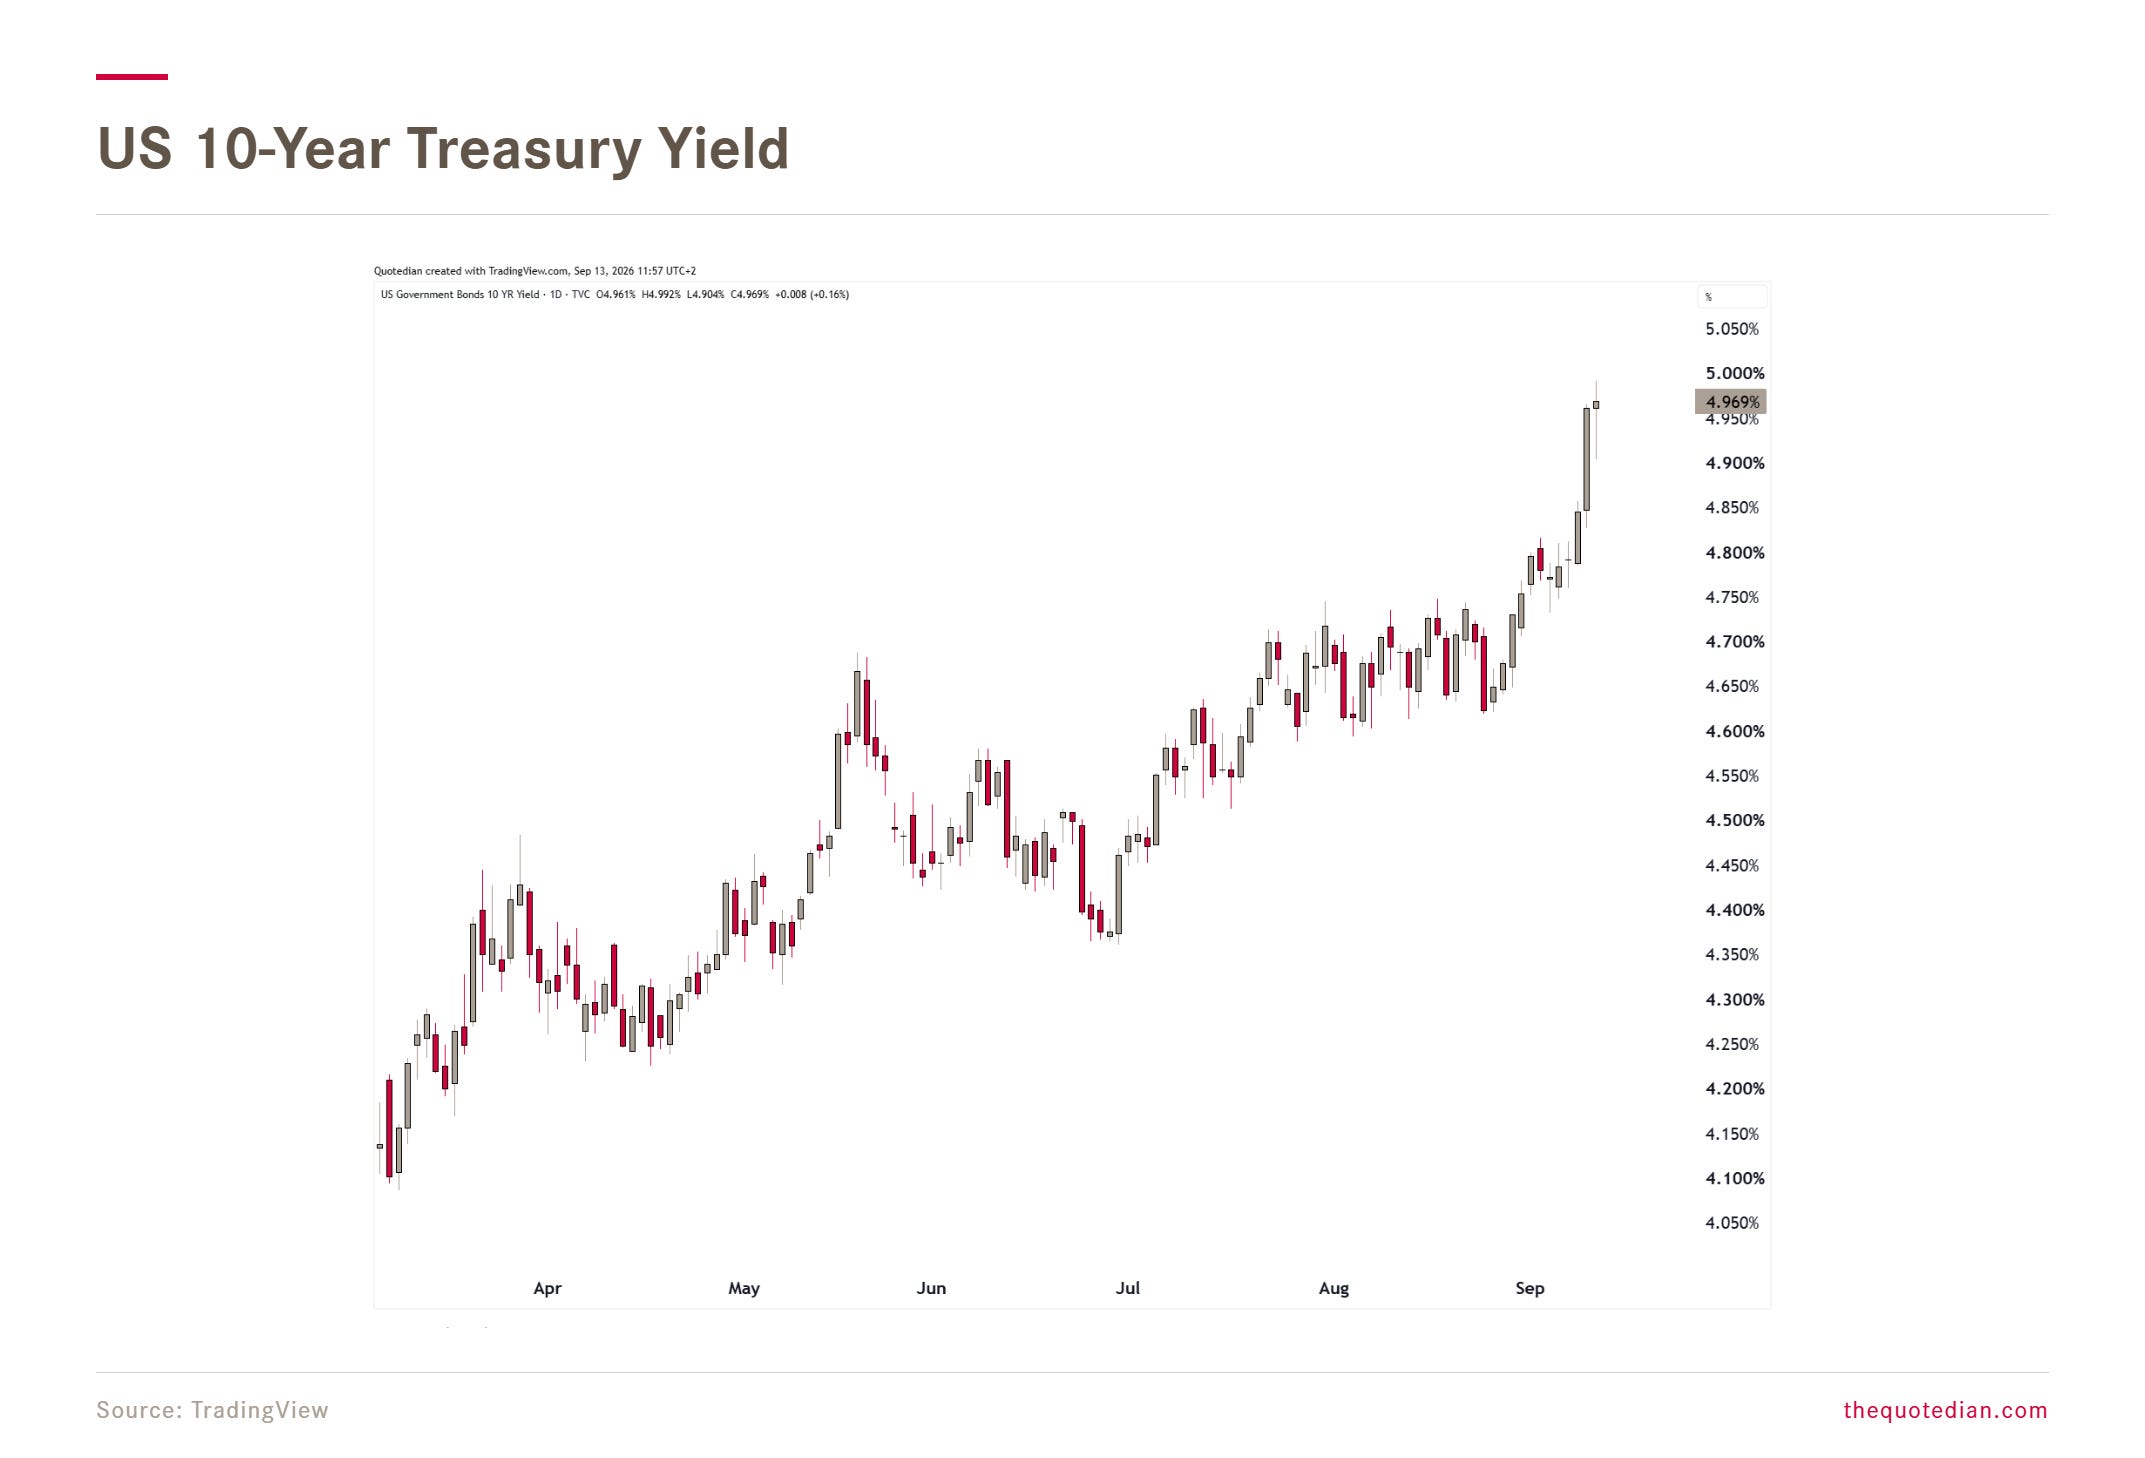
That’s the highest intraday reading since October 2023, when the UST briefly traded above 5% (but closed much lower on the day):
However, on a weekly closing basis, we just witnessed the highest close since … drumroll … 2007!
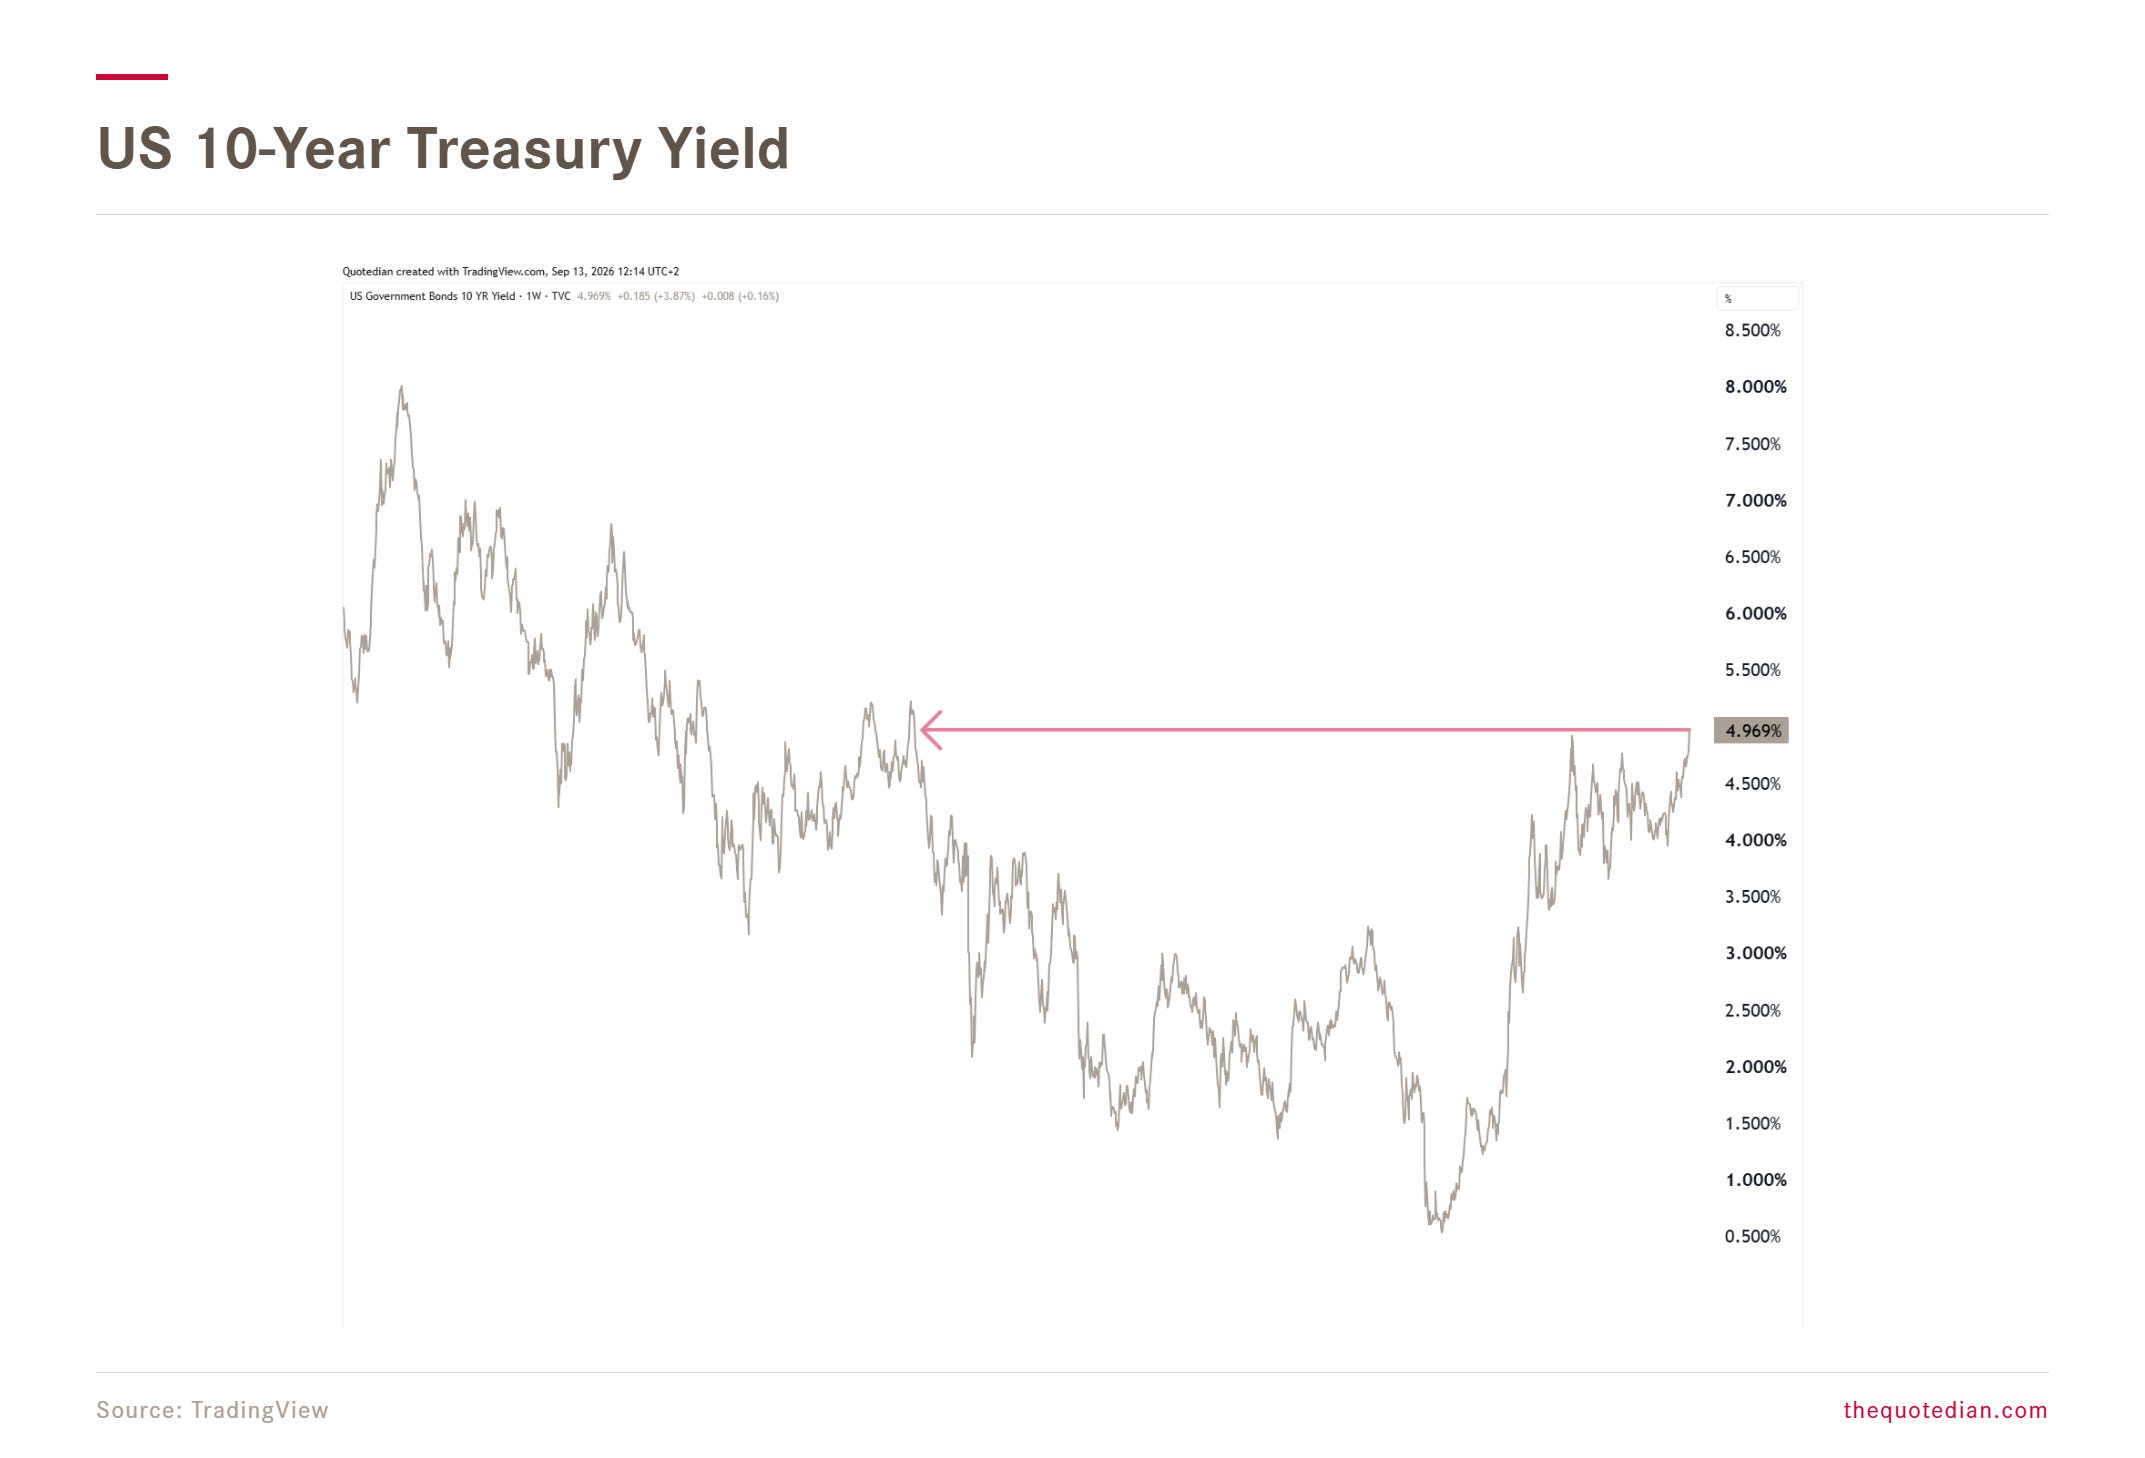
That was when many of you, dear readers, were still _____________ (fill in your activity at the time).
It was also at the onset of the GFC, which in turn, led to a period of extreme (easy) central bank policies, pushing US the 10-year Yield to 0.50% (!) during crisis (e.g. European Sovereign Debt Crisis) after Crisis (e.g. COVID-Crisis).
So, with yields at 5% again, are we then in for a new GFC?
No.
Or, probably not.
Are we in for a short-term (equity) market correction?
Probably yes.
But the point of all this is that we are actually returning to the “new normal”. Point in case: If we consider the post-WW2 area as ‘modern time’,

then the average yield over the past 80 years was … another drumroll … 5.19%!!
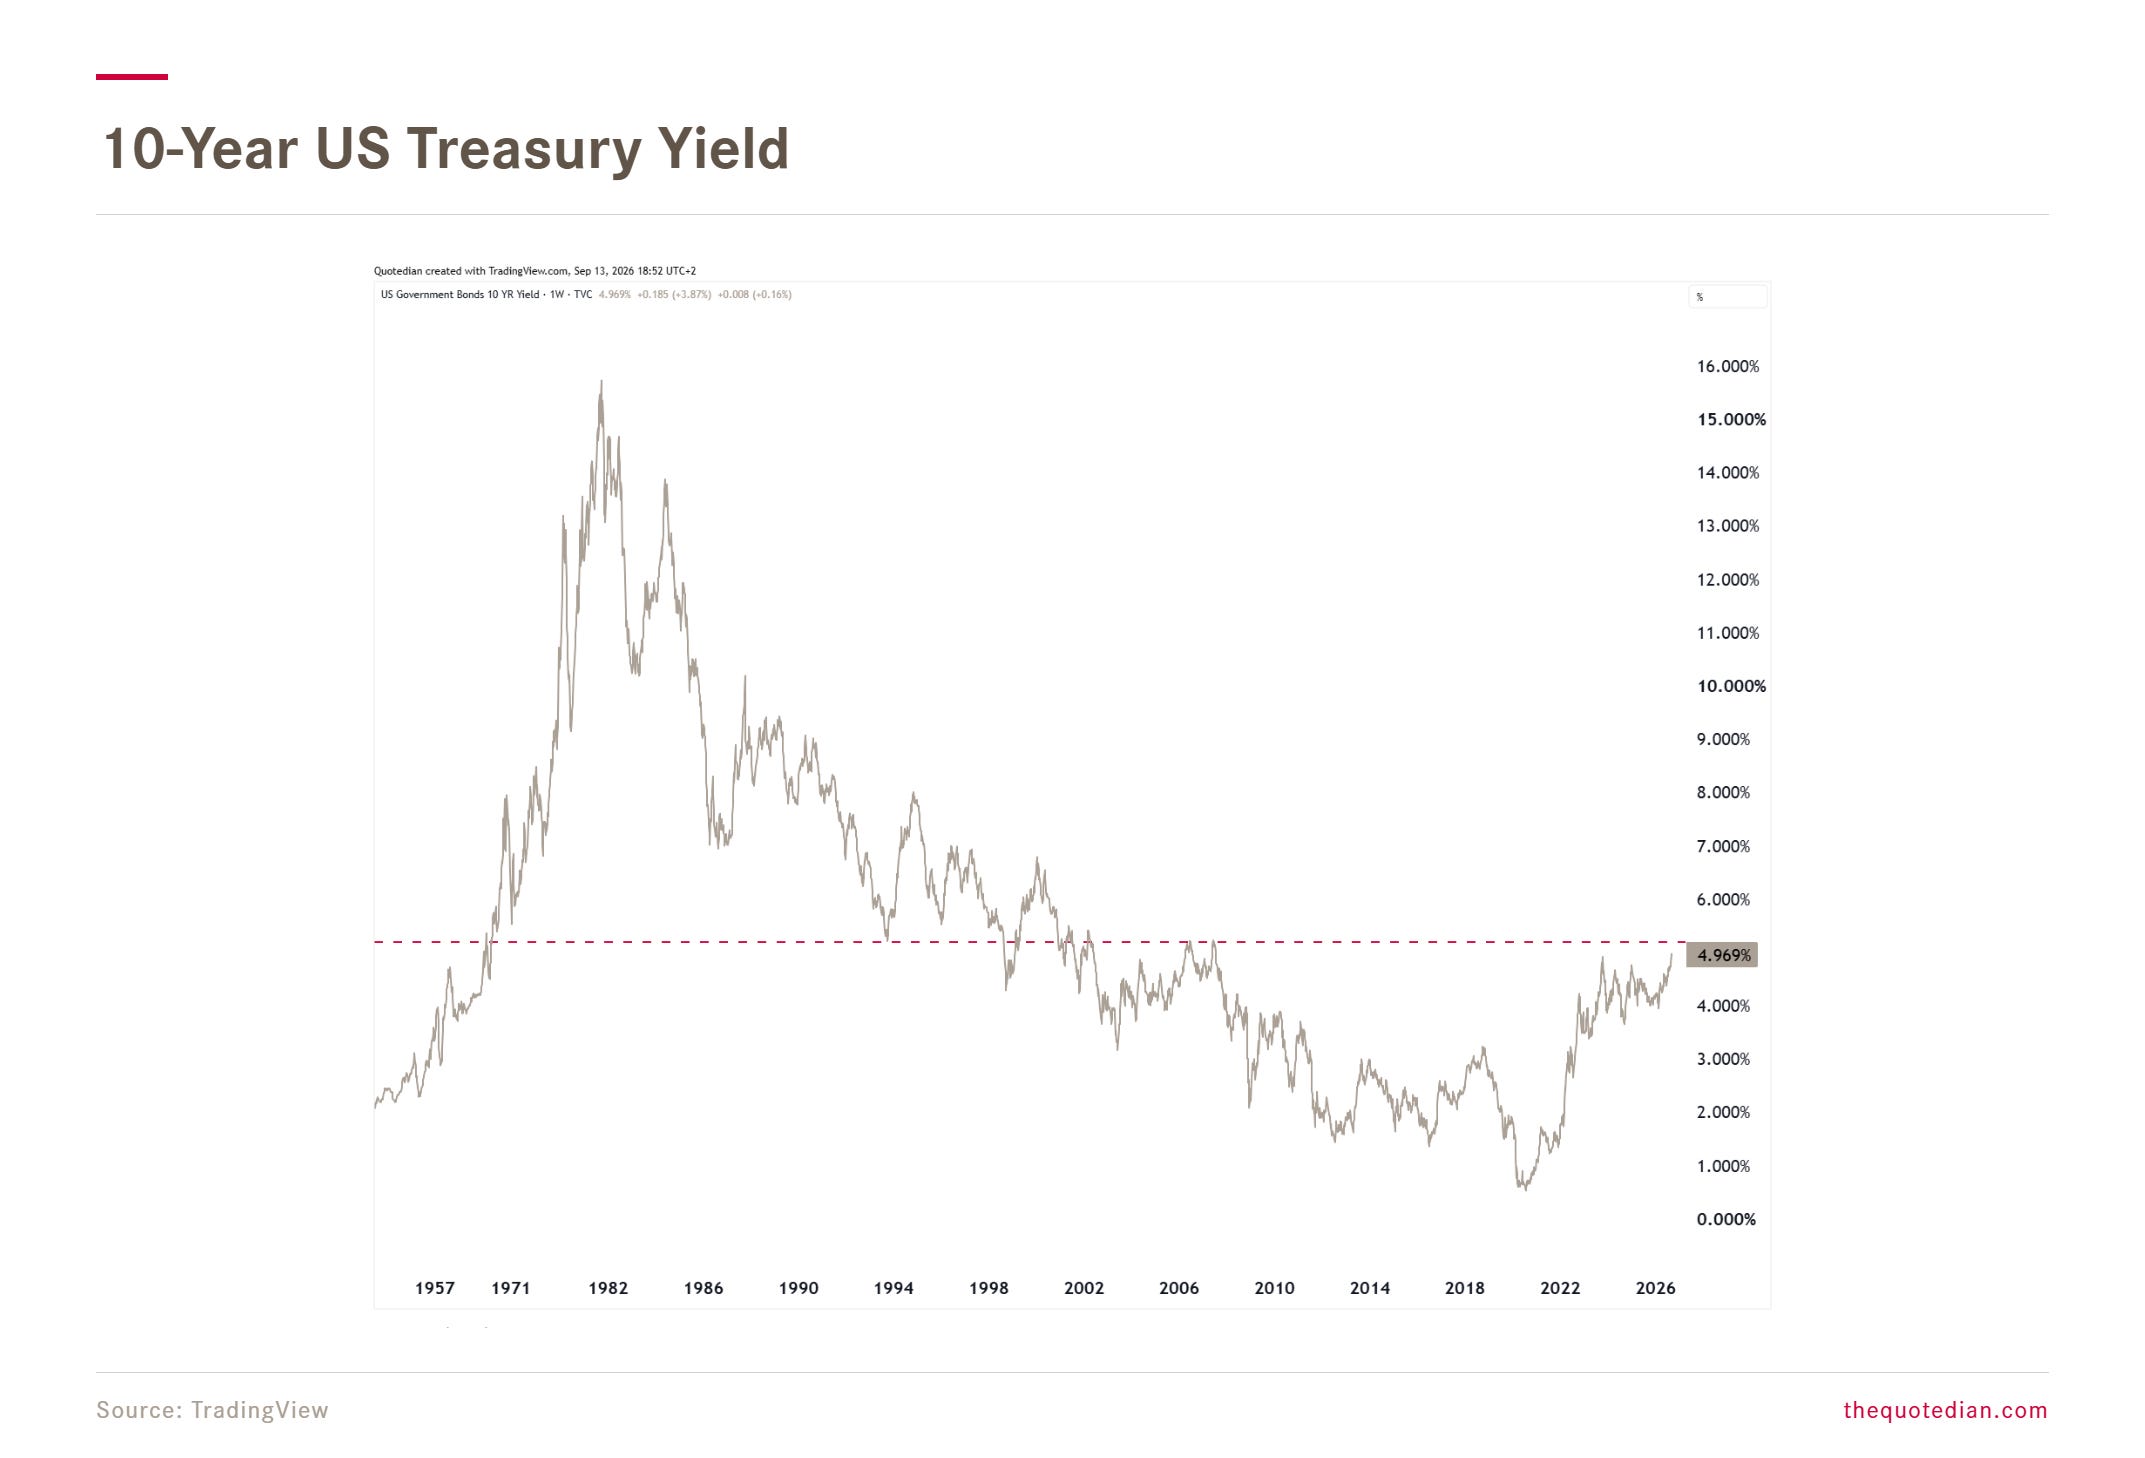
But, wait! There’s more!
In early 2020, now Boston College finance professor Schmelzing issued a seminal Bank of England white paper (click here). Schmelzing went through seven centuries of archives — city-state ledgers, Dutch and British debt records, everything up to modern bond data — and built an annual series of what the safest government of the day paid to borrow, from 1311 to 2018.
The average yield over those 700 years?
Just north of 6%.
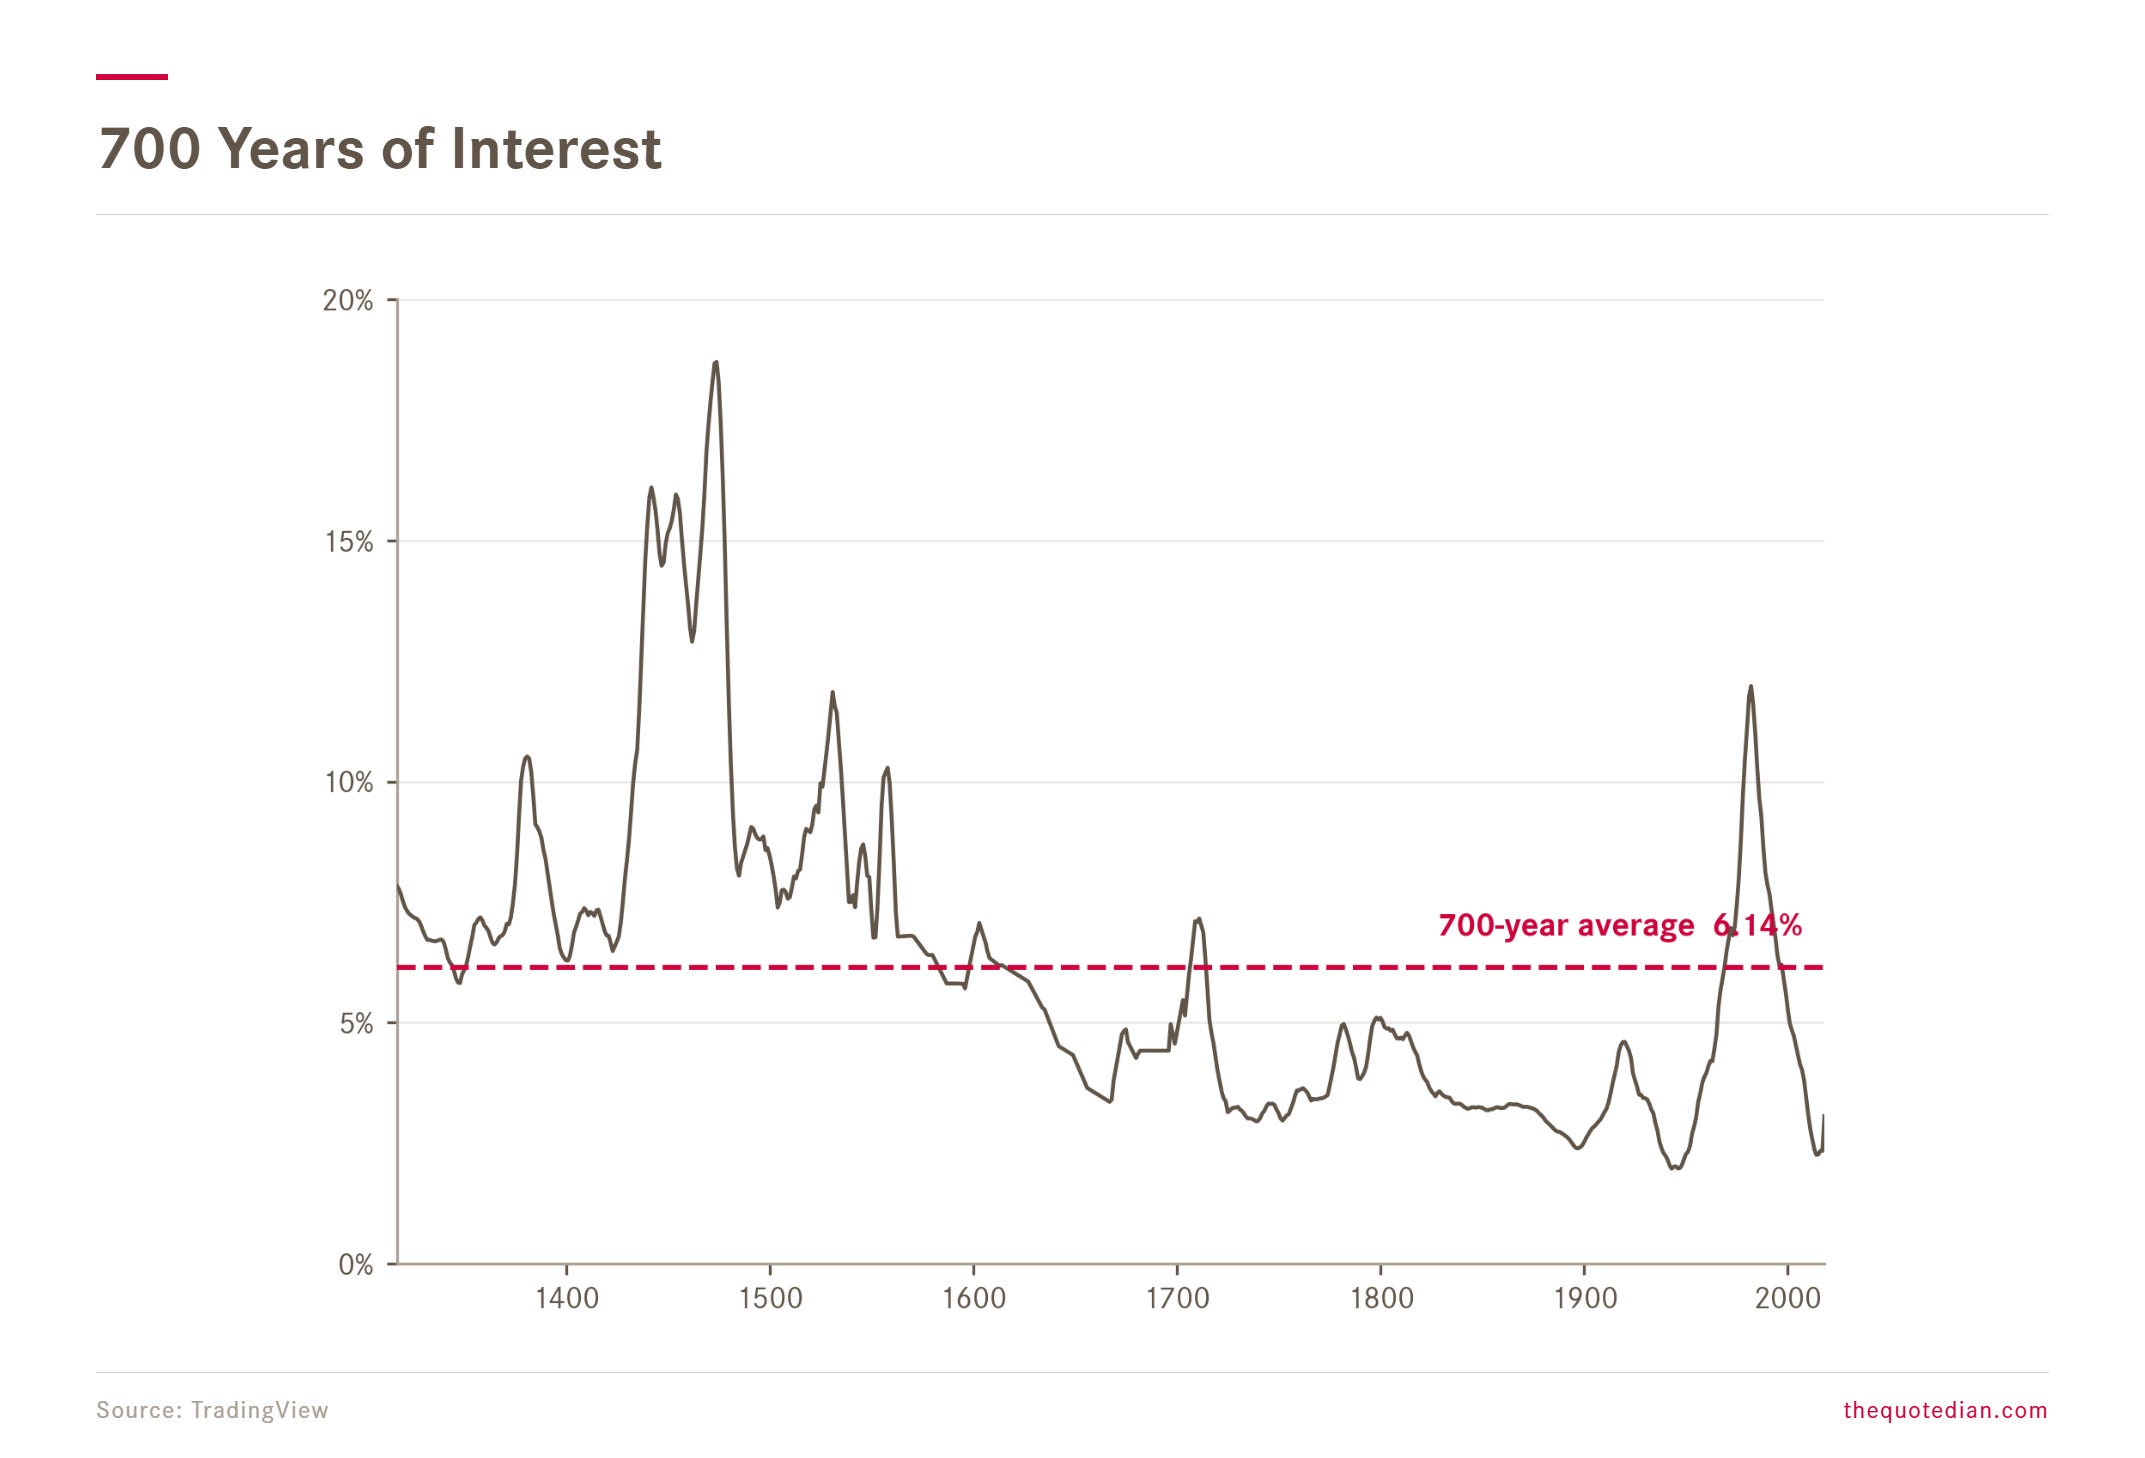
In other words, we are now getting back to what is normal.
BACK TO THE FUTURE.
Welcome to the Old Normal.

Starting our weekly “Tour de Force” of financial markets, first things first:
Just because bond yields are hitting a seemingly magical 5% number (US 10-year Treasury), it does not mean that markets will drop like a stone.
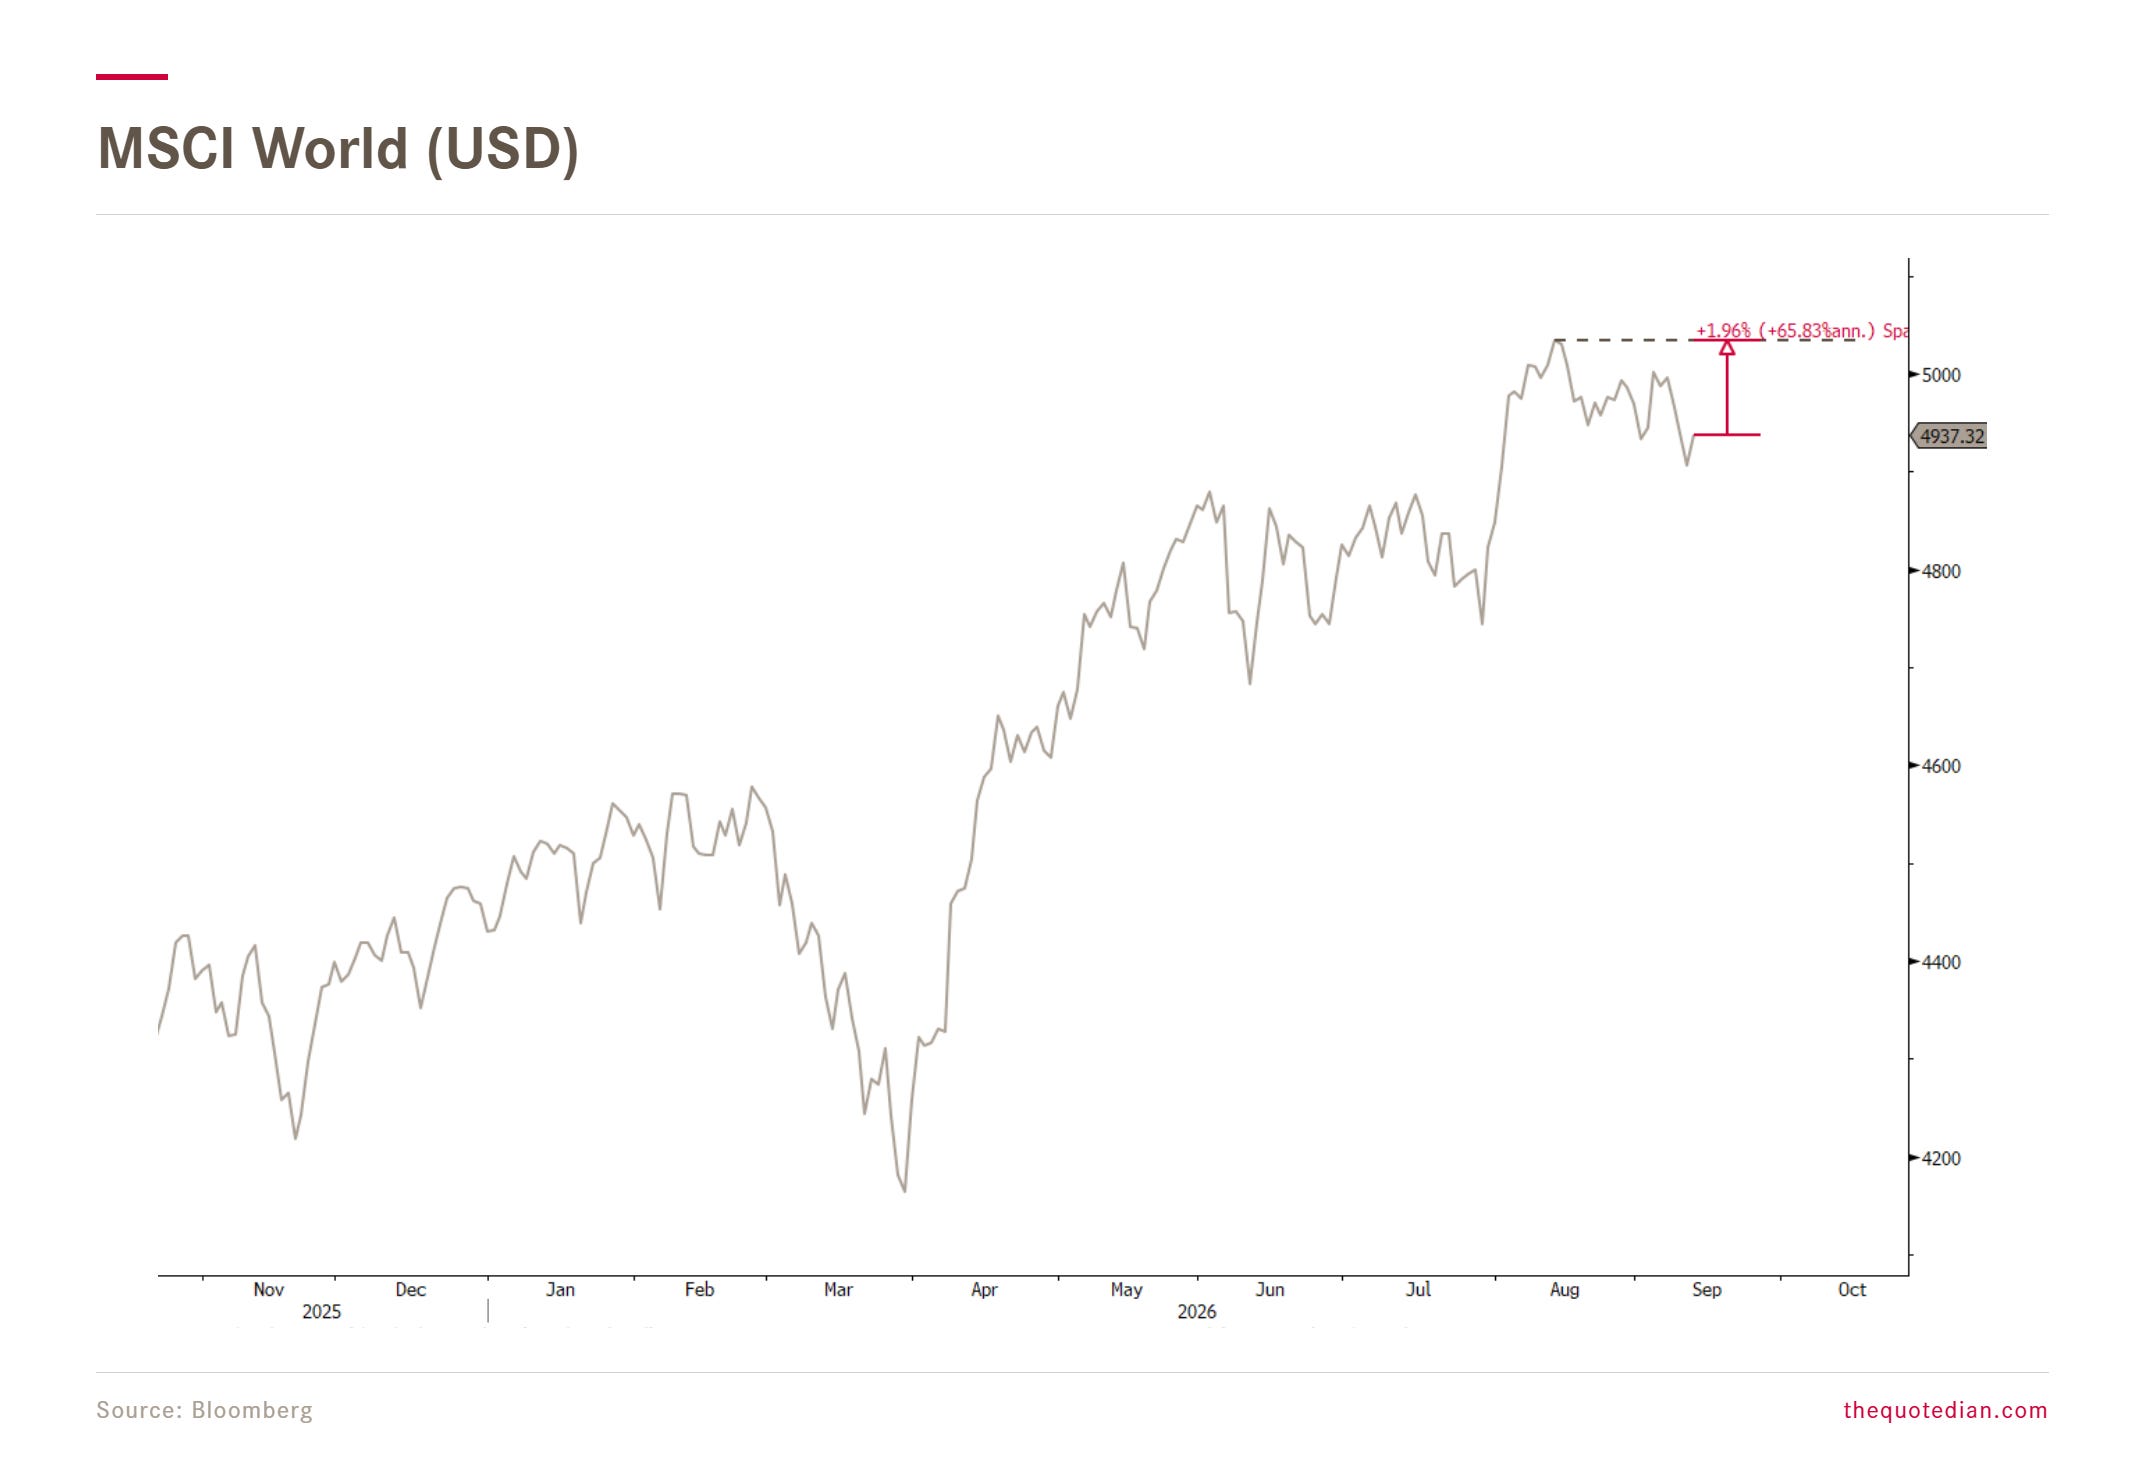
Quite “au contraire”, equity markets have been surprisingly resilient. The MSCI World index is less than two percent from a new all-time high:
HOWEVER …
Several factors argue for a move lower before higher …
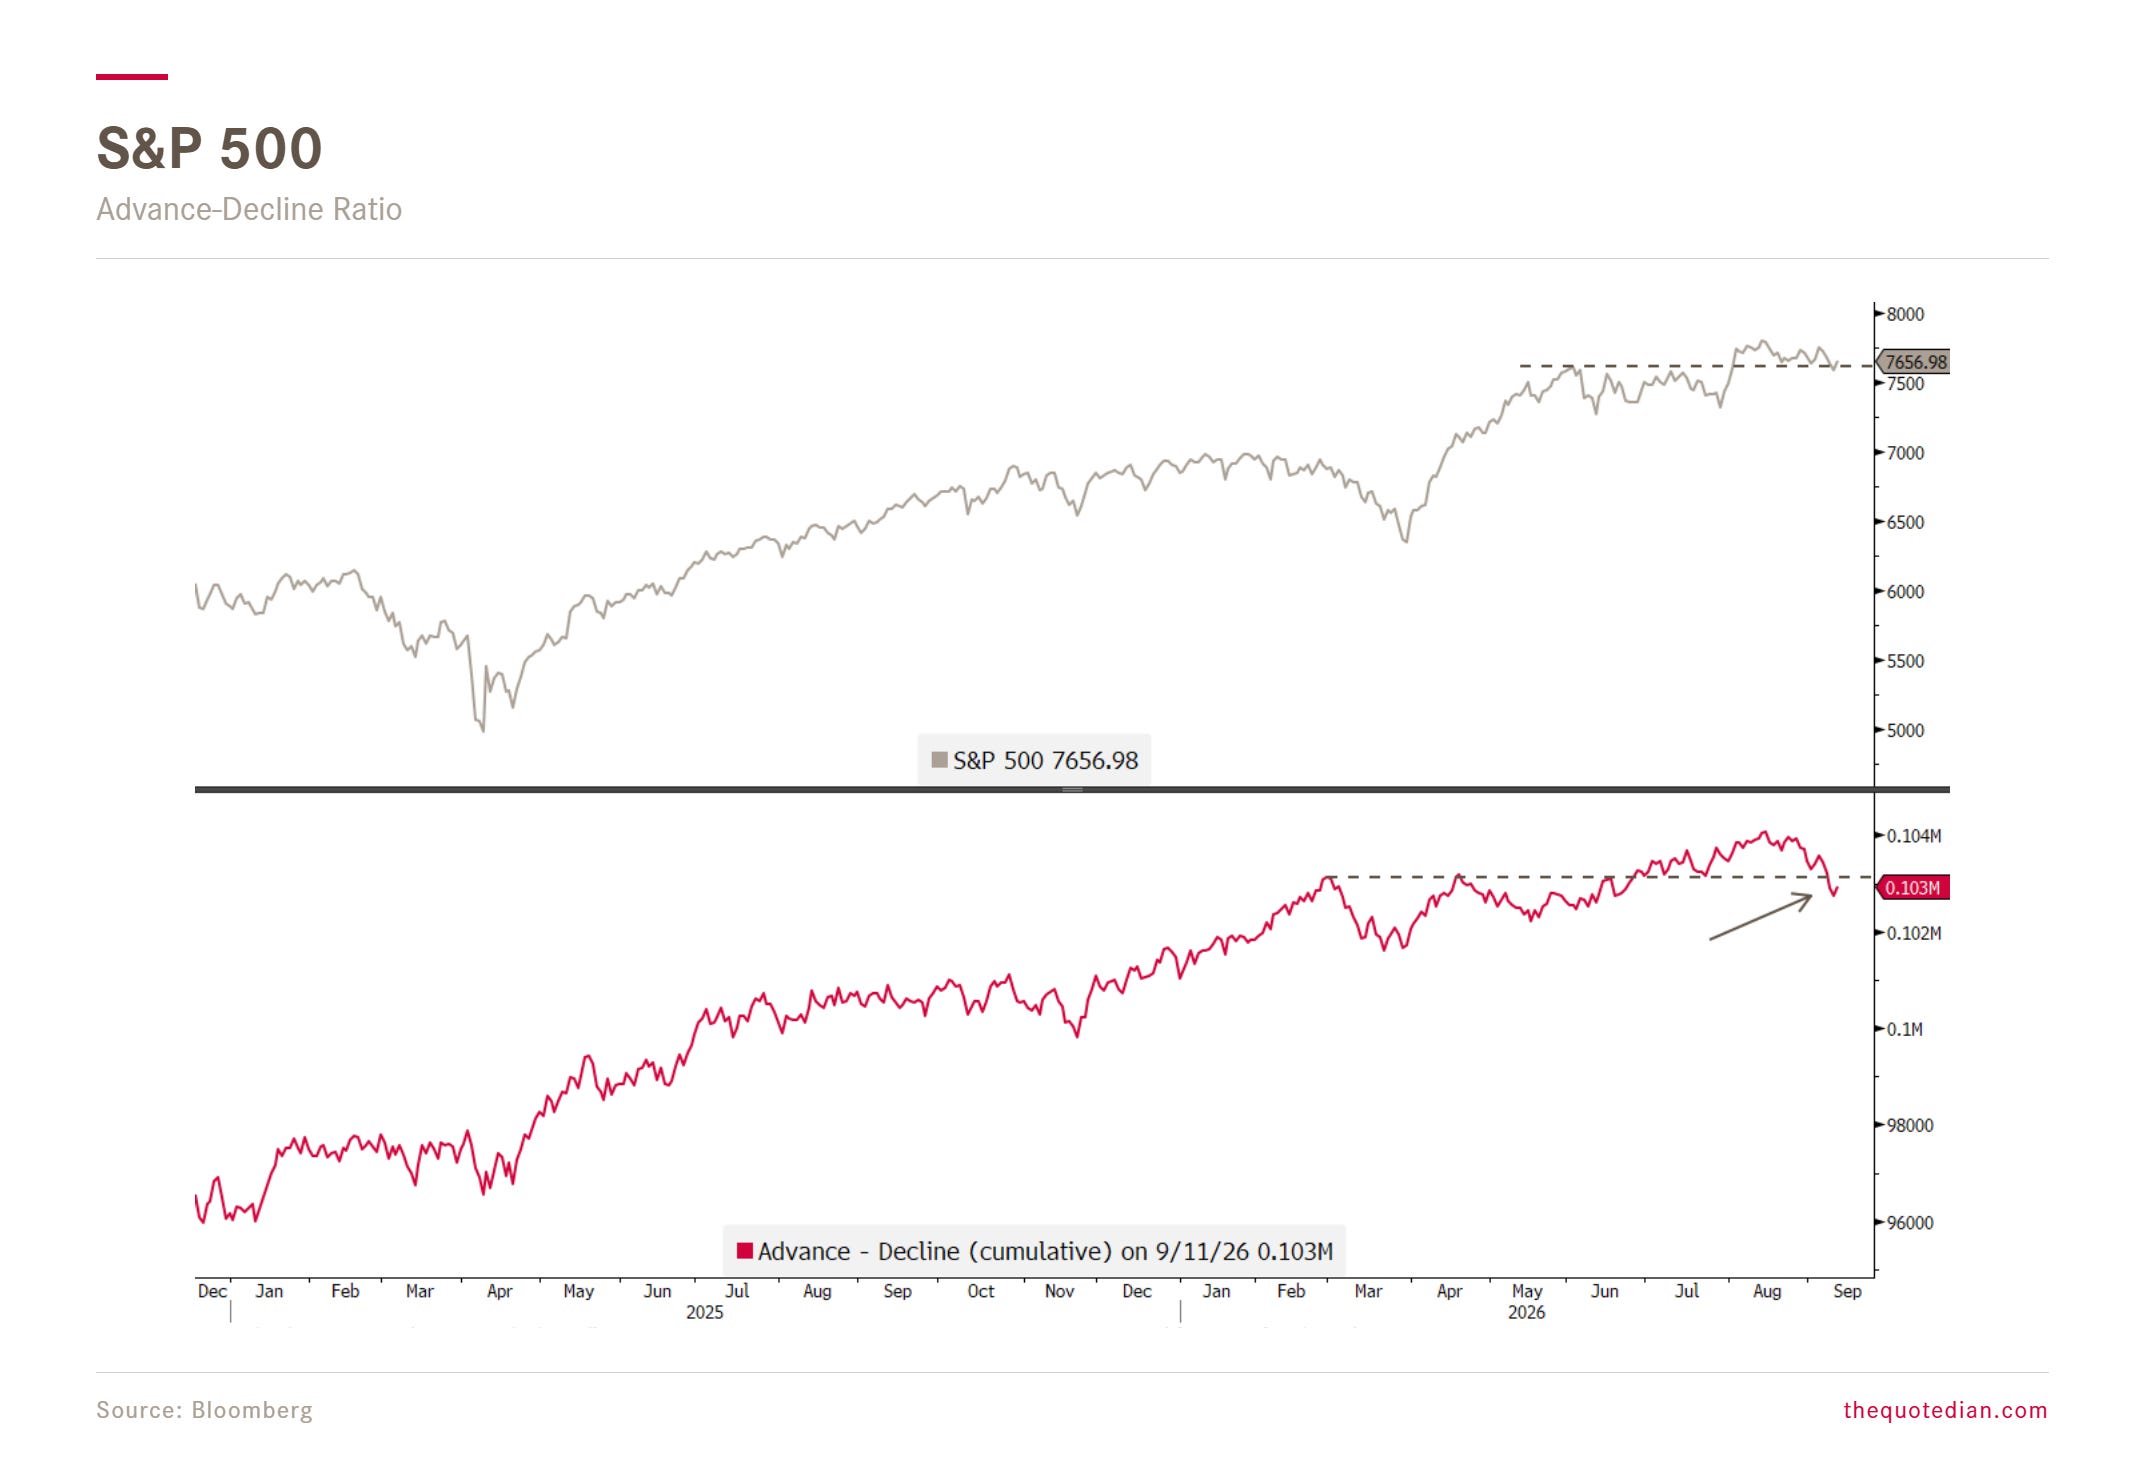
For example, breadth continues to deteriorate. Not only on the S&P 500:
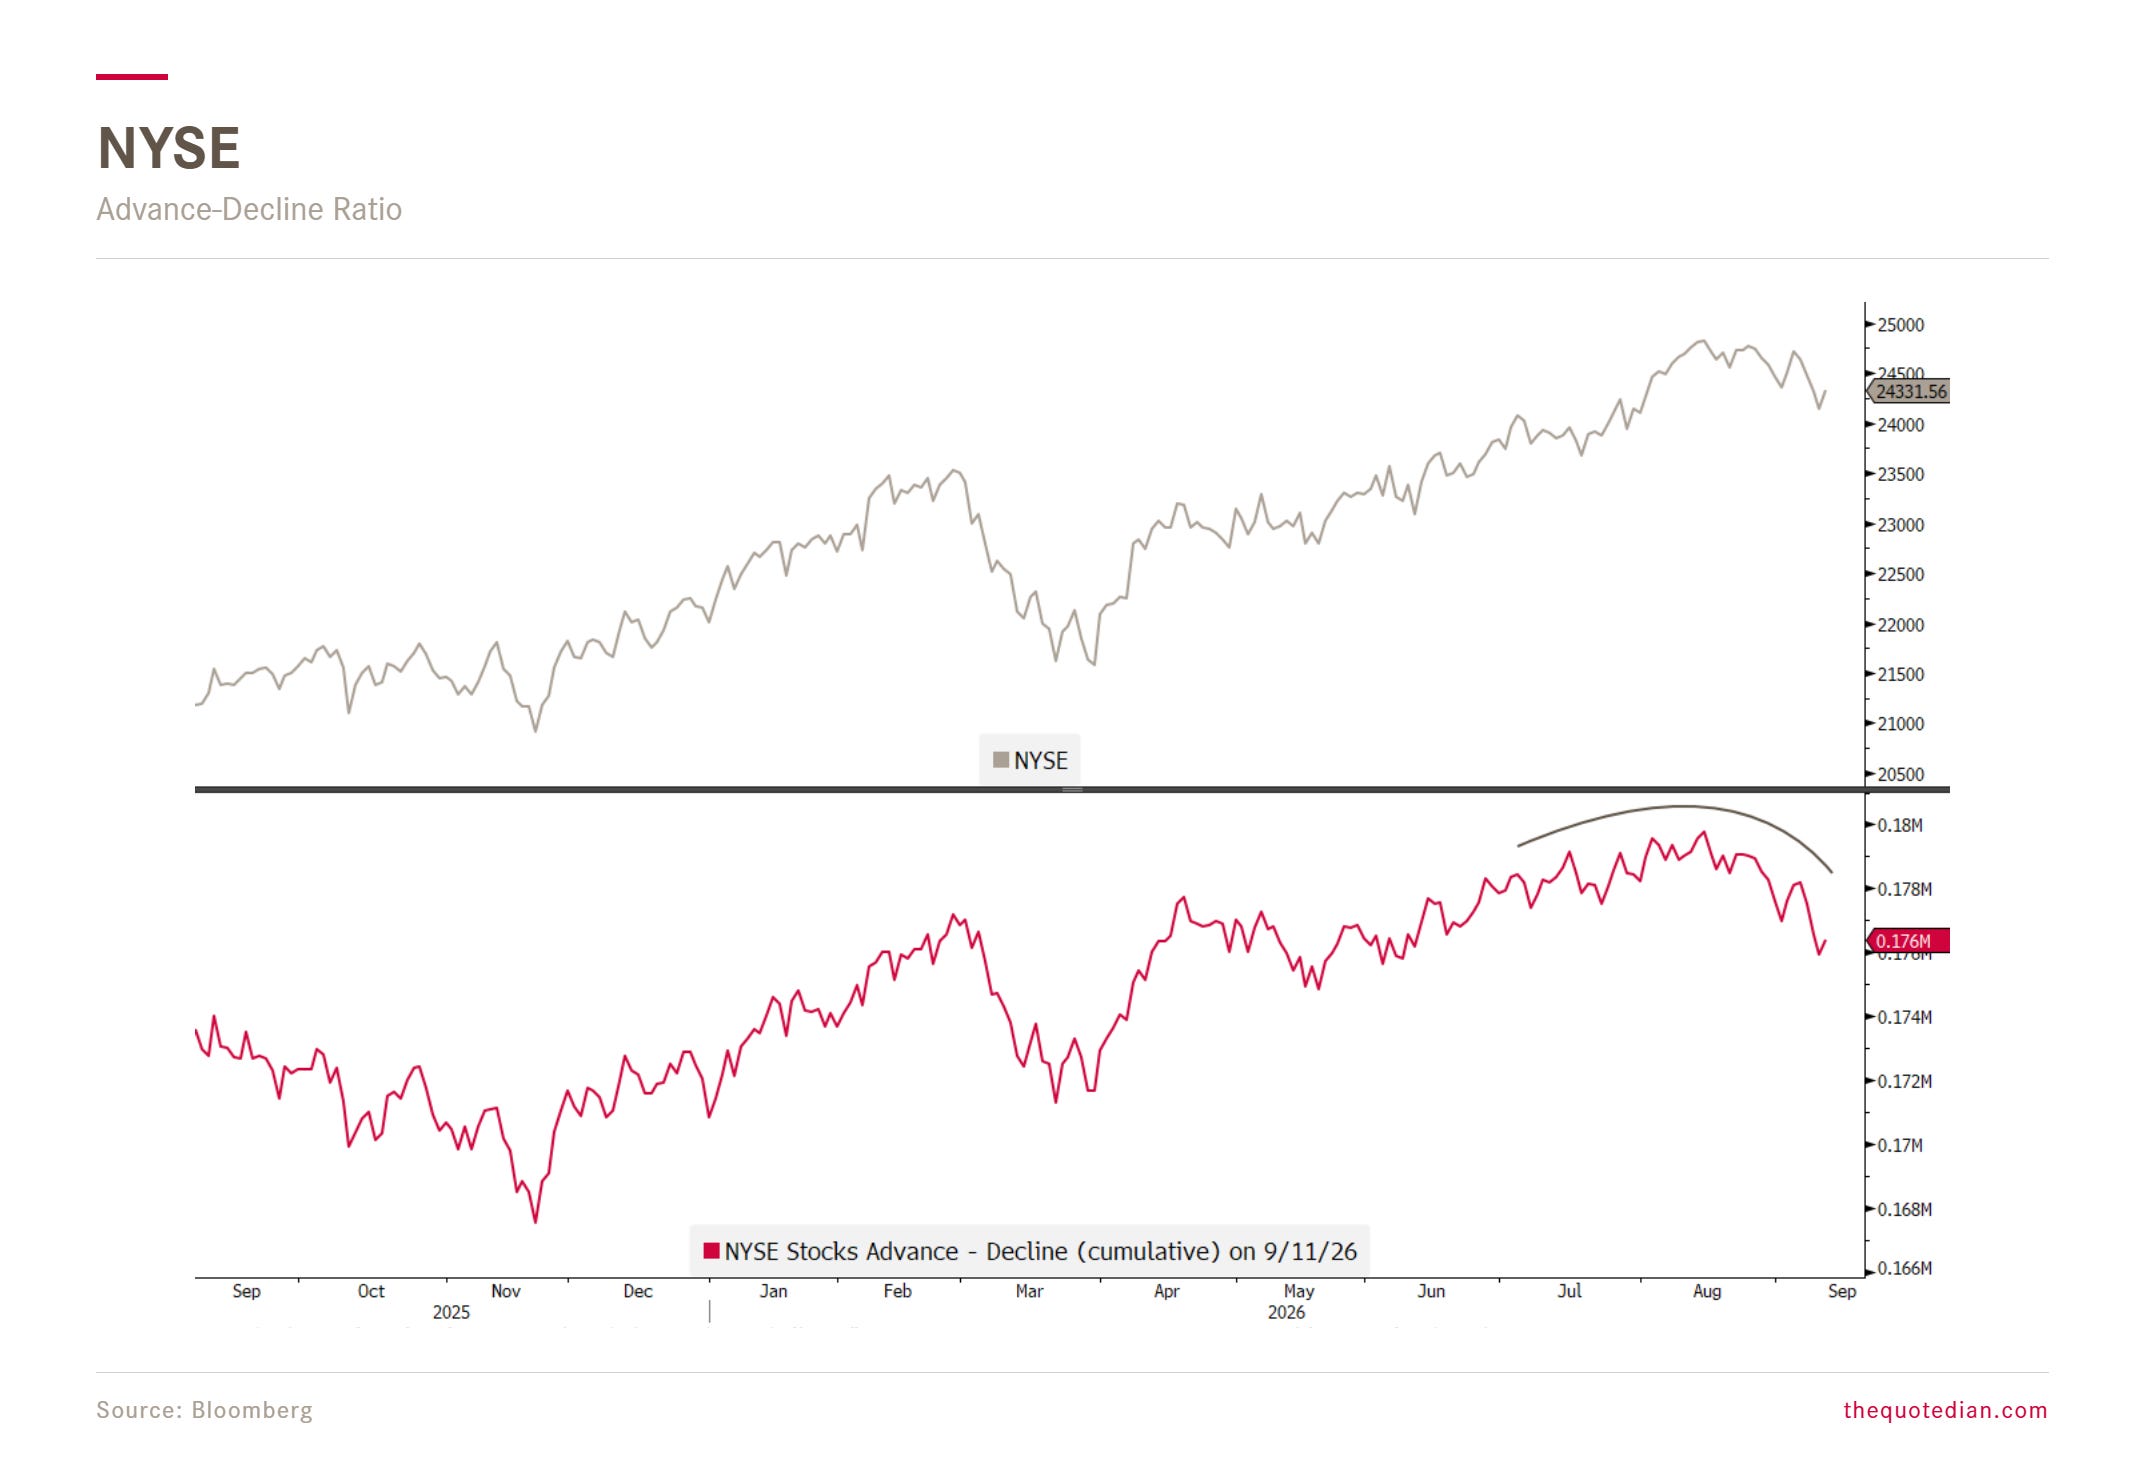
But also on the broader US market:
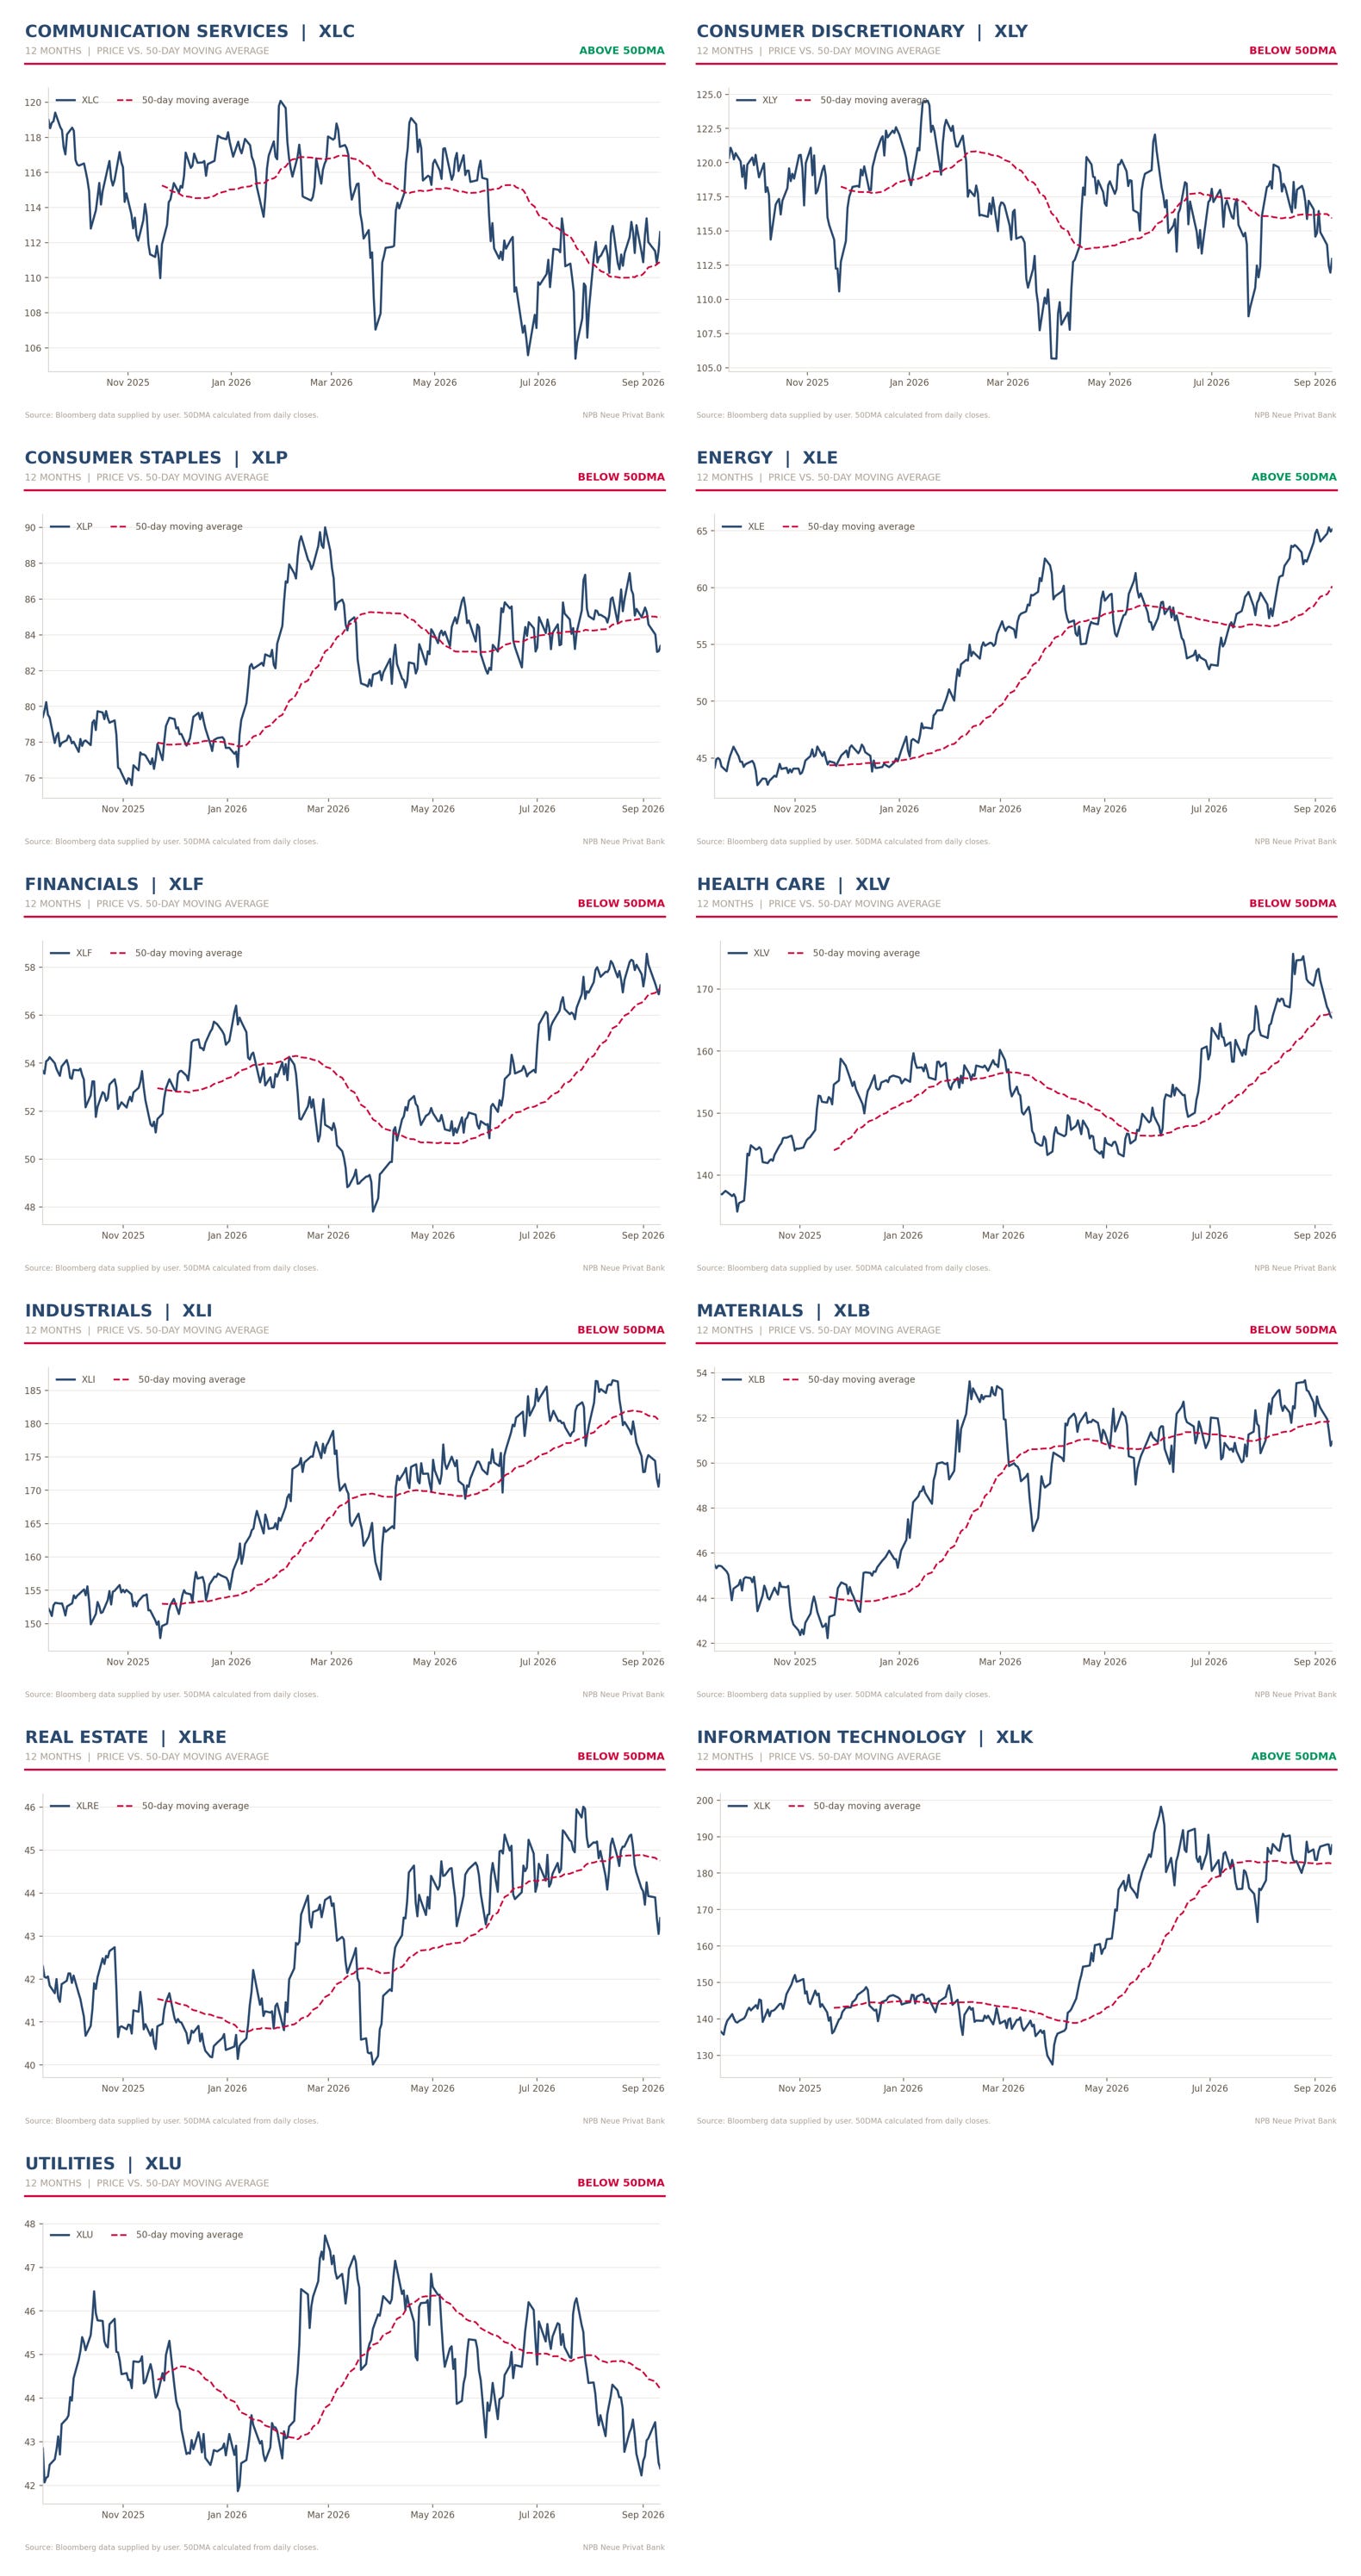
Only 3 out of the 11 economic sectors continue to trade above their 50-day moving average:
We could argue that the S&P 500 has successfully tested support and is recovering:
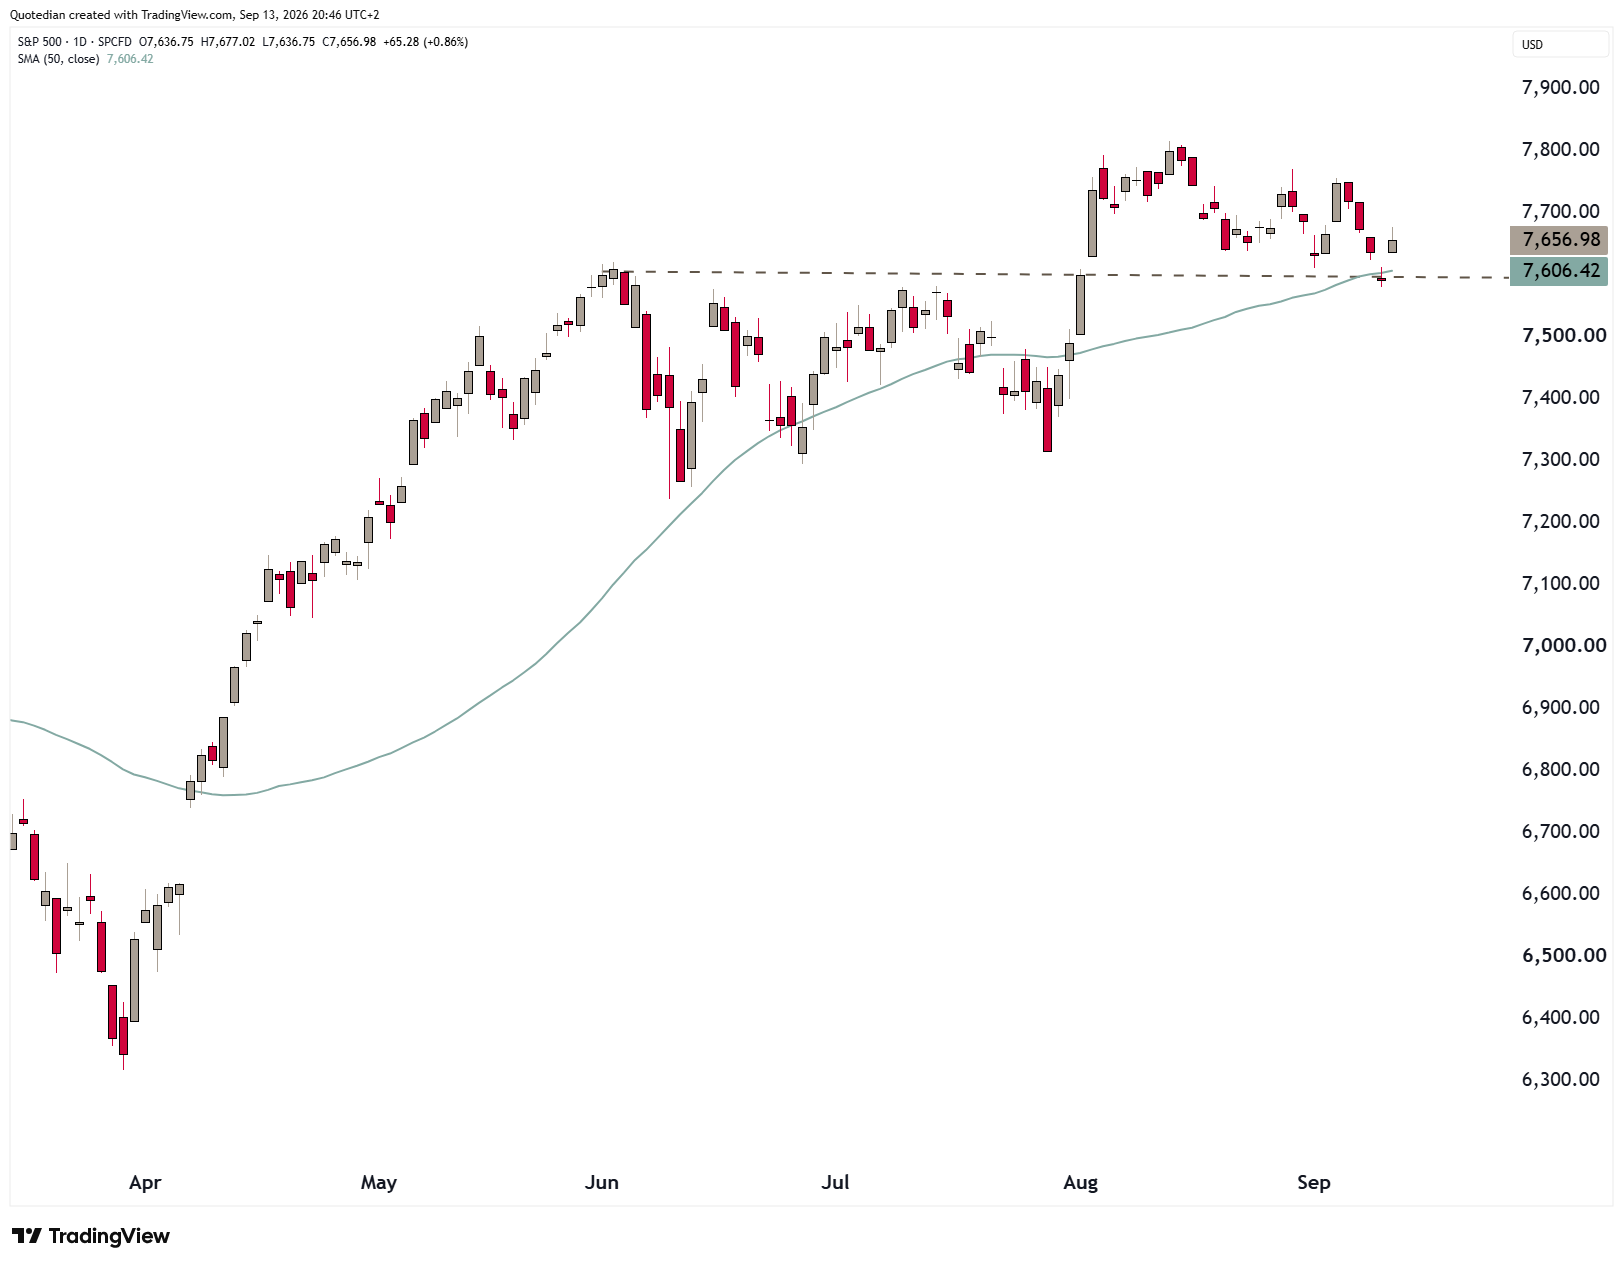
However, a broader view reveals a pretty different story.
E.g., the same index, but equal-weight:
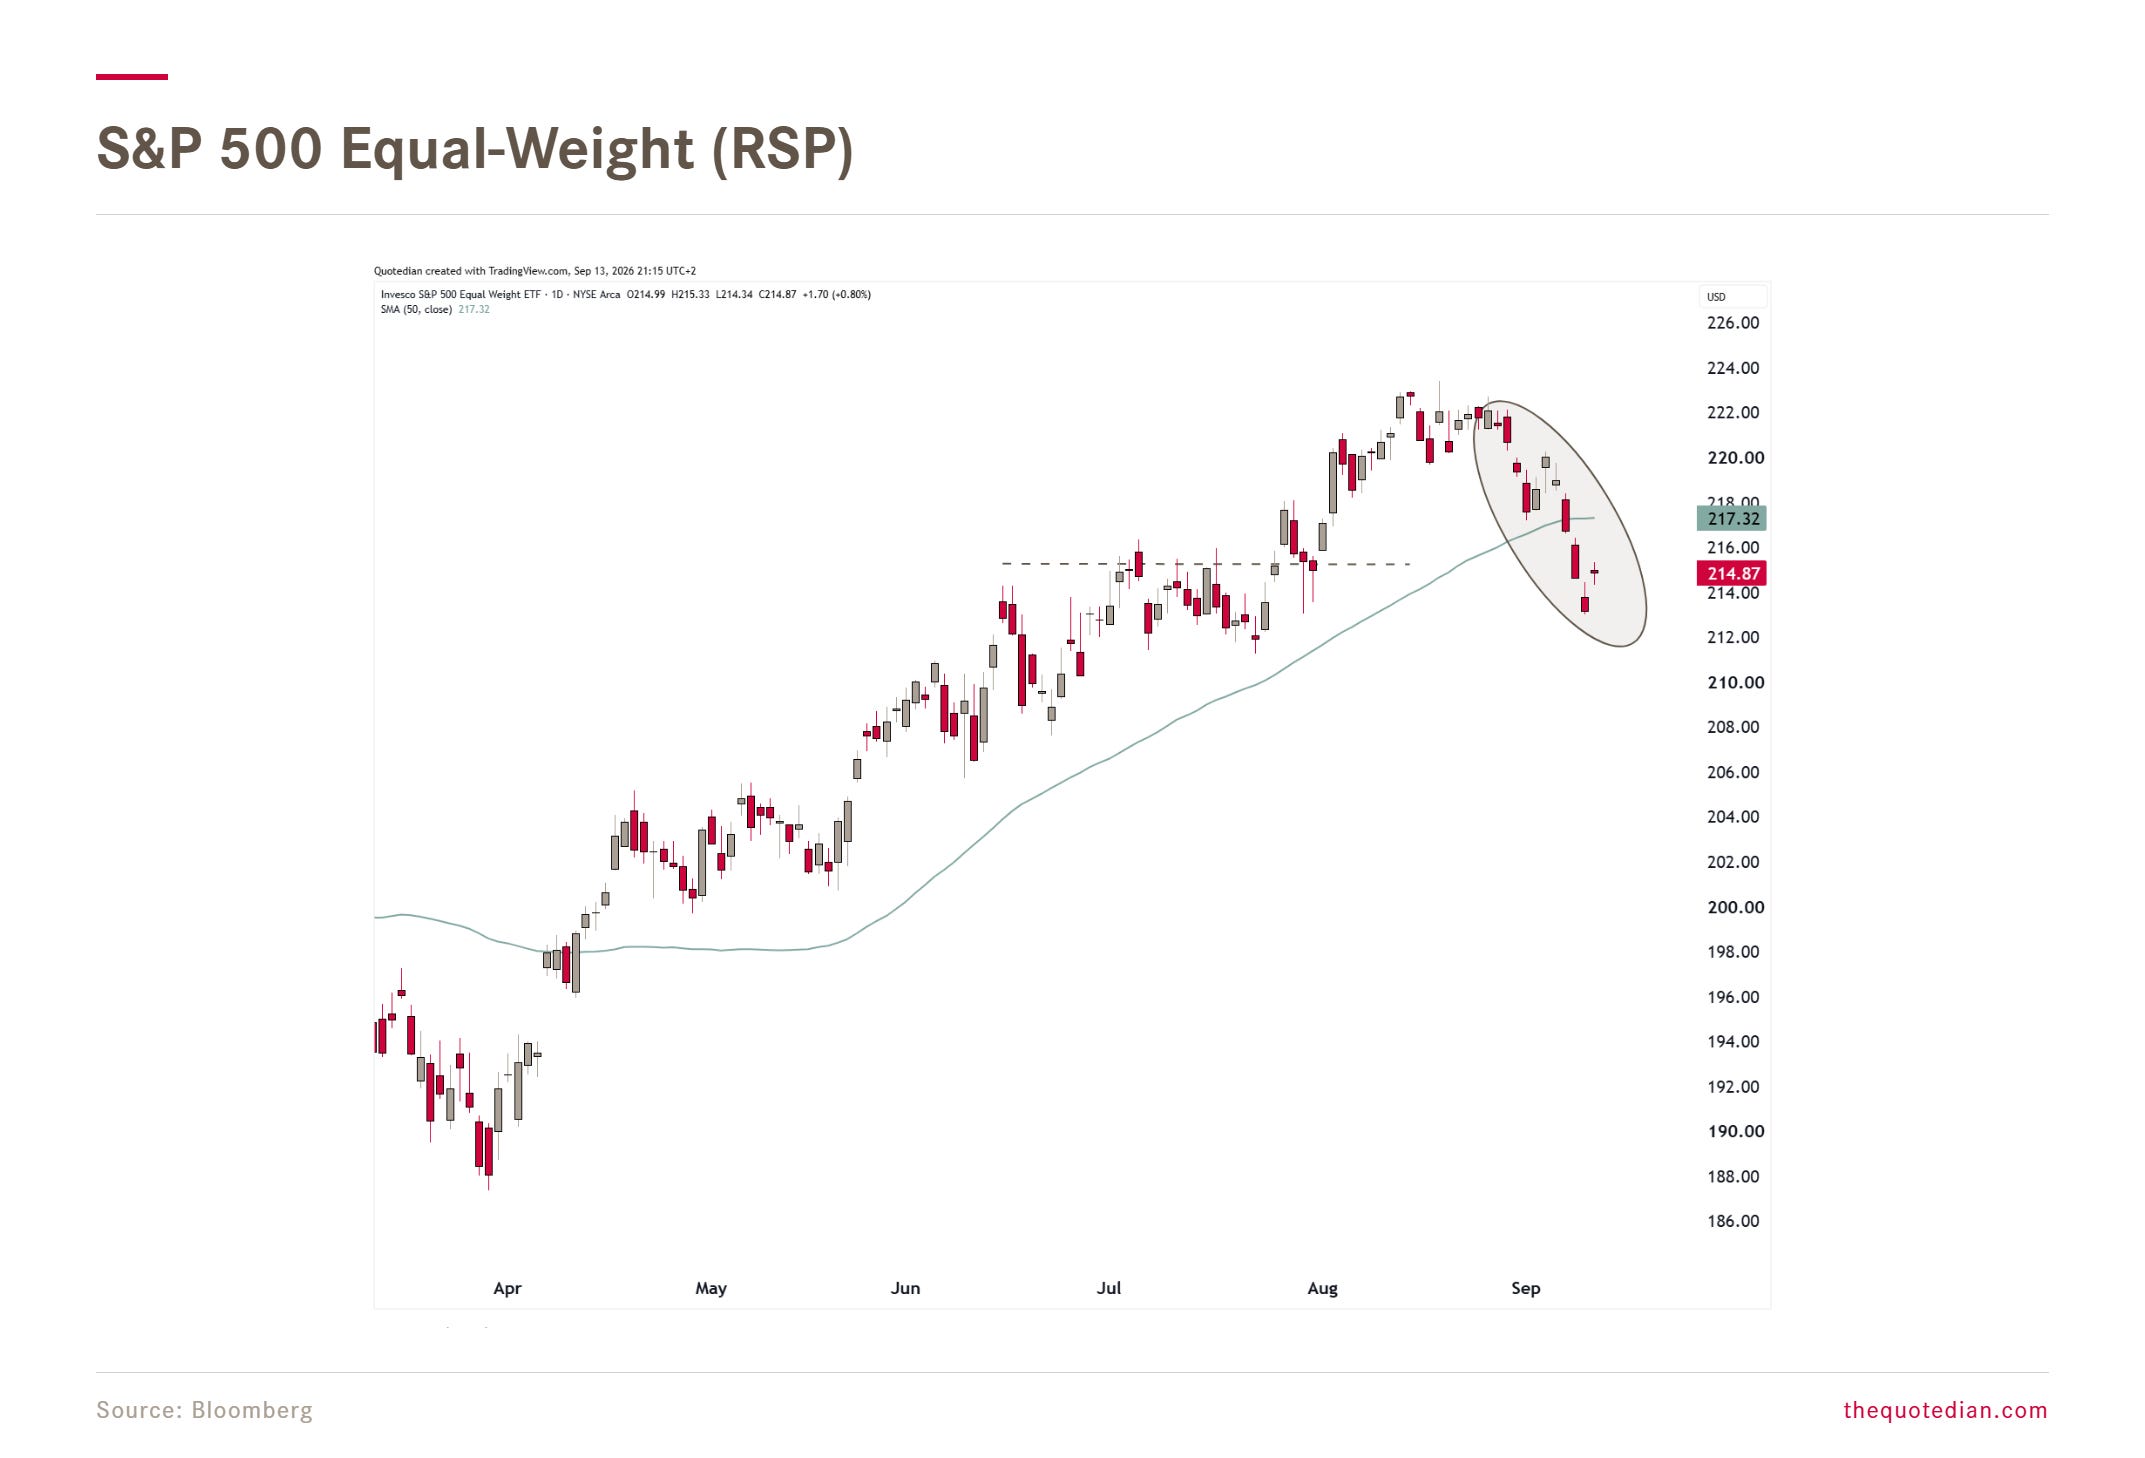
Ouch!
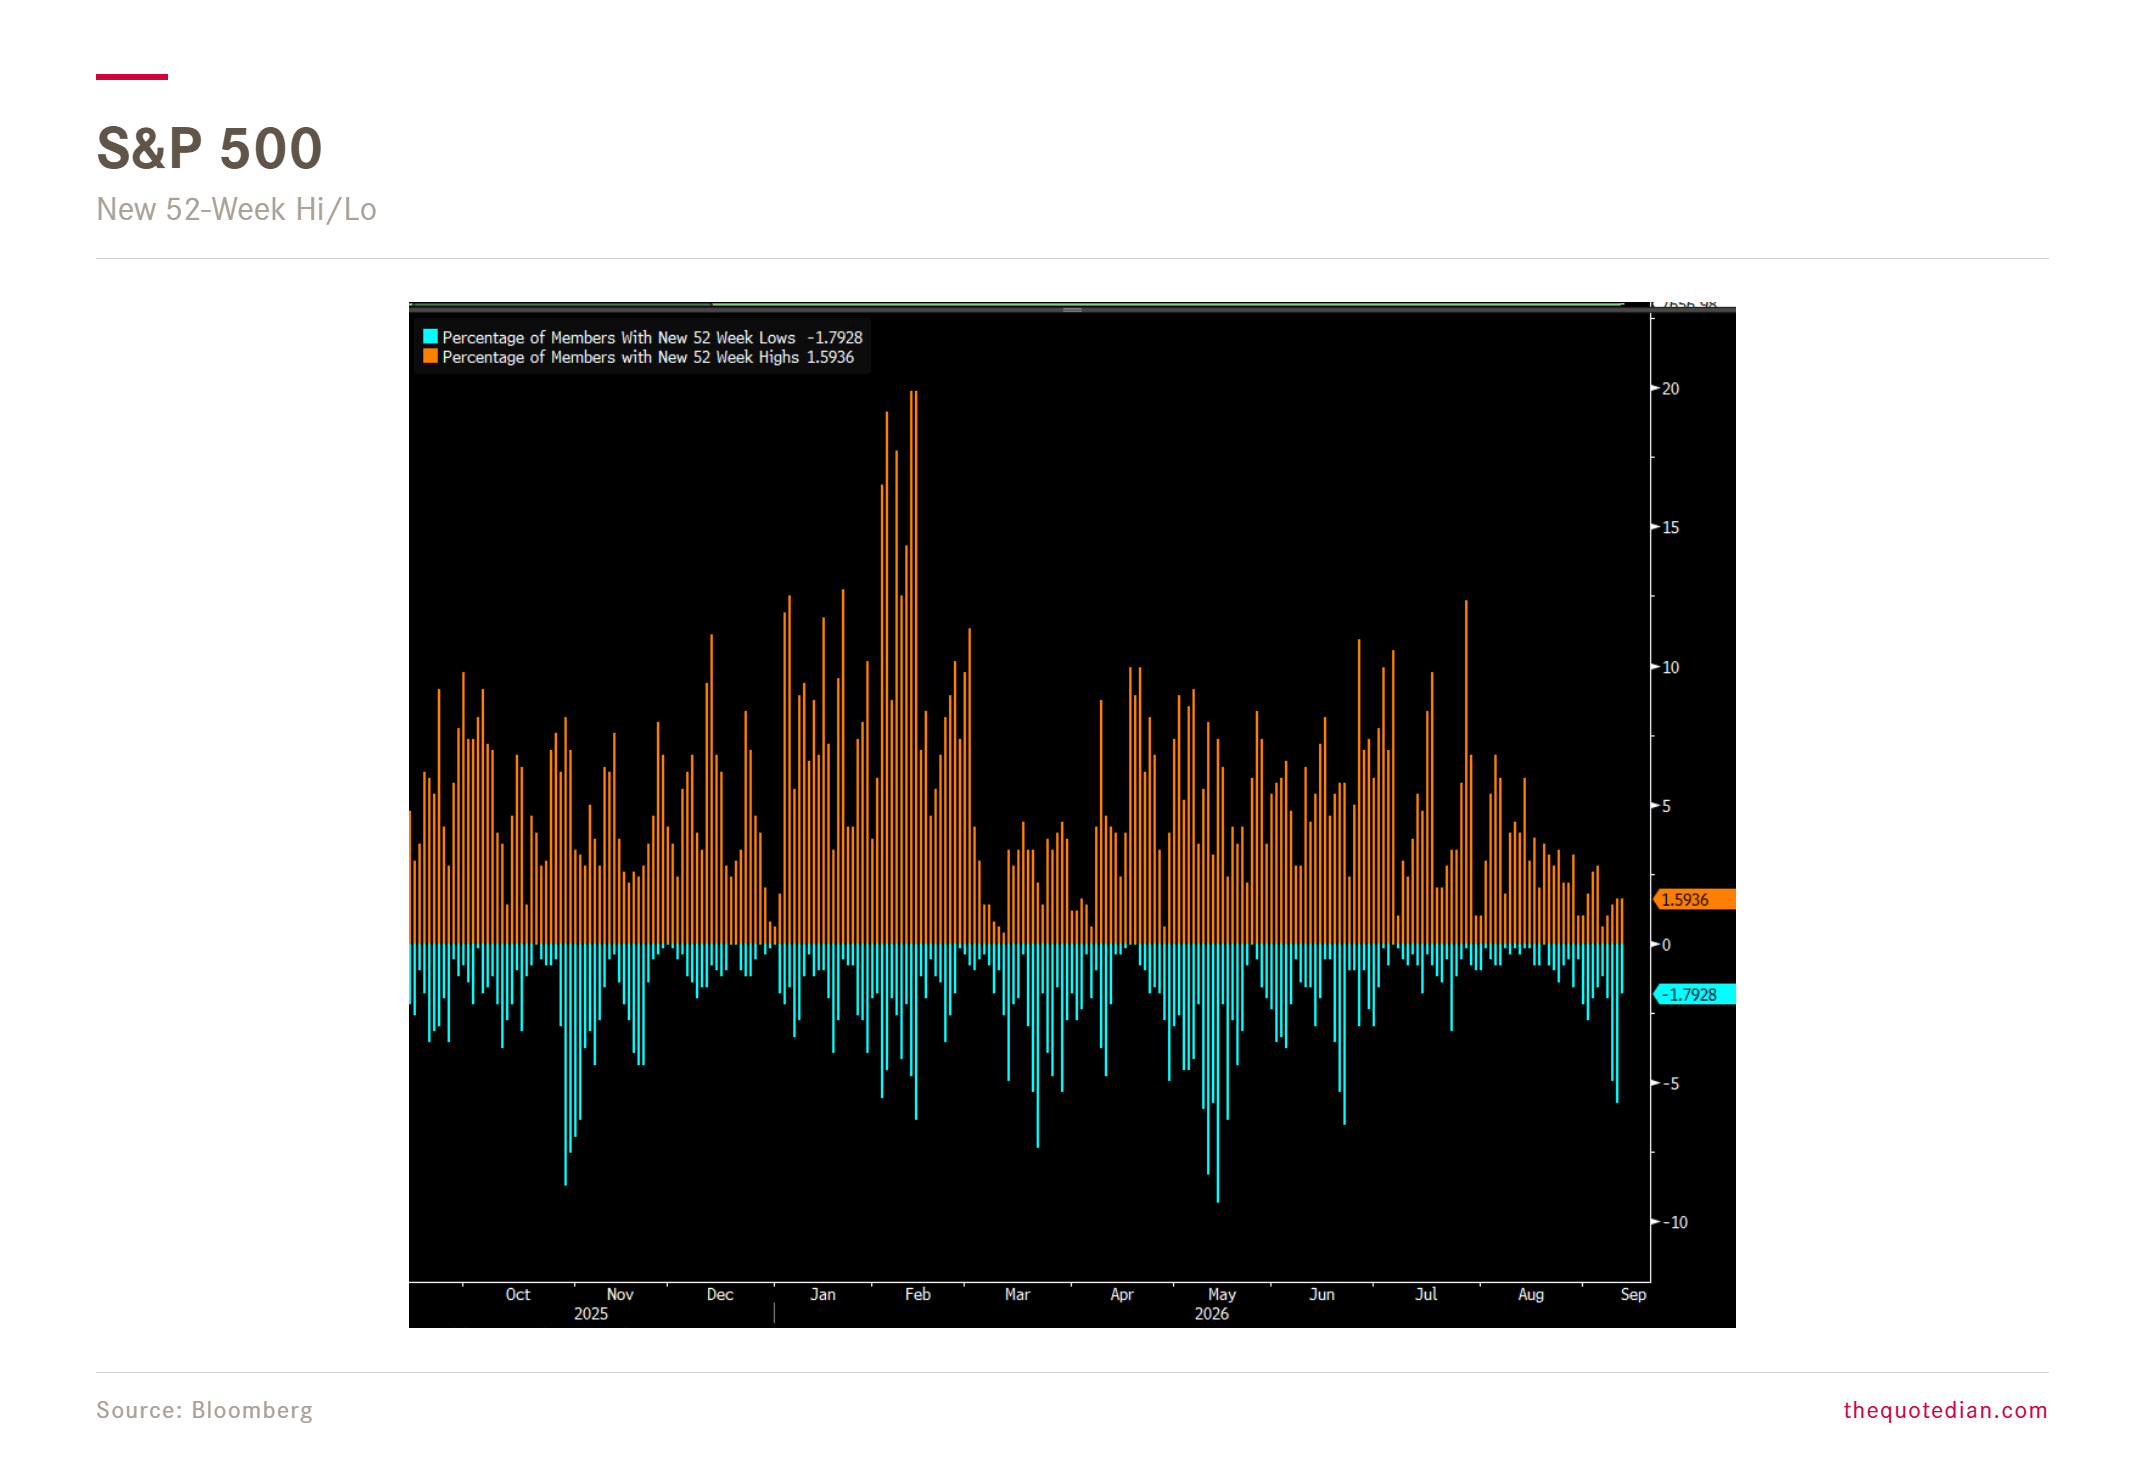
No wonder then to see that the number of new 52-week lows has been expanding, whilst that of new 52-week highs, contracting:
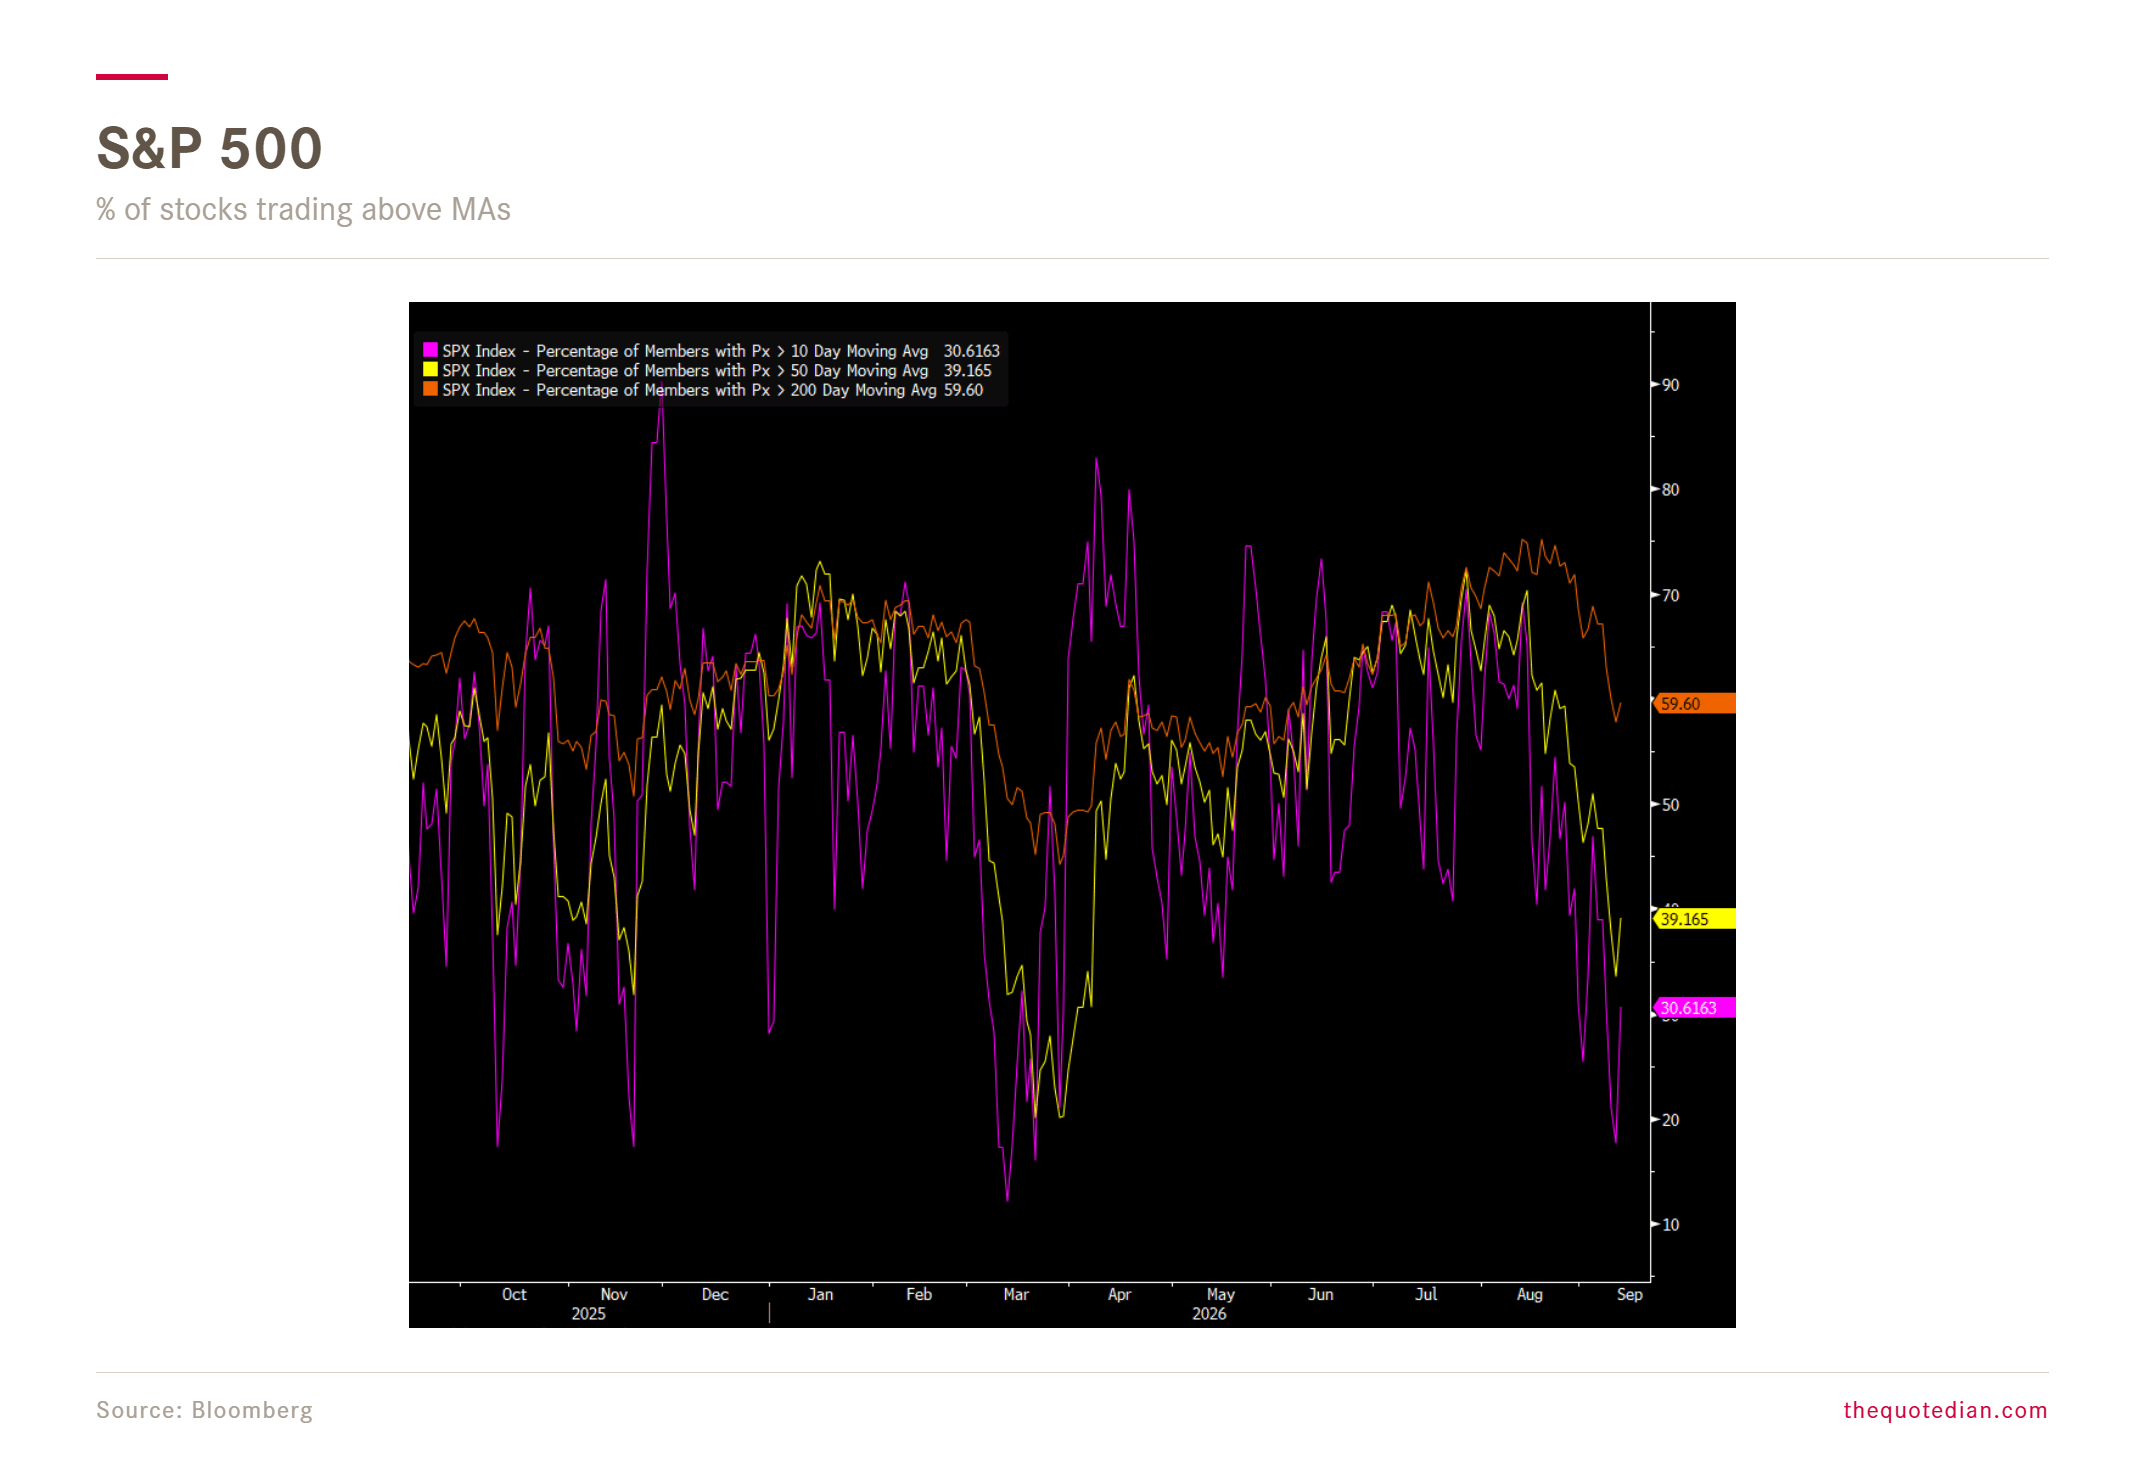
Or that more and more stocks are trading below their key moving averages:
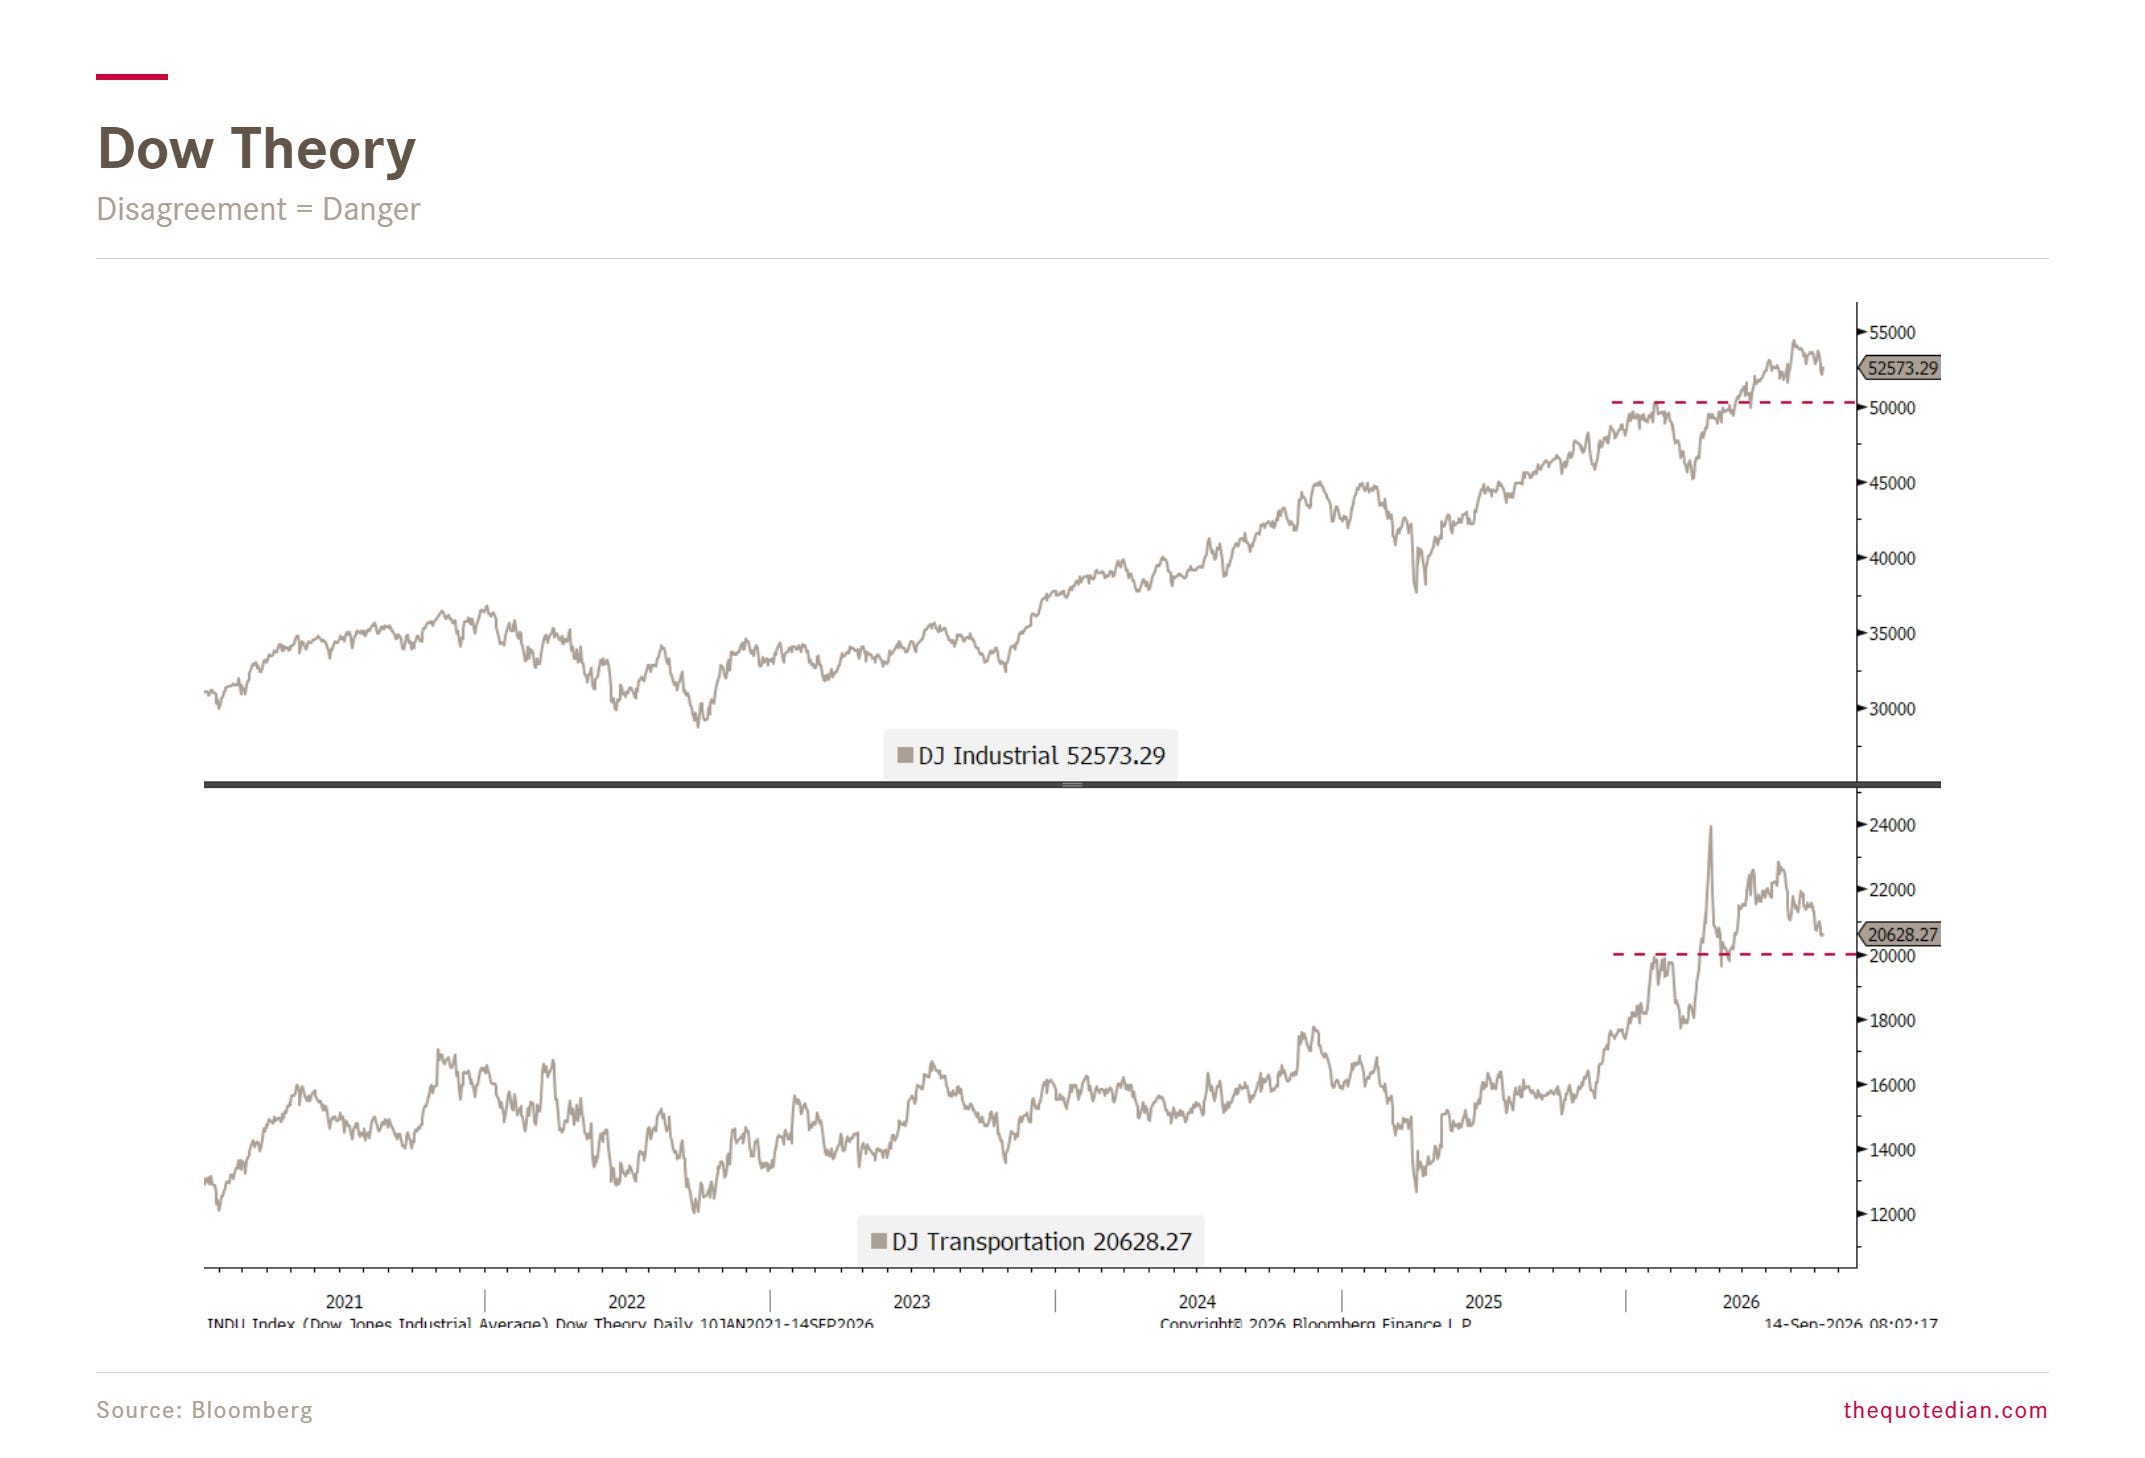
Dow Theory is setting up for a sell signal (needs confirmation), with the two indices disagreeing with each other:
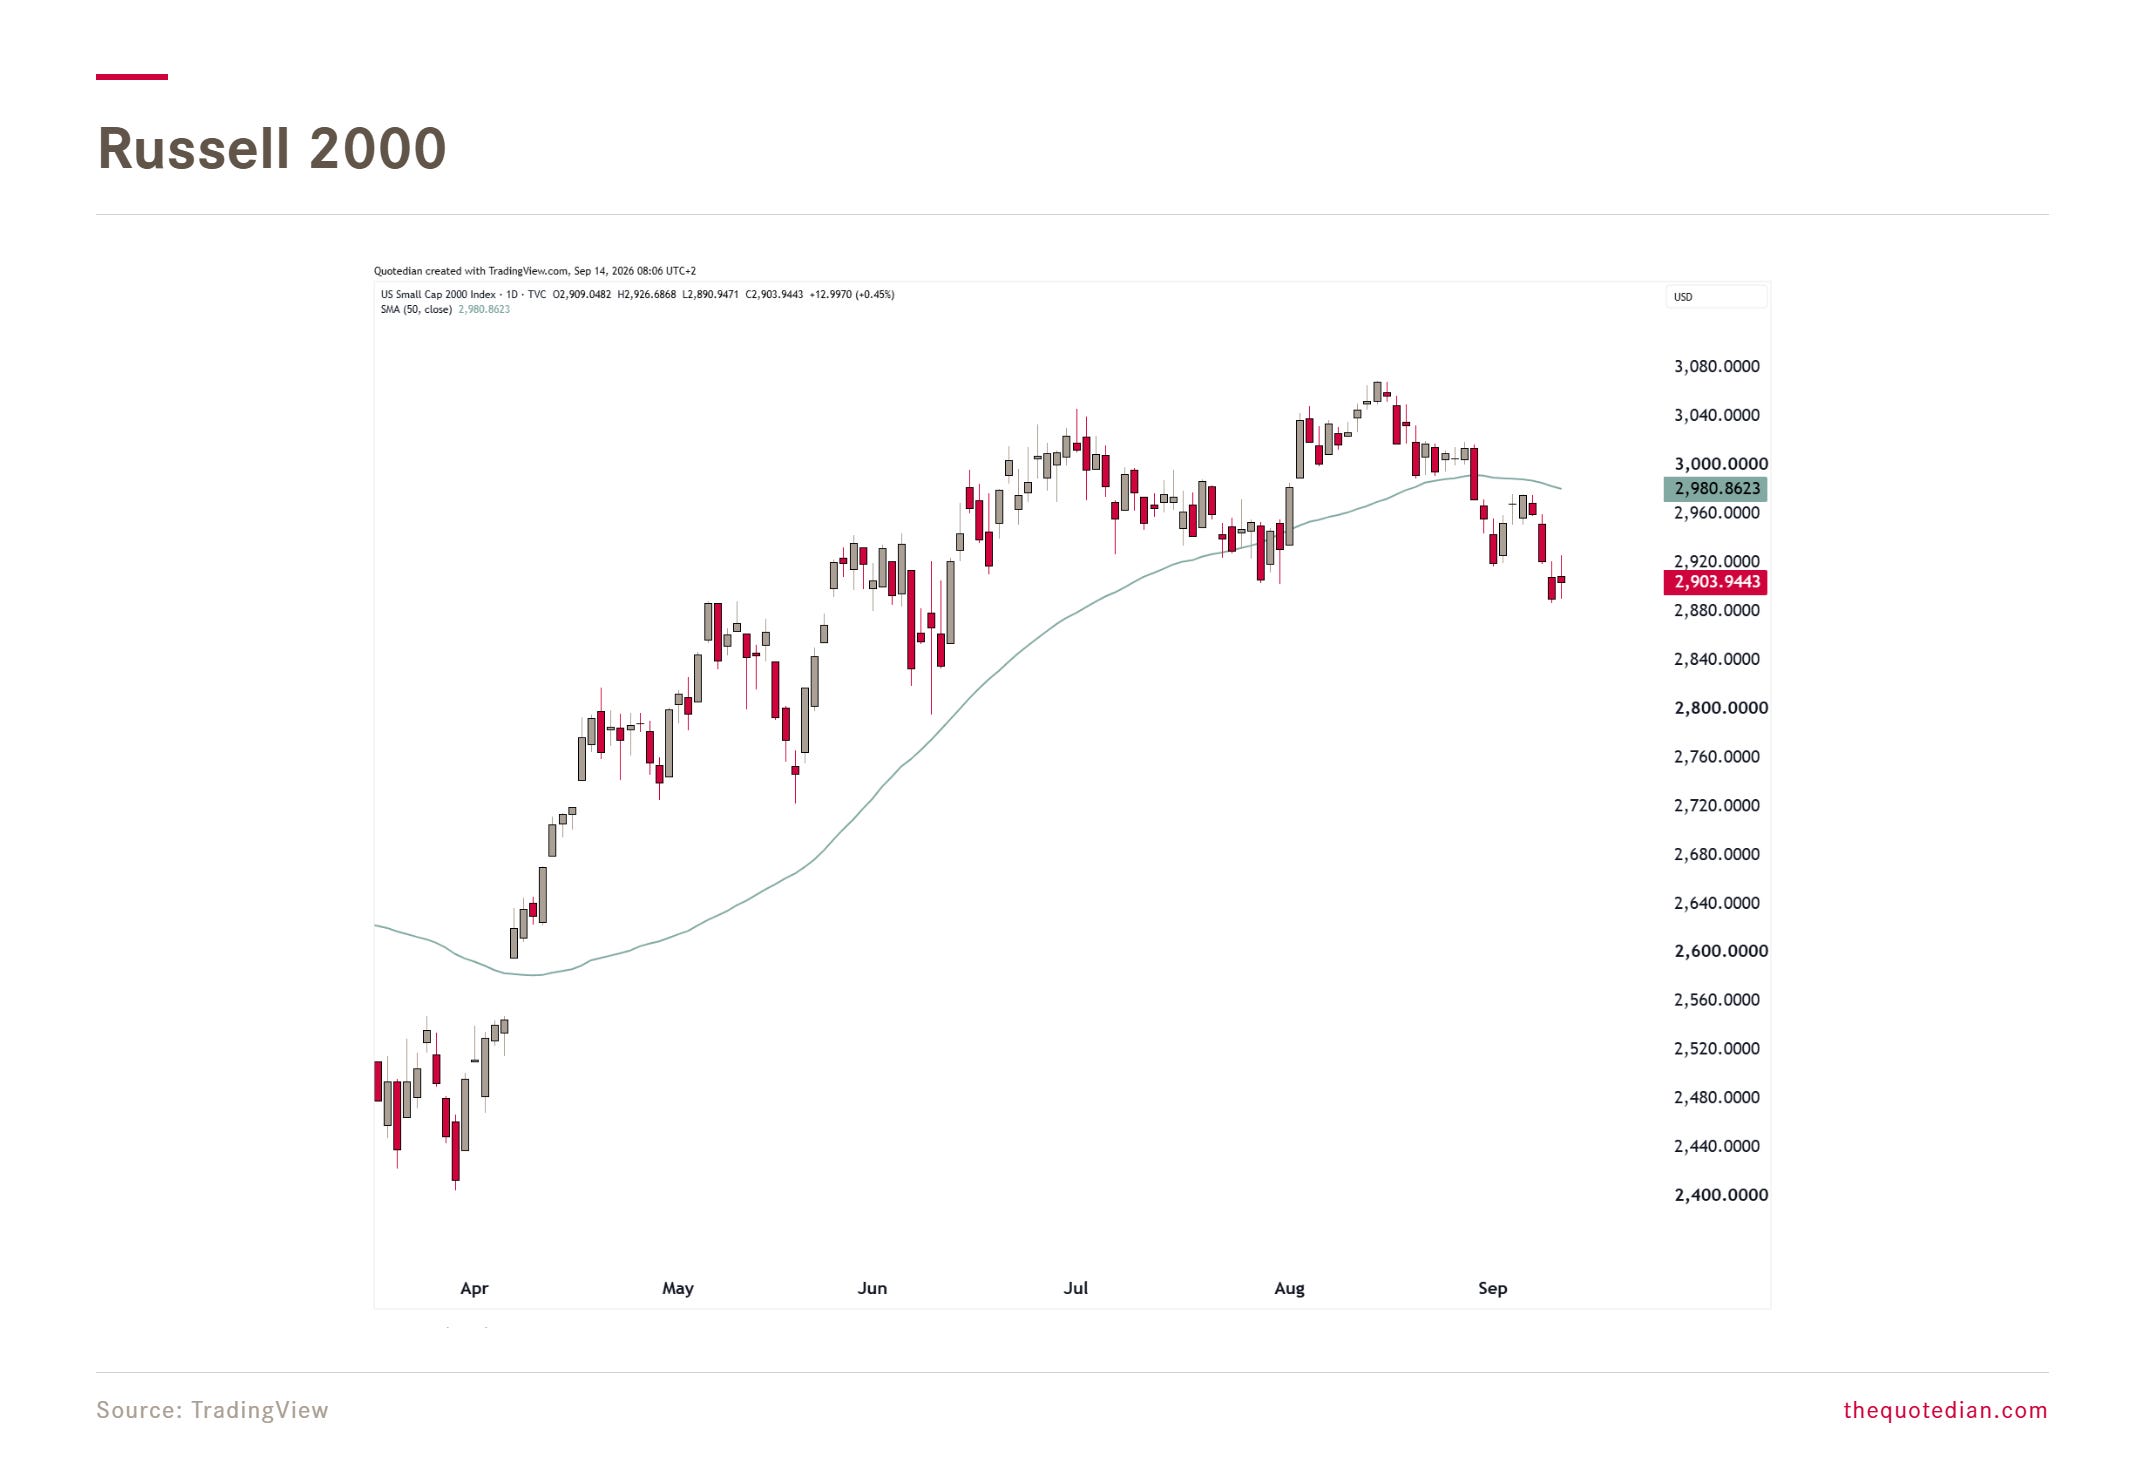
Small-cap stocks (Russell 2000) are not liking the prospect of a Fed tightening cycle:
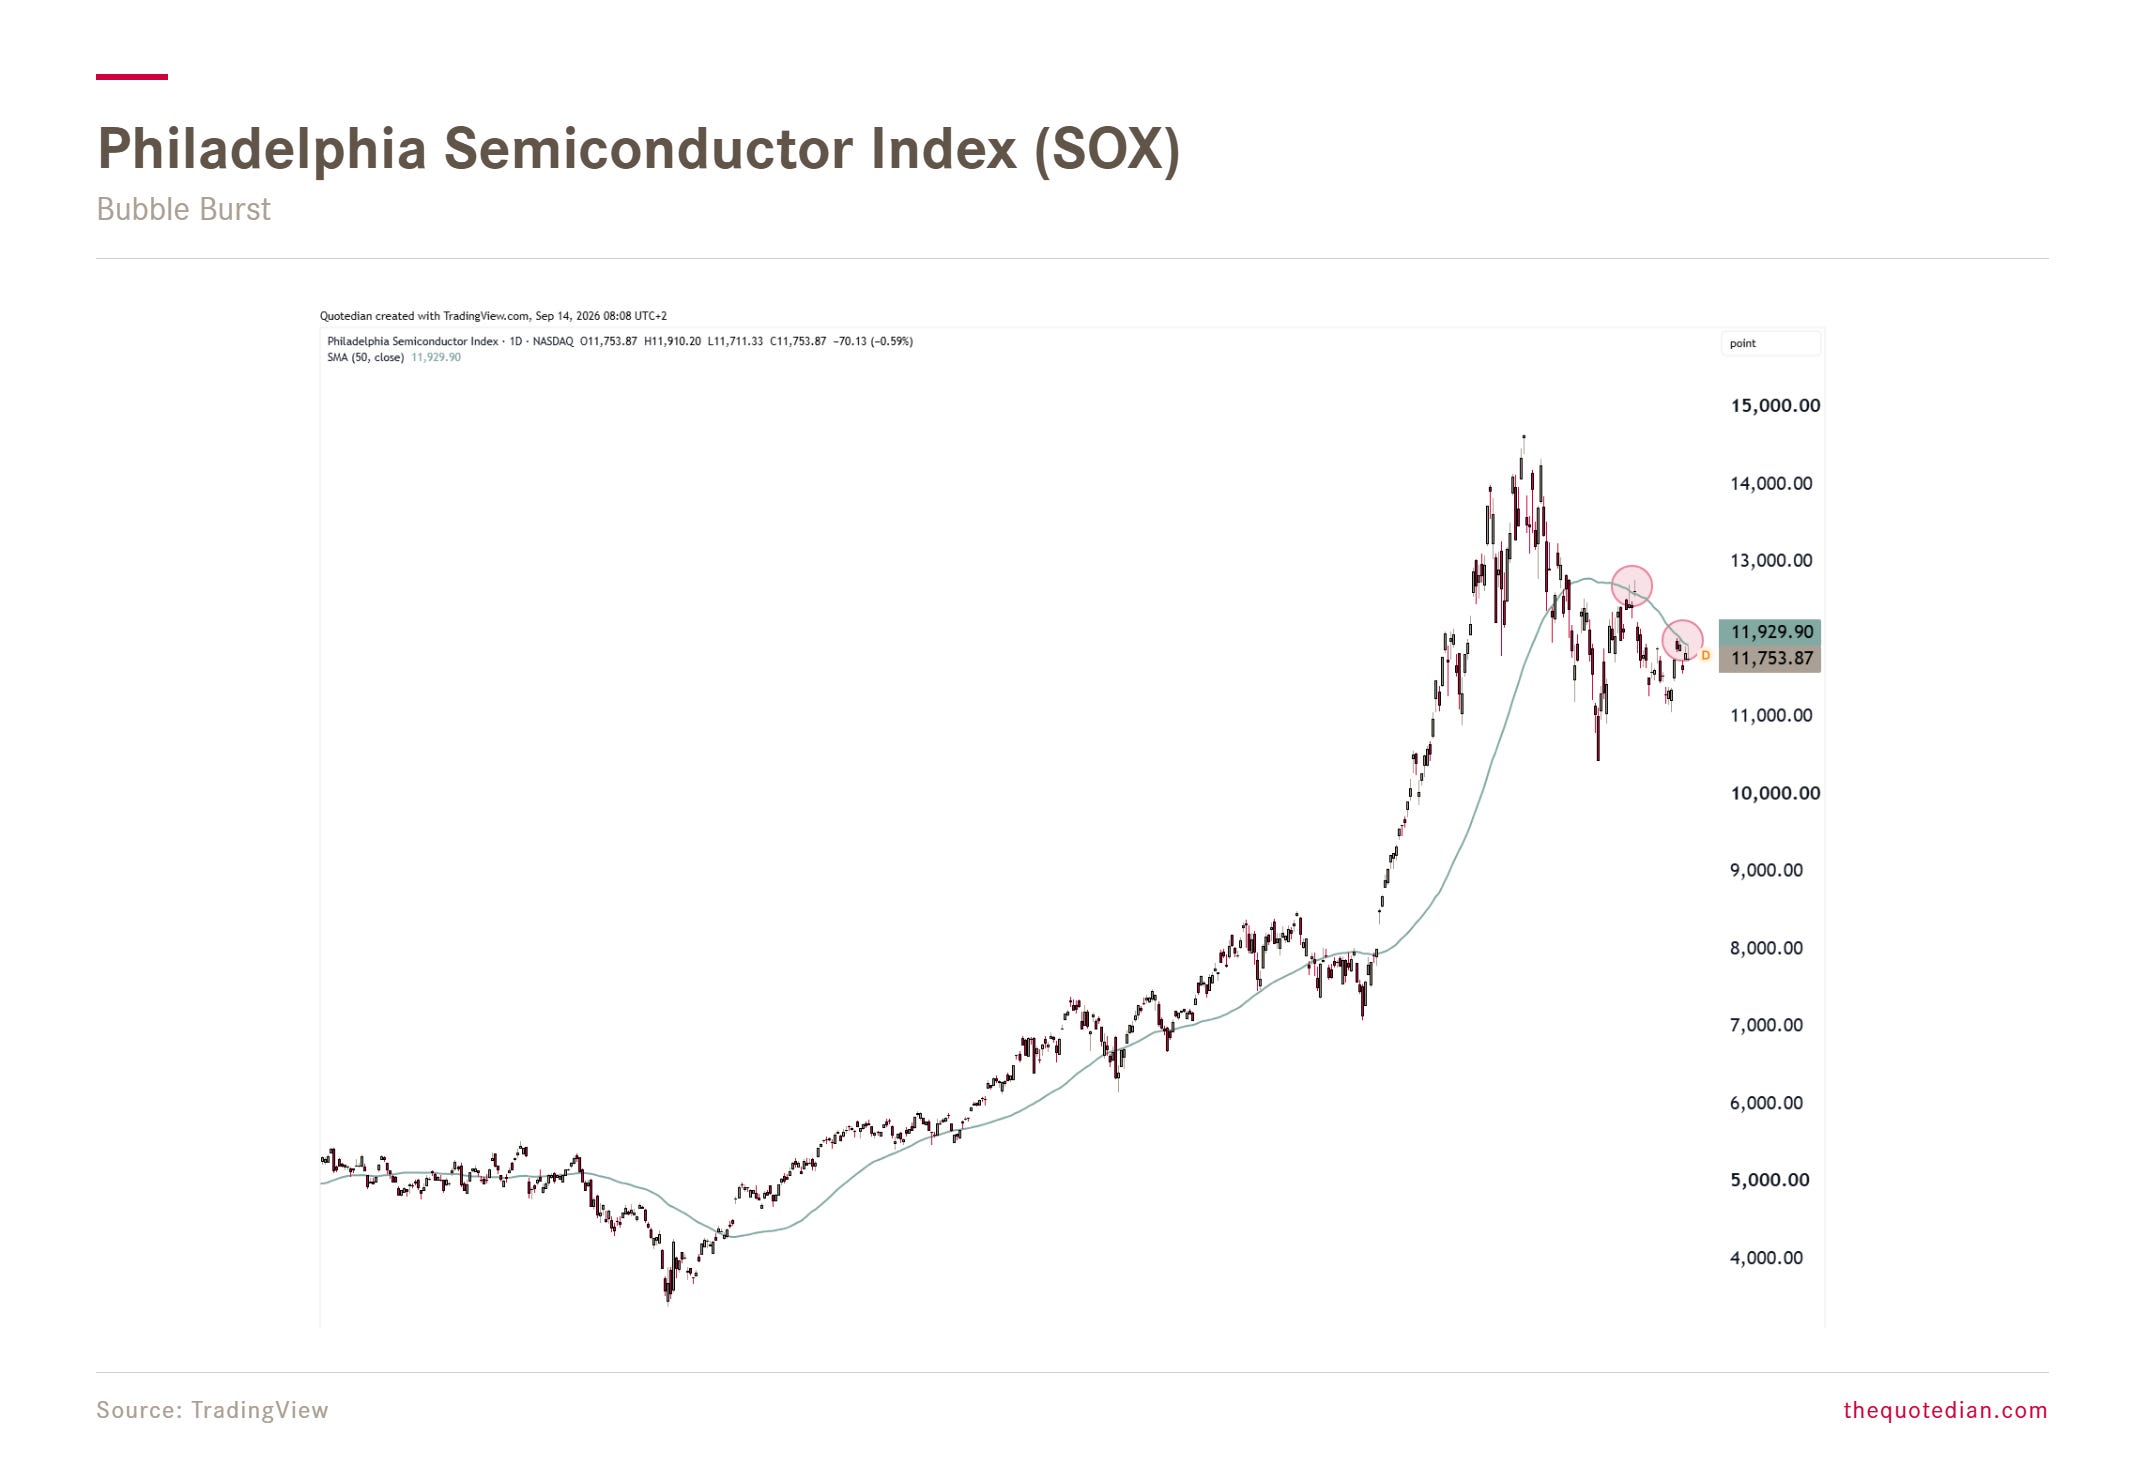
And the previous cycle leaders, semiconductor stocks, never found their way above the 50-day moving average again:
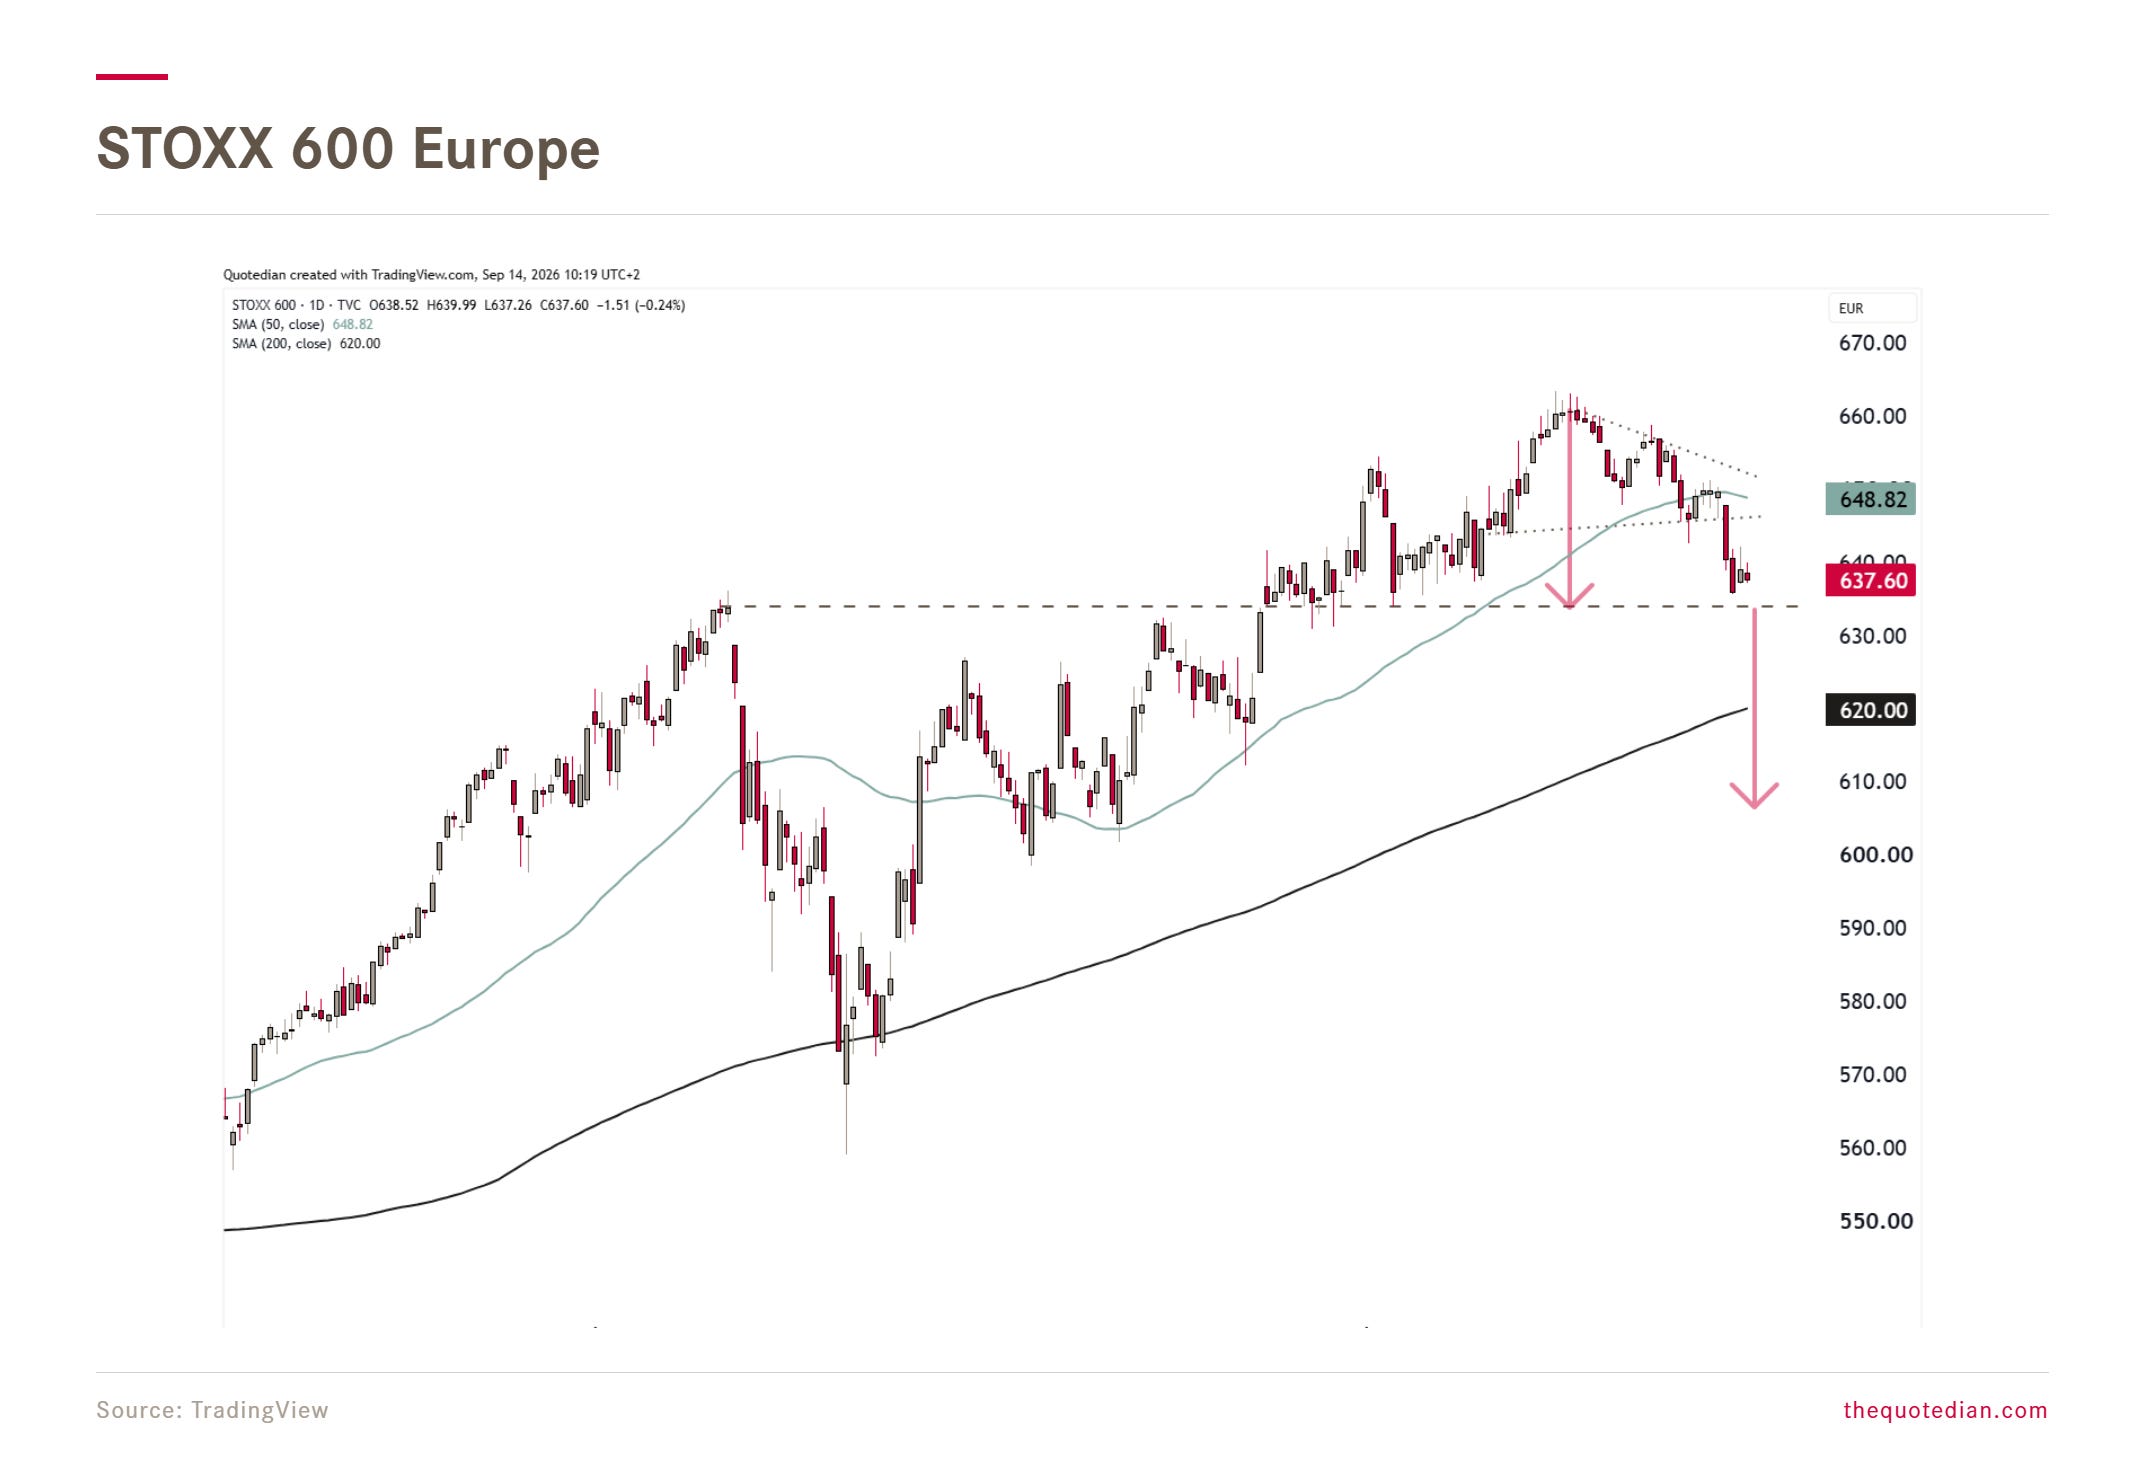
In Europe, stocks have fallen out of the consolidation triangle (dashed lines) on the ‘wrong’ side and are approaching key pivot point (dashed line) at 634:
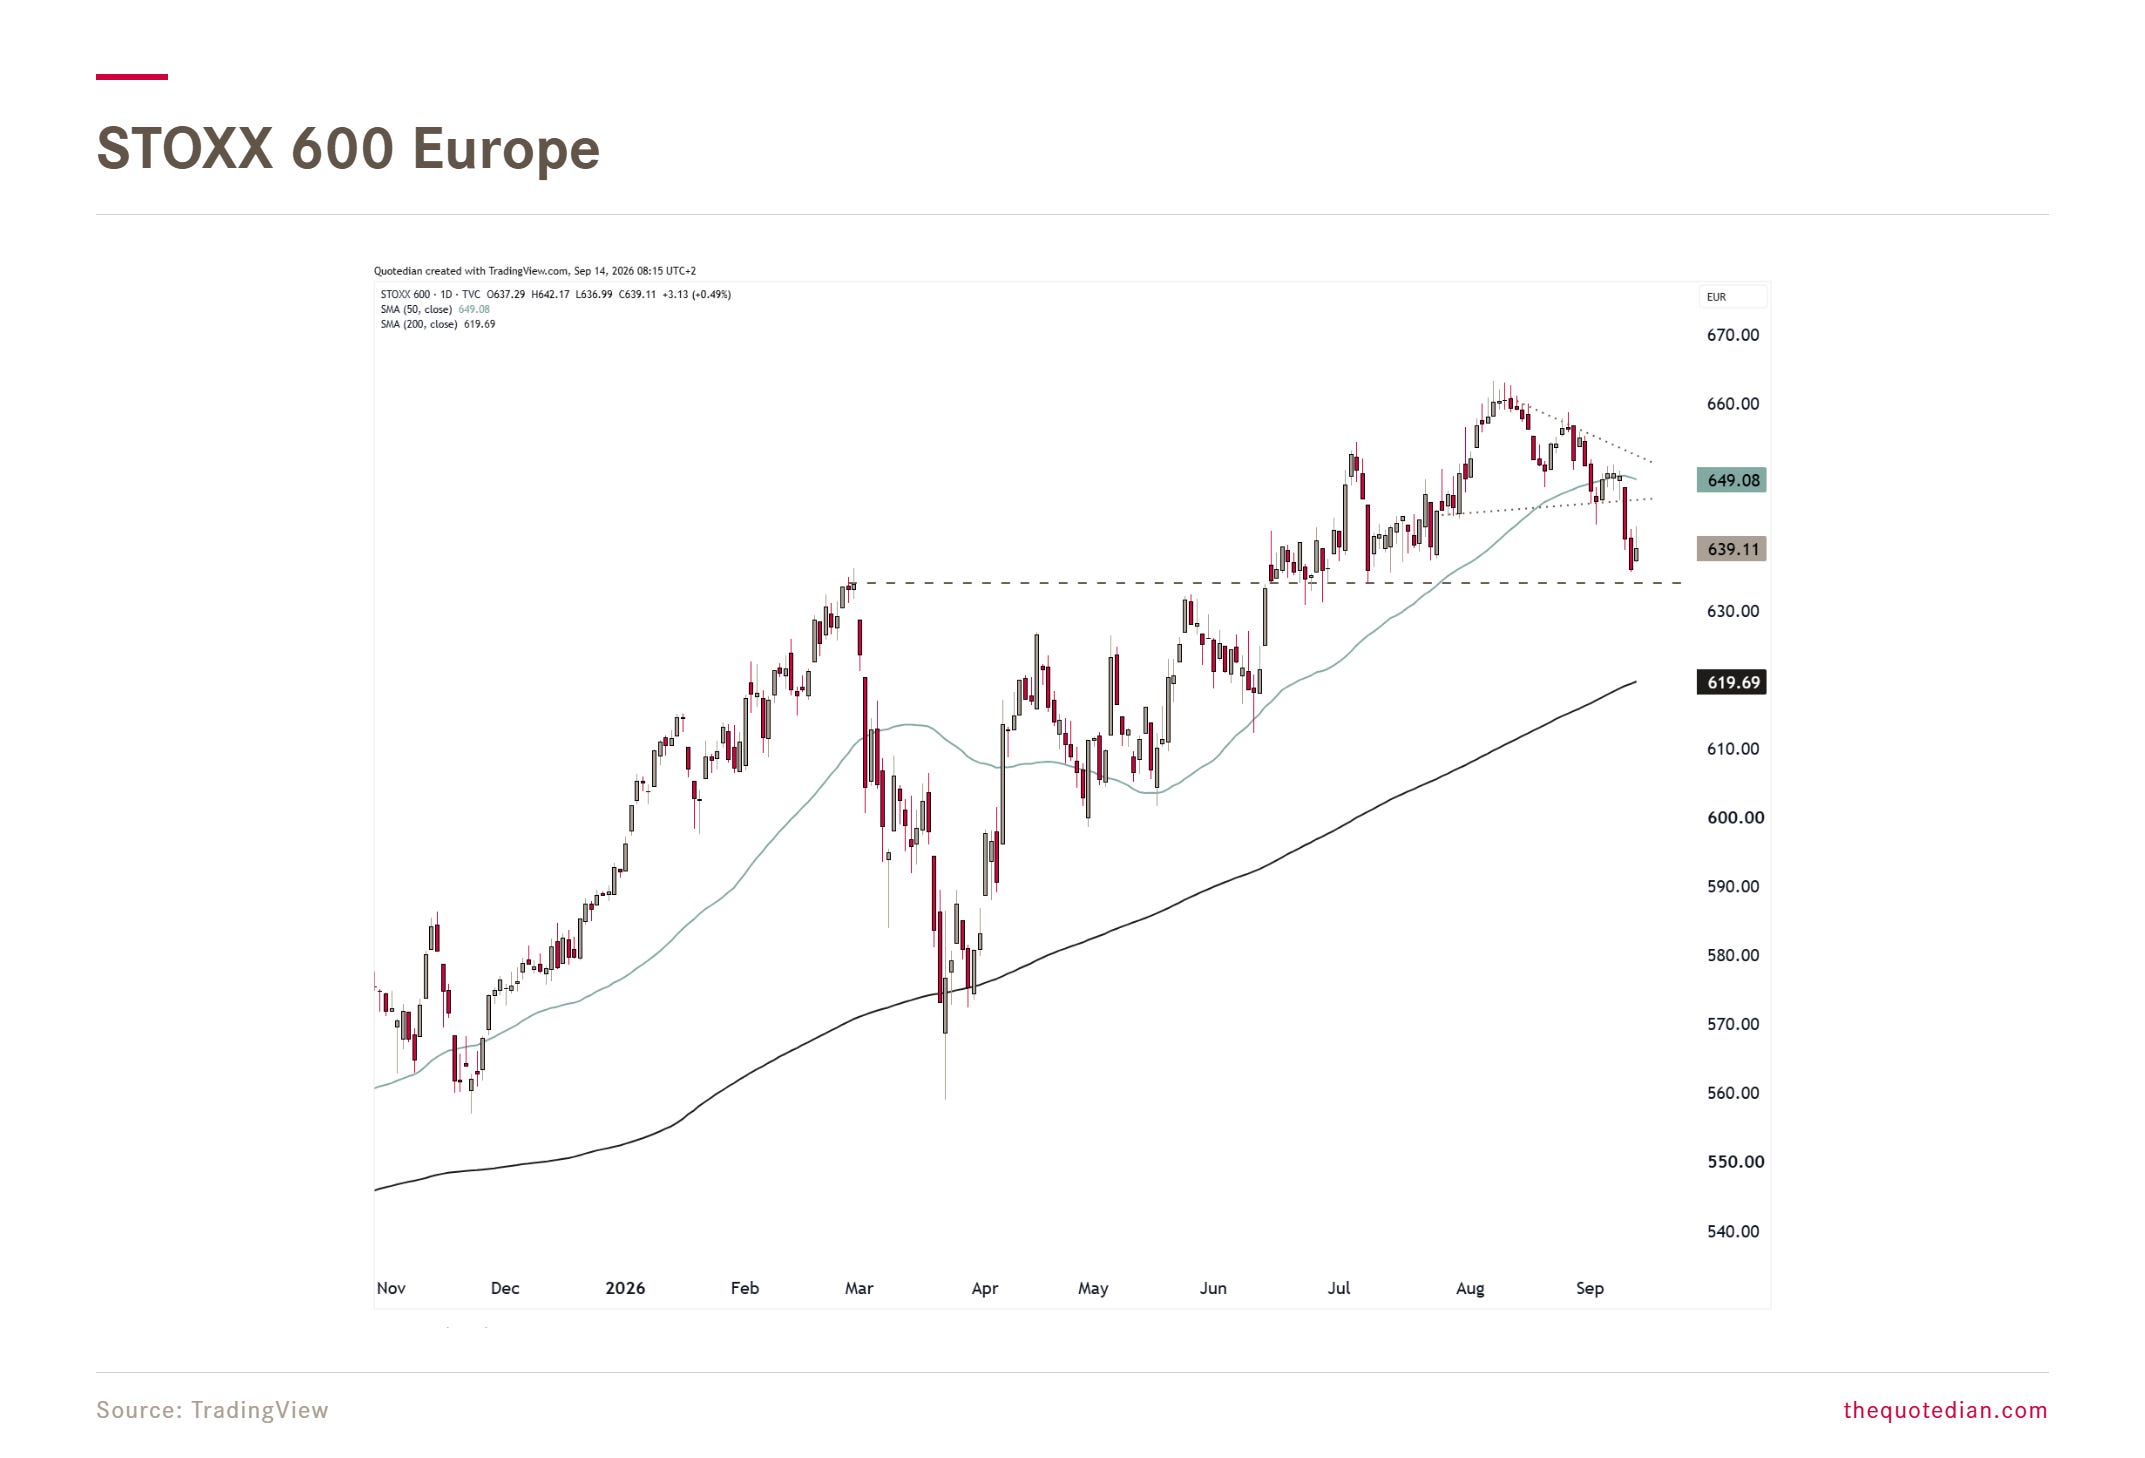
A break of that pivot(dashed line) could take the index down another extra 5% to below its 200-day MA:
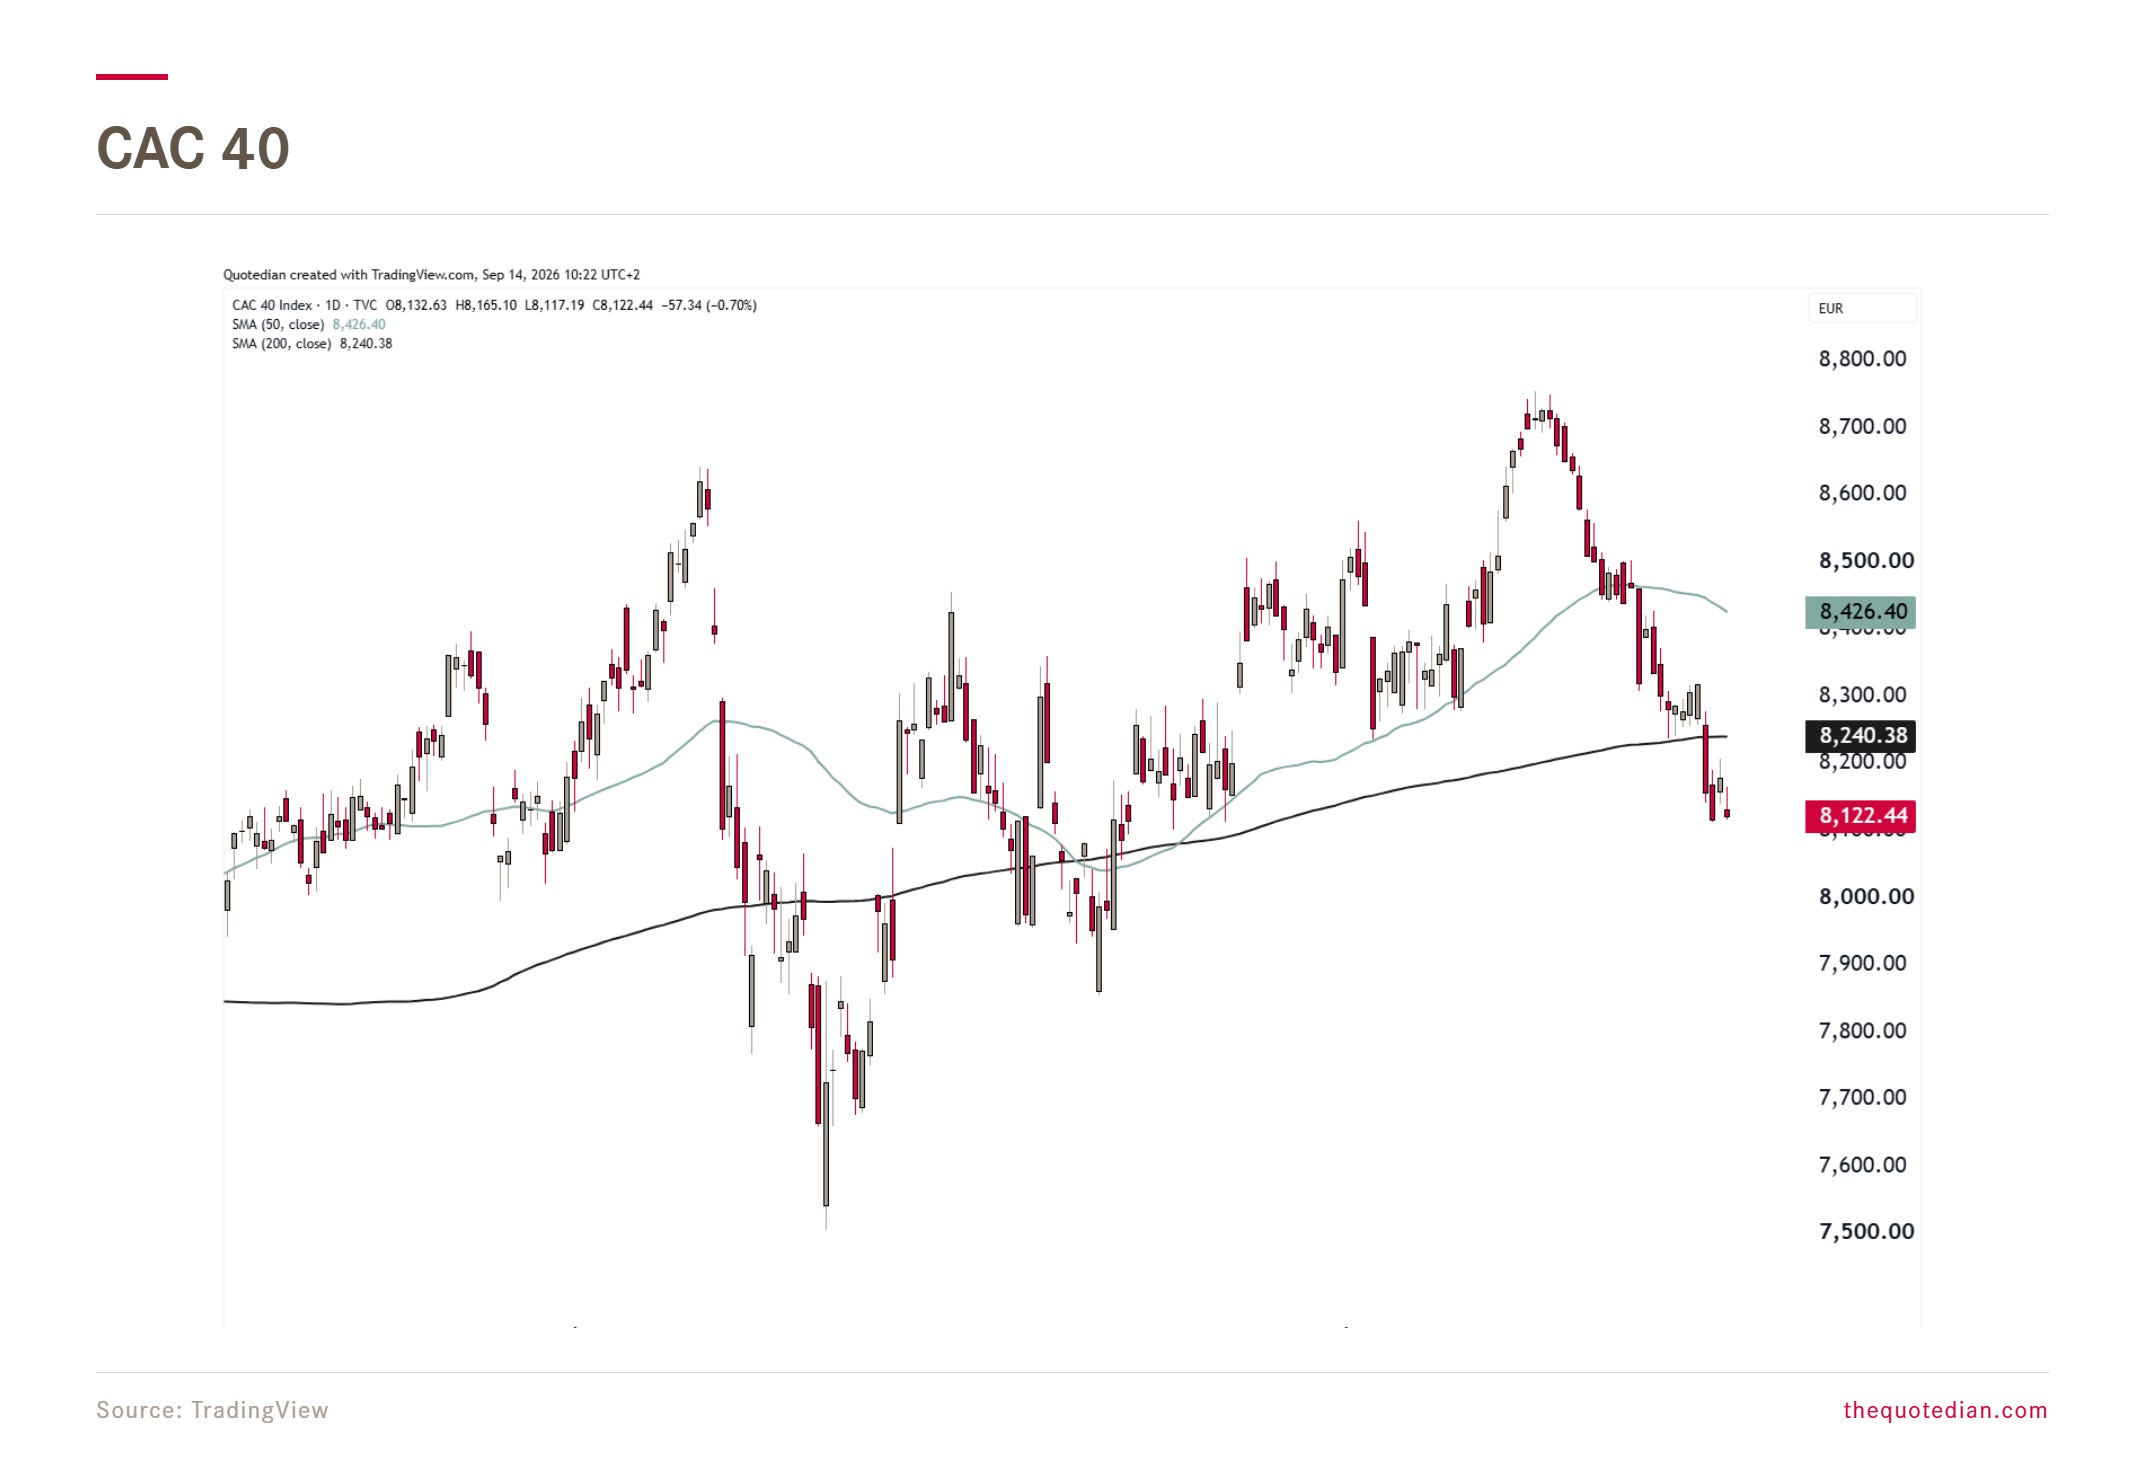
France’s CAC-40 is “ahead” of other European indices in that conxtext:
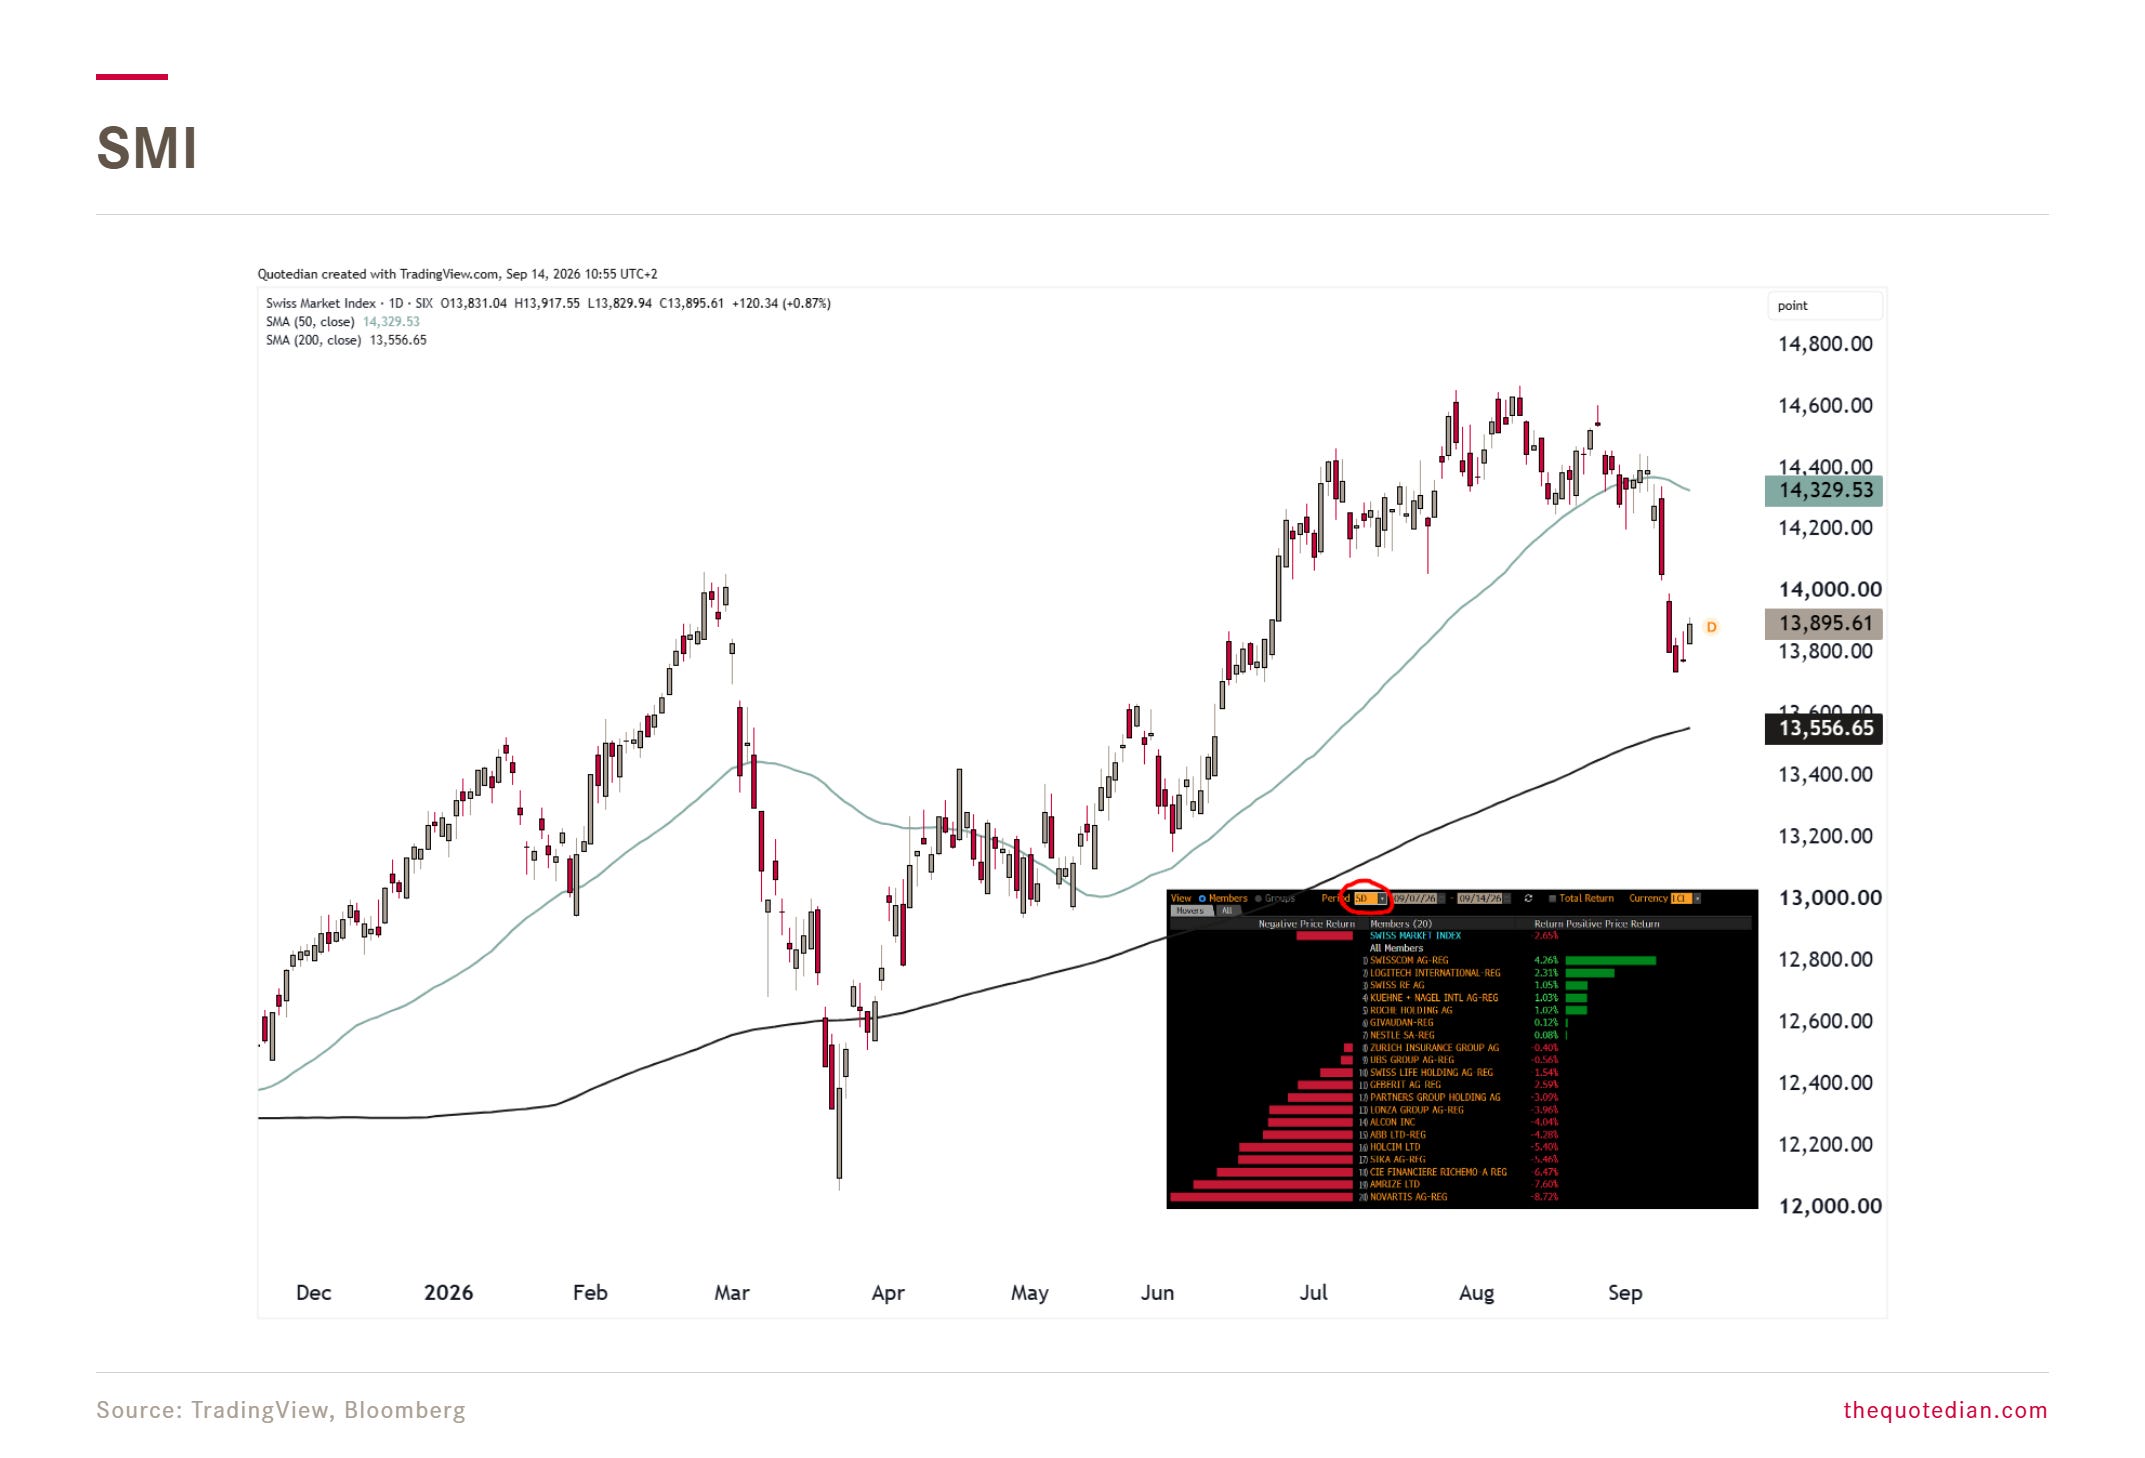
The SMI in Switzerland has been dragged down by bad news from index heavy-weight component (15%) Novartis:
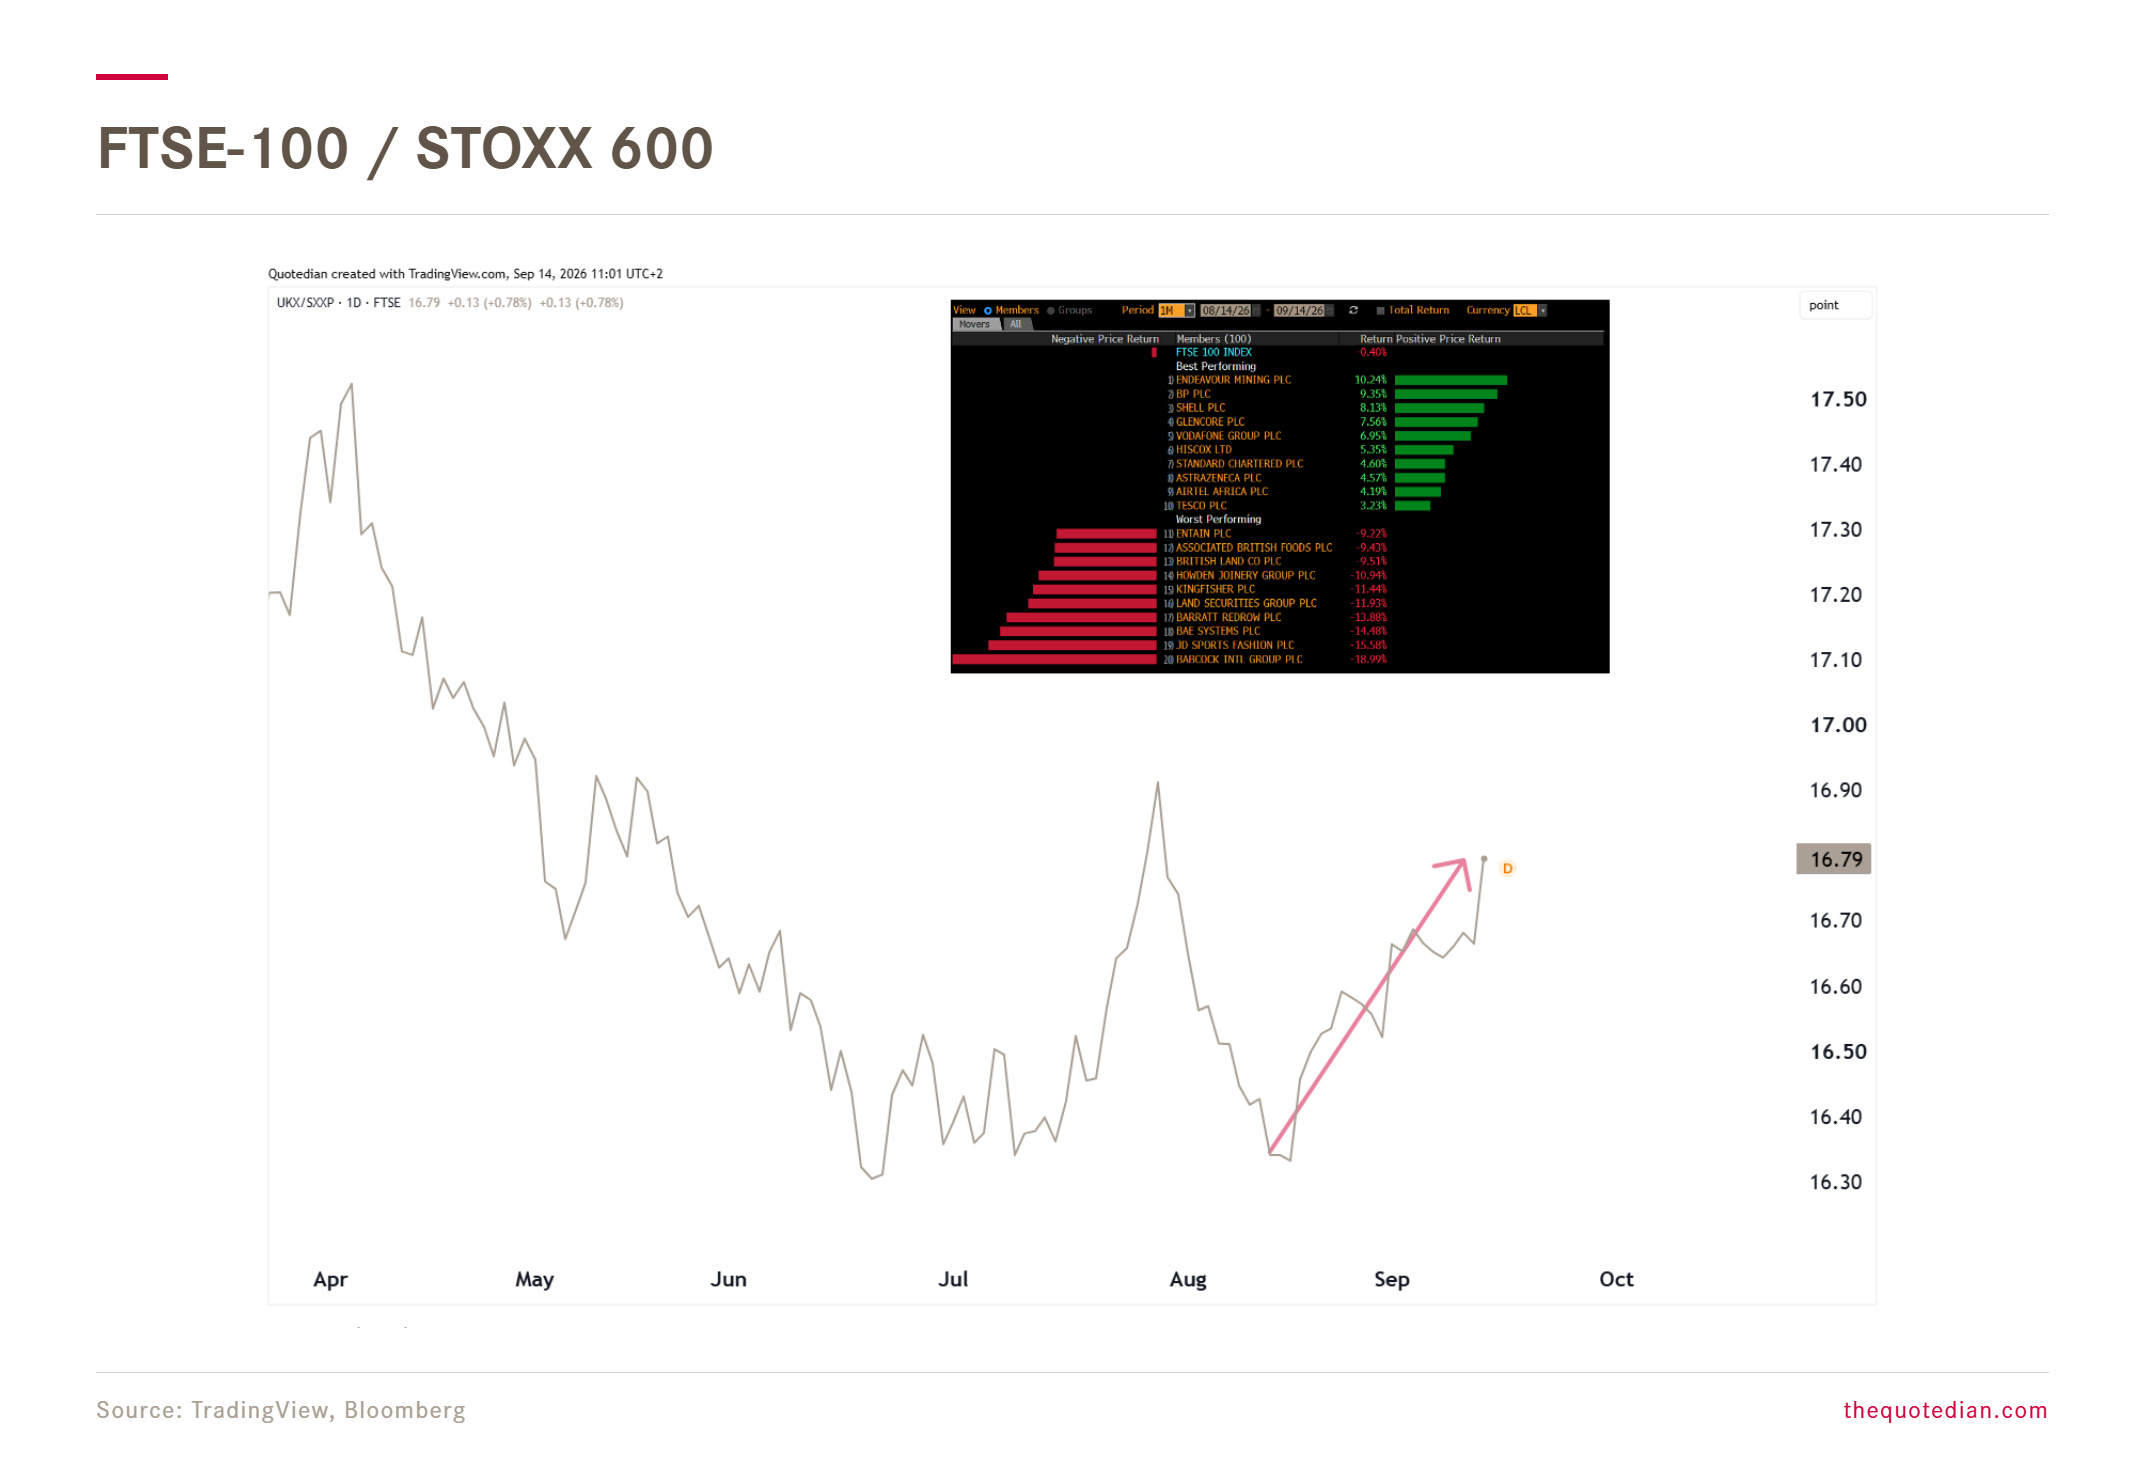
On the other side, the Footsie 100 has turned into a relative outperformer, mostly thanks to its above-average exposure to oil and mining stocks:
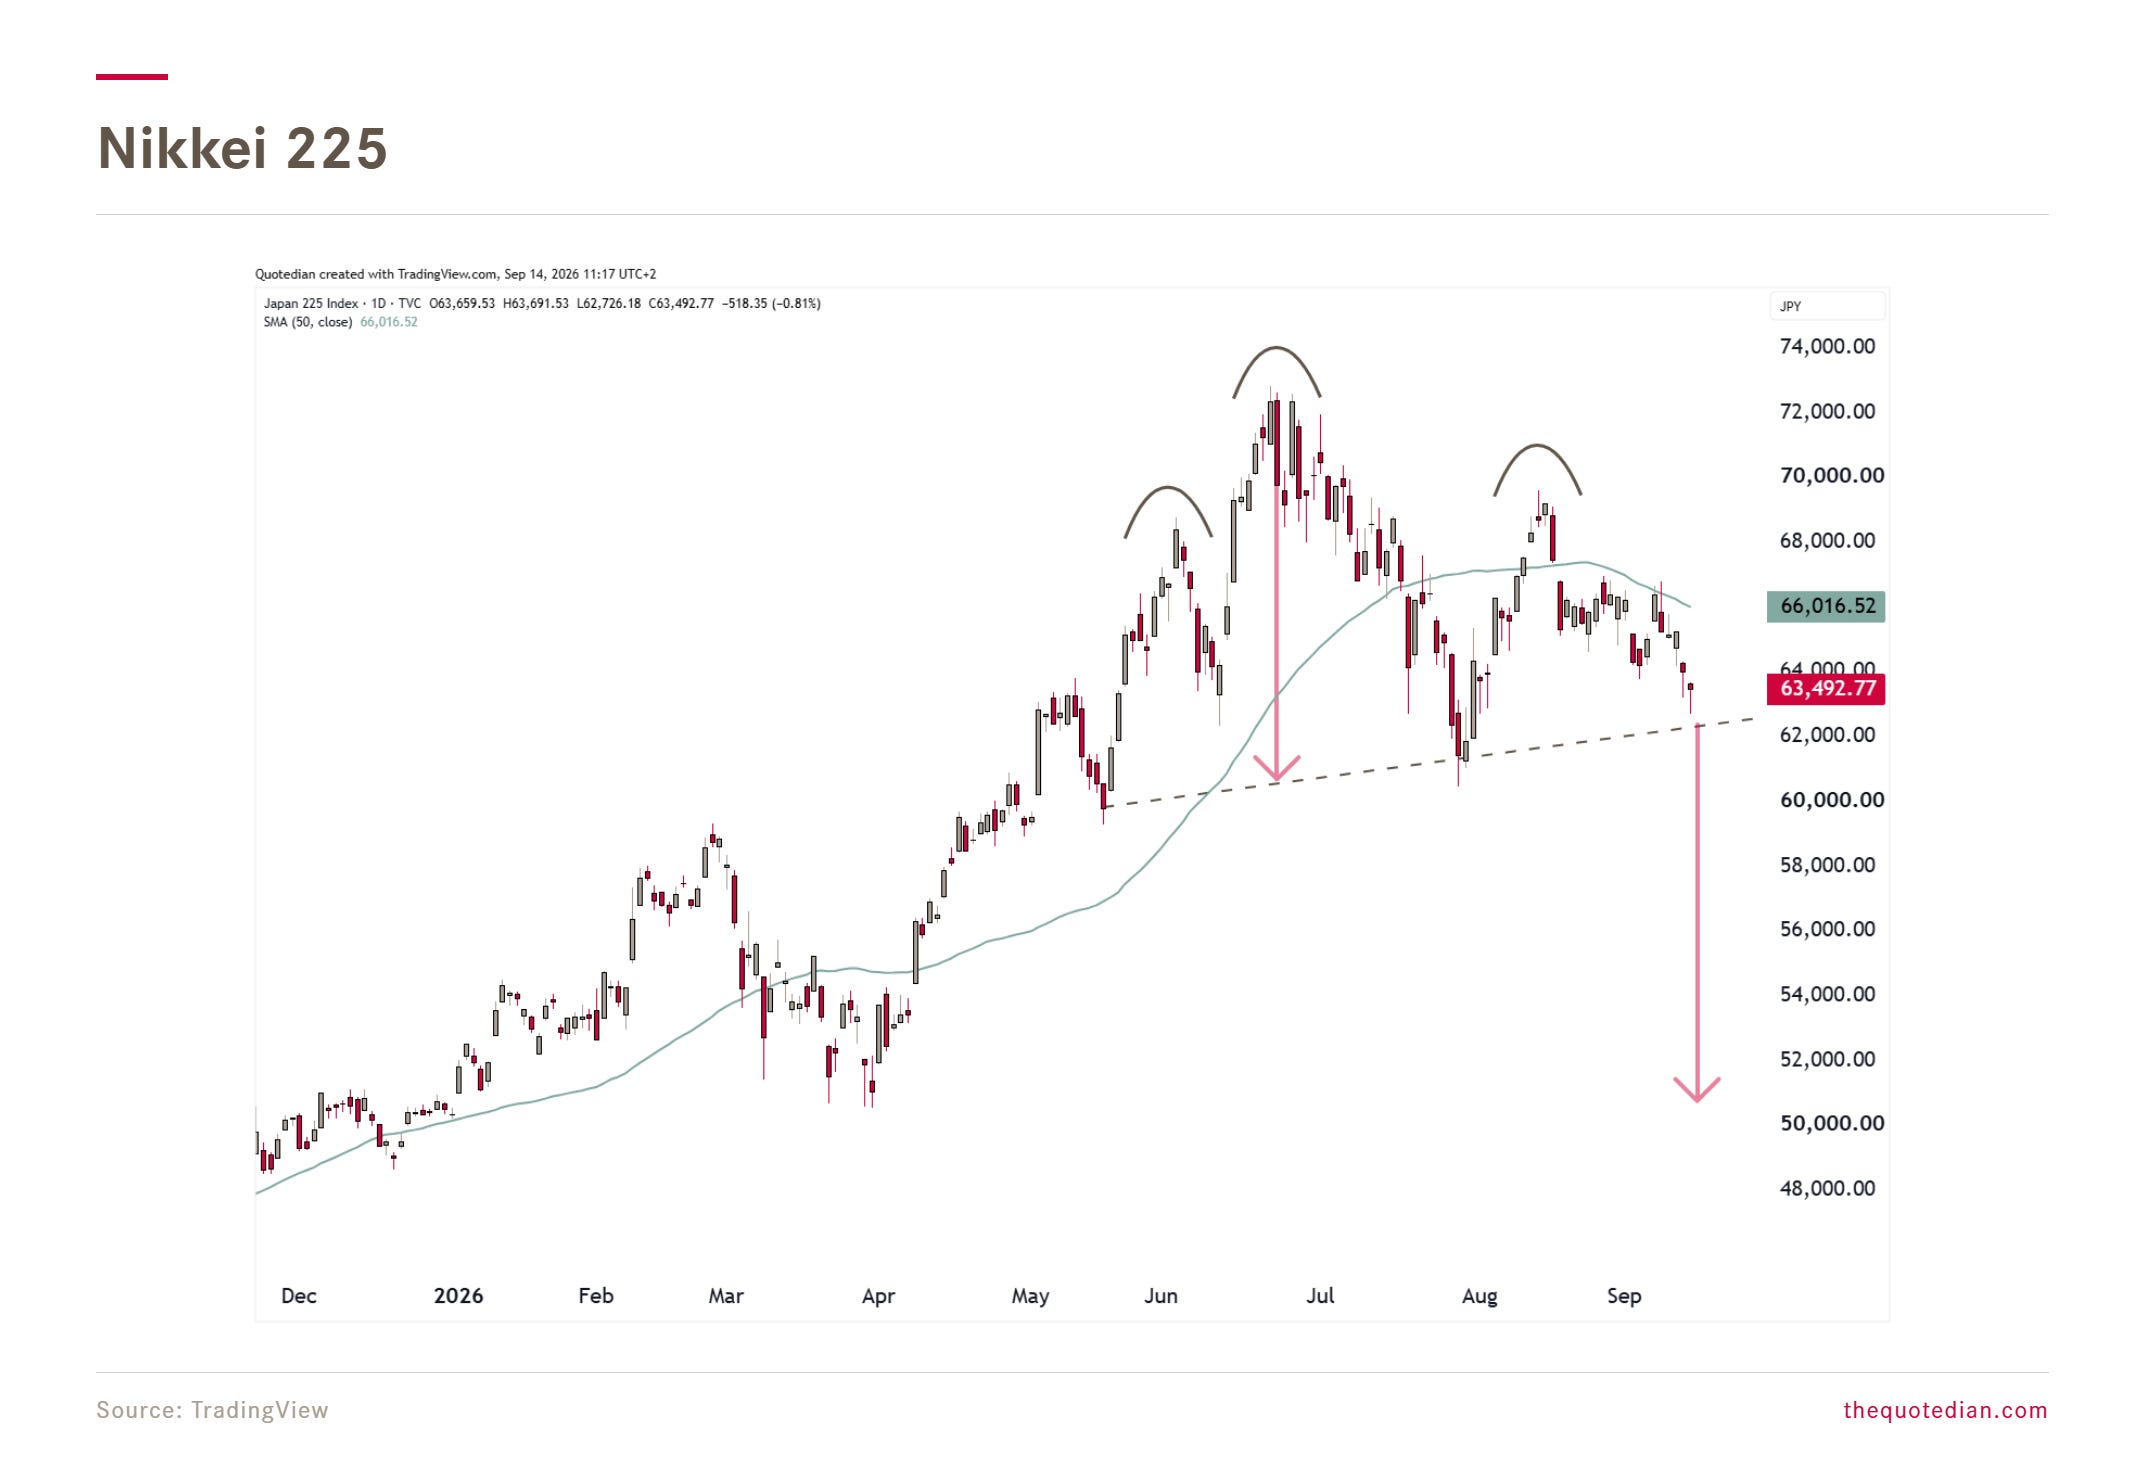
In Asia, Japan’s Nikkei 225 index is at danger of completing a shoulder-head-shoulder trend reversal pattern, which could take the index down to 50k should the neckline (dashed) be broken:
All hopes on the broader Topix then, which continues to look more constructive then the N225:
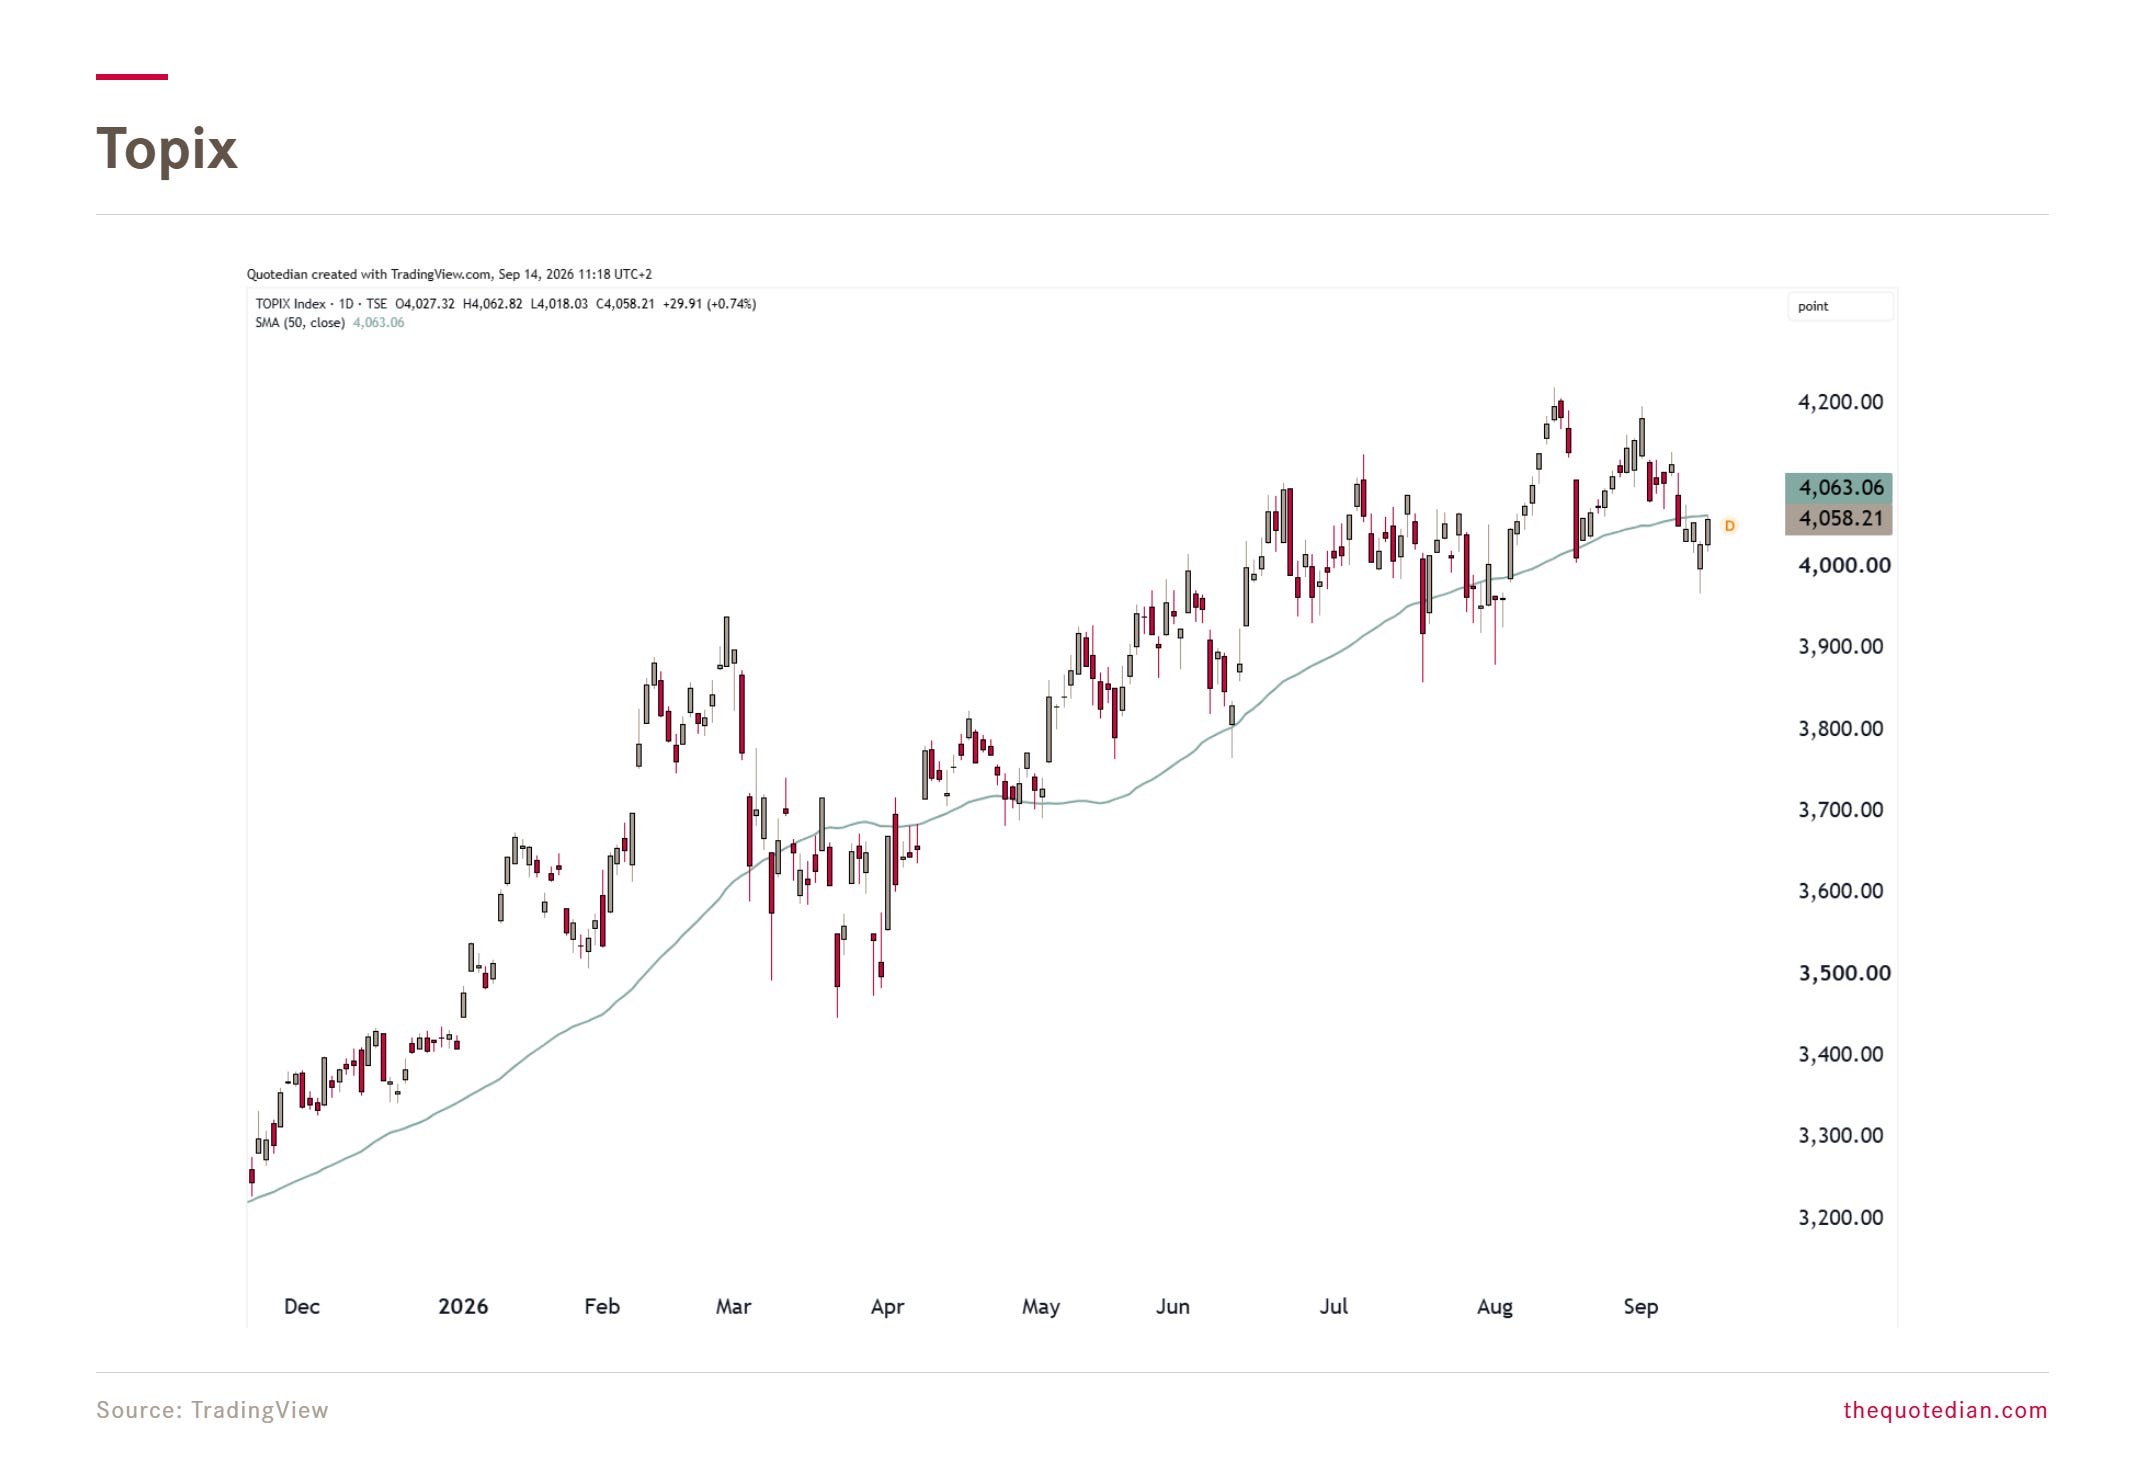
However, this index too is currently trading below its 50-day MA…
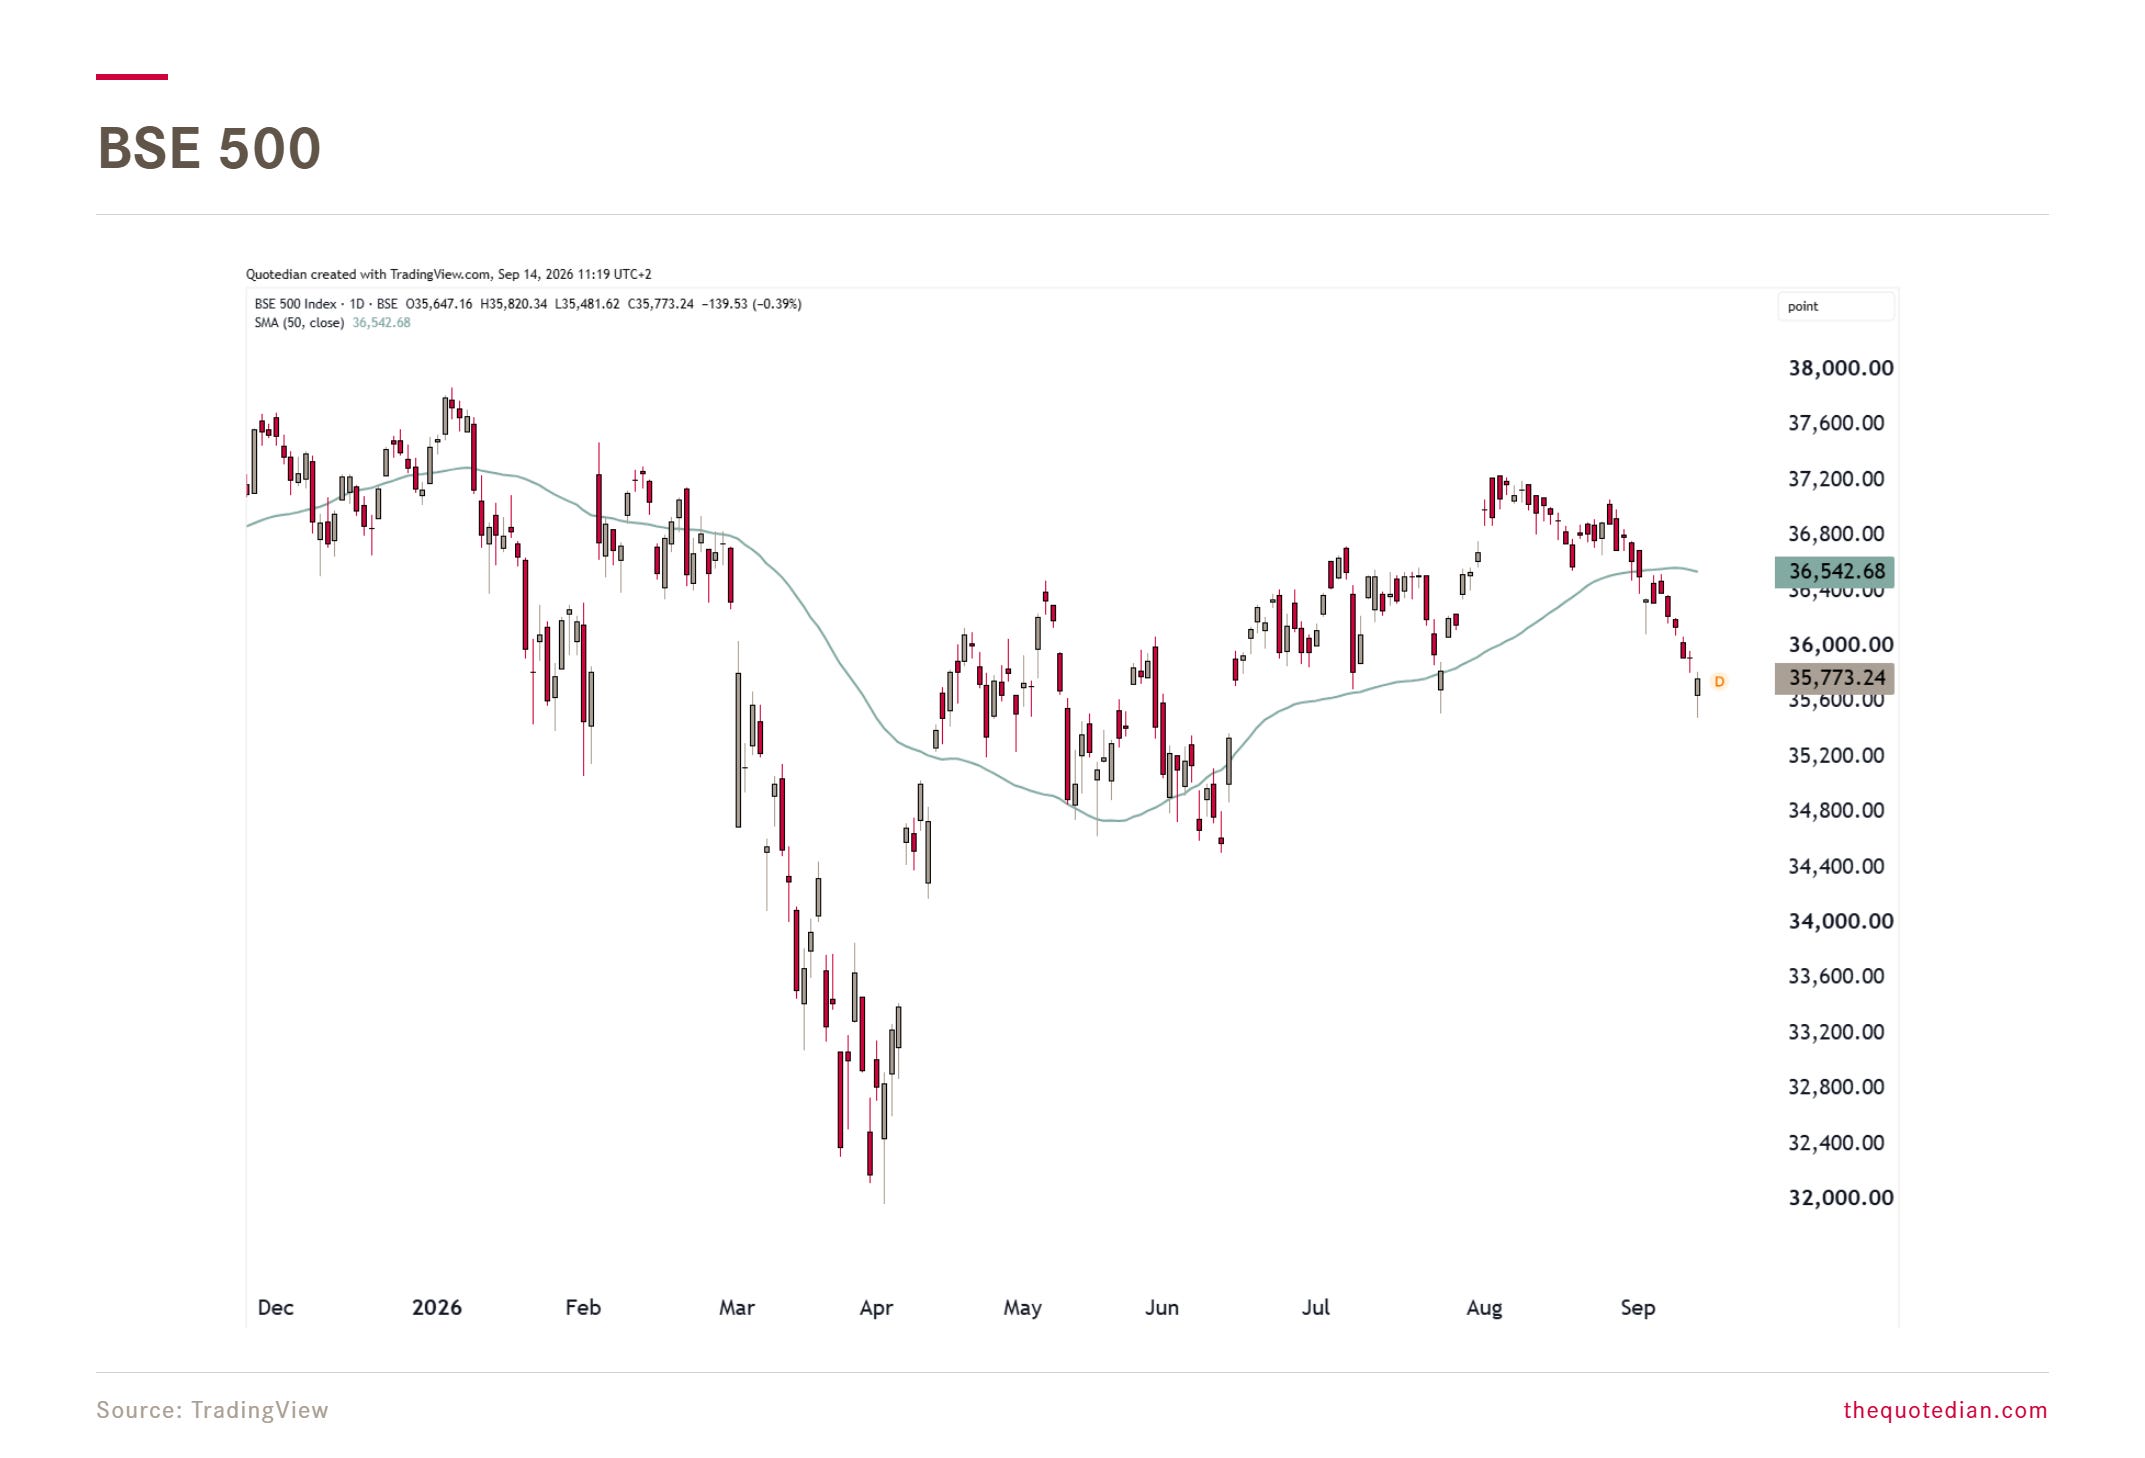
The Indian stock market continues to disappoint, as the country is facing kind of a double-whammy from higher oil prices and the AI-shock to its service oriented economic:
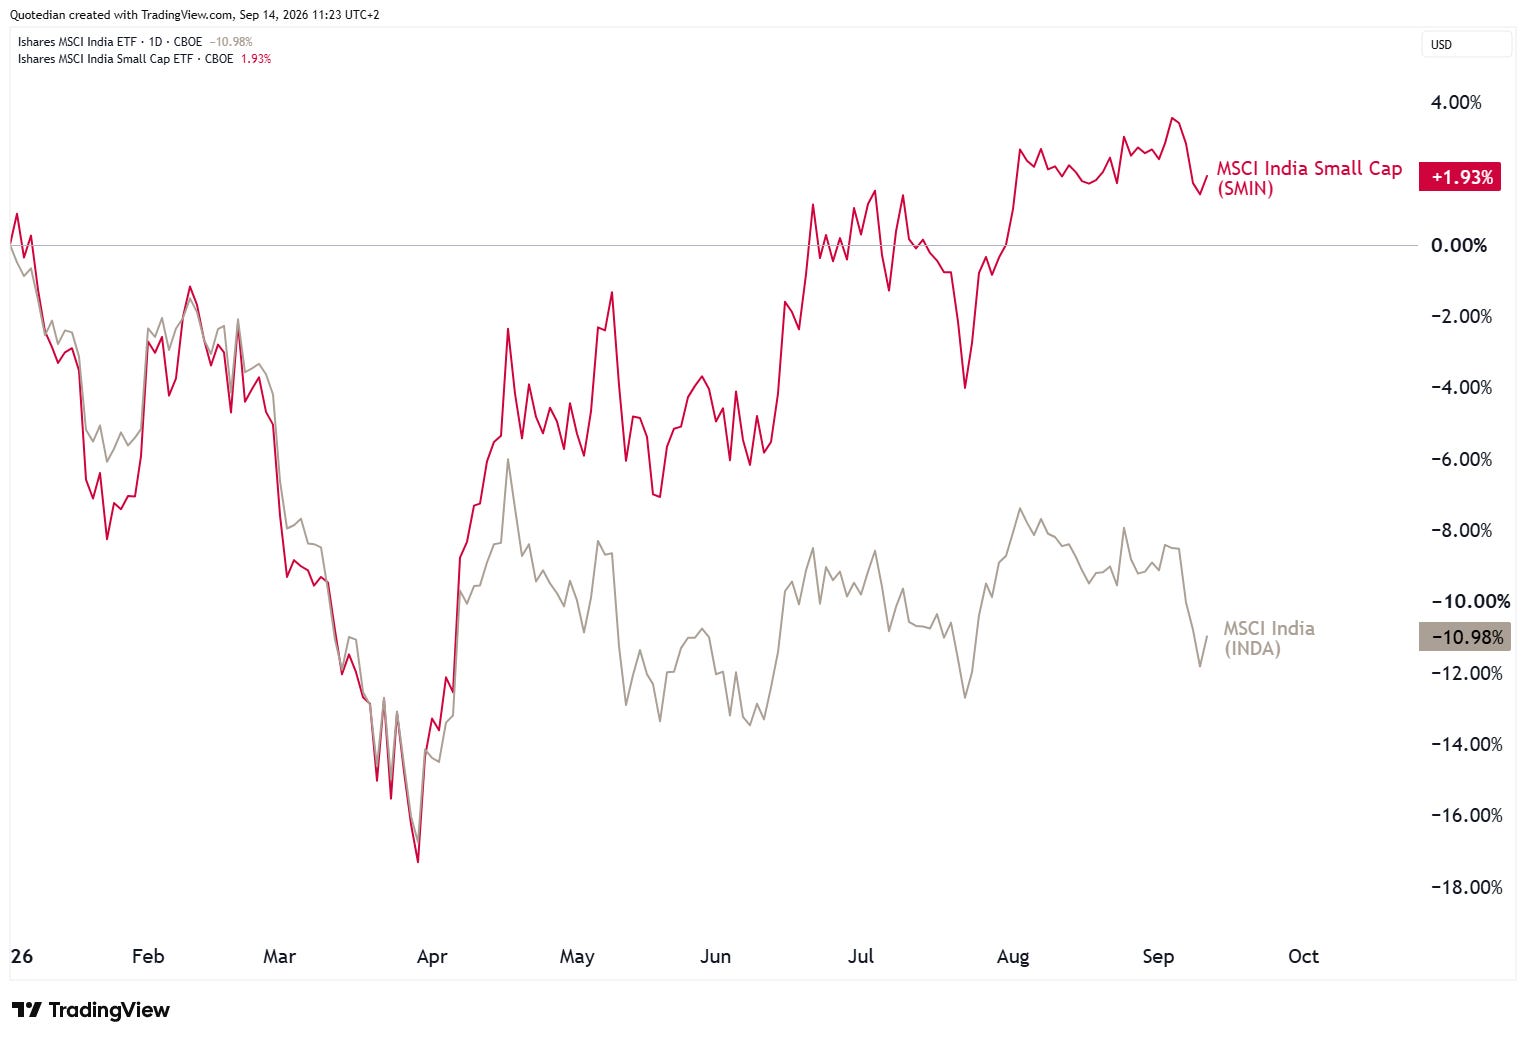
However, there is a ray of light from Indian small caps, which are performing pretty decently in comparison to their large-cap bros:
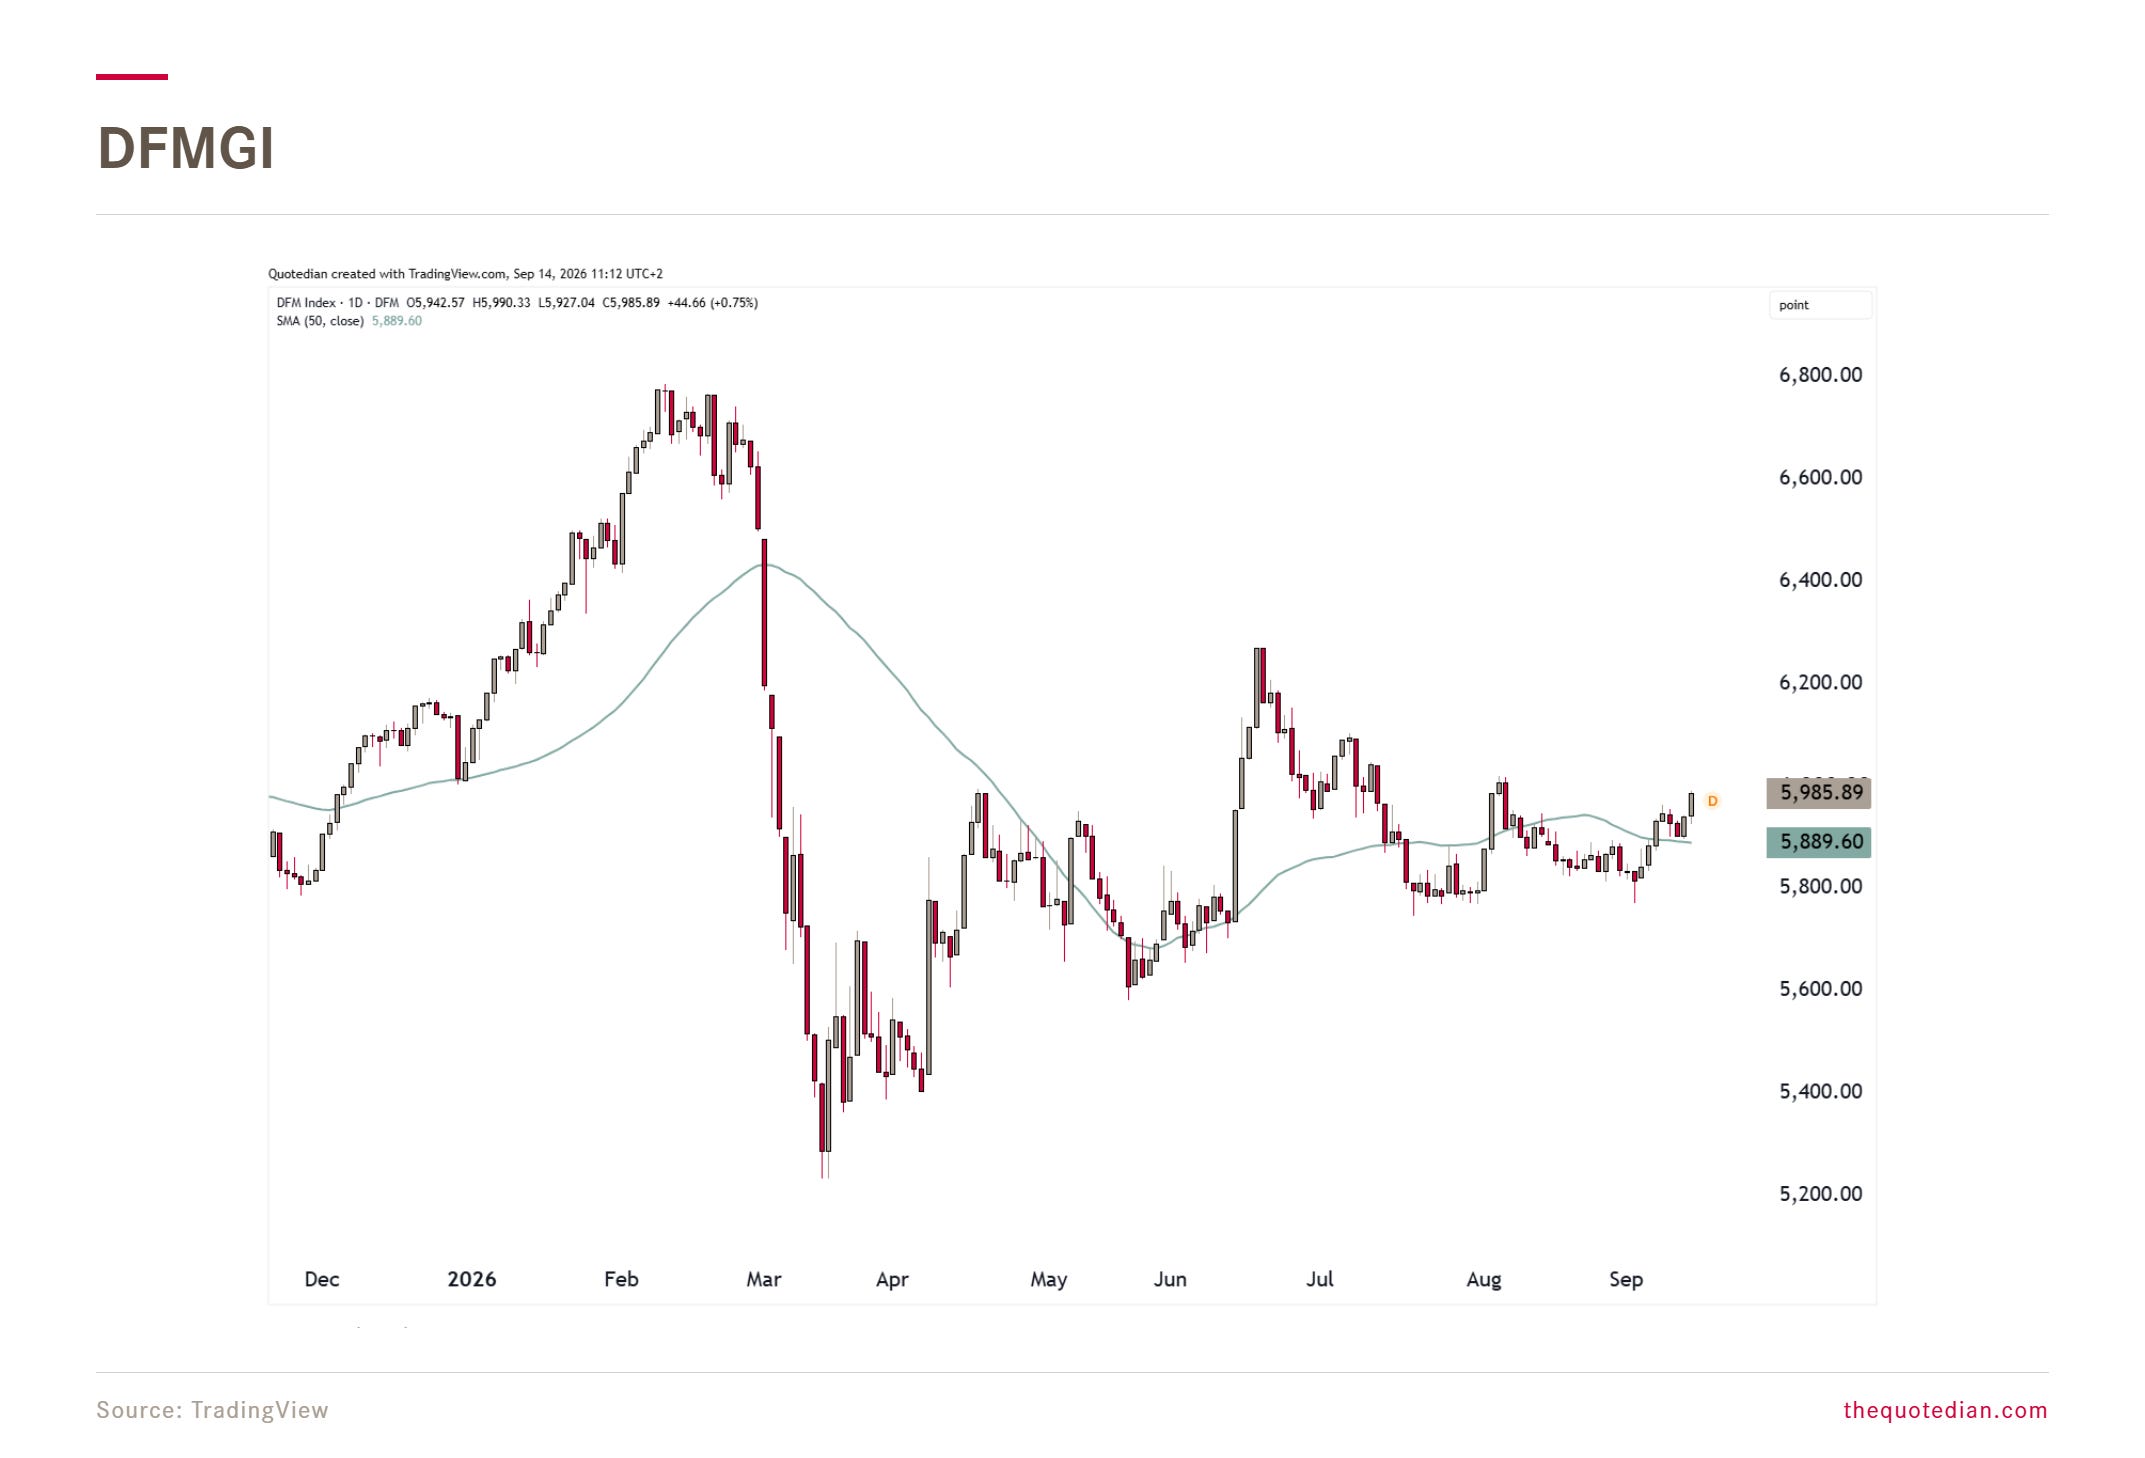
Dubai’s DFMGI is surprisingly resilient, considering the economic impact the argument between Iran and the US must have on the wider region:
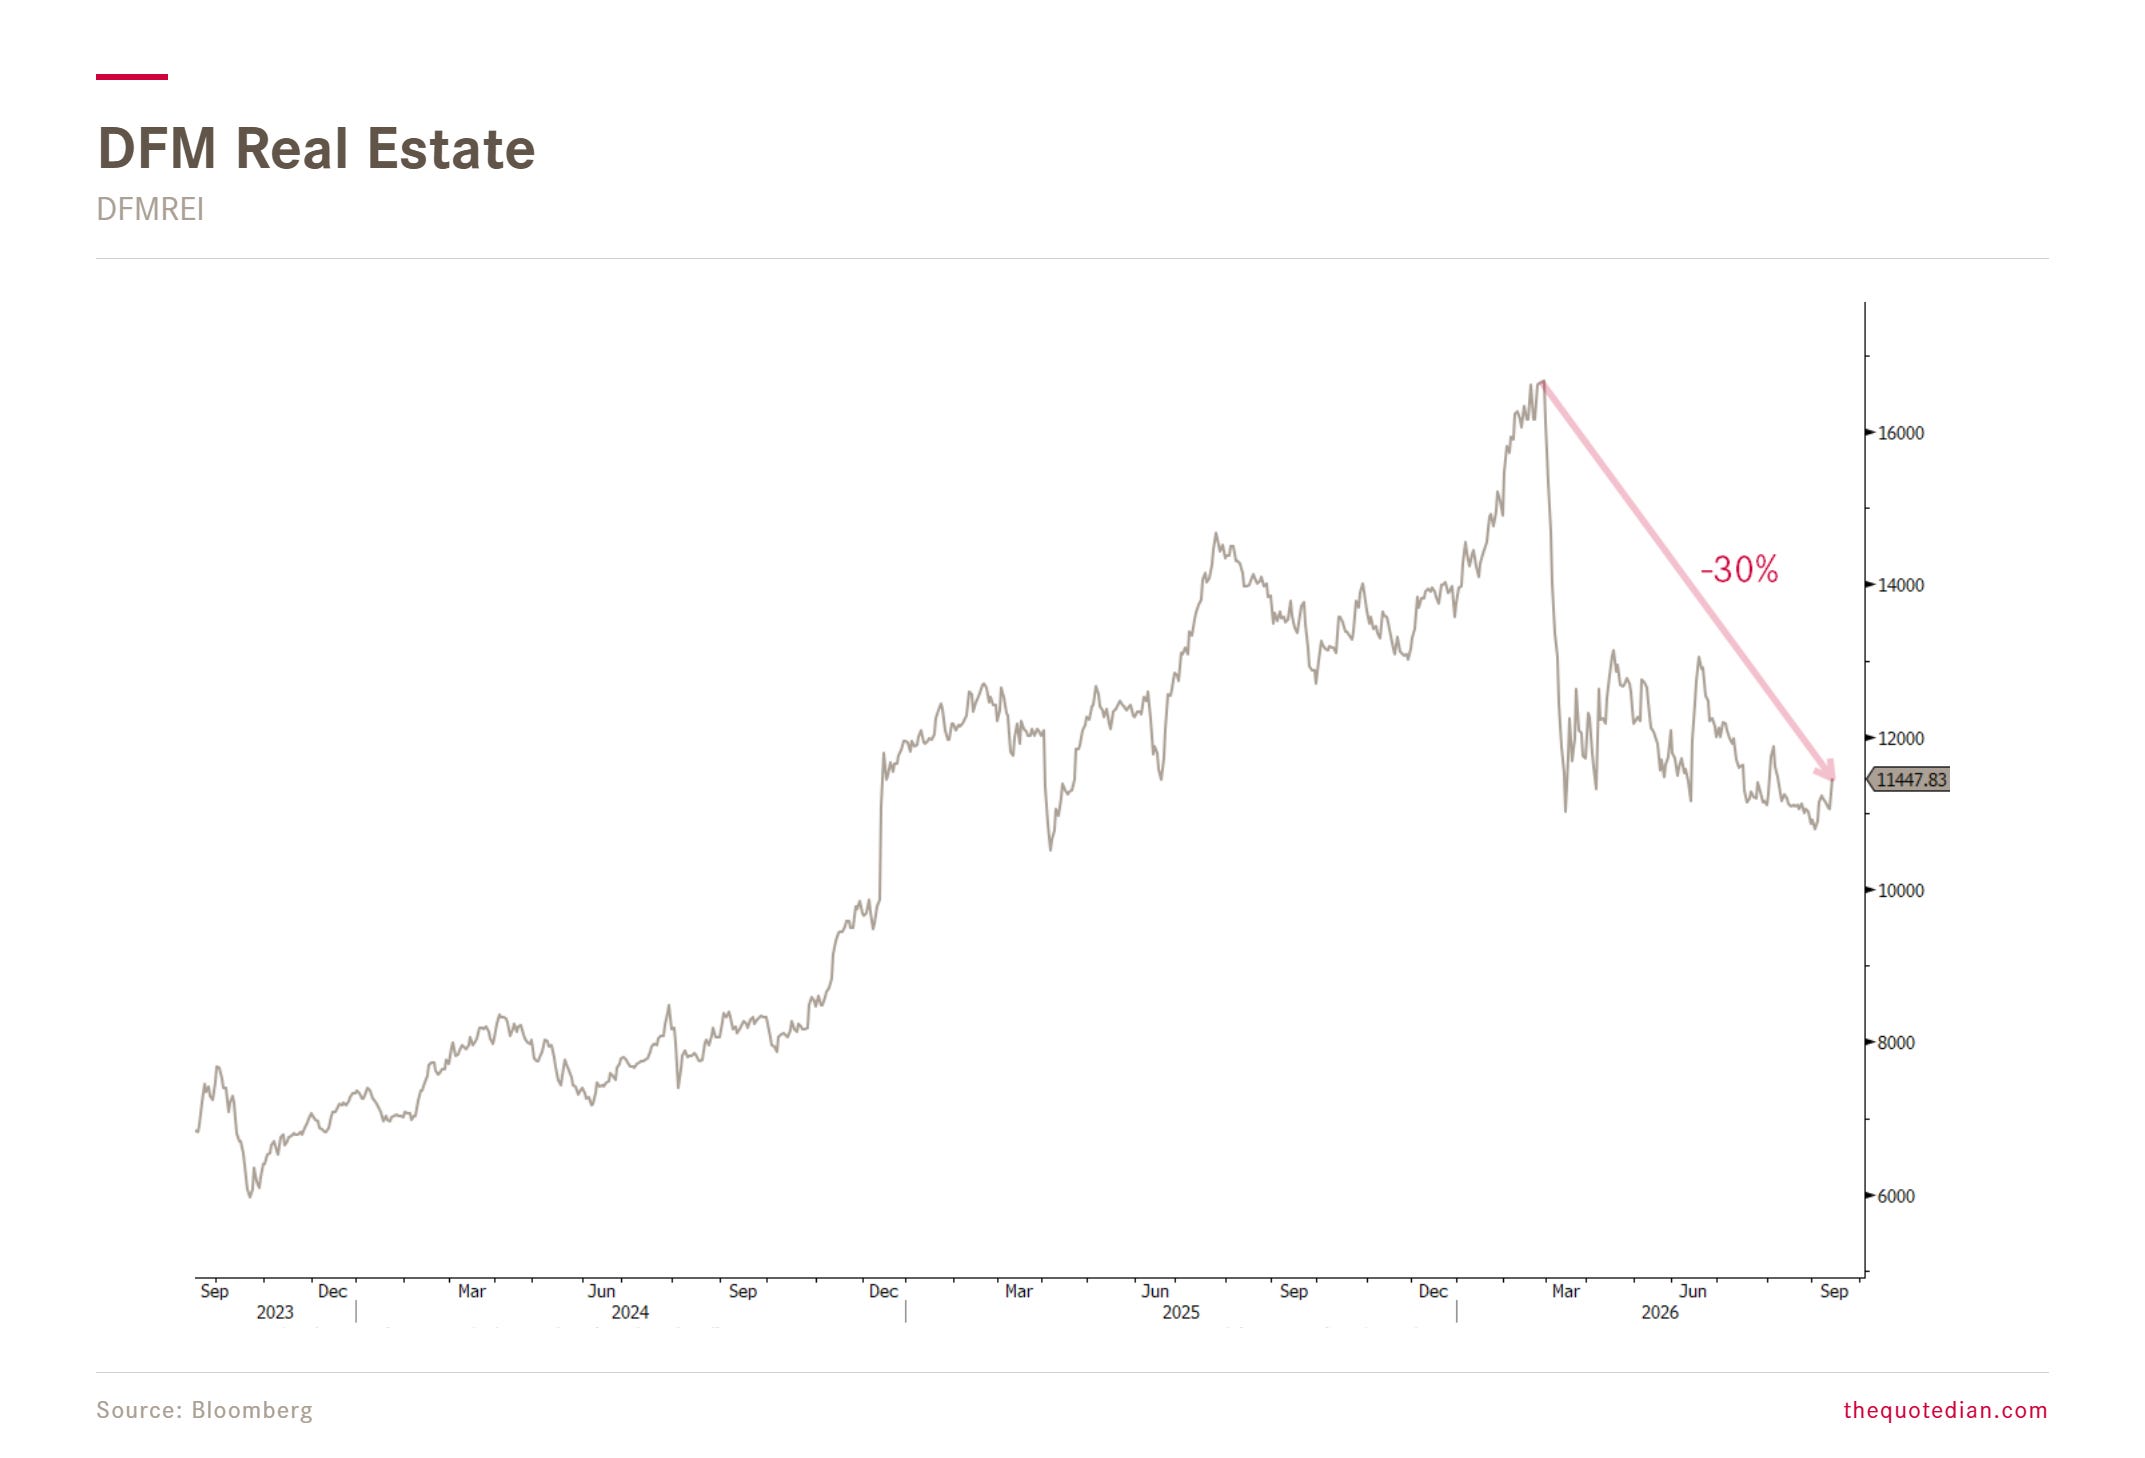
But it has definitely not been an easy year for UAE real estate stocks:
So, as we turned sector-specific anyway with our last observation, let’s continue sector specific.
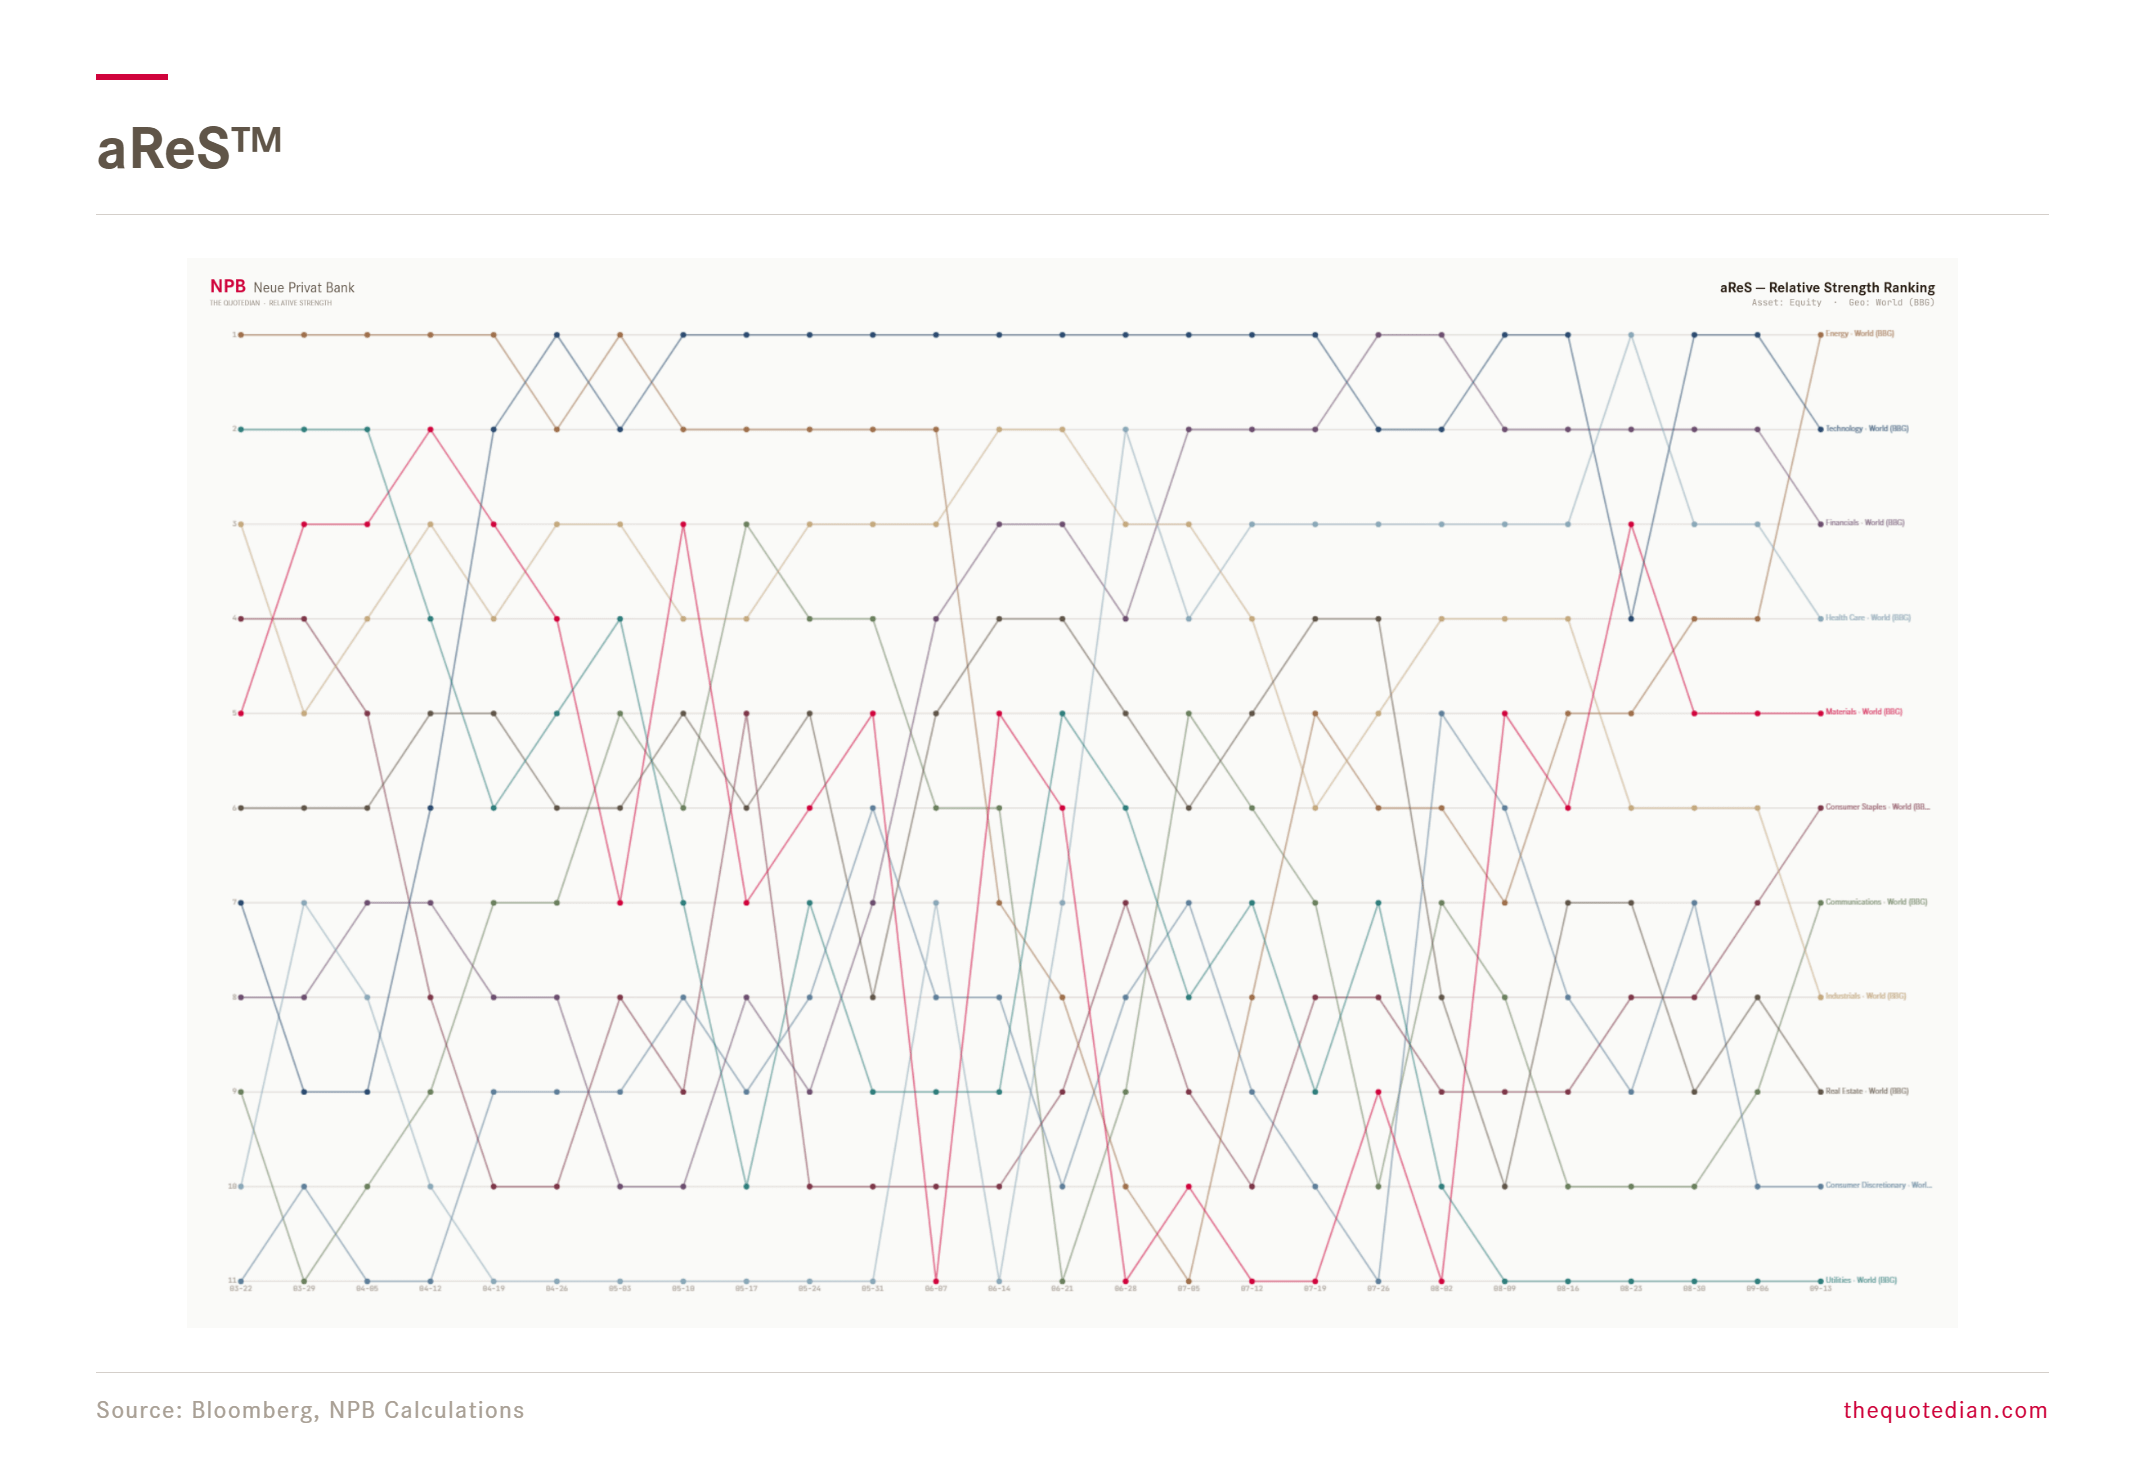
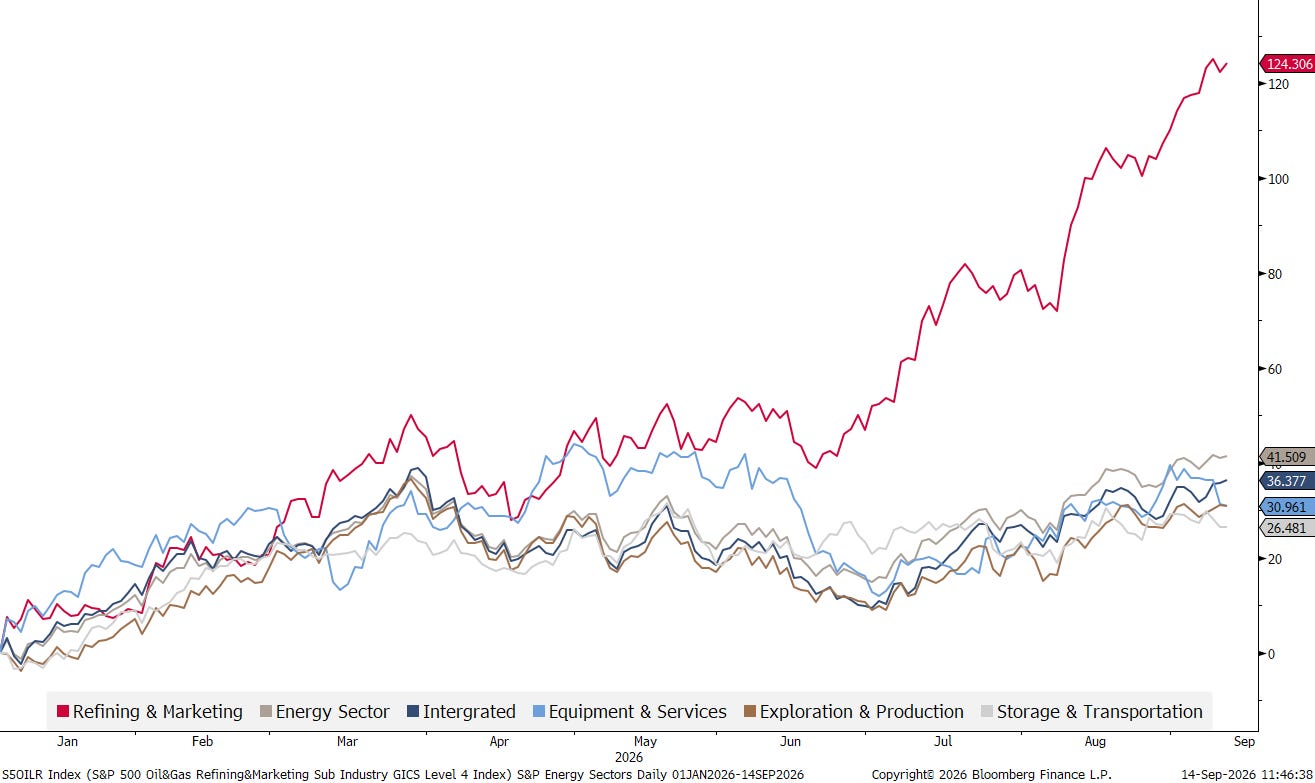
On our proprietary aReS™ sector model, energy has taken the clear lead again, followed by tech stocks:
However, in comparison to energy stocks, which just marked new highs this year, tech stocks are showing up with a divergence:
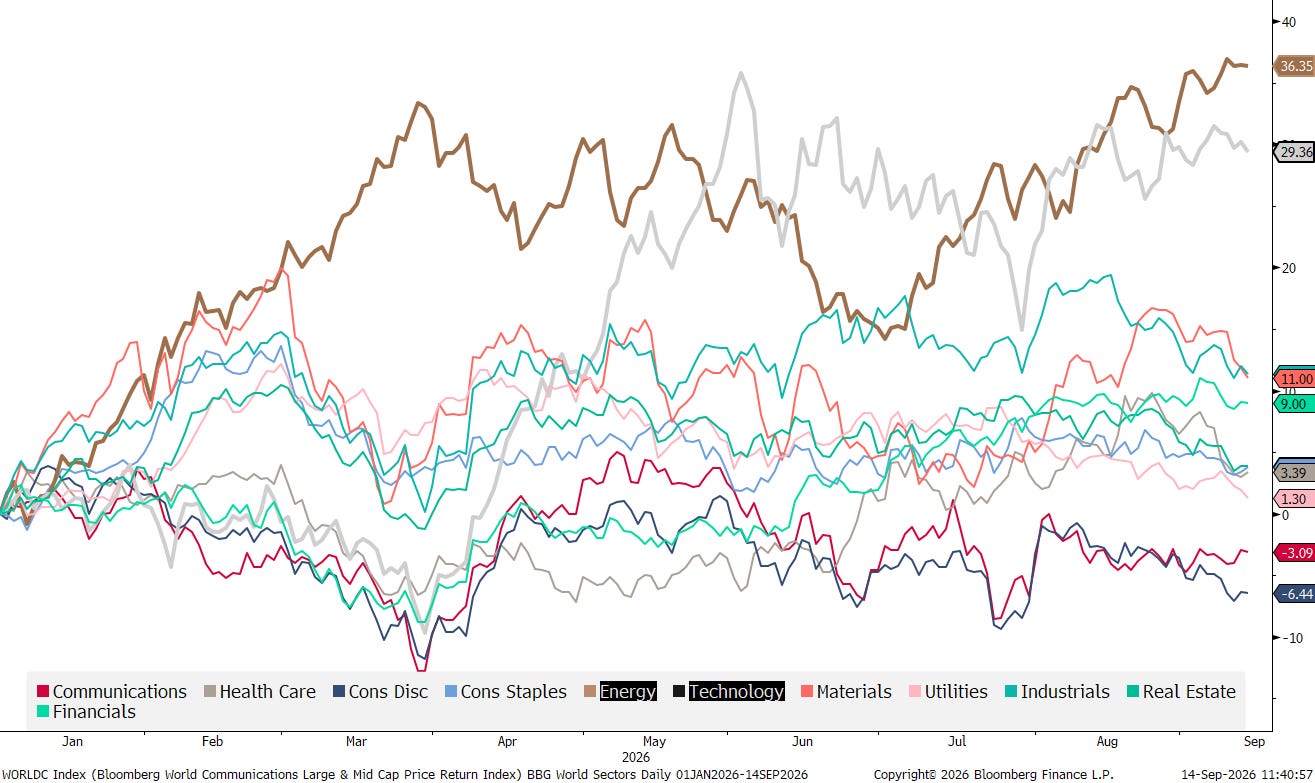
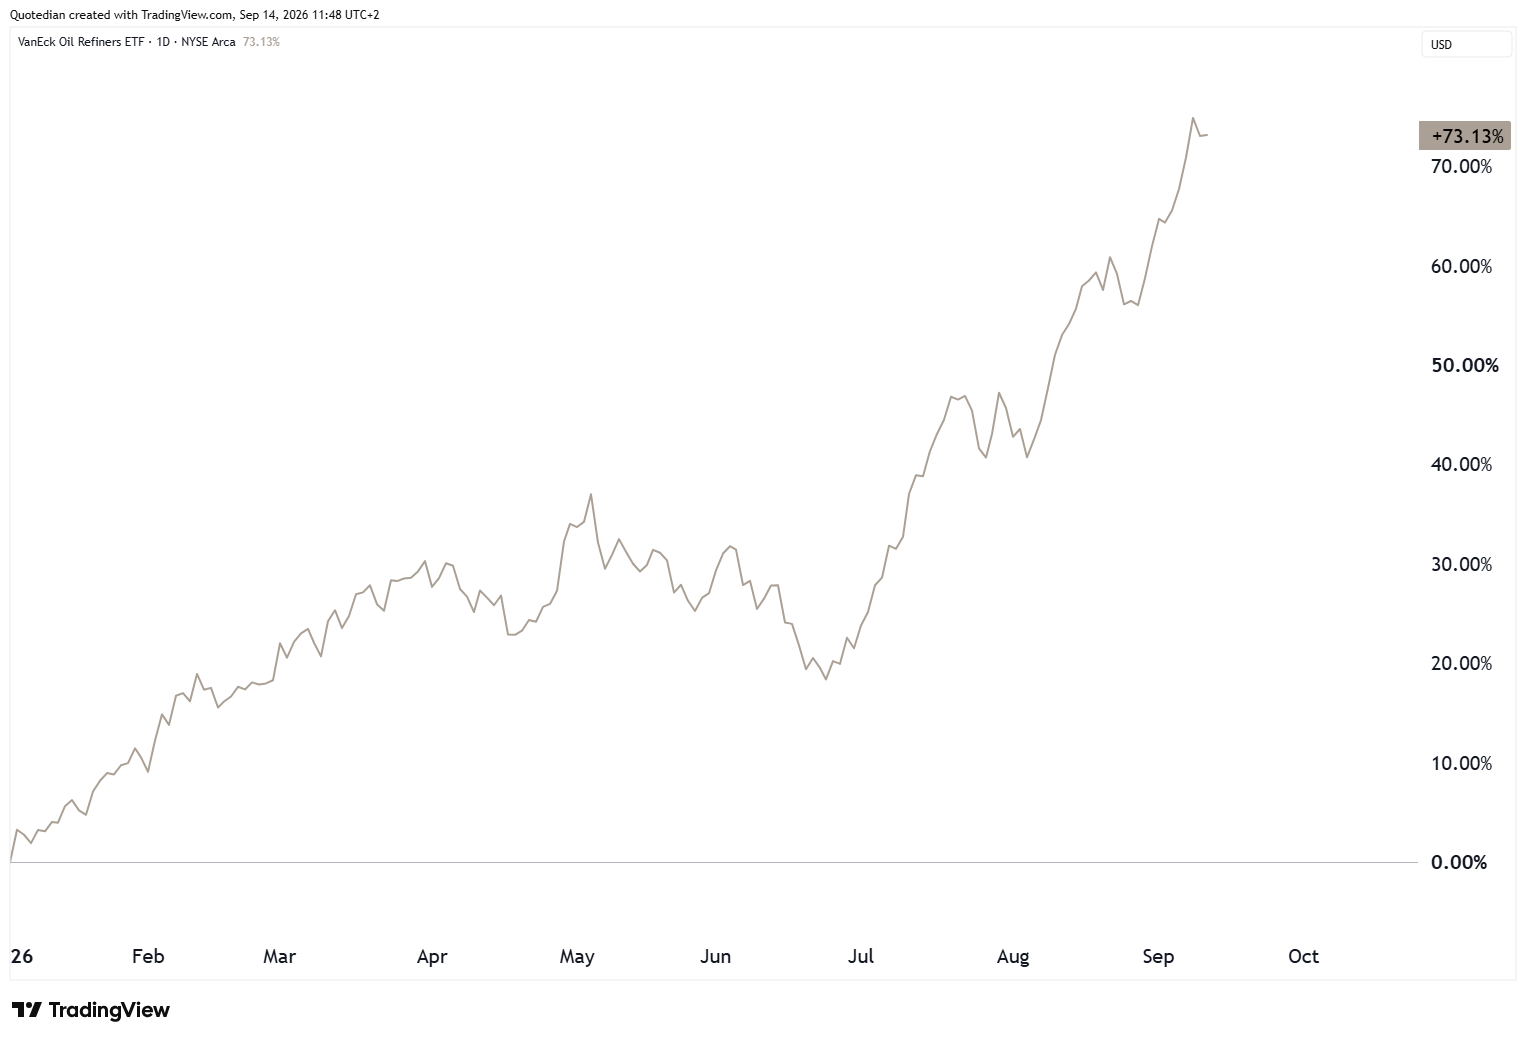
The 36% YTD performance from the energy is very juicy in itself, and has proven a much better hedge than bonds to shifts in geopolitical tensions. The more astute investor, was able to squeeze that performance-lemon even more though:
And just to rub it in, we have been recommending the VanEck Oil Refiners ETF (CRAK) for months on end this year in this very publication 😉:
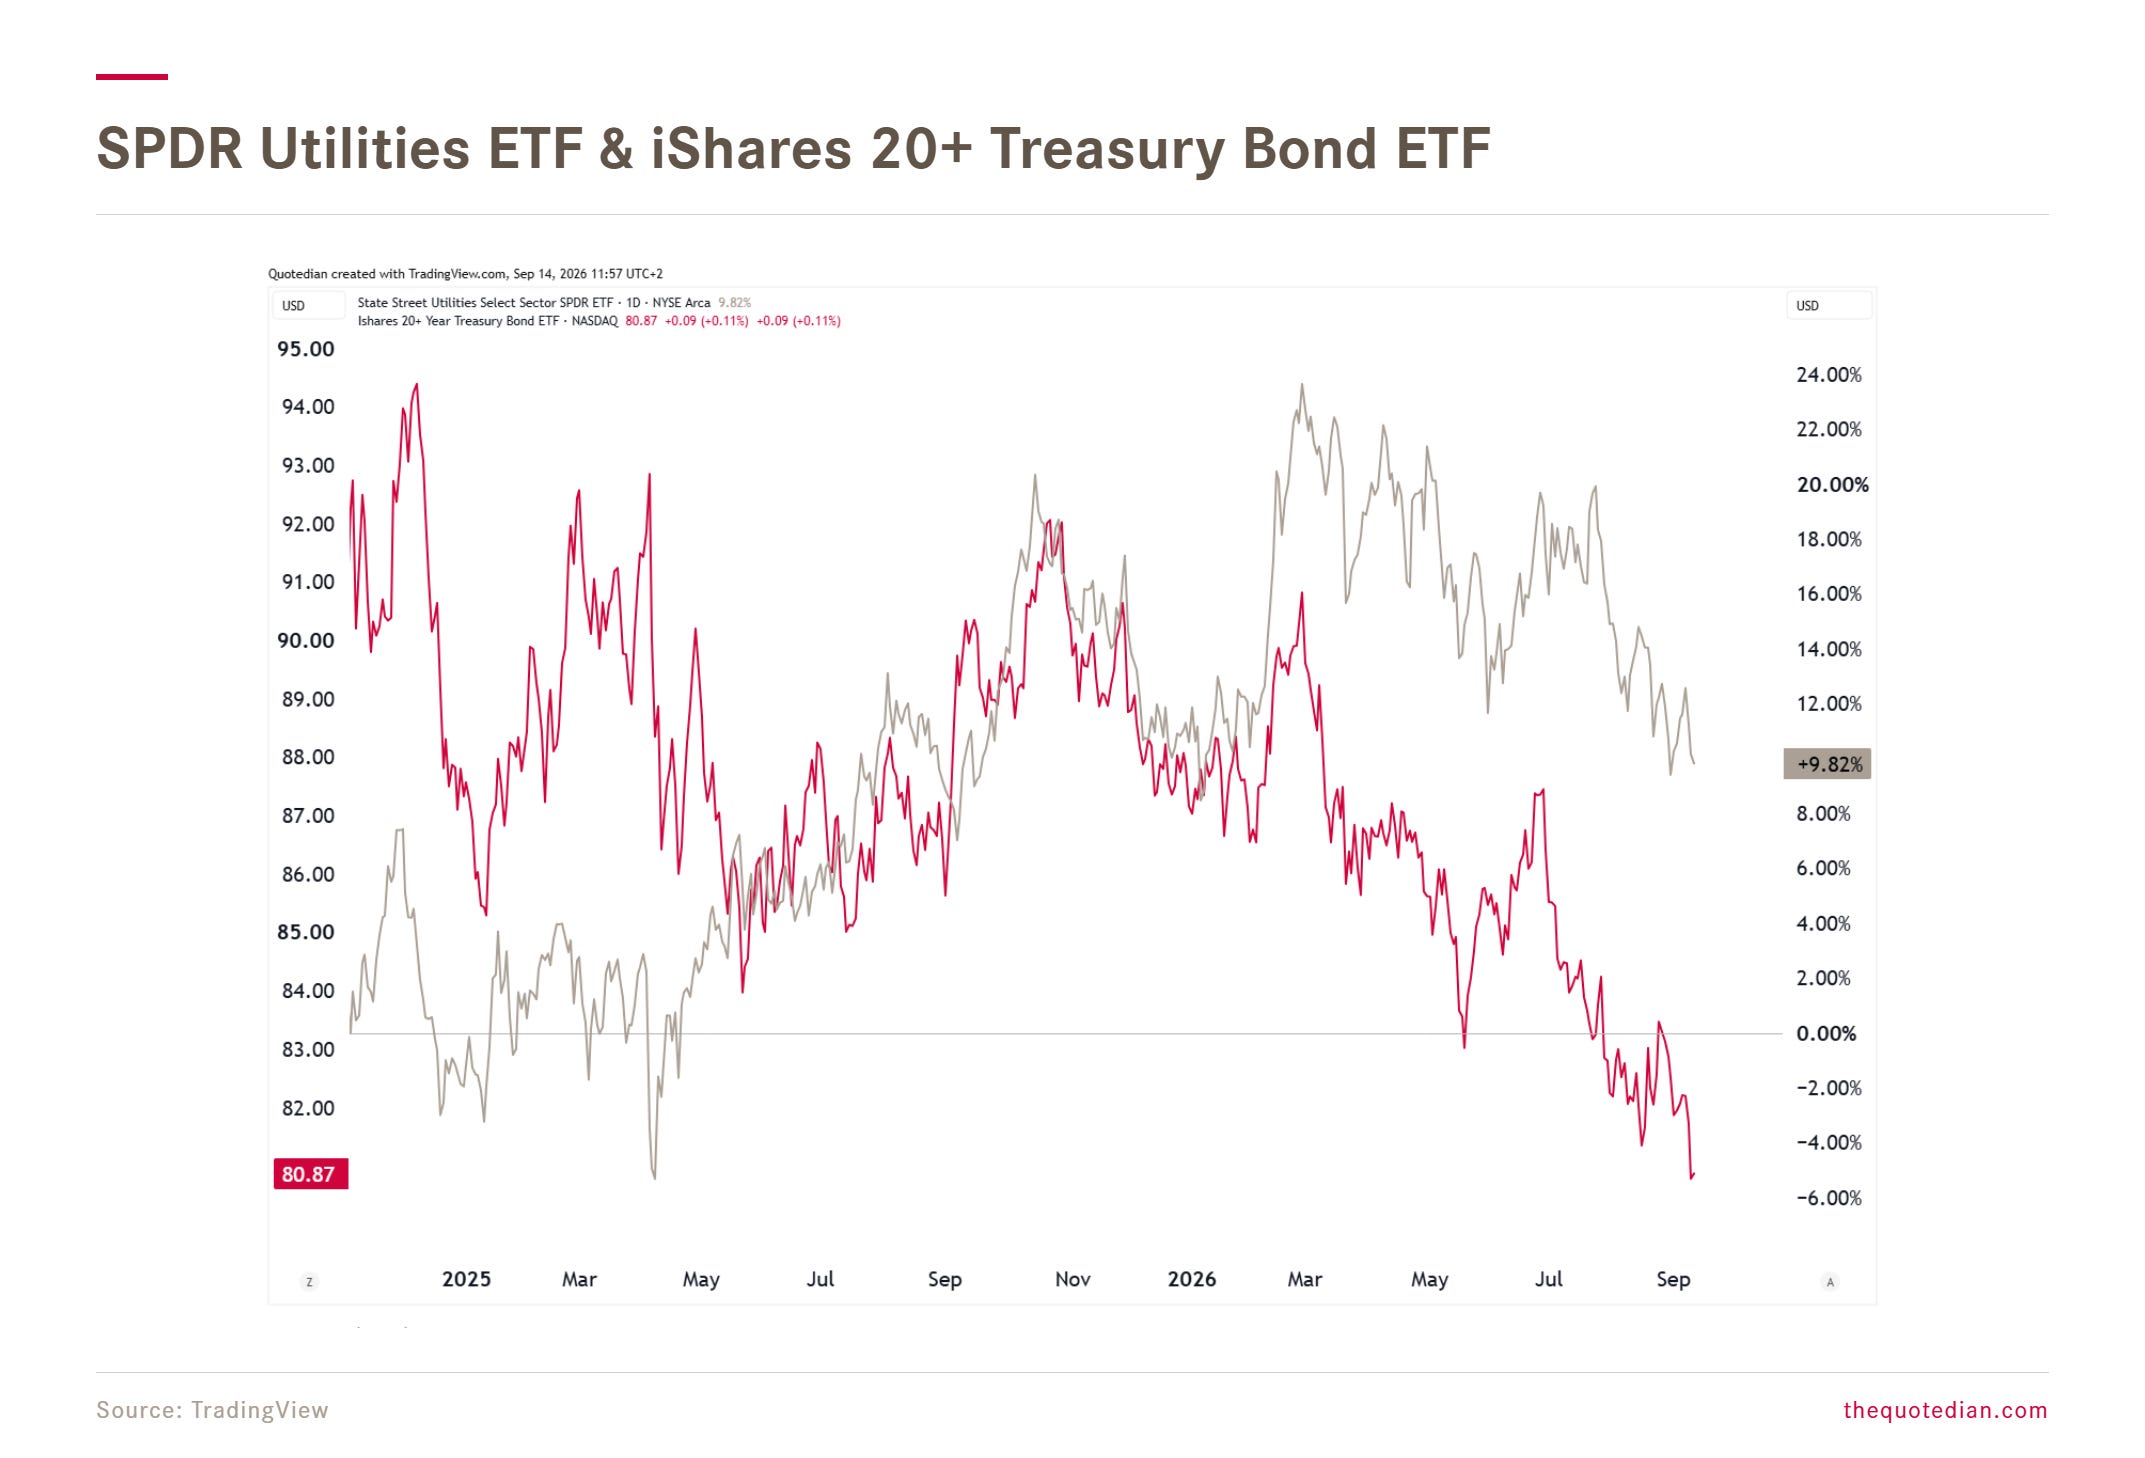
Let’s use the weakest sector on our aReS™ model, Utilities, as a segue into the bond section.
Utility stocks (XLU - grey line), tend be higher dividend payers, and hence, the threat of higher bond yields puts that cohort under a similar pressure as bonds (TLT - red line) themselves:
Strong employment numbers, firm inflation (CPI&PPI) figures, a big-mouthed US Treasury secretary and a Fed Chairman that has painted himself into a corner are all exerting simultaneously upside pressure on bond yields:
Post the strong economic numbers and firm inflation readings, the odds for a rate hike have climbed now to nearly 90%:
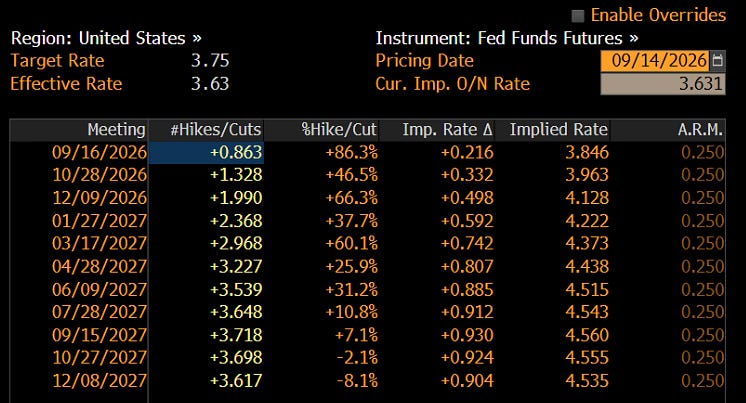
I previously thought that Fed Chairman Warsh will not hike until after the mid-term elections in early November in order not to upset Uncle Donald. But given his firm “I am an inflation-fighter” speech at the Jackson Hole symposium only a few weeks ago, he now has twisted his own arm behind his back for such a hike to occur this week.

In any case, the bond vigilantes have hiked already:
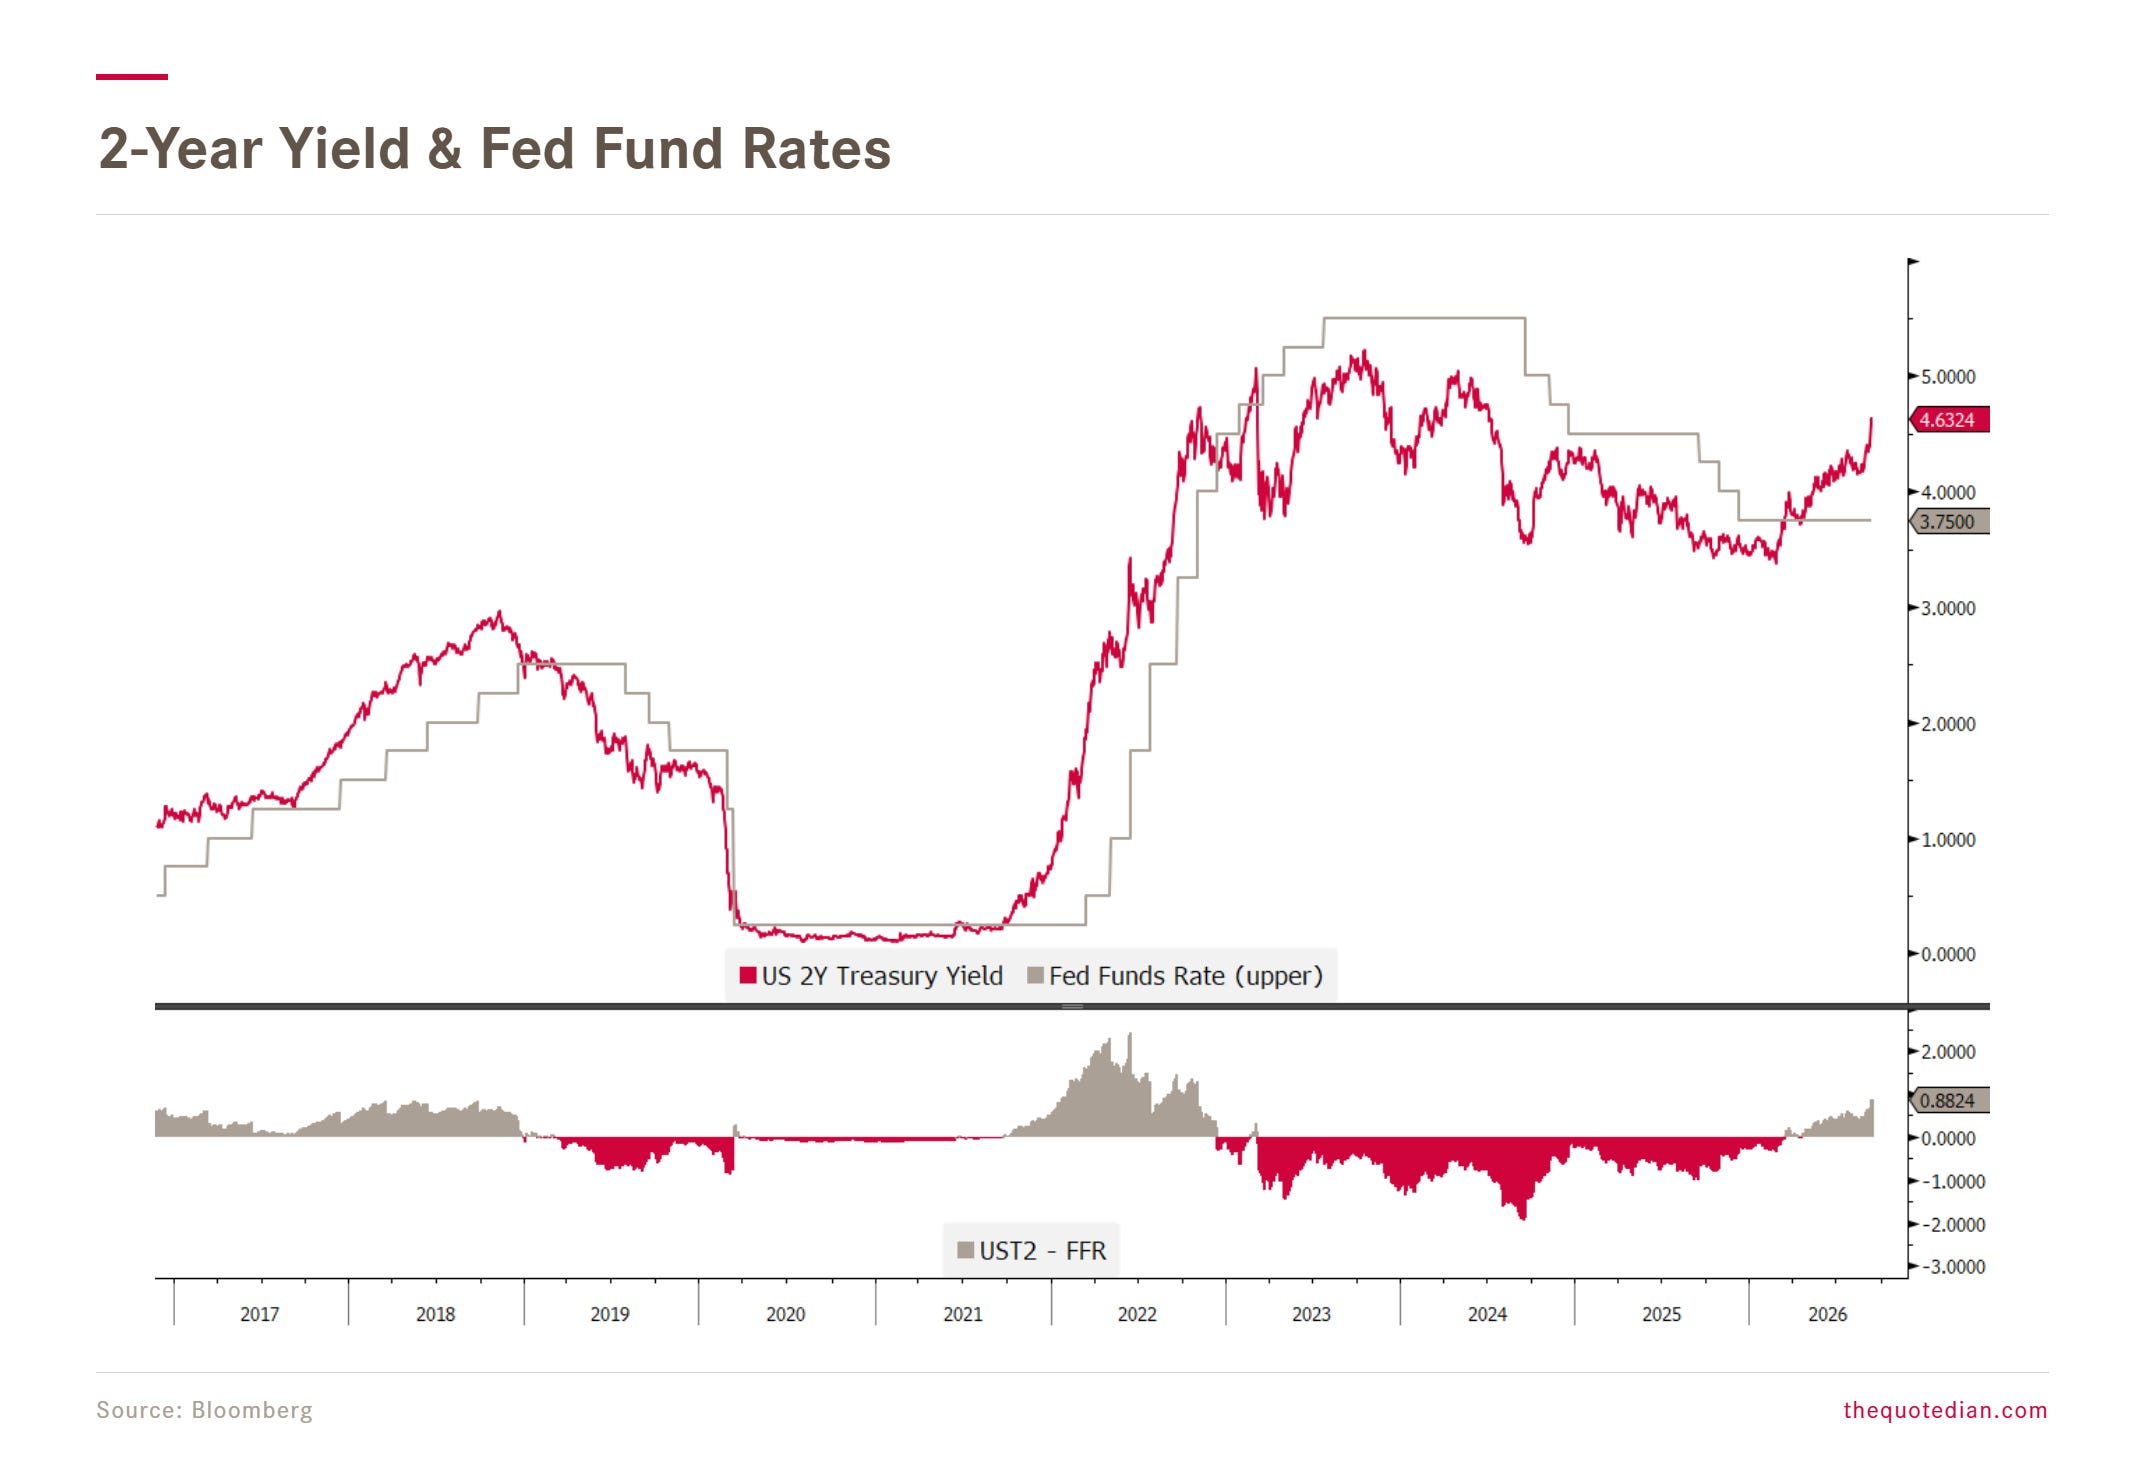
The 30-year Treasury bond yield is now also already way above the “You Shall Not Pass” level ‘set’ a few weeks ago by Bessent-In-Da-House:
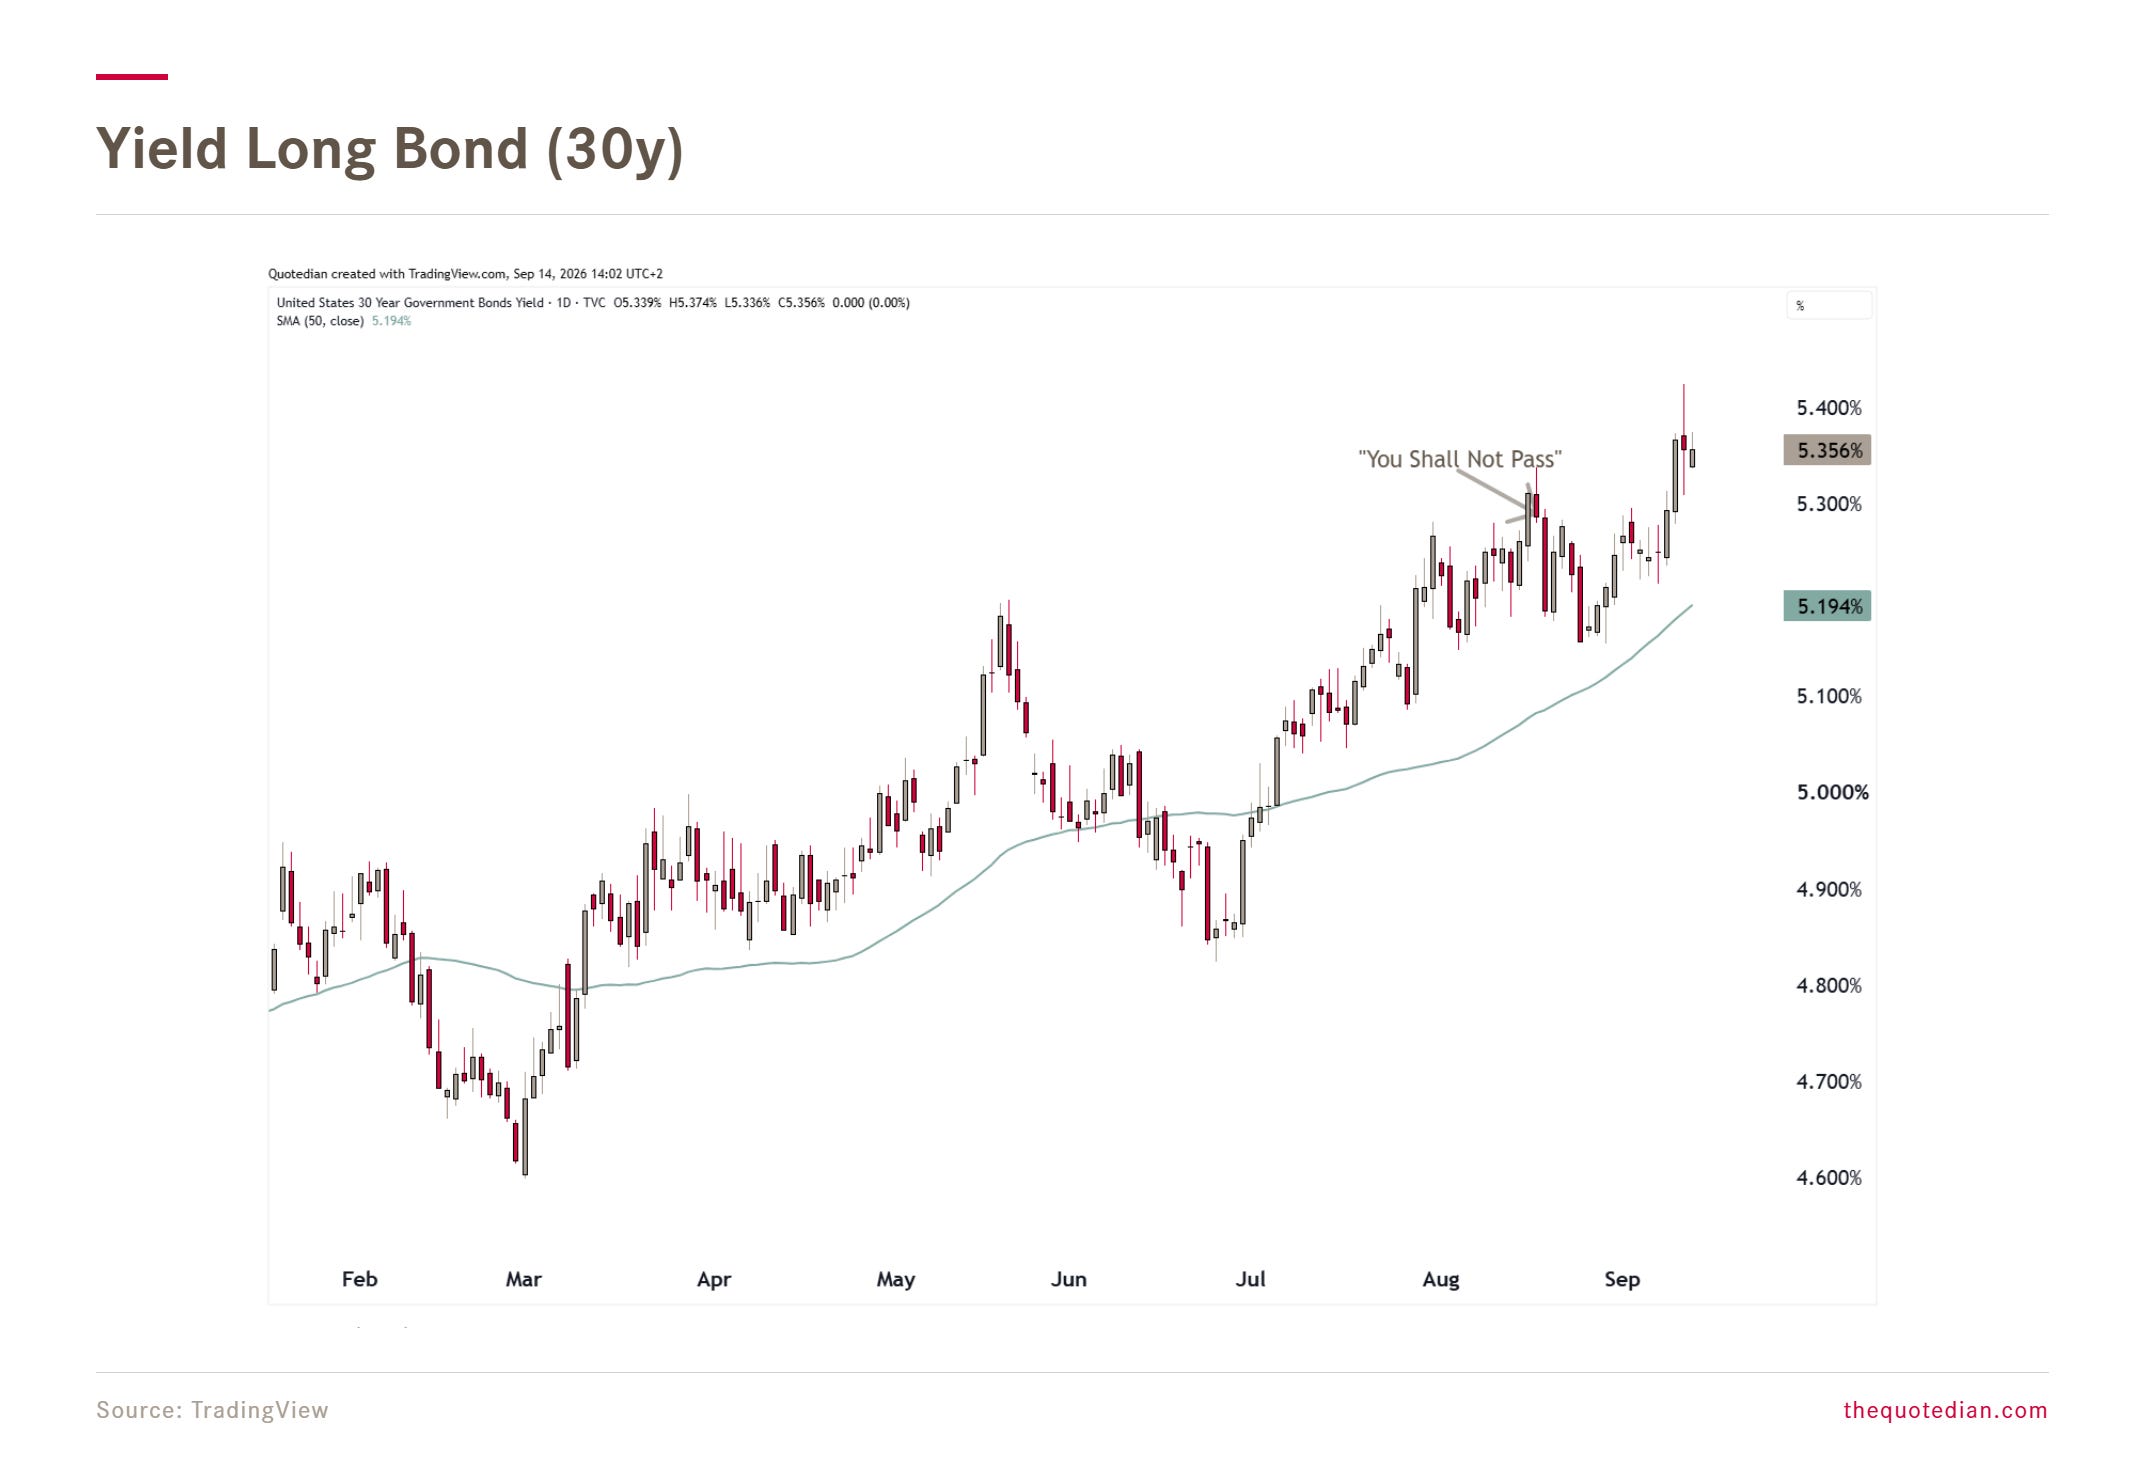
Looking at a rising bond yield chart may “harmlessify” the cruel reality that bond investors, especially at the long-end are suffering.
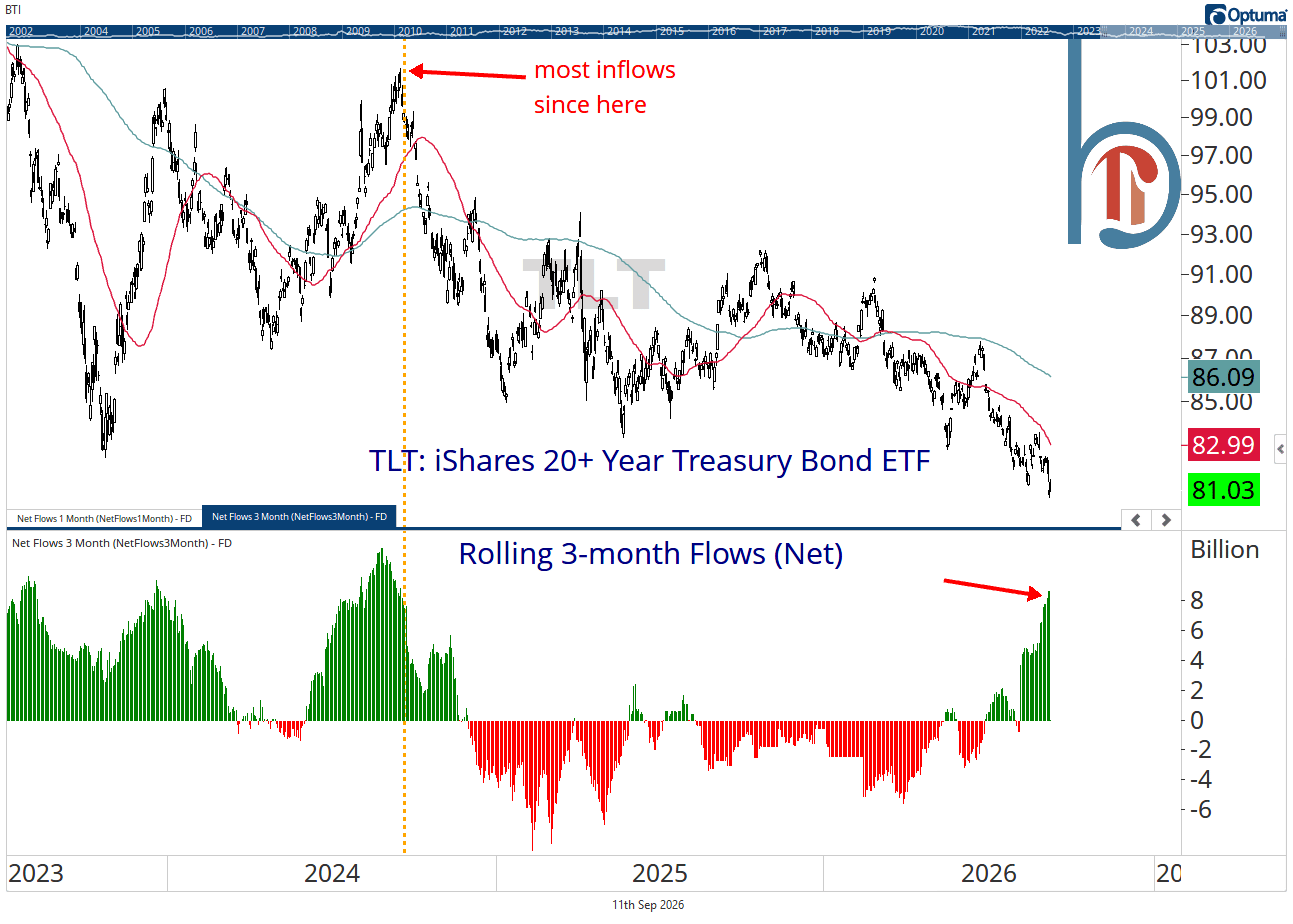
The iShares 20+ Treasury Bond ETF, with an approximate duration of >15, is down over 50% over the past six years:
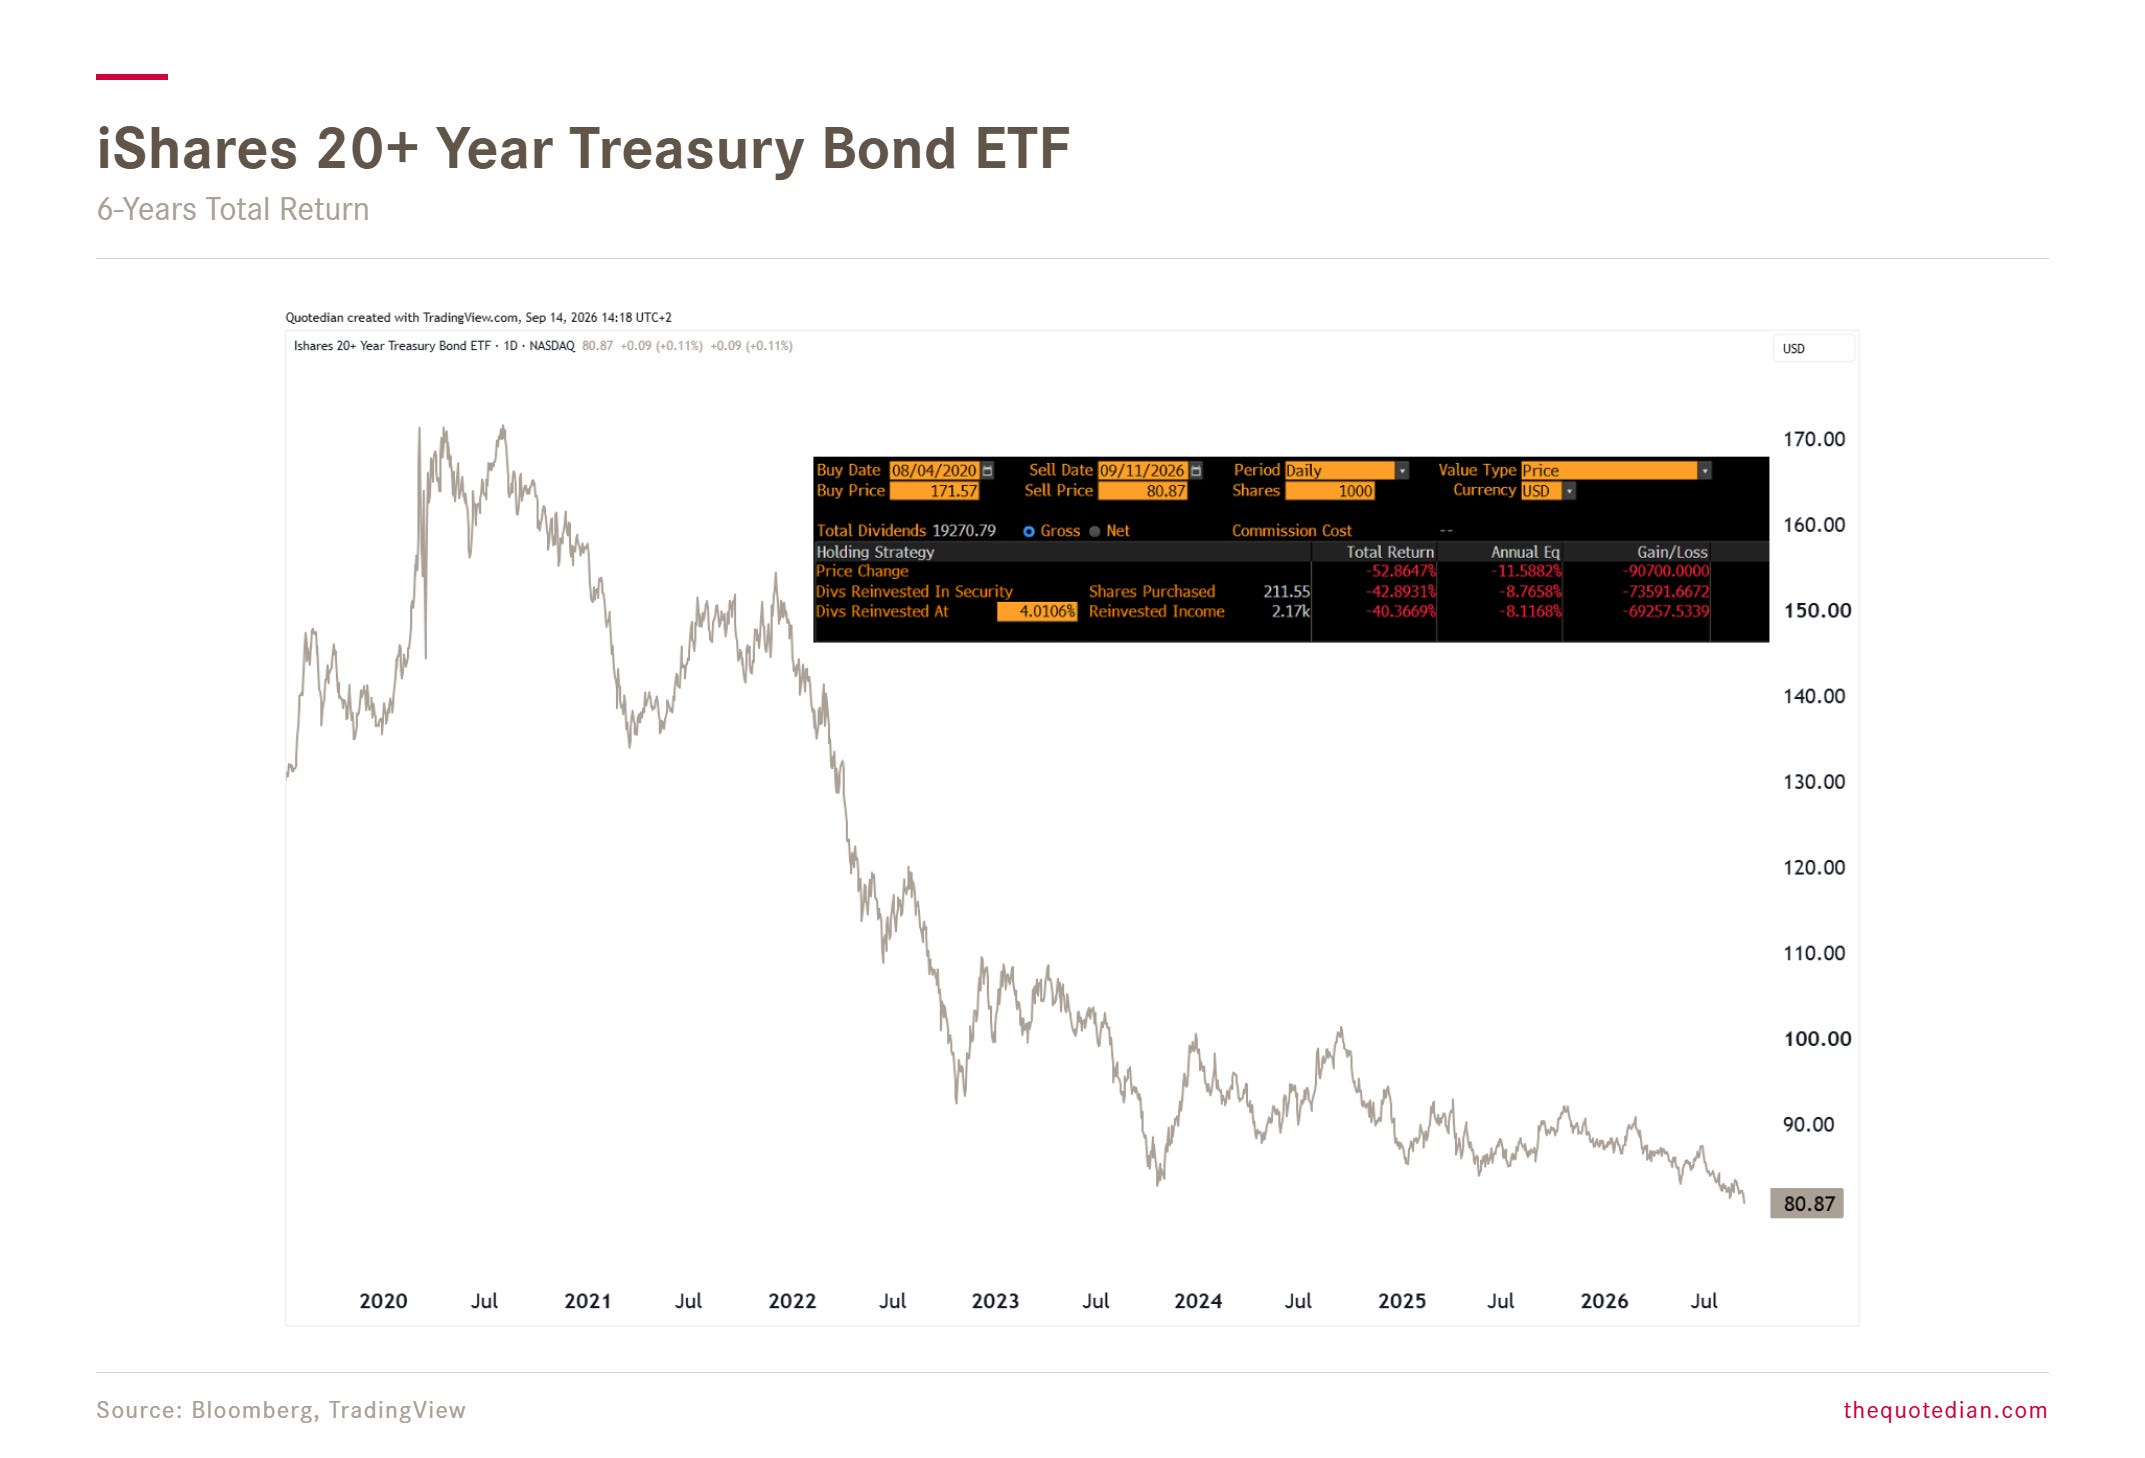
That’s an annualized Total Return, with dividends reinvested and all, of negative nearly nine percent!!
And if the following chart is of any guidance, the worst may still lay ahead:
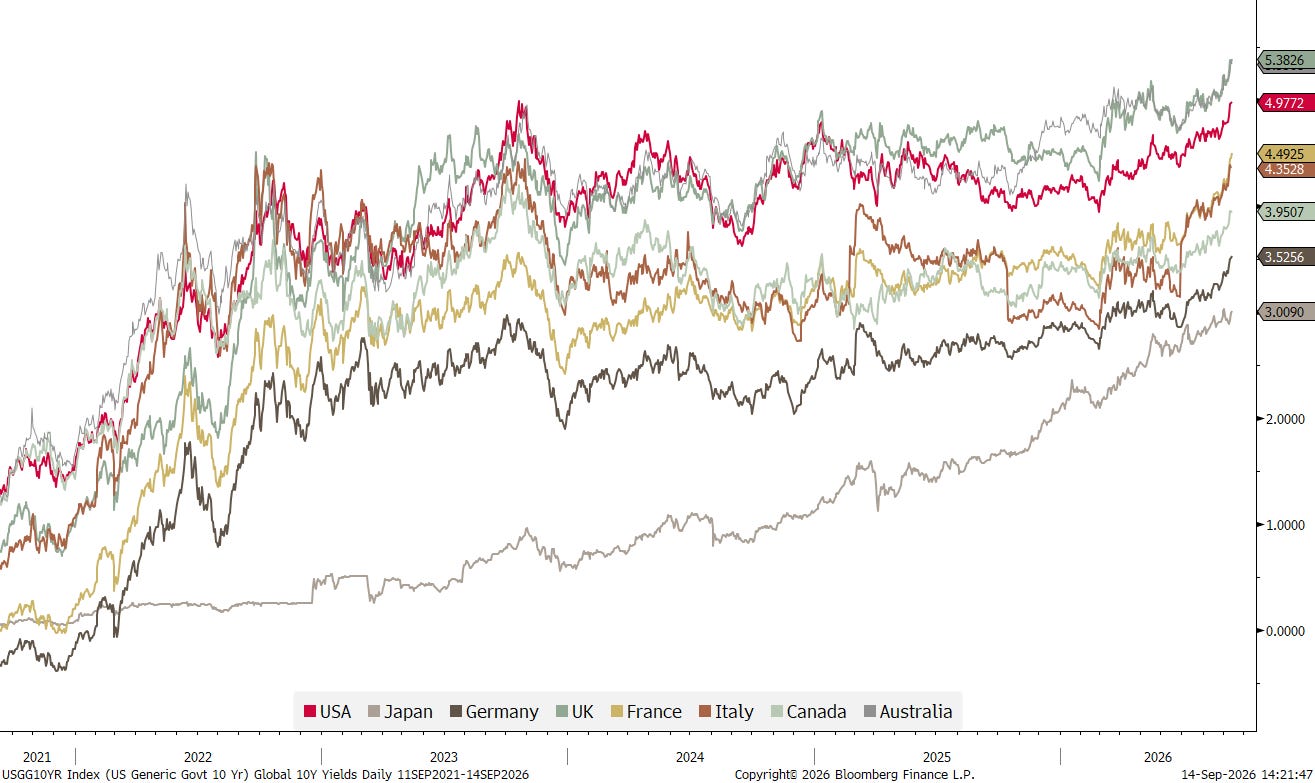
But of course, rising yields are not only a US phenomenon:
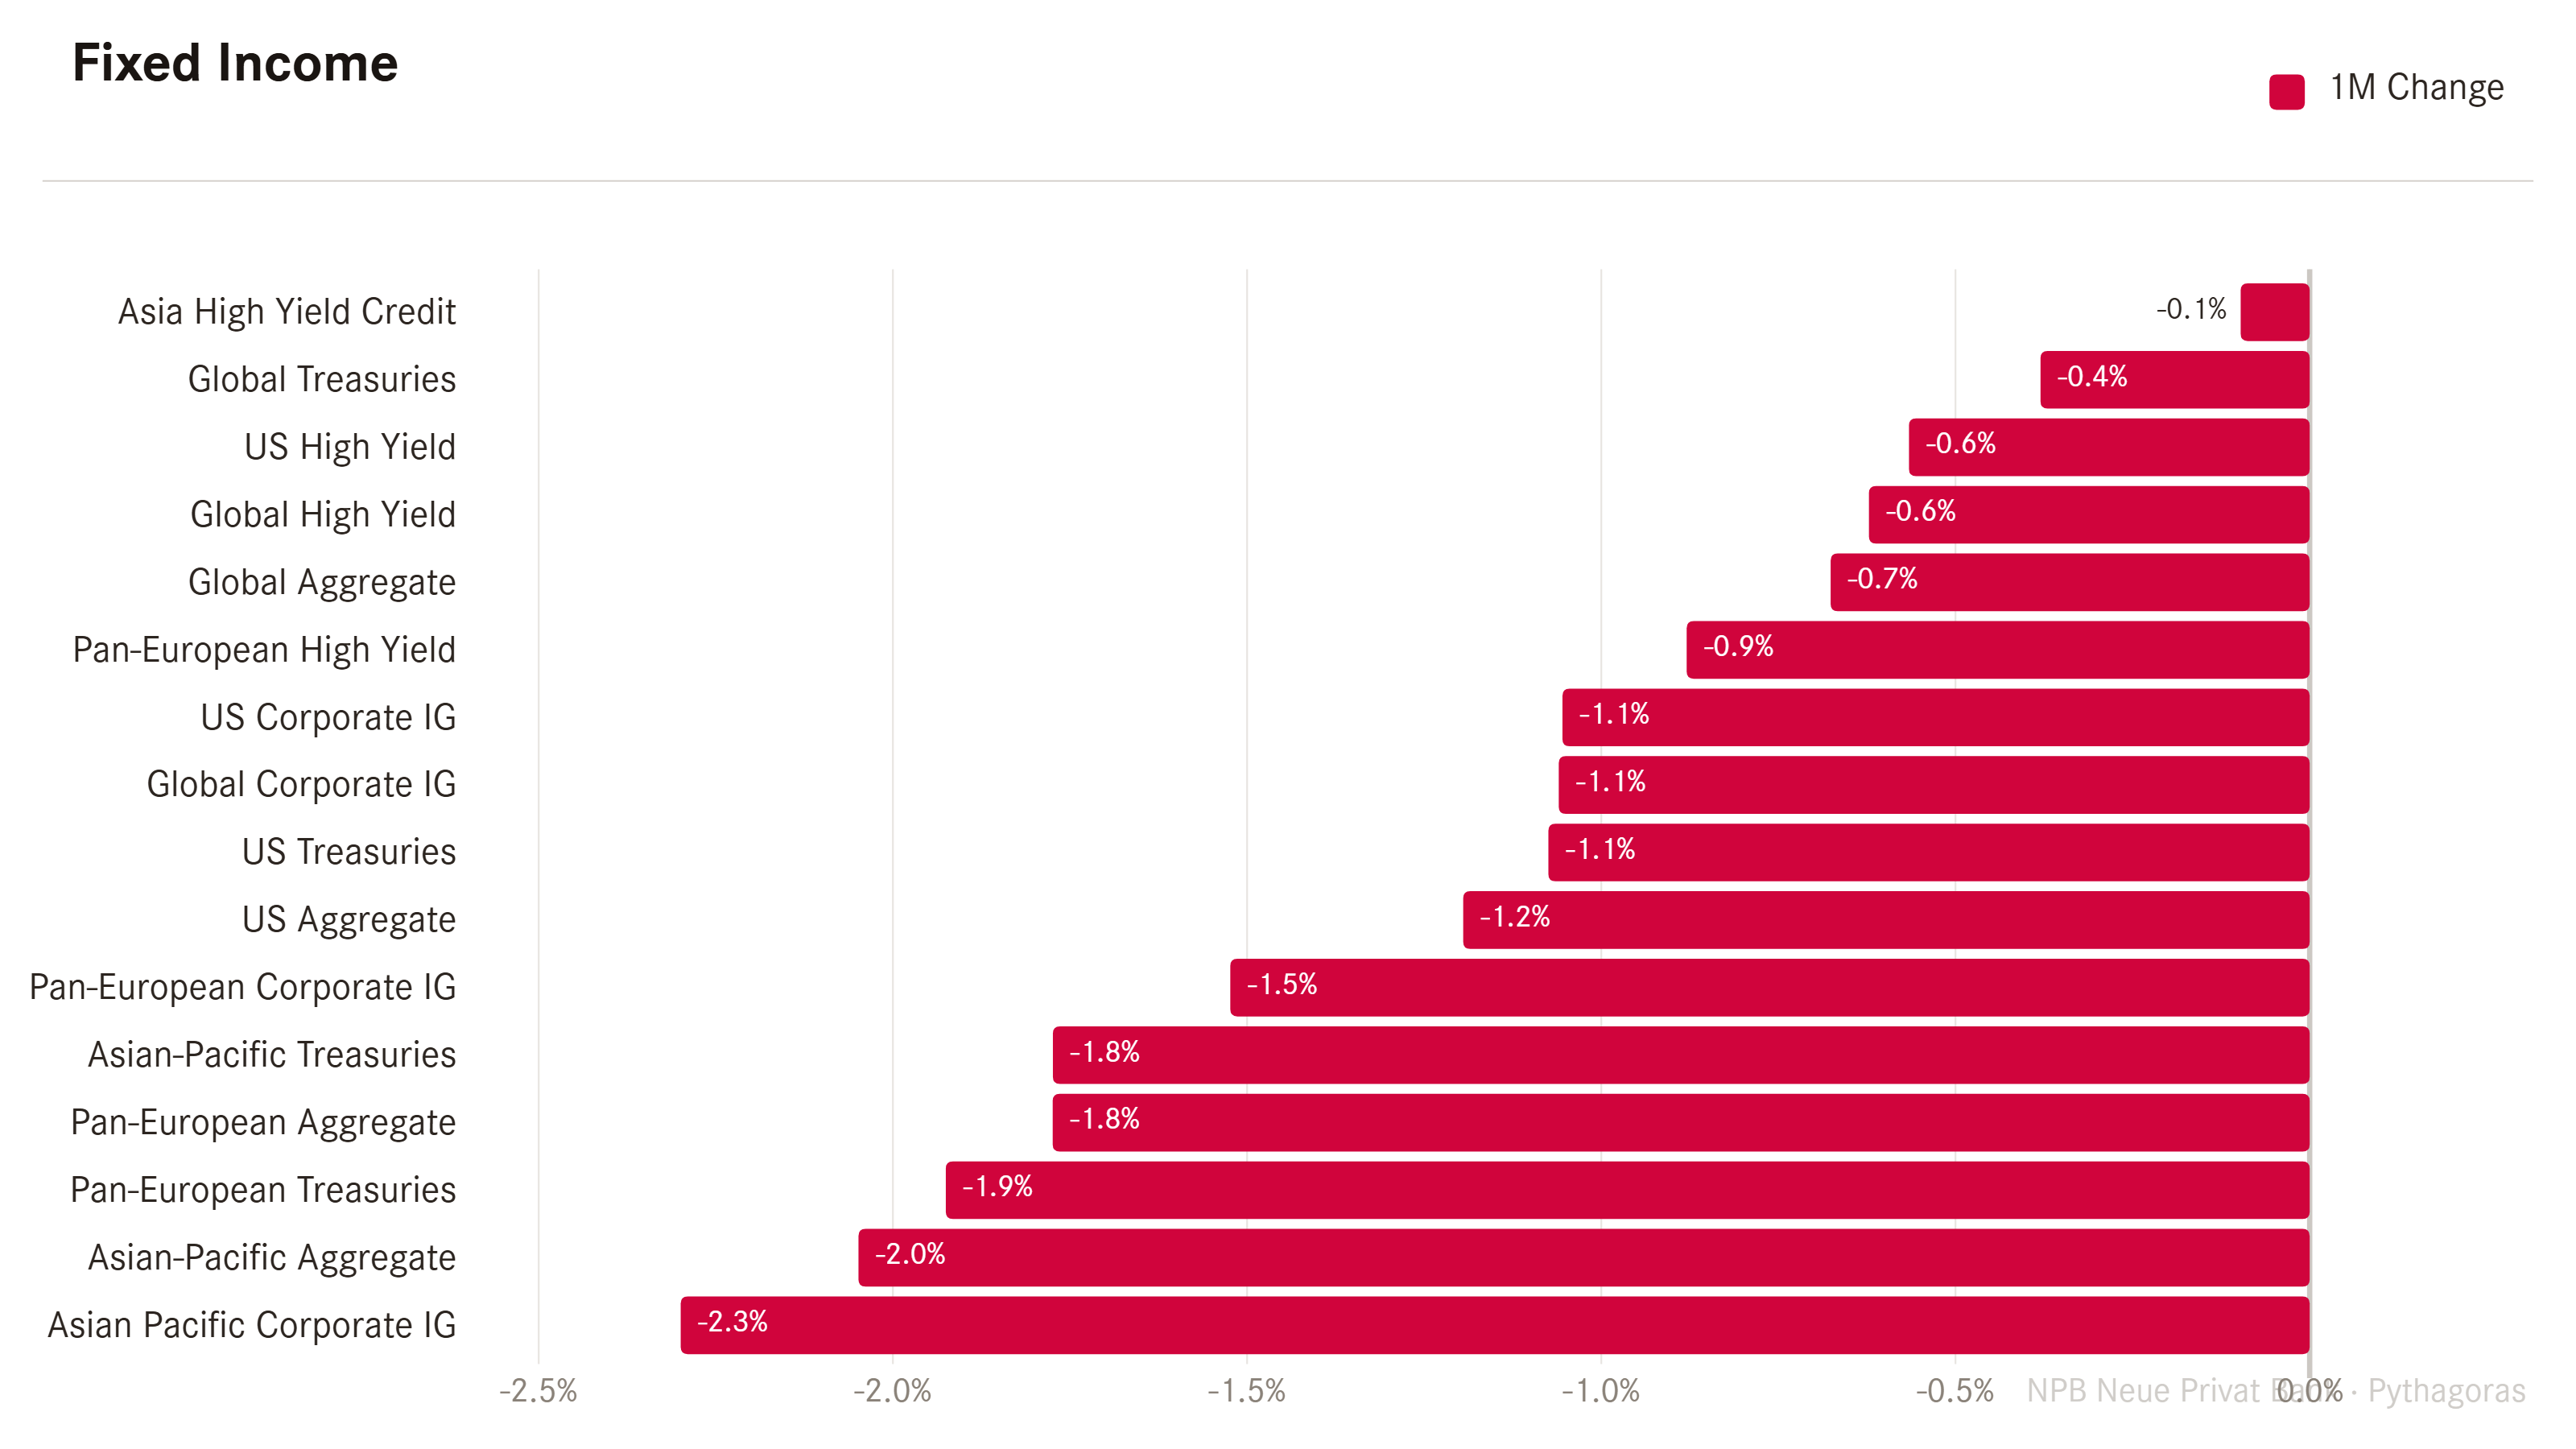
The past month has been brutal for bond investors:
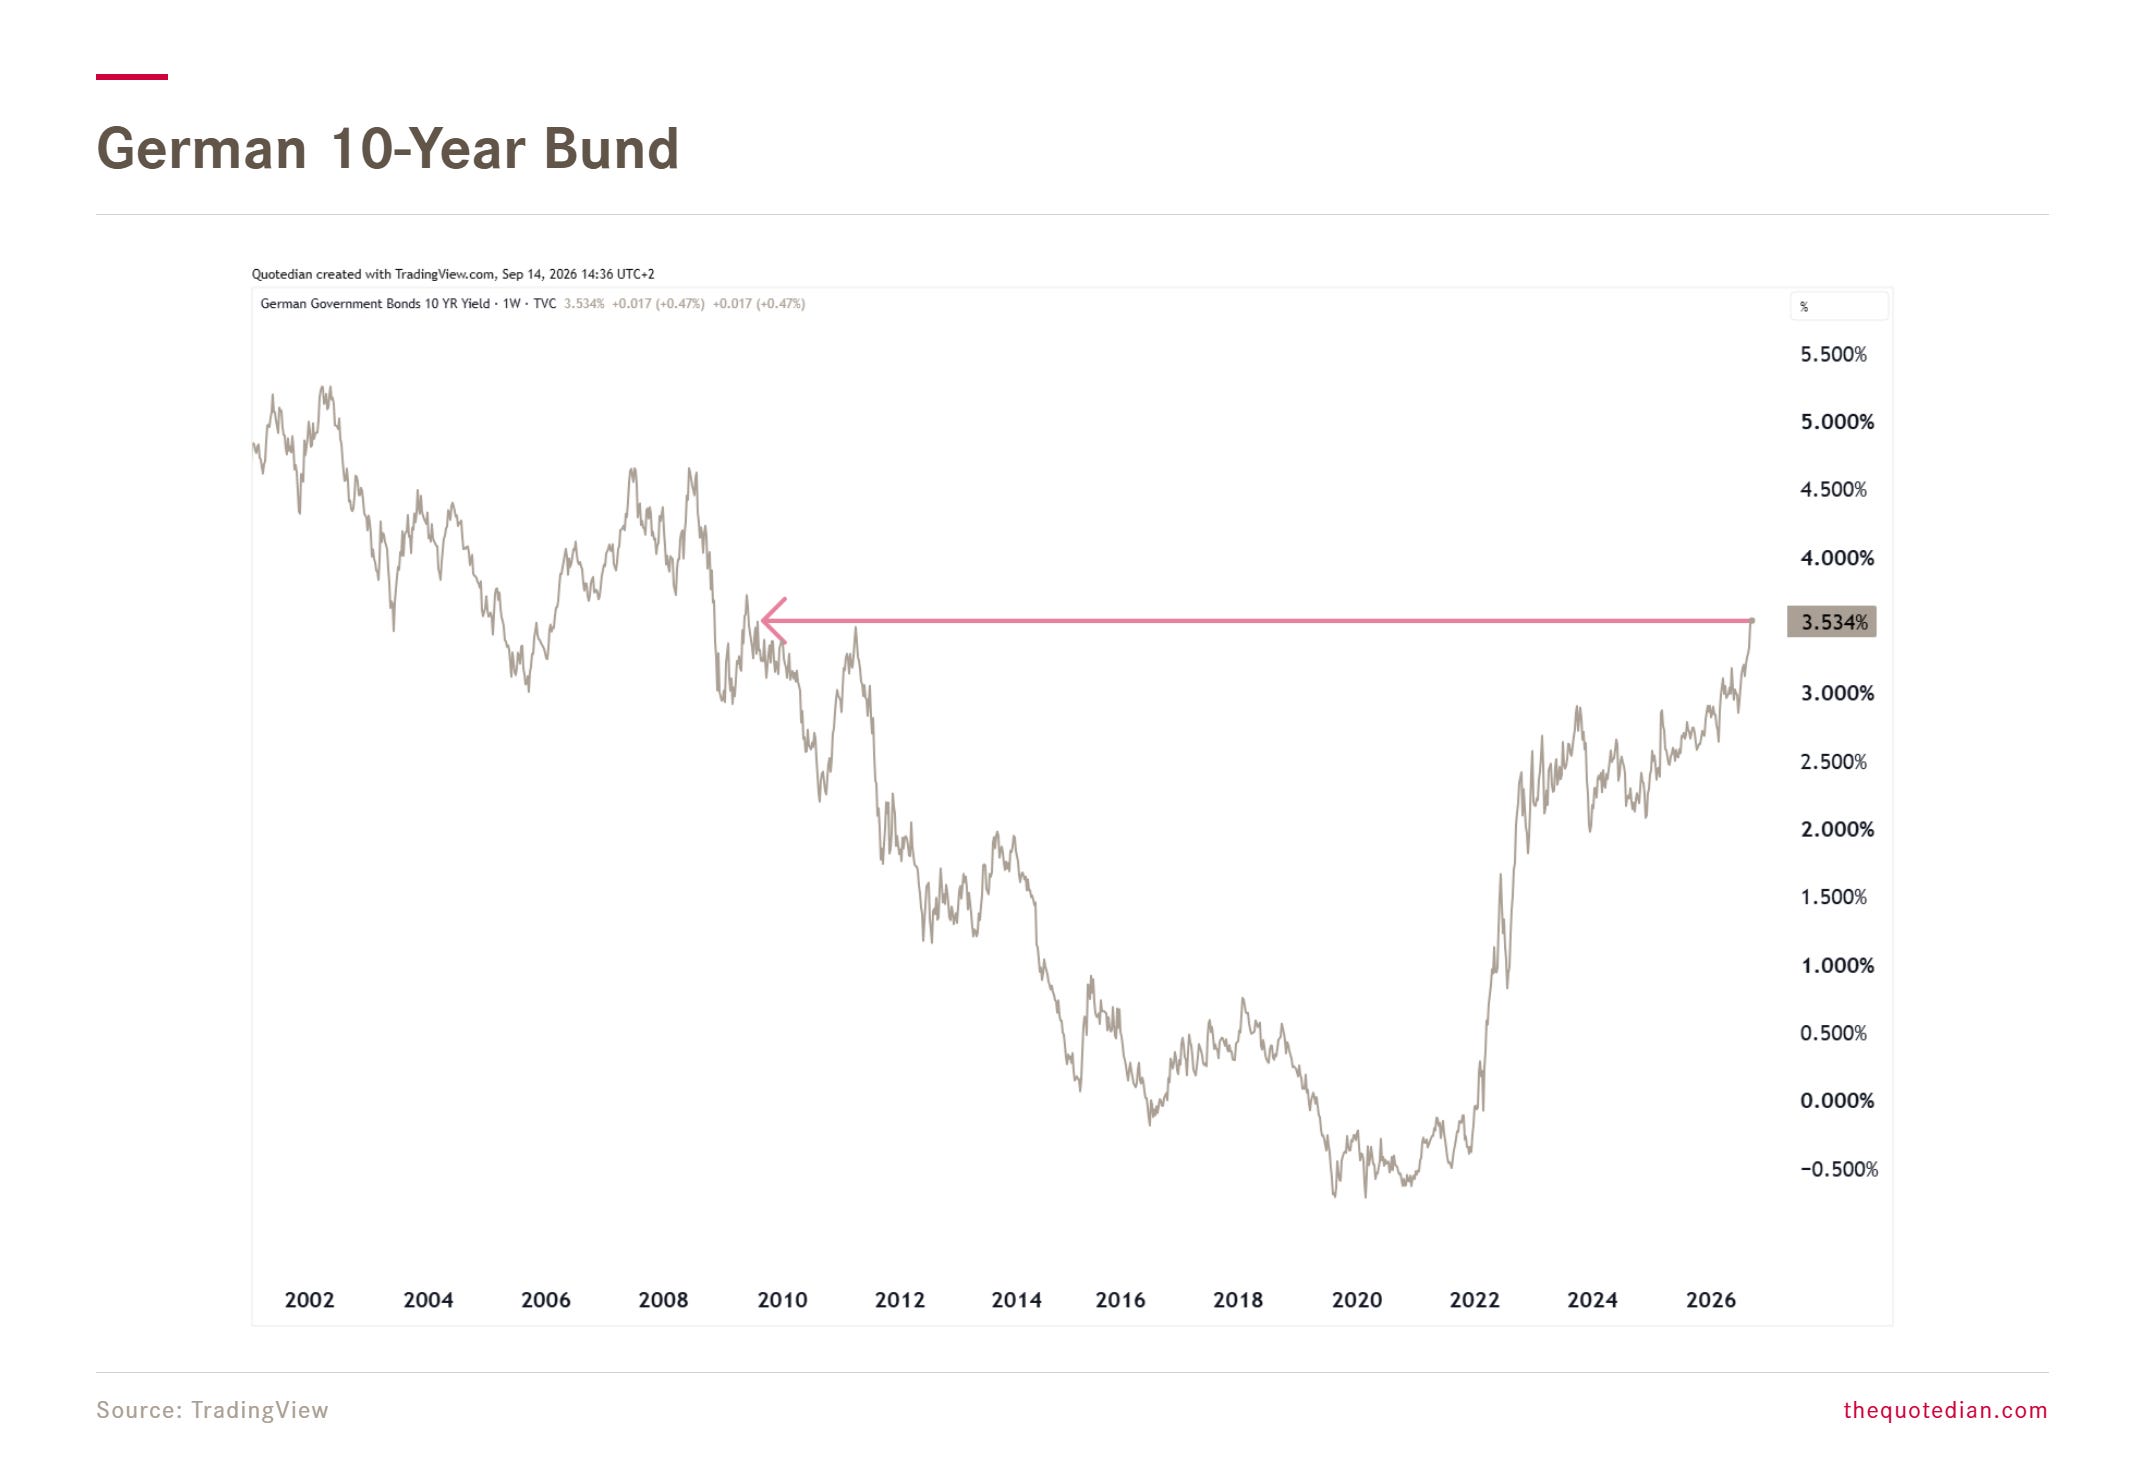
The German 10-Year Bund level is at its highest since 2009 (when it was falling=:
And staying on European yields for a moment, something seems rotten in the state of … France!
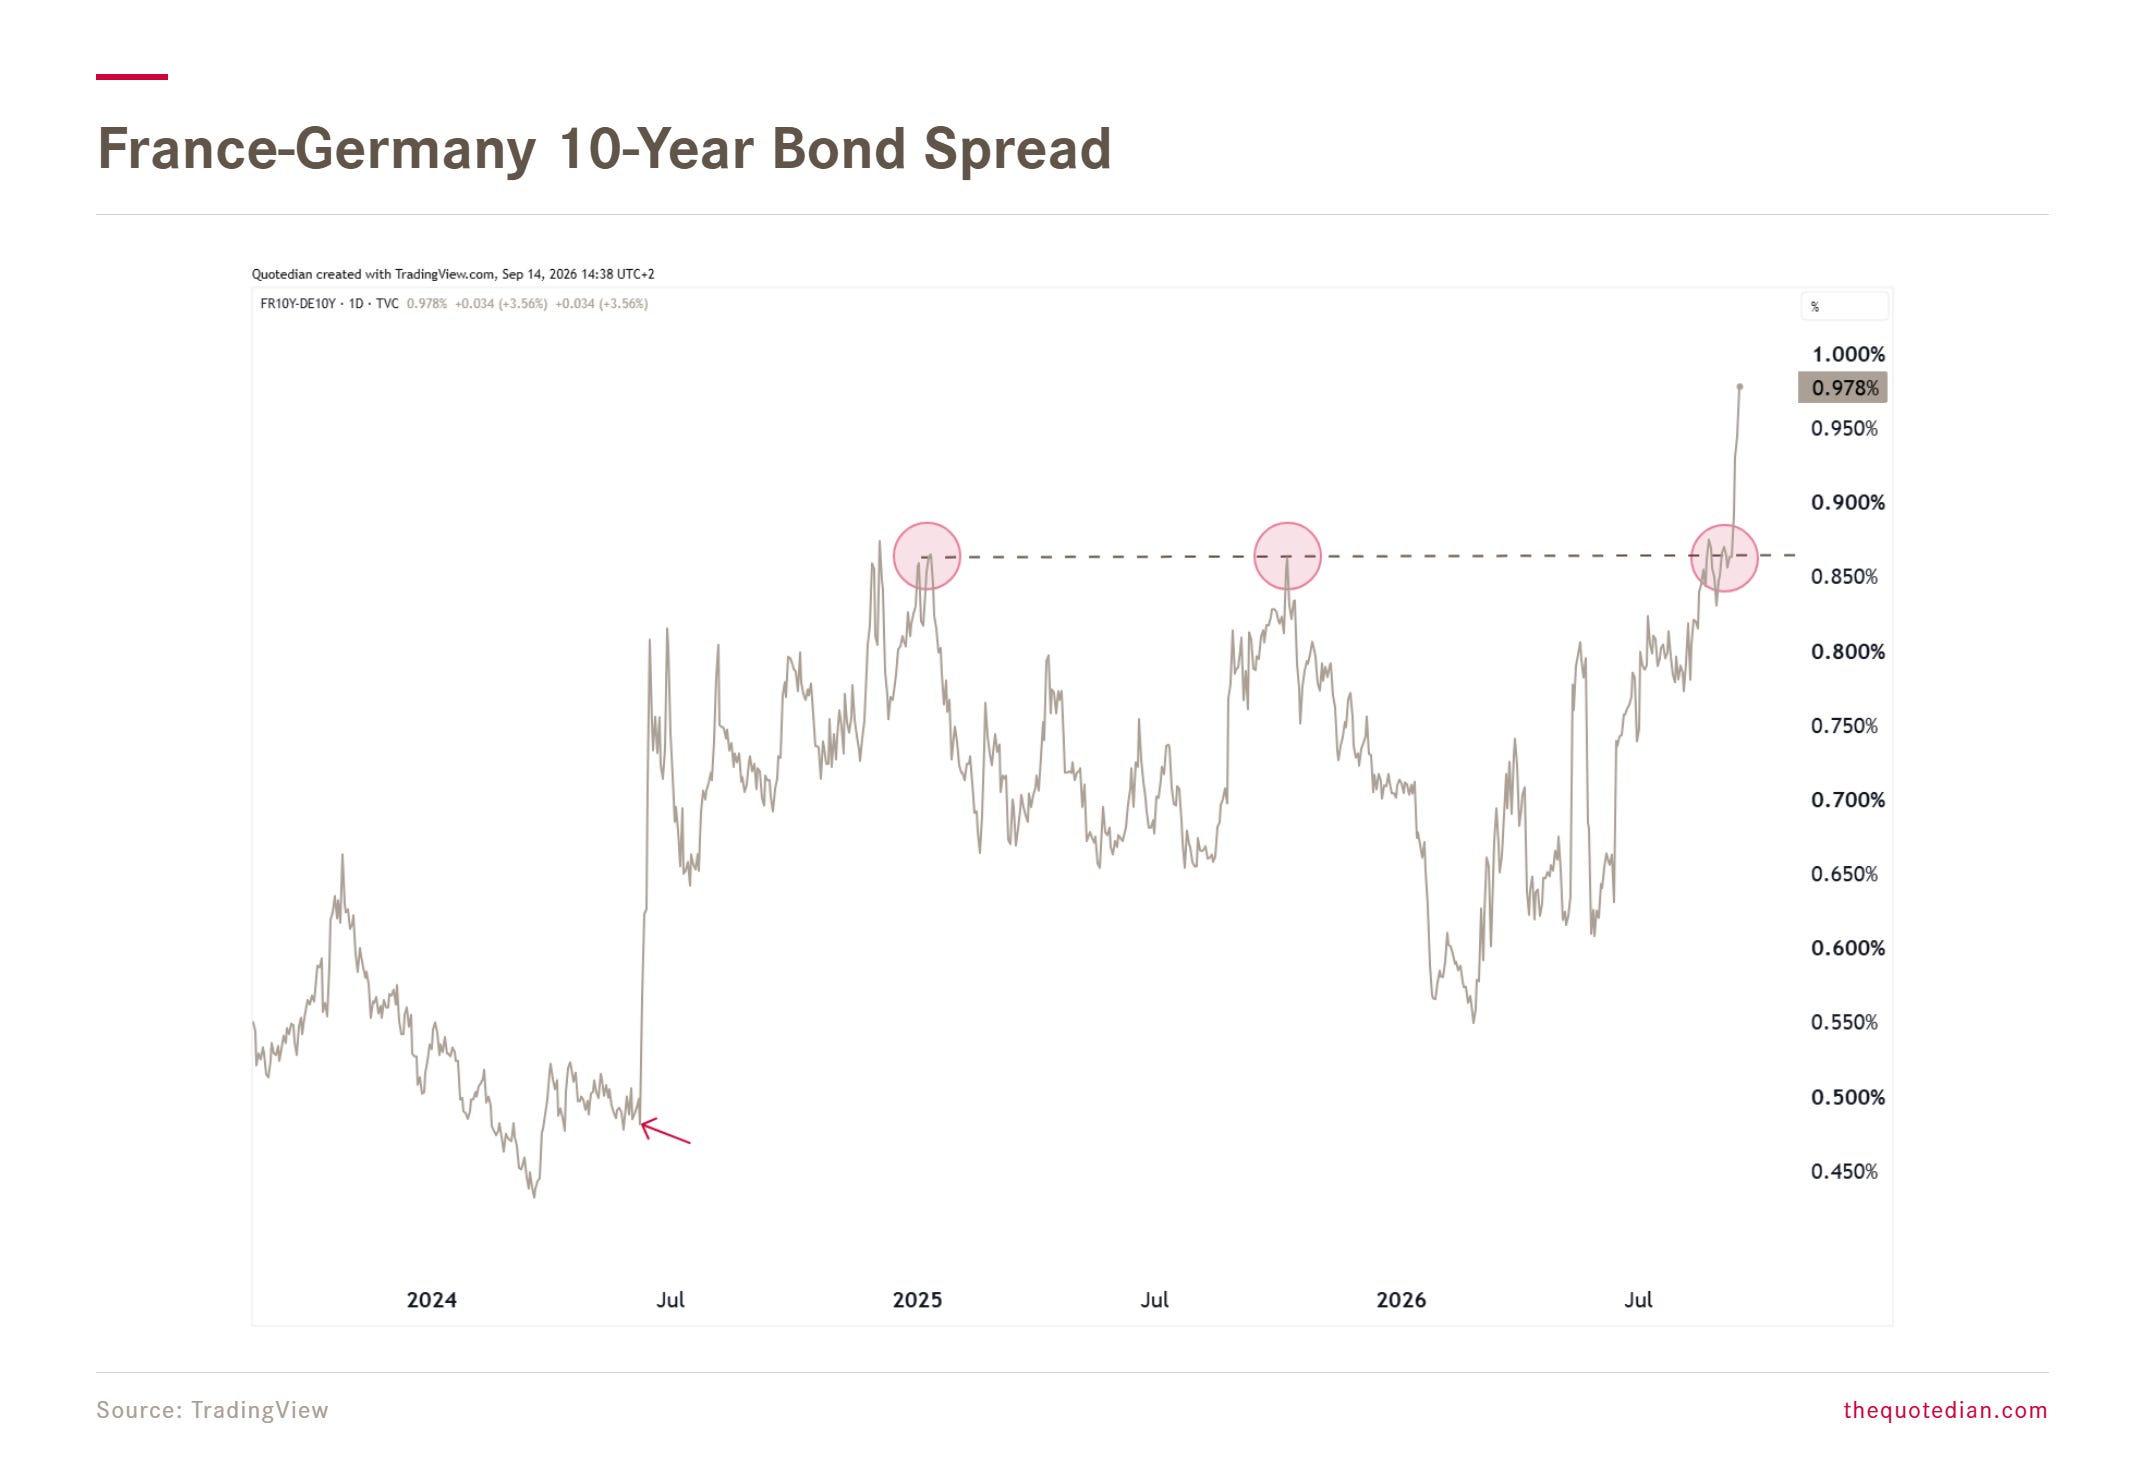
Whilst we know and have written about the upcoming French election (Spring 2027) and the perils associated by either the extreme right or the extreme left winning, last Friday’s news provided the “blow-out”:
France cut its 2026 growth forecast from 0.7% to 0.5% and, more importantly, admitted it will miss its 5% budget-deficit target — without offering a new one. With debt already near 118% of GDP and interest costs surging, weaker growth makes an already uncomfortable debt trajectory worse. The bond market got the message: fiscal credibility is eroding, and the vigilantes are returning to Paris.
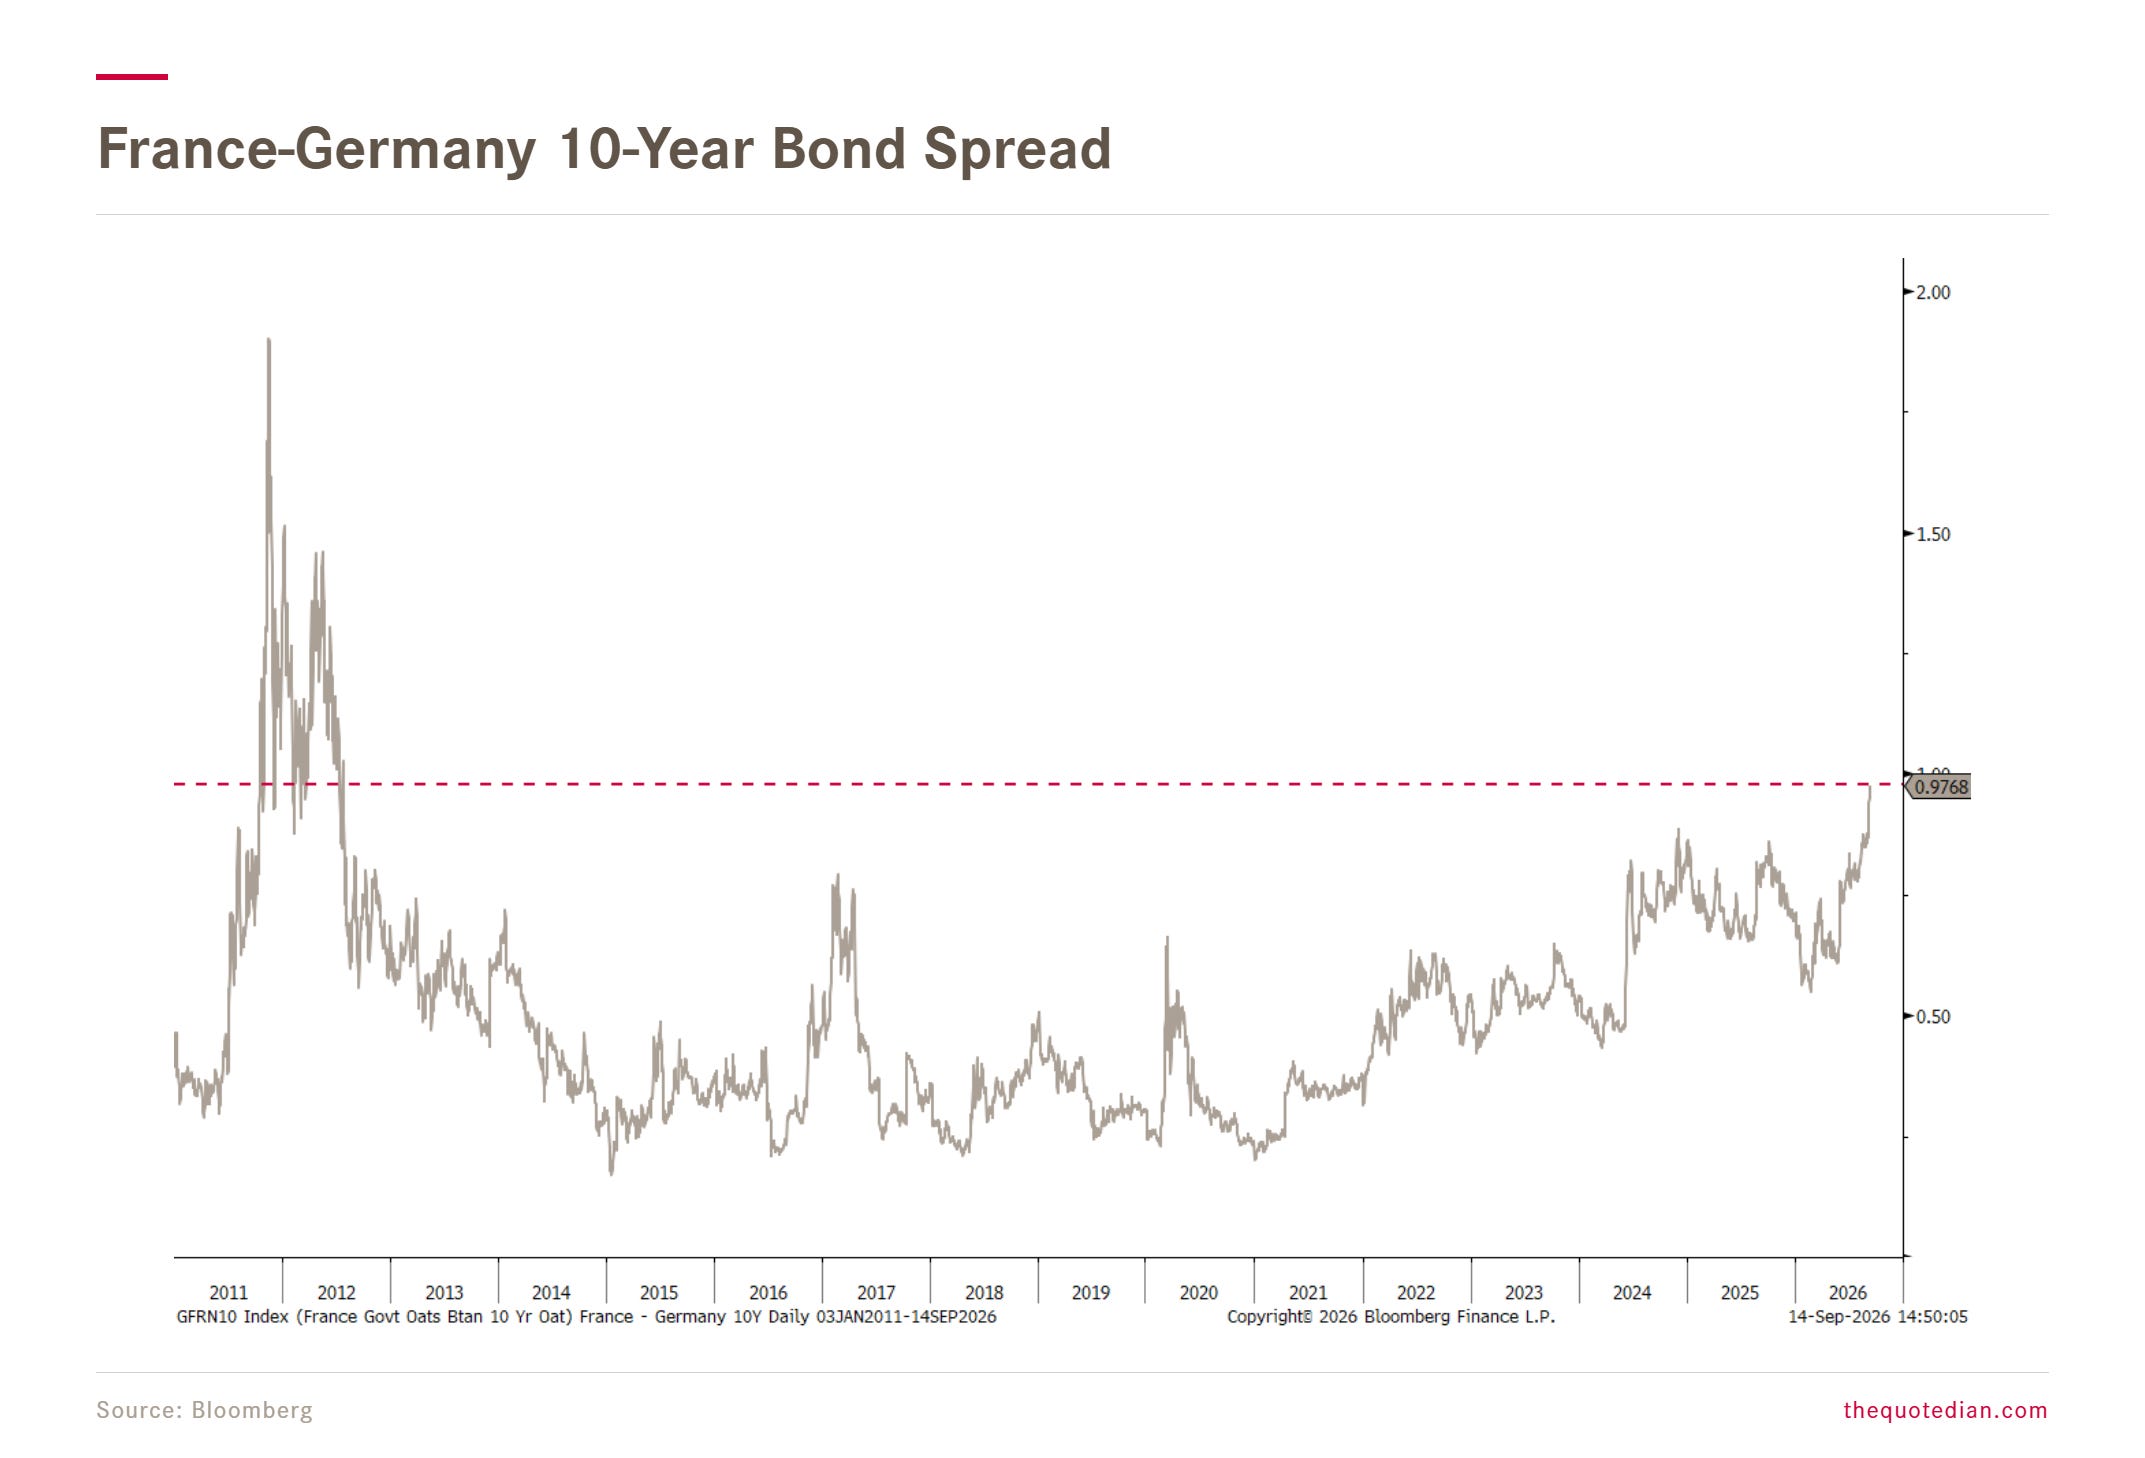
Hence we are at levels again not see since the European Sovereign Debt Crisis:
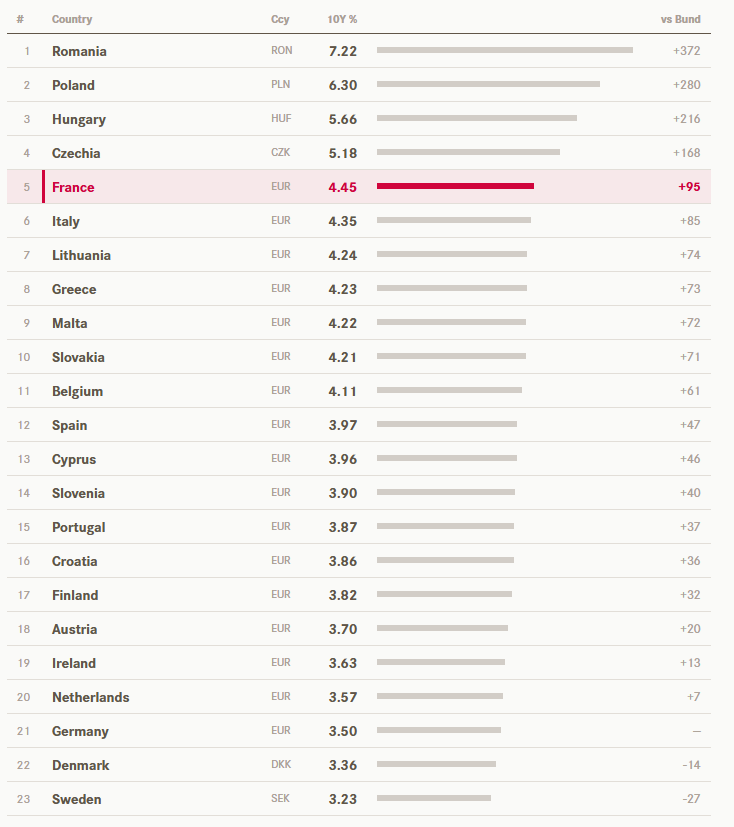
Or, in other words, with French yields 4.45%, they are the highest in the euro area and 9bp above Italy. The only EU sovereigns paying more are the four non-euro CEE issuers, where the gap reflects local policy rates rather than credit.
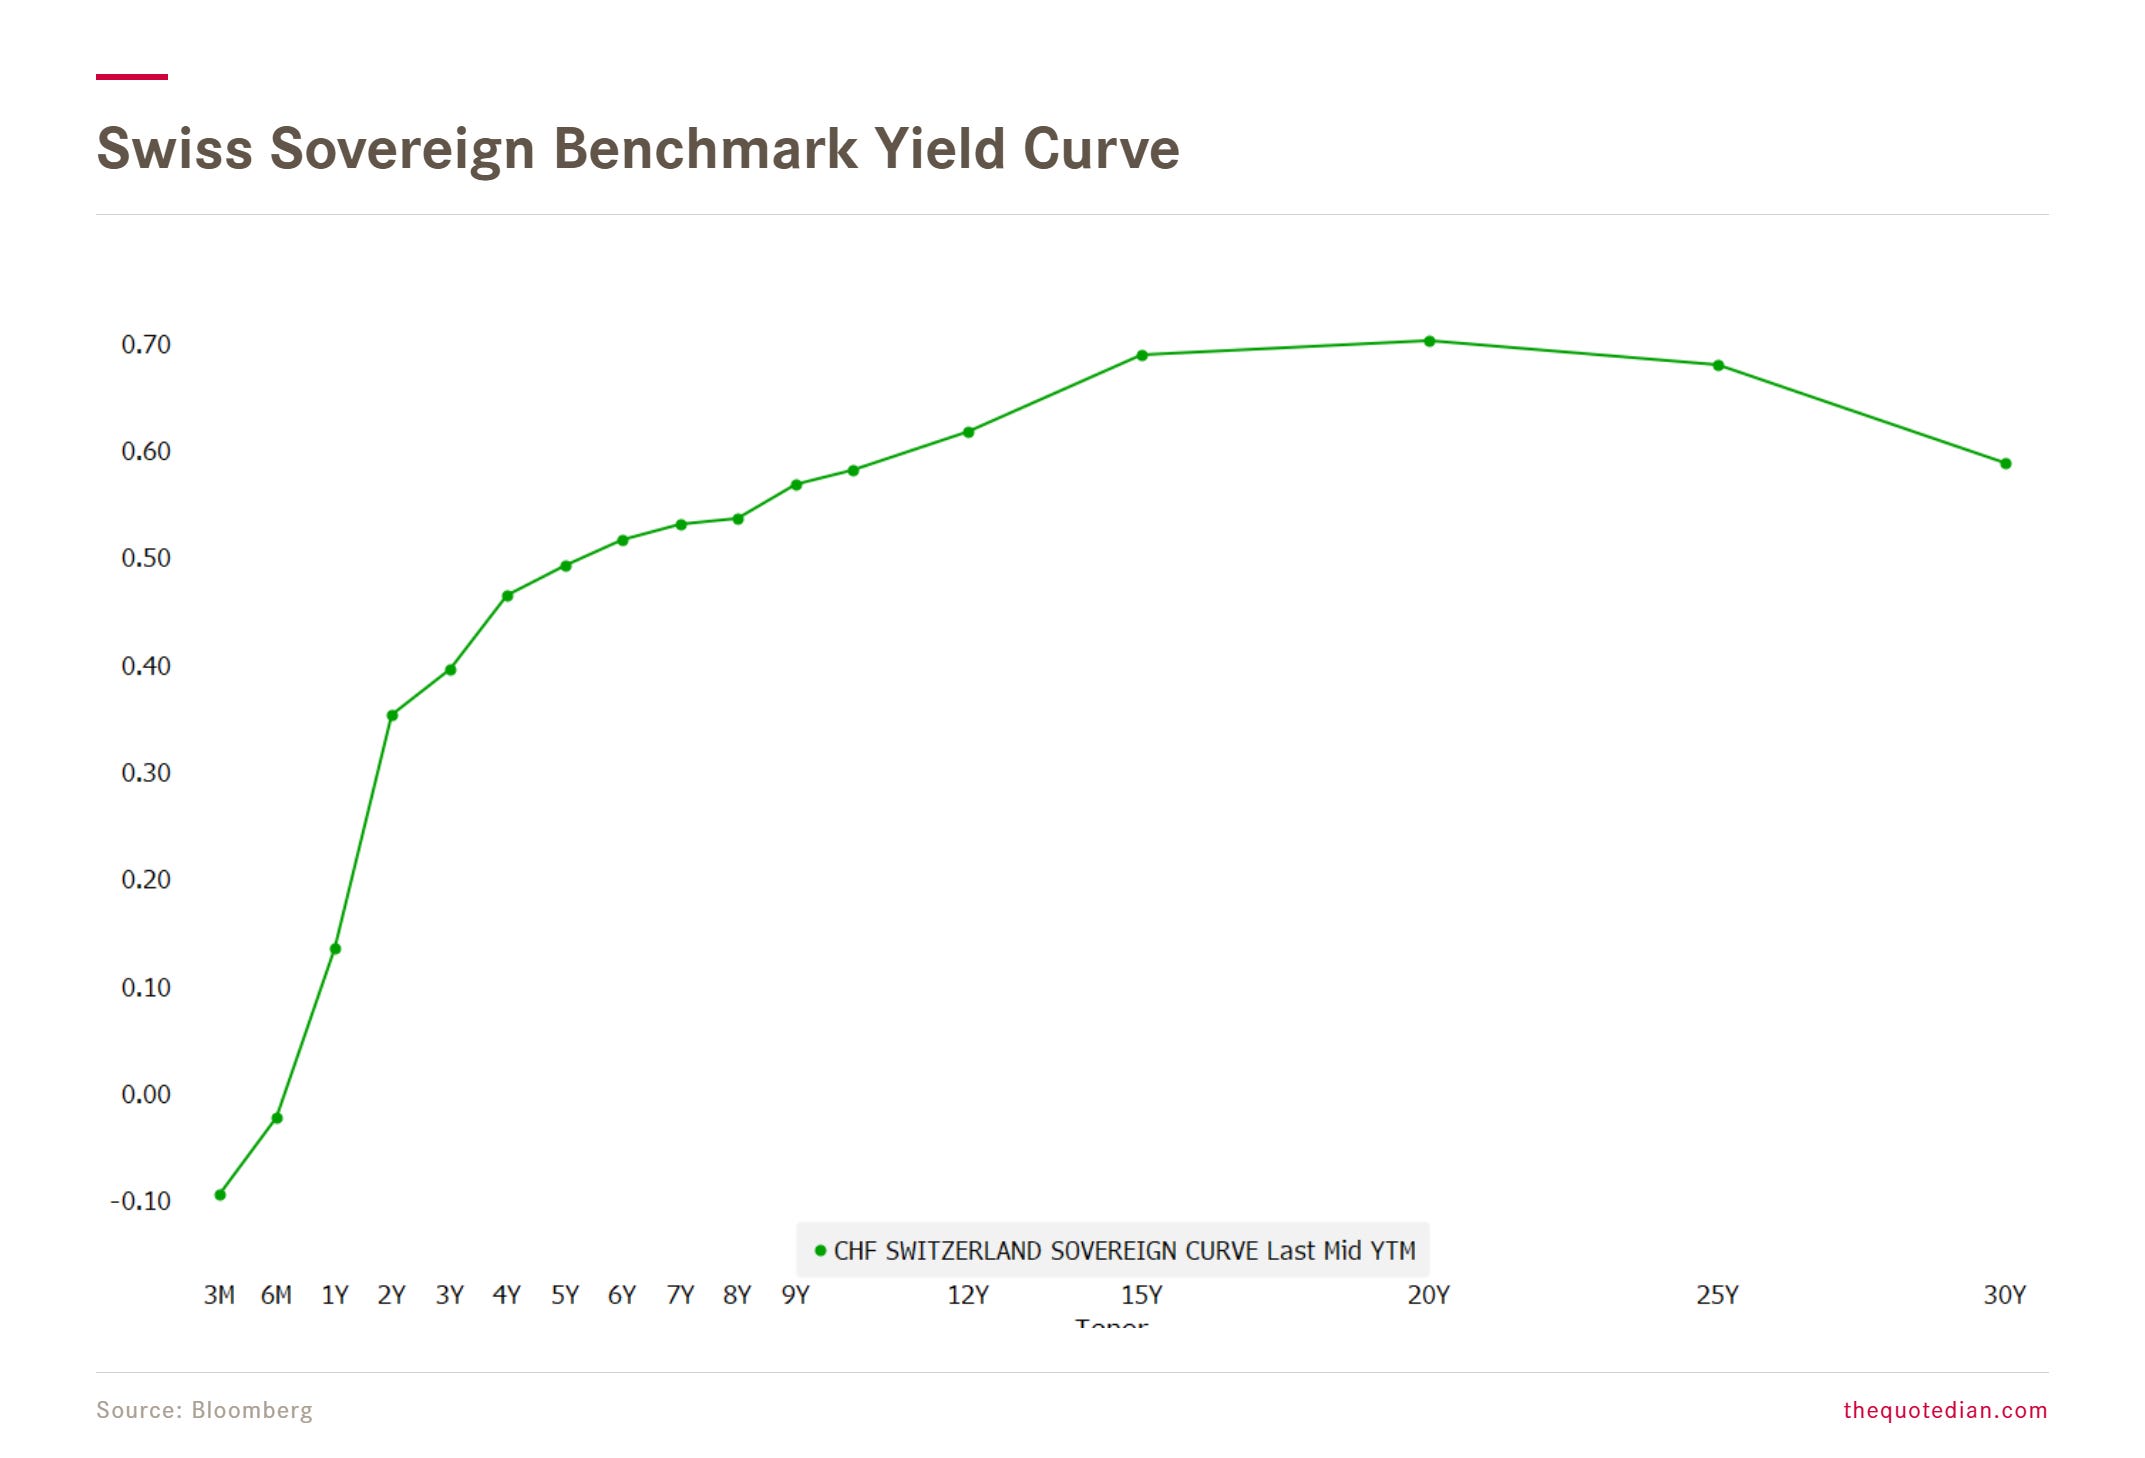
Nearly enough on government bond yields now - just one or two more - because we cannot go without mentioning that even a Swiss 10-year bond yields pays ‘something’ again:
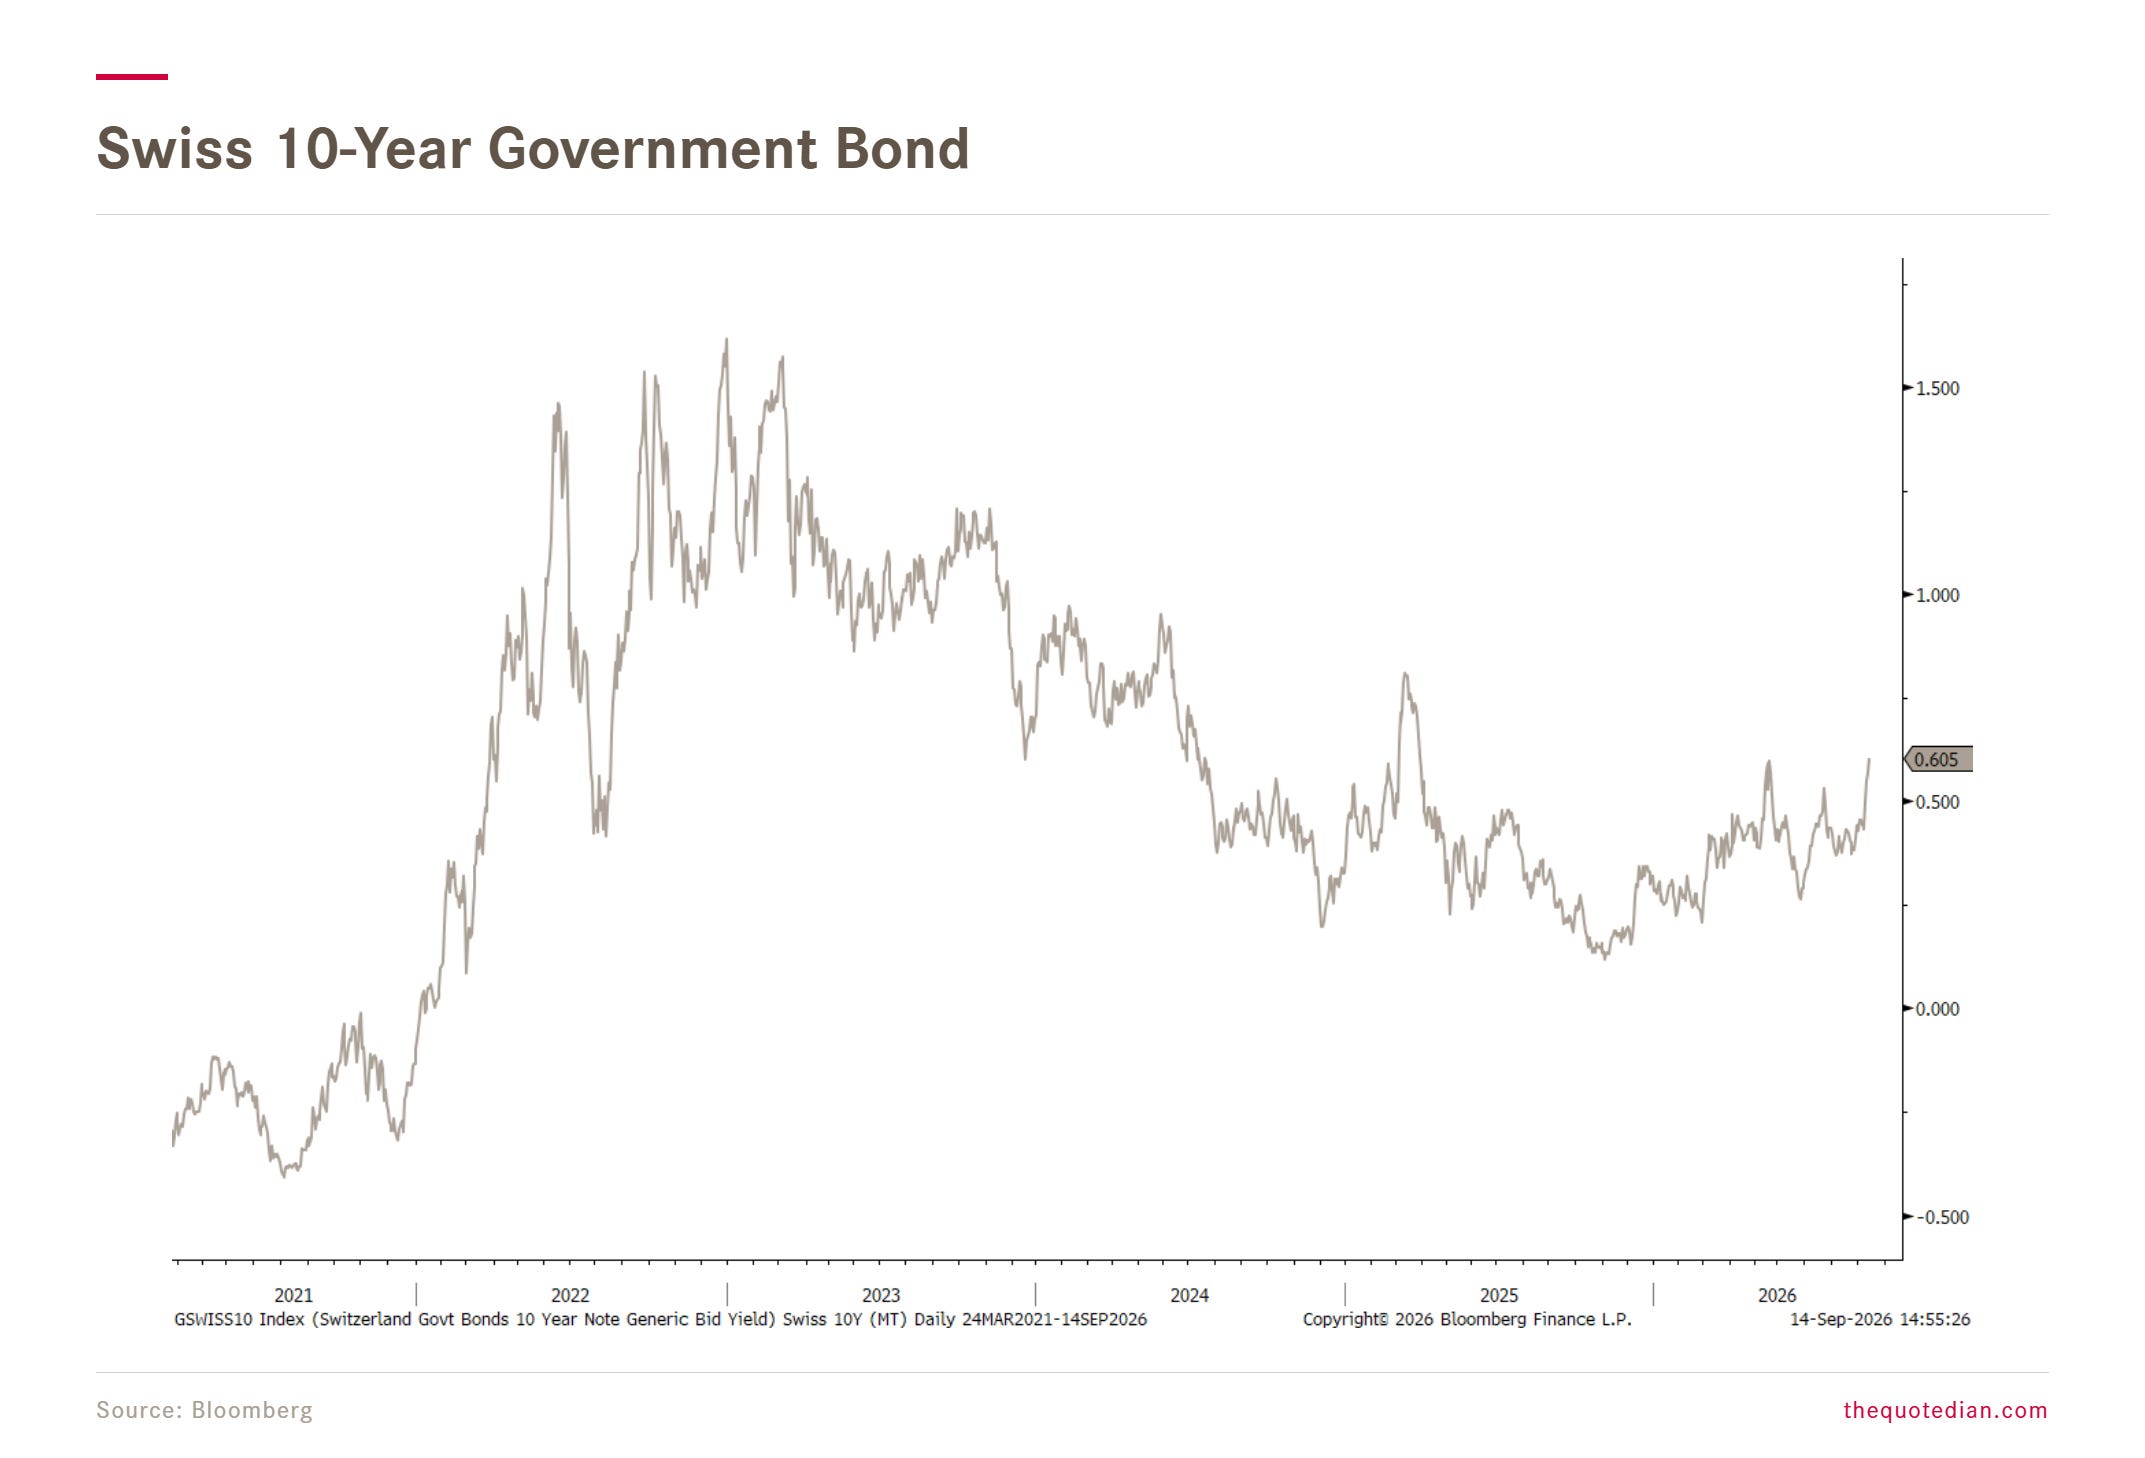
Nearly completely gone is the negative interest rate paradigm:
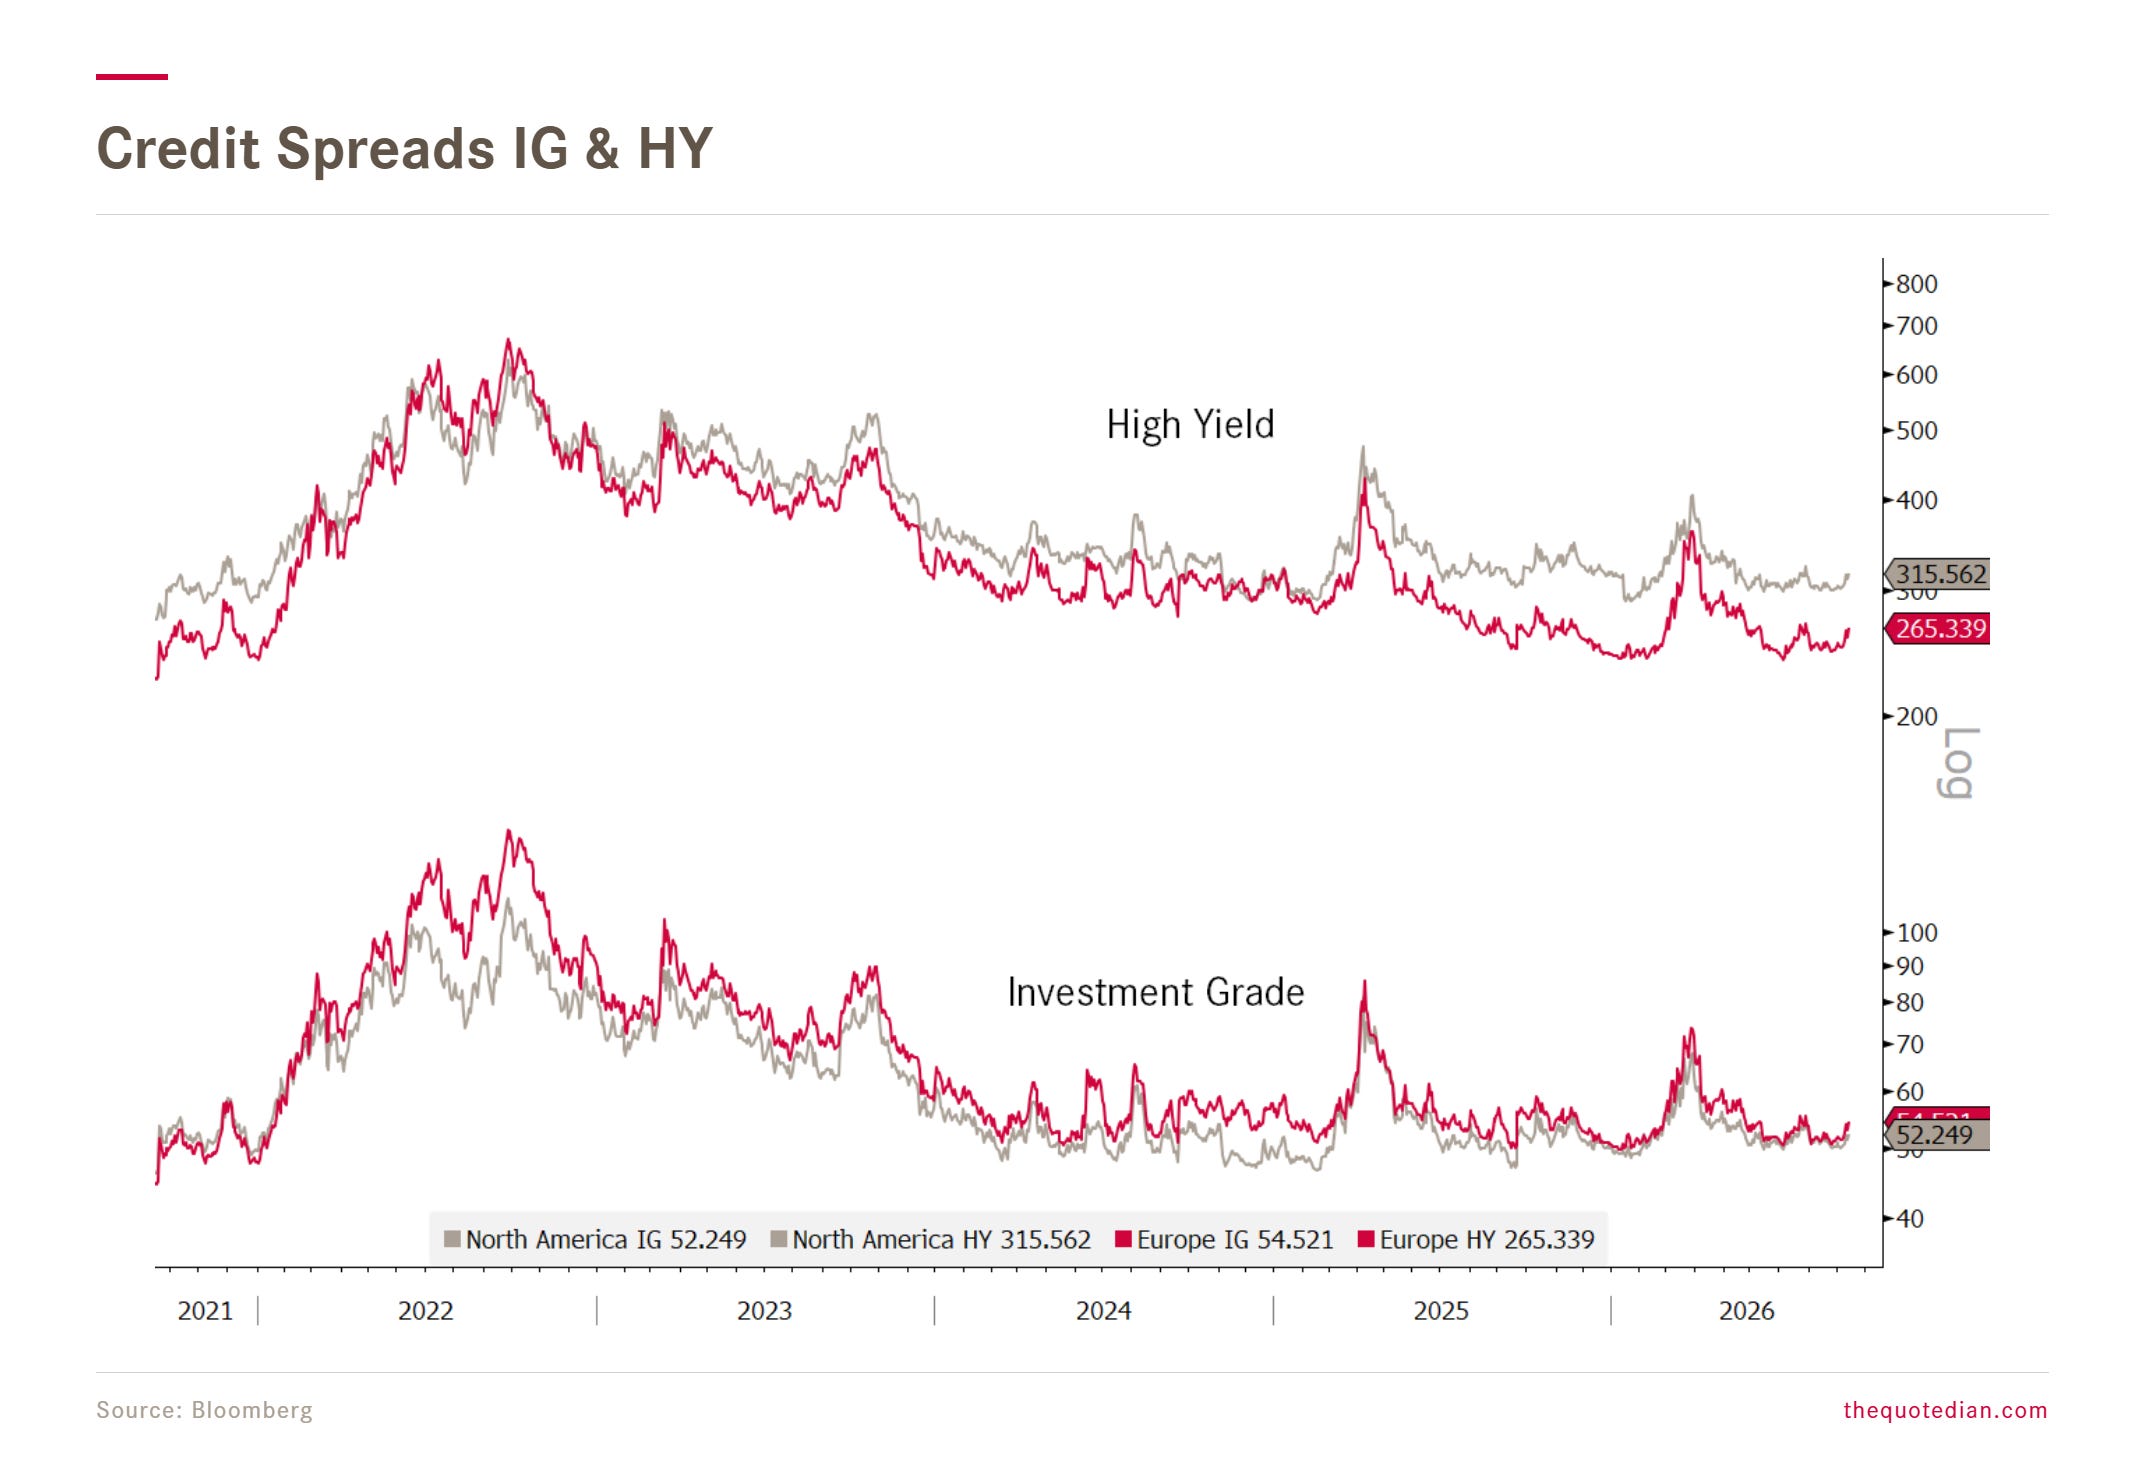
Credit spreads continue tight, despite a tiny widening observed over the past few weeks:
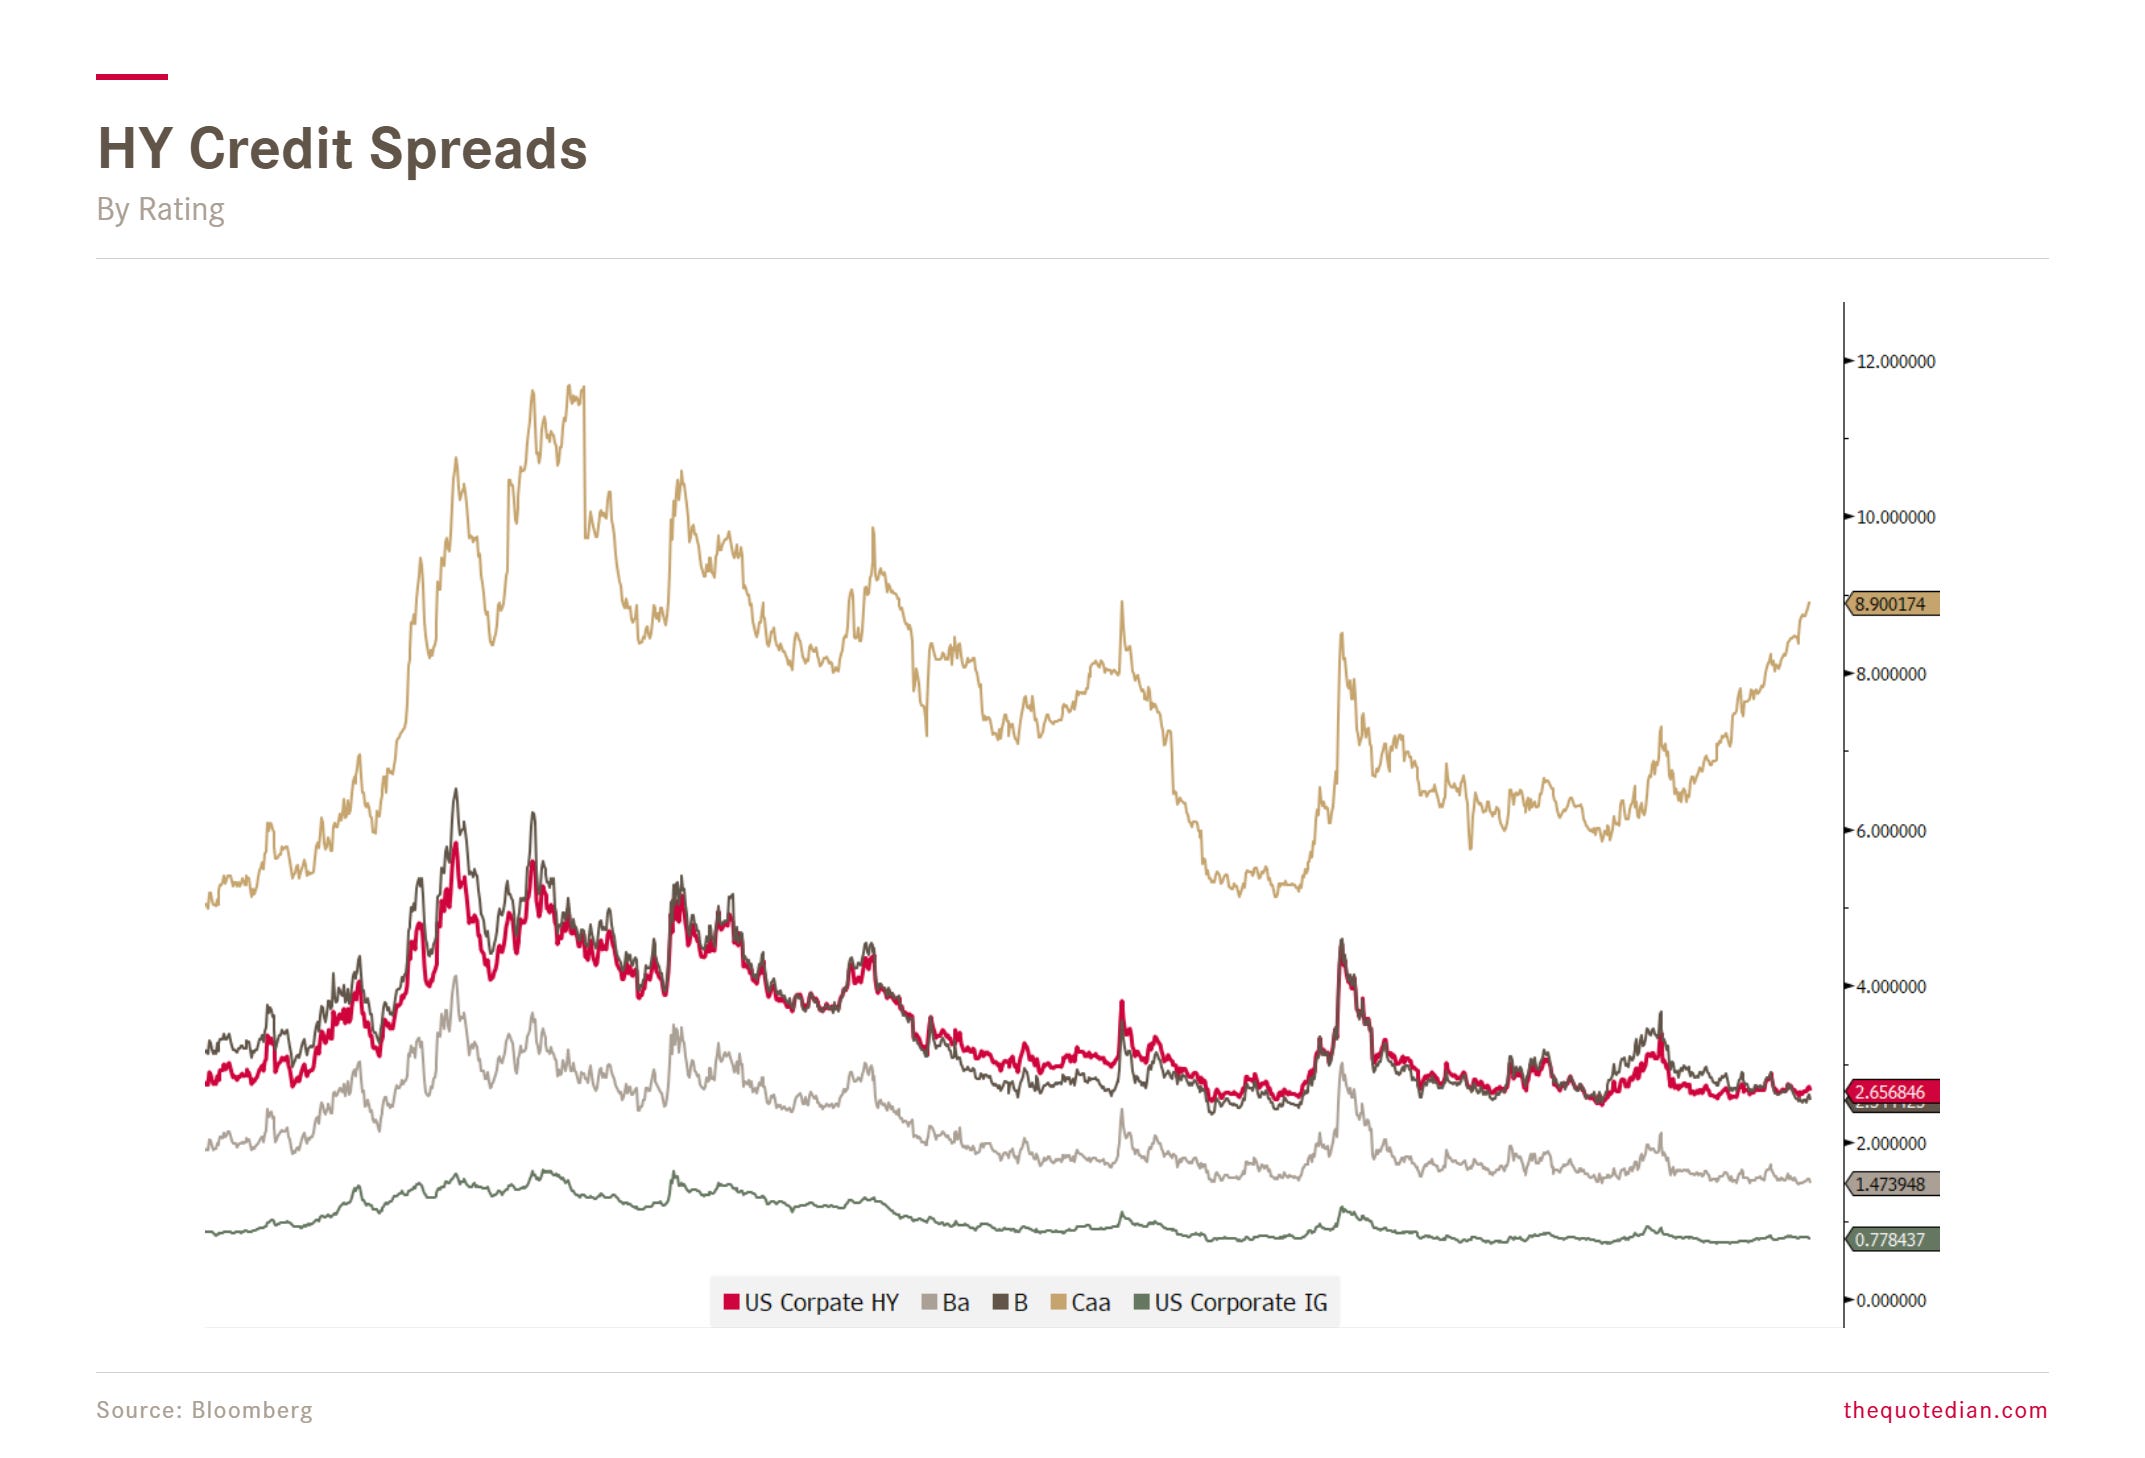
We continue to keep an eye on the widening amongst the CCC- rated bonds, which continues to fail to contaminate the other rating buckets:
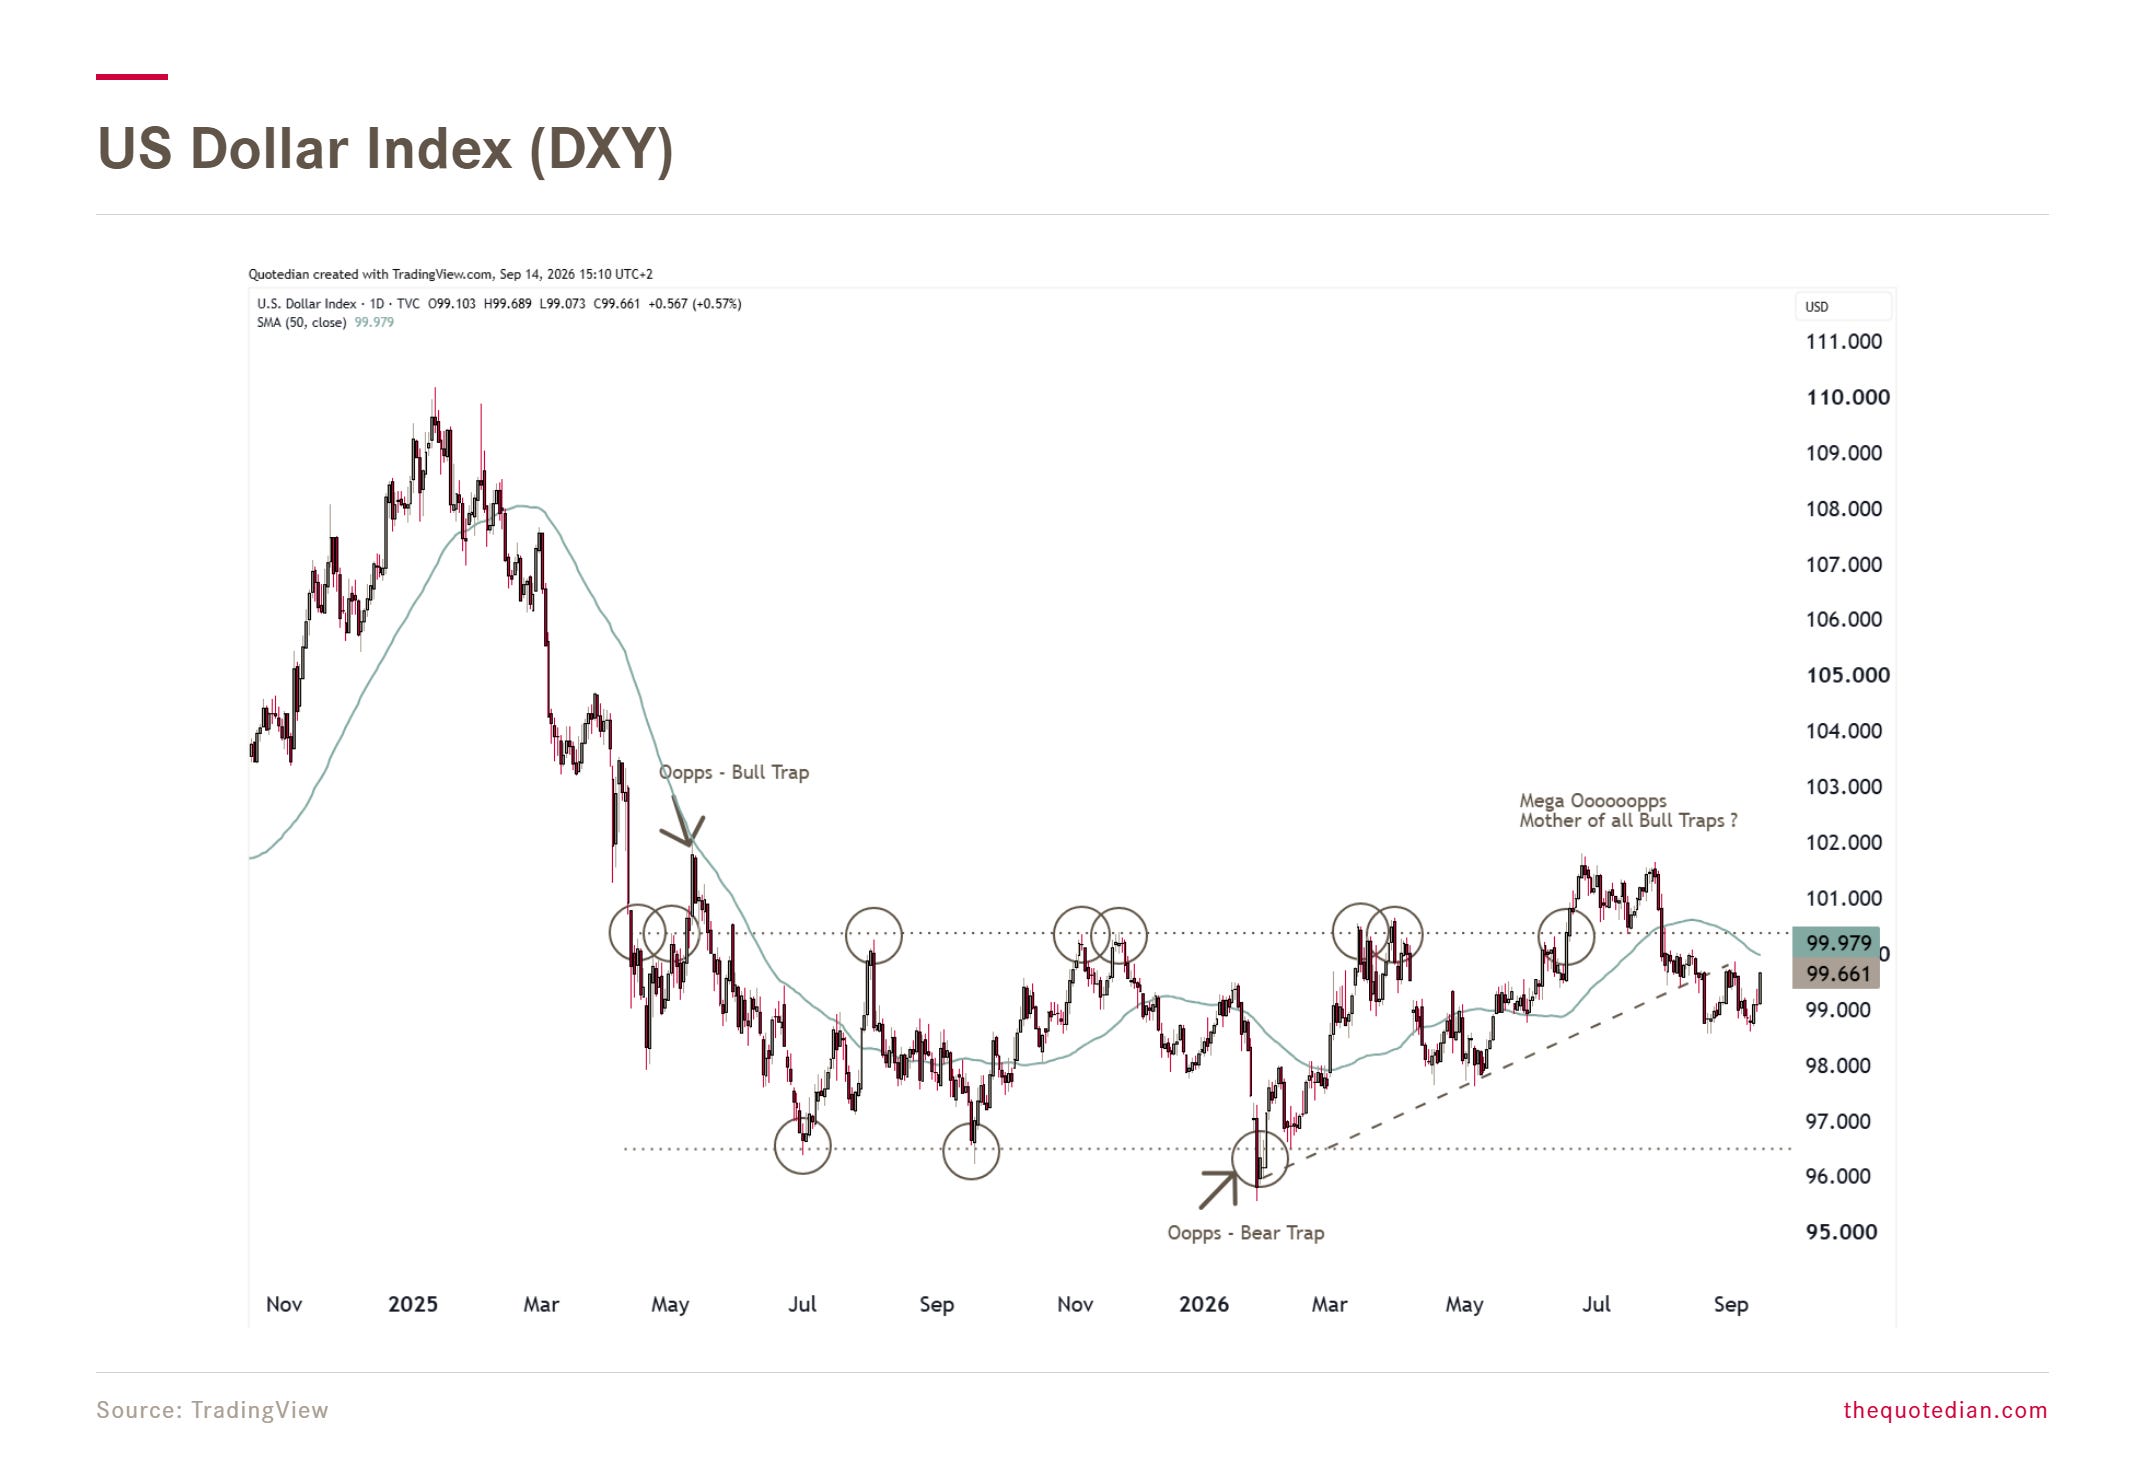
Turning briefly to currencies, the US Dollar Index (DXY) continues to be range stuck between two opposing forces:
Until recently, it was the weak JPY that kept the Dollar index from dropping meaningfully. That is clearly not the case anymore, with the Japanese Yen having rallied more than five percent over the past month:
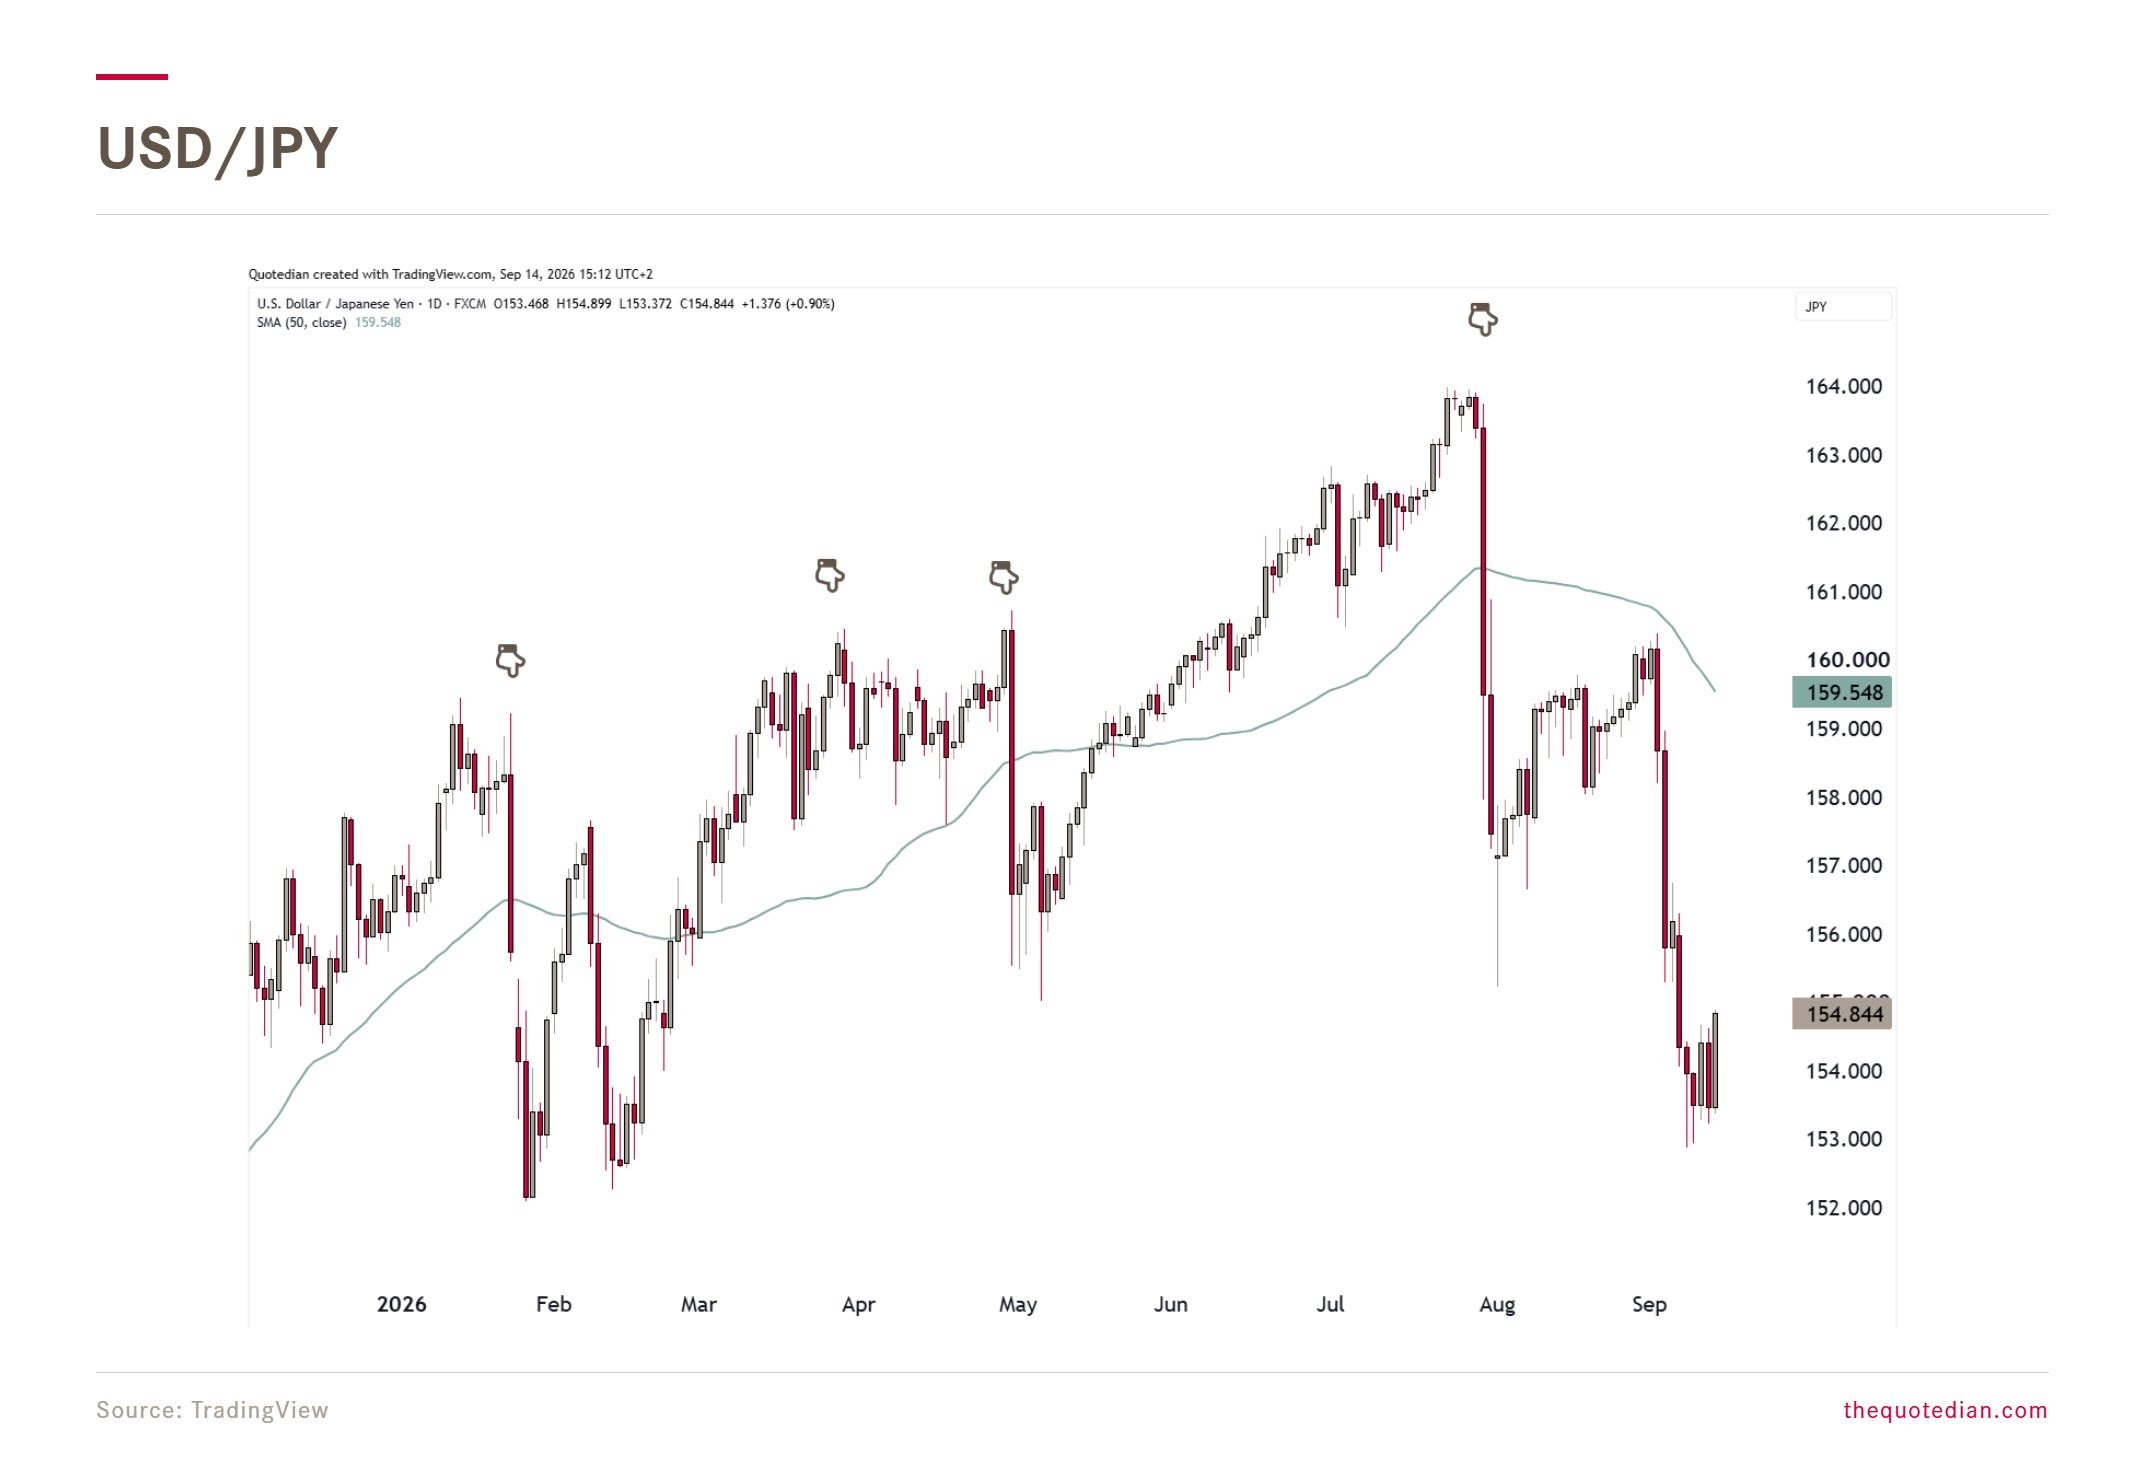
However, now suddenly a weak Euro, probably on the back of the French news, is now hindering the DXY to fall:
Frustratingly, the table has turned and the FX game continues to be one of the search for the least dirty shirt in the laundry basket.
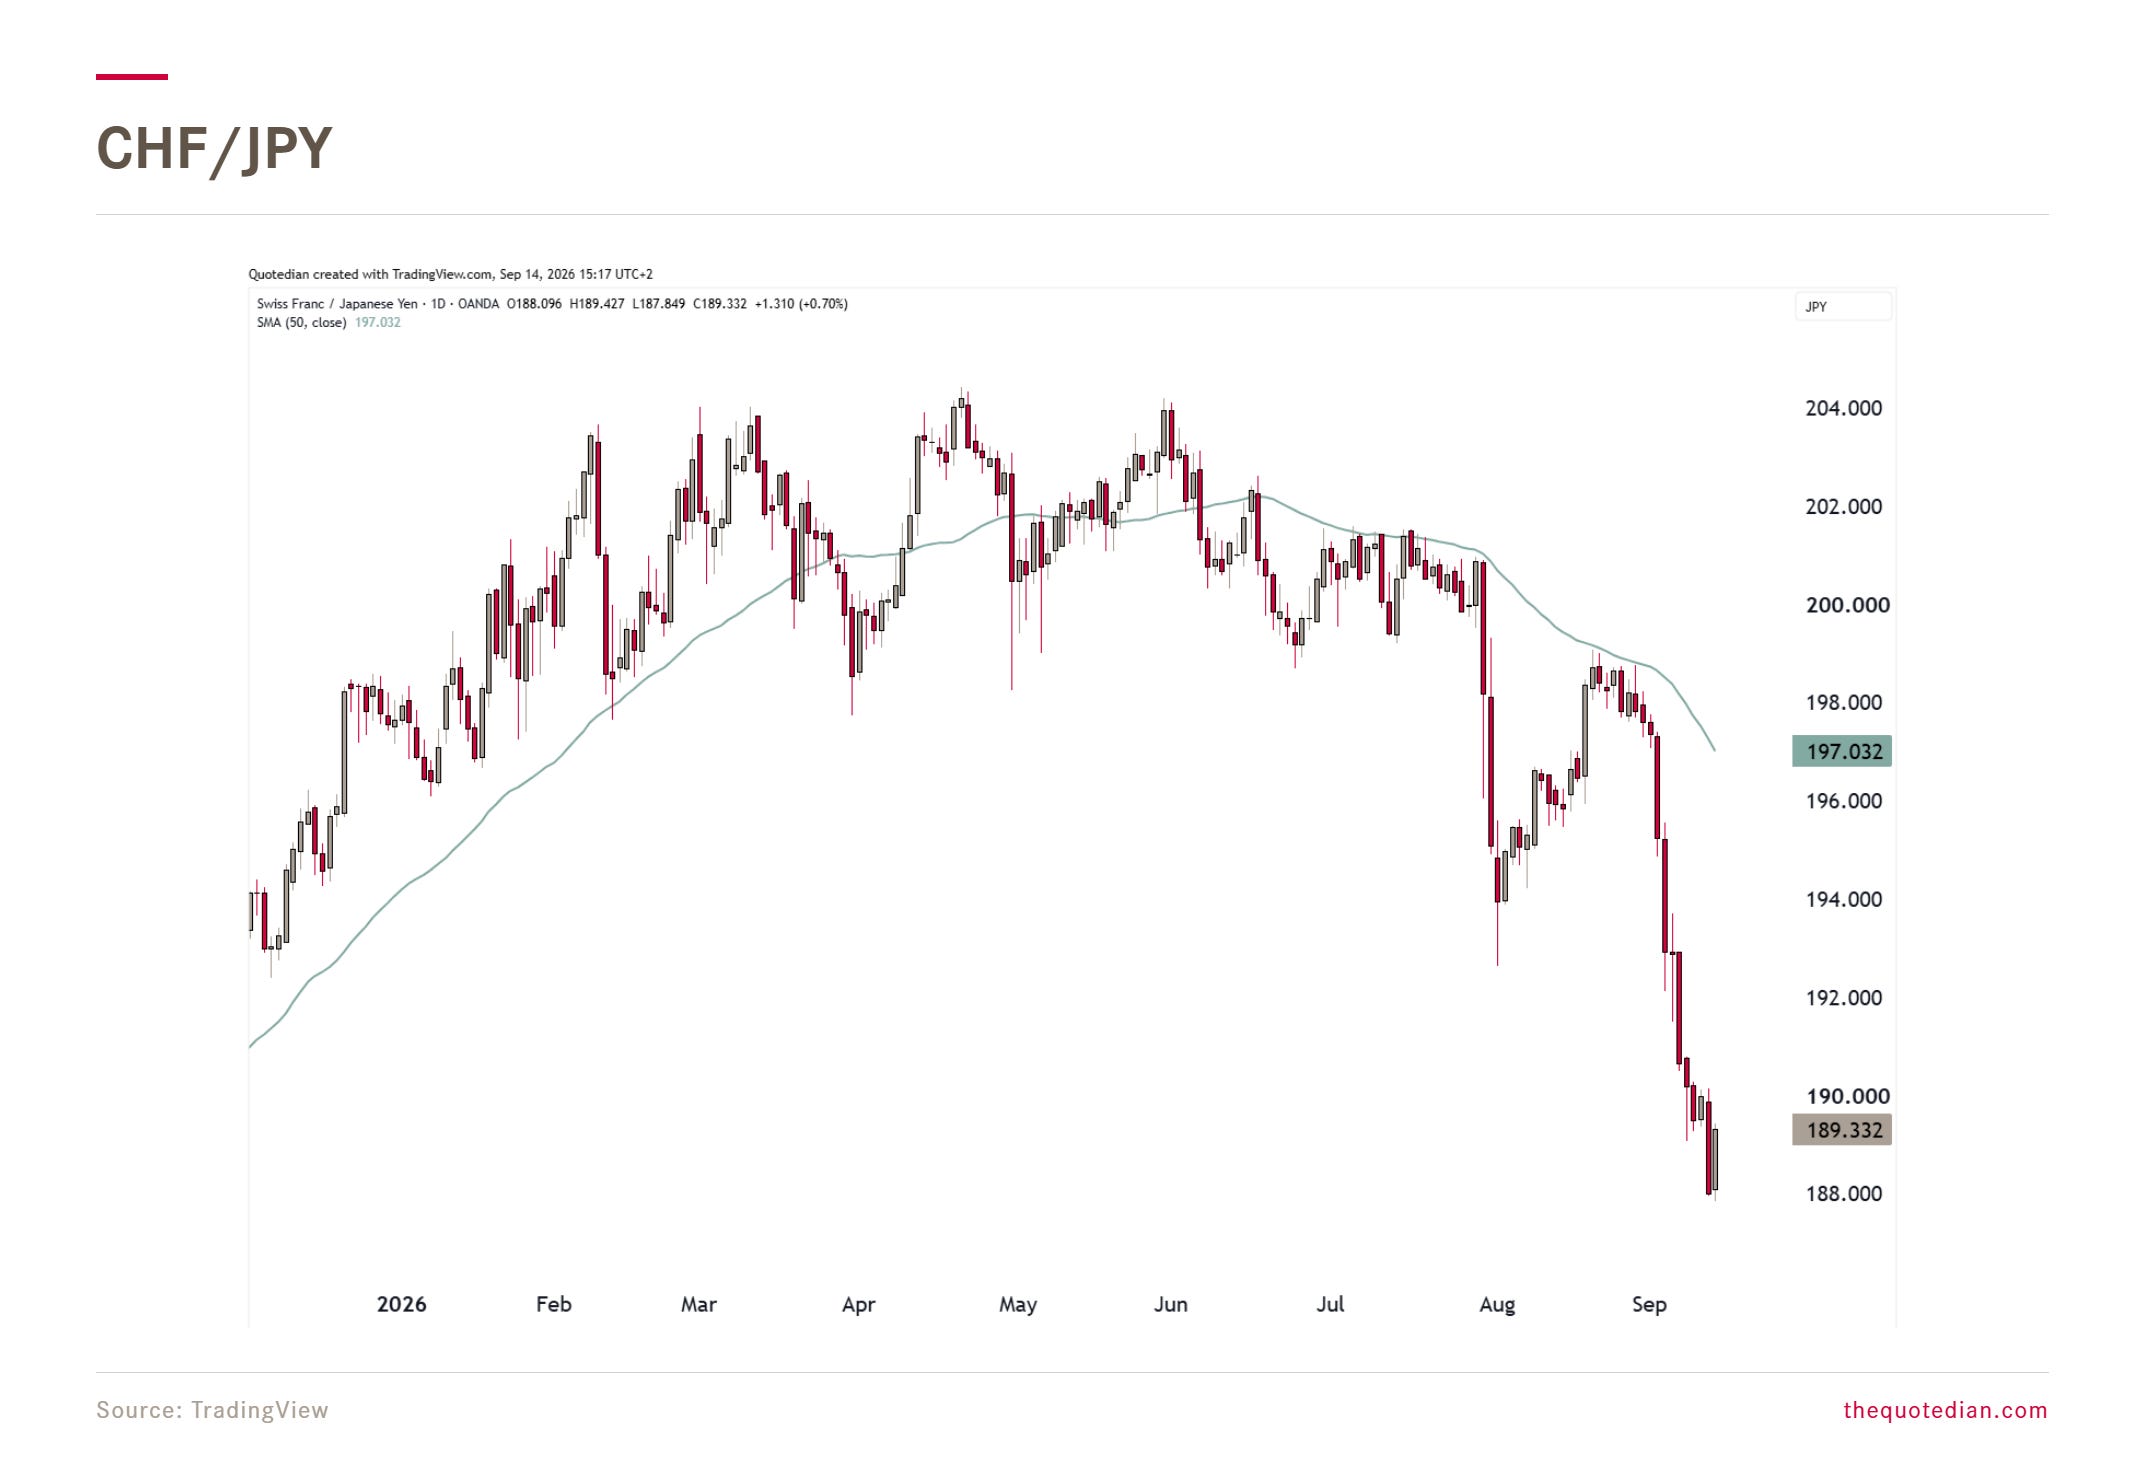
At least our last week’s recommendation (click here) for a short CHF/JPY position is paying off handsomely:
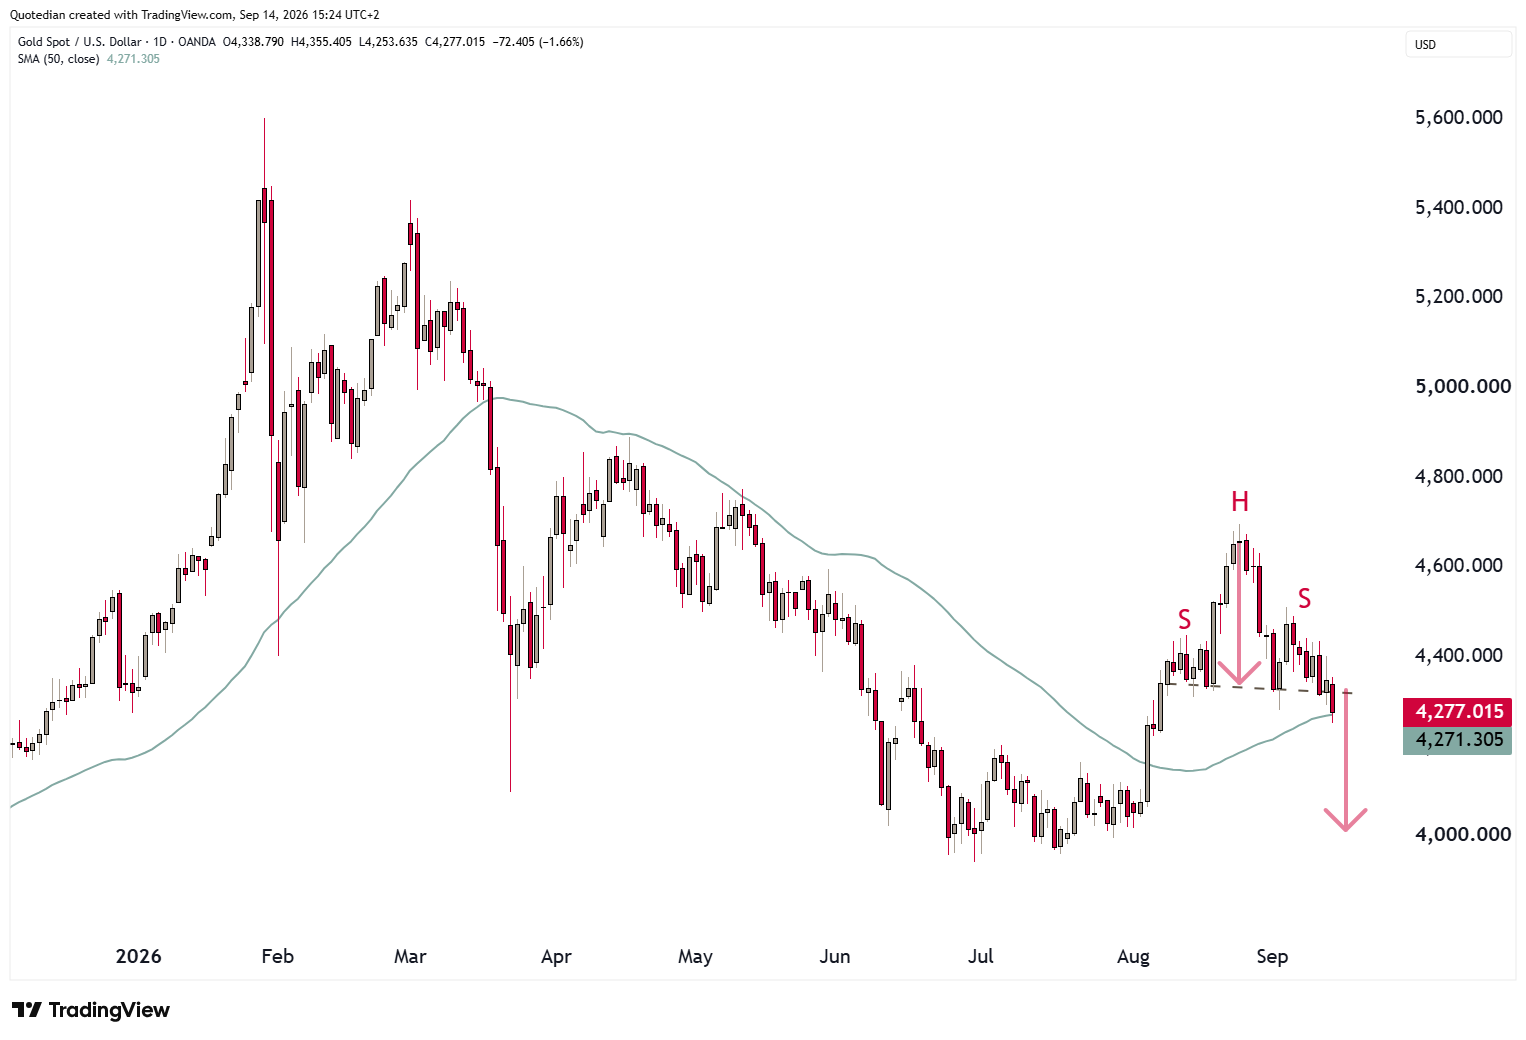
What is working a bit less well is our call for a higher Gold price. Real yields (grey line) are pulling Gold lower:
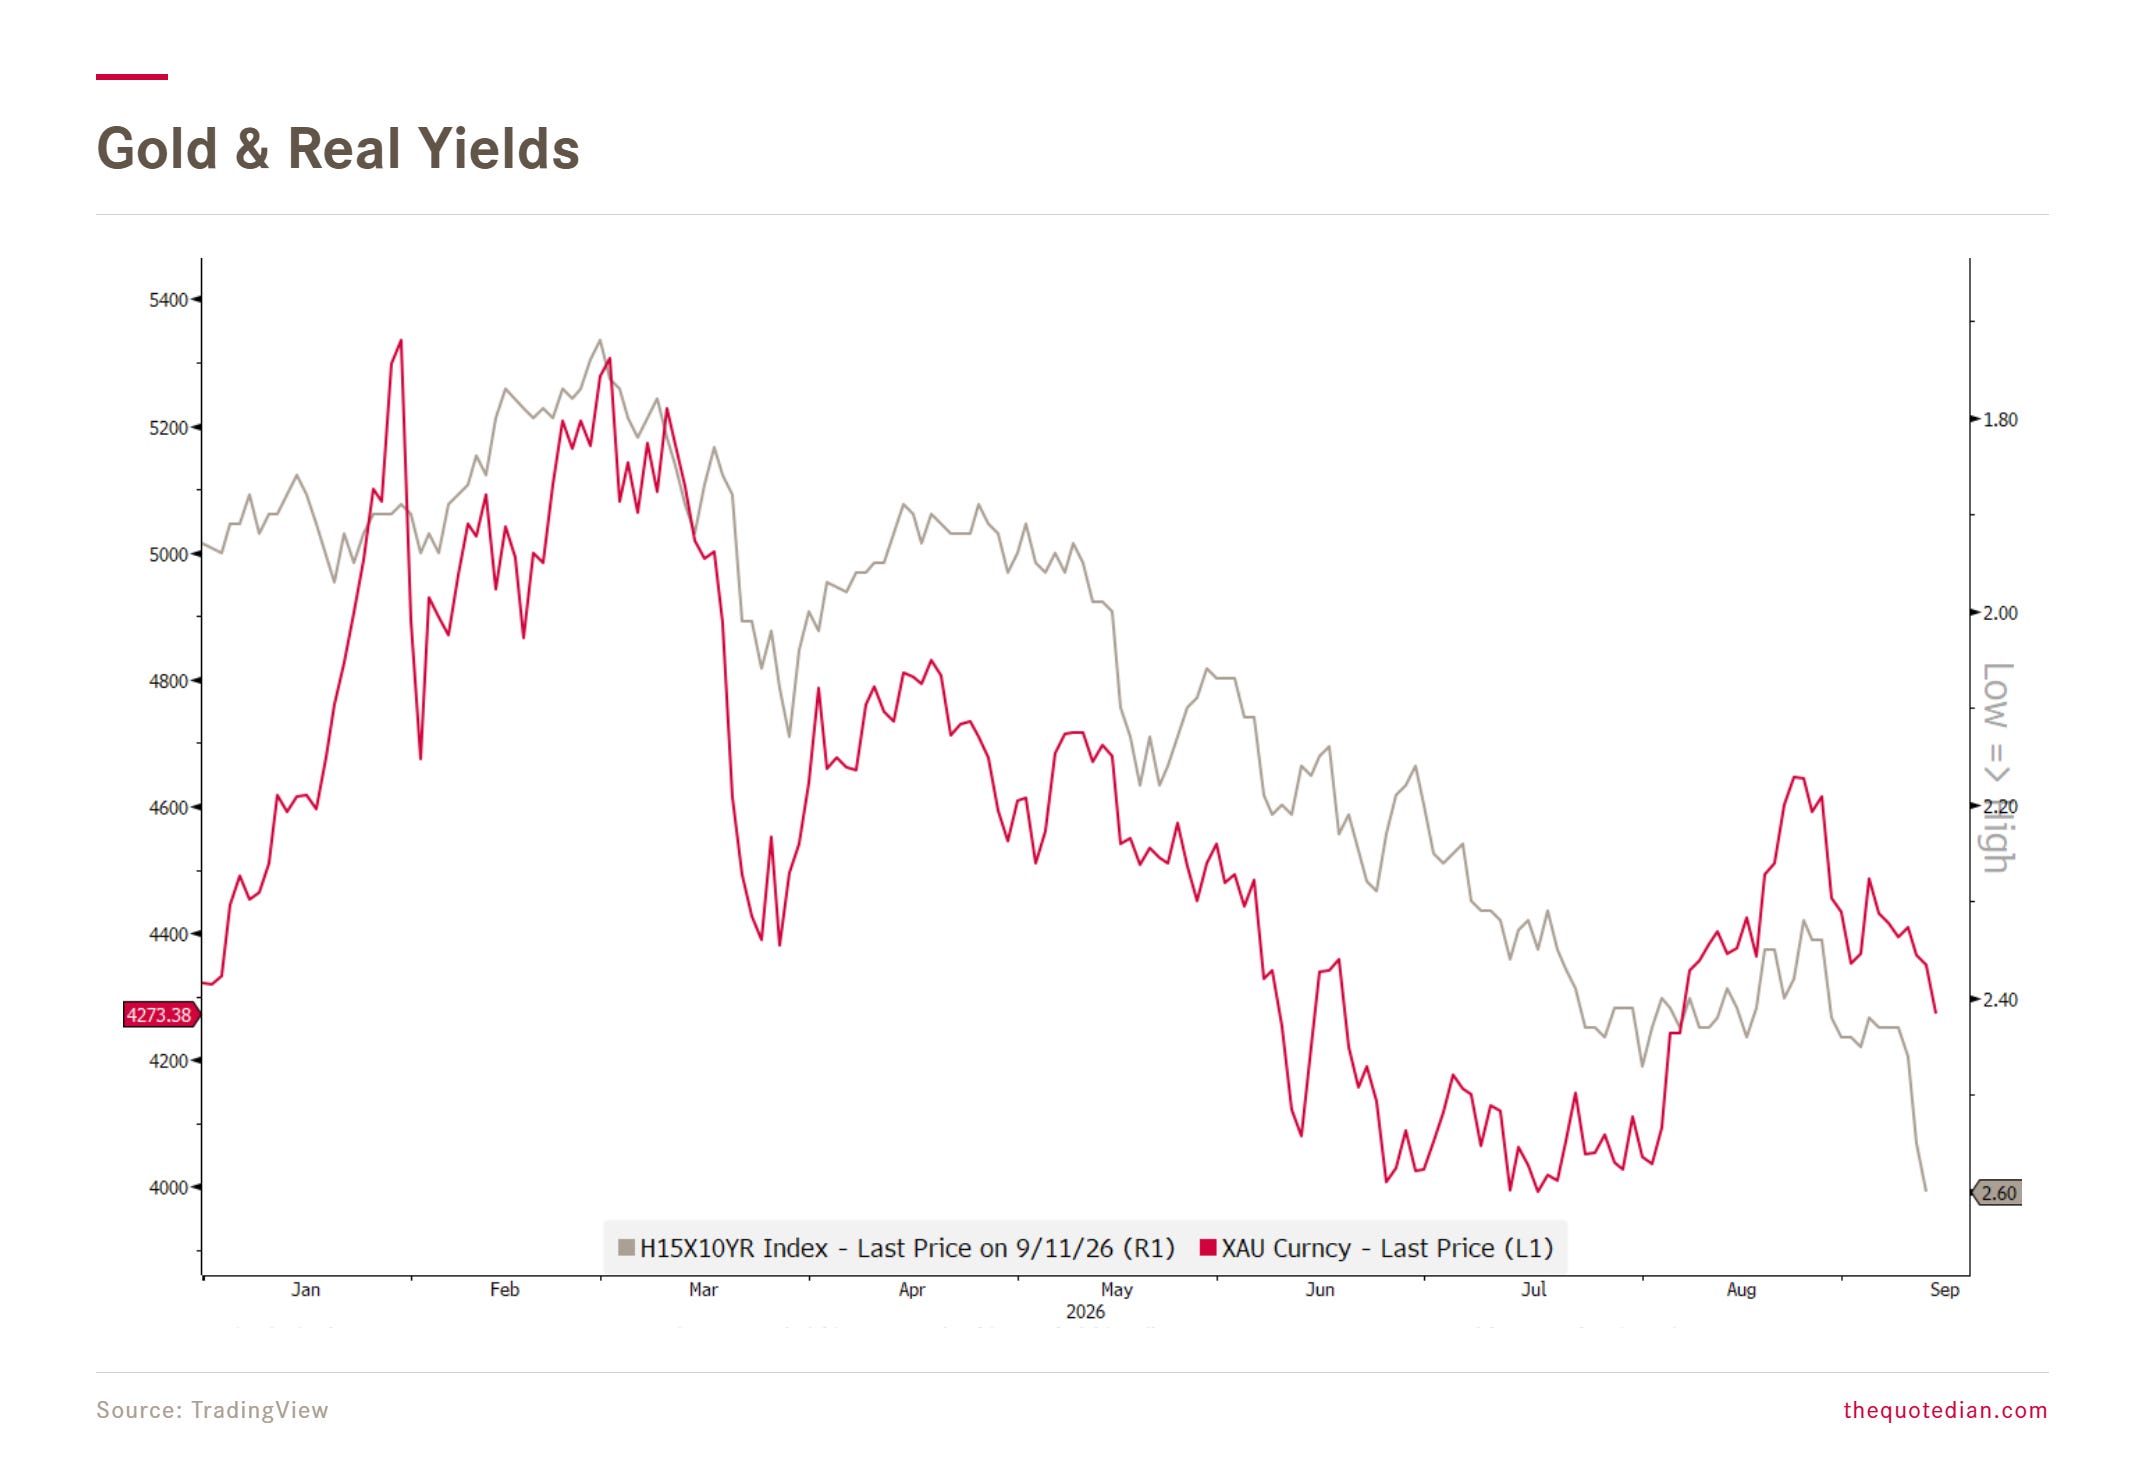
On the Gold chart, there’s a small danger of a short-term shoulder-head-shoulder top, which could take the Gold price back down to the July lows:
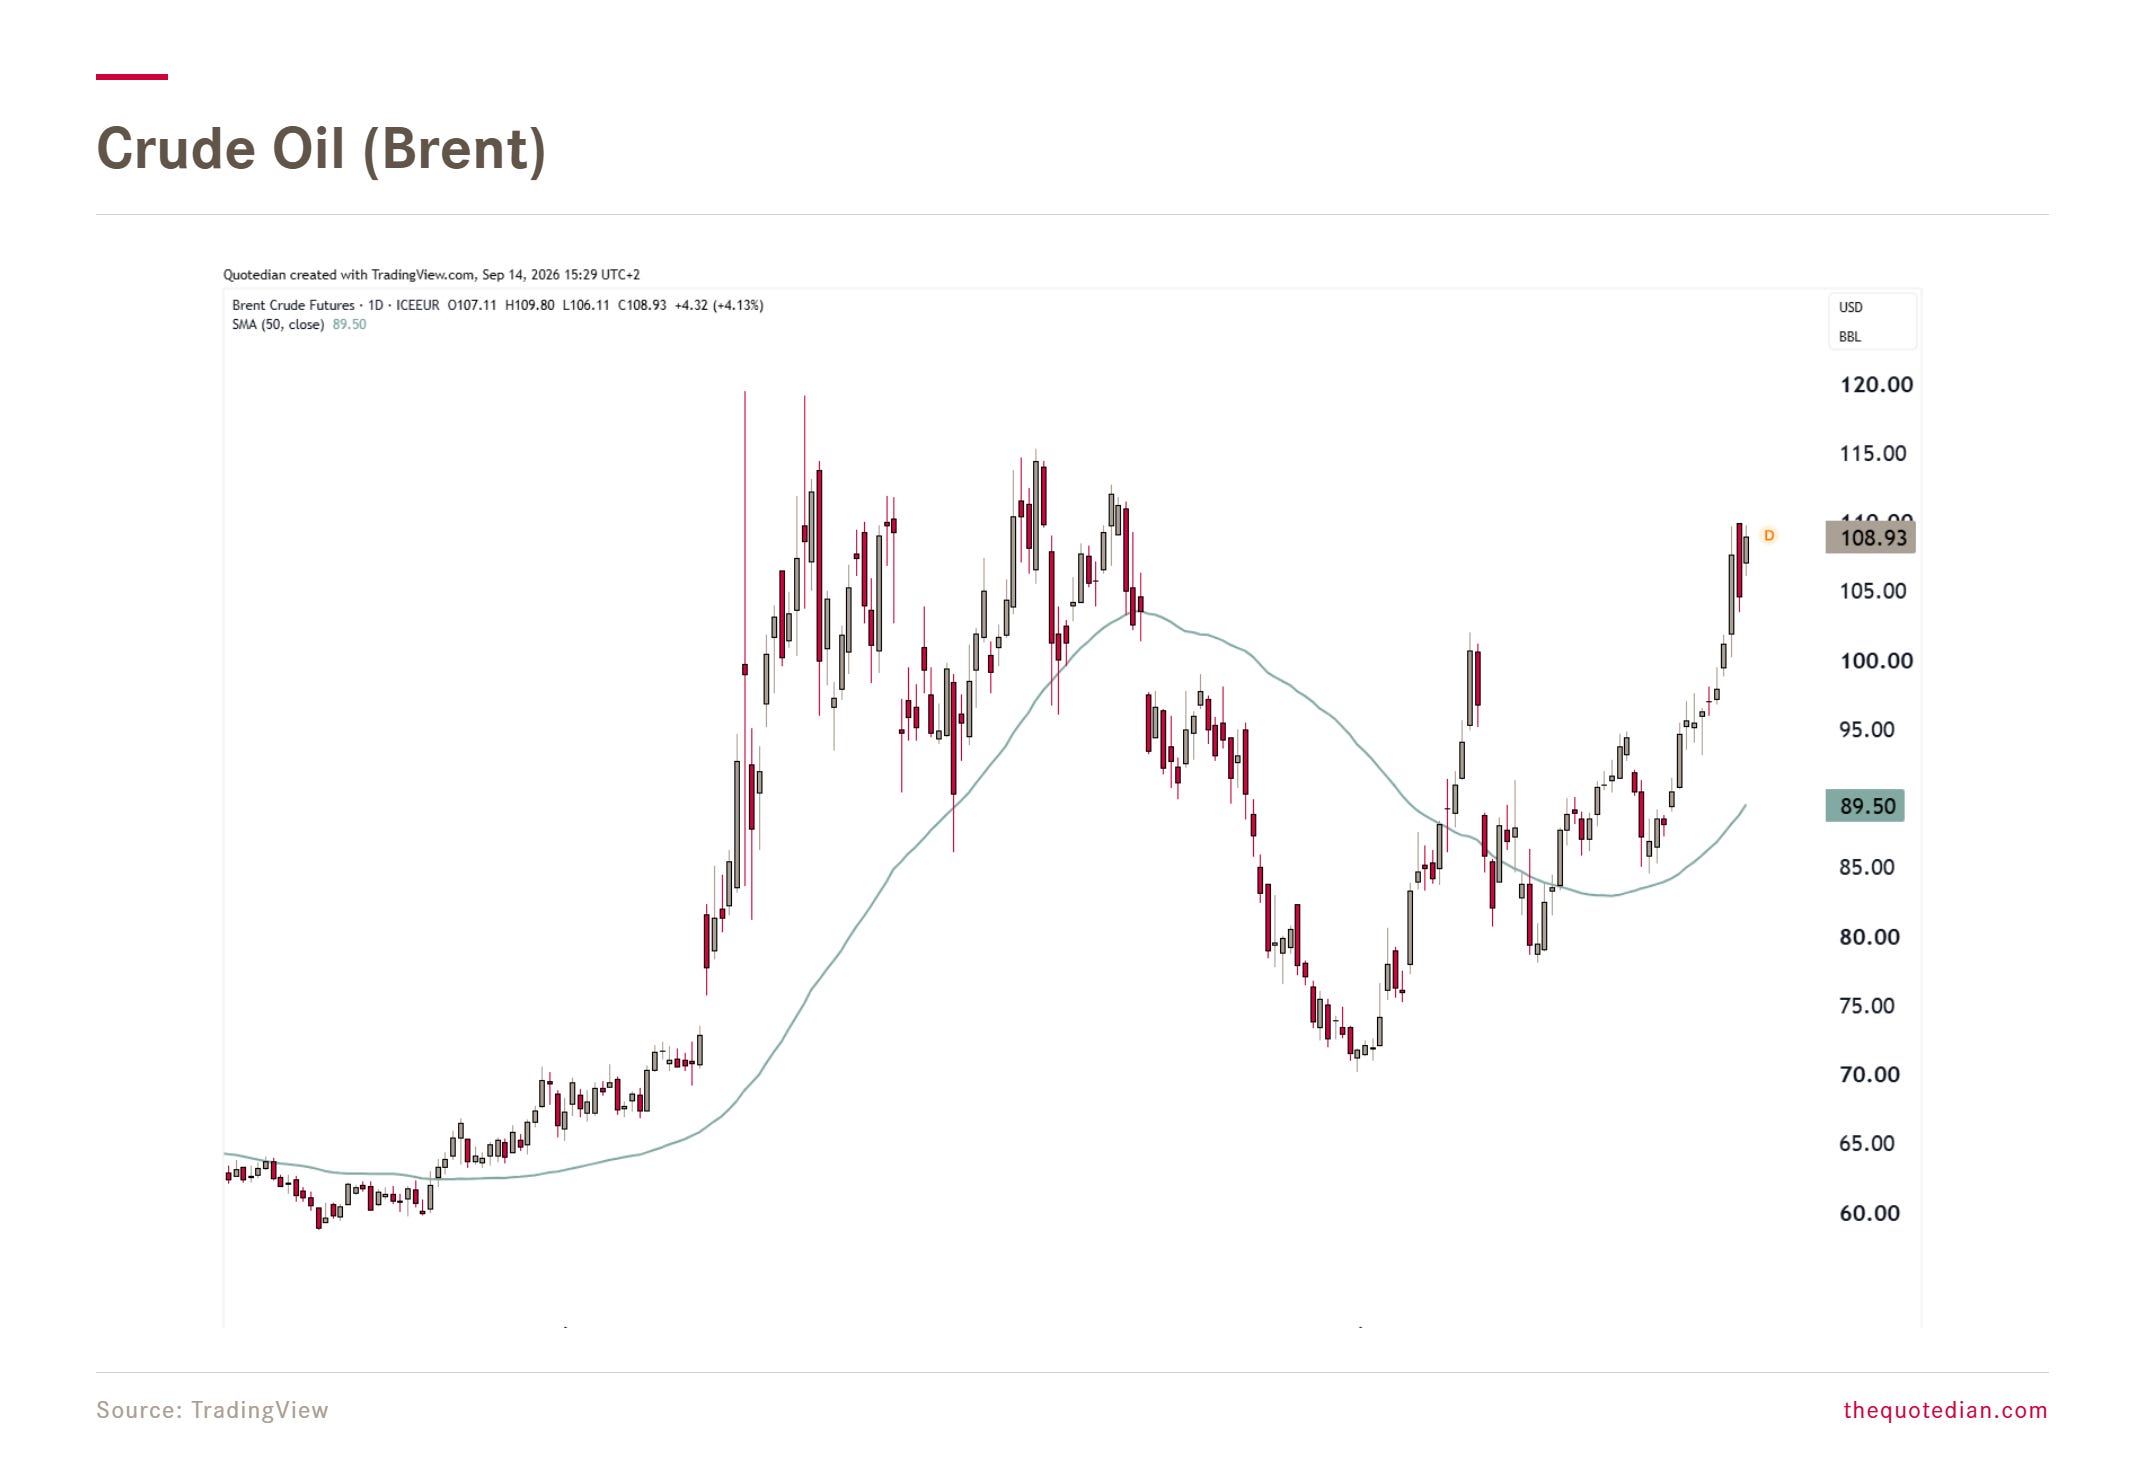
Agent Orange (aka Tariff Man, aka DJT, aka The Disruptor-in-Chief, aka … ah, never mind) got himself, and everybody, into quite the mess with that Iran-thingy. Here’s the price of oil creeping towards its cycle highs:
But, of course, it is not only oil that suffers (or profits) from the conflict in the Strait of Hormuz:
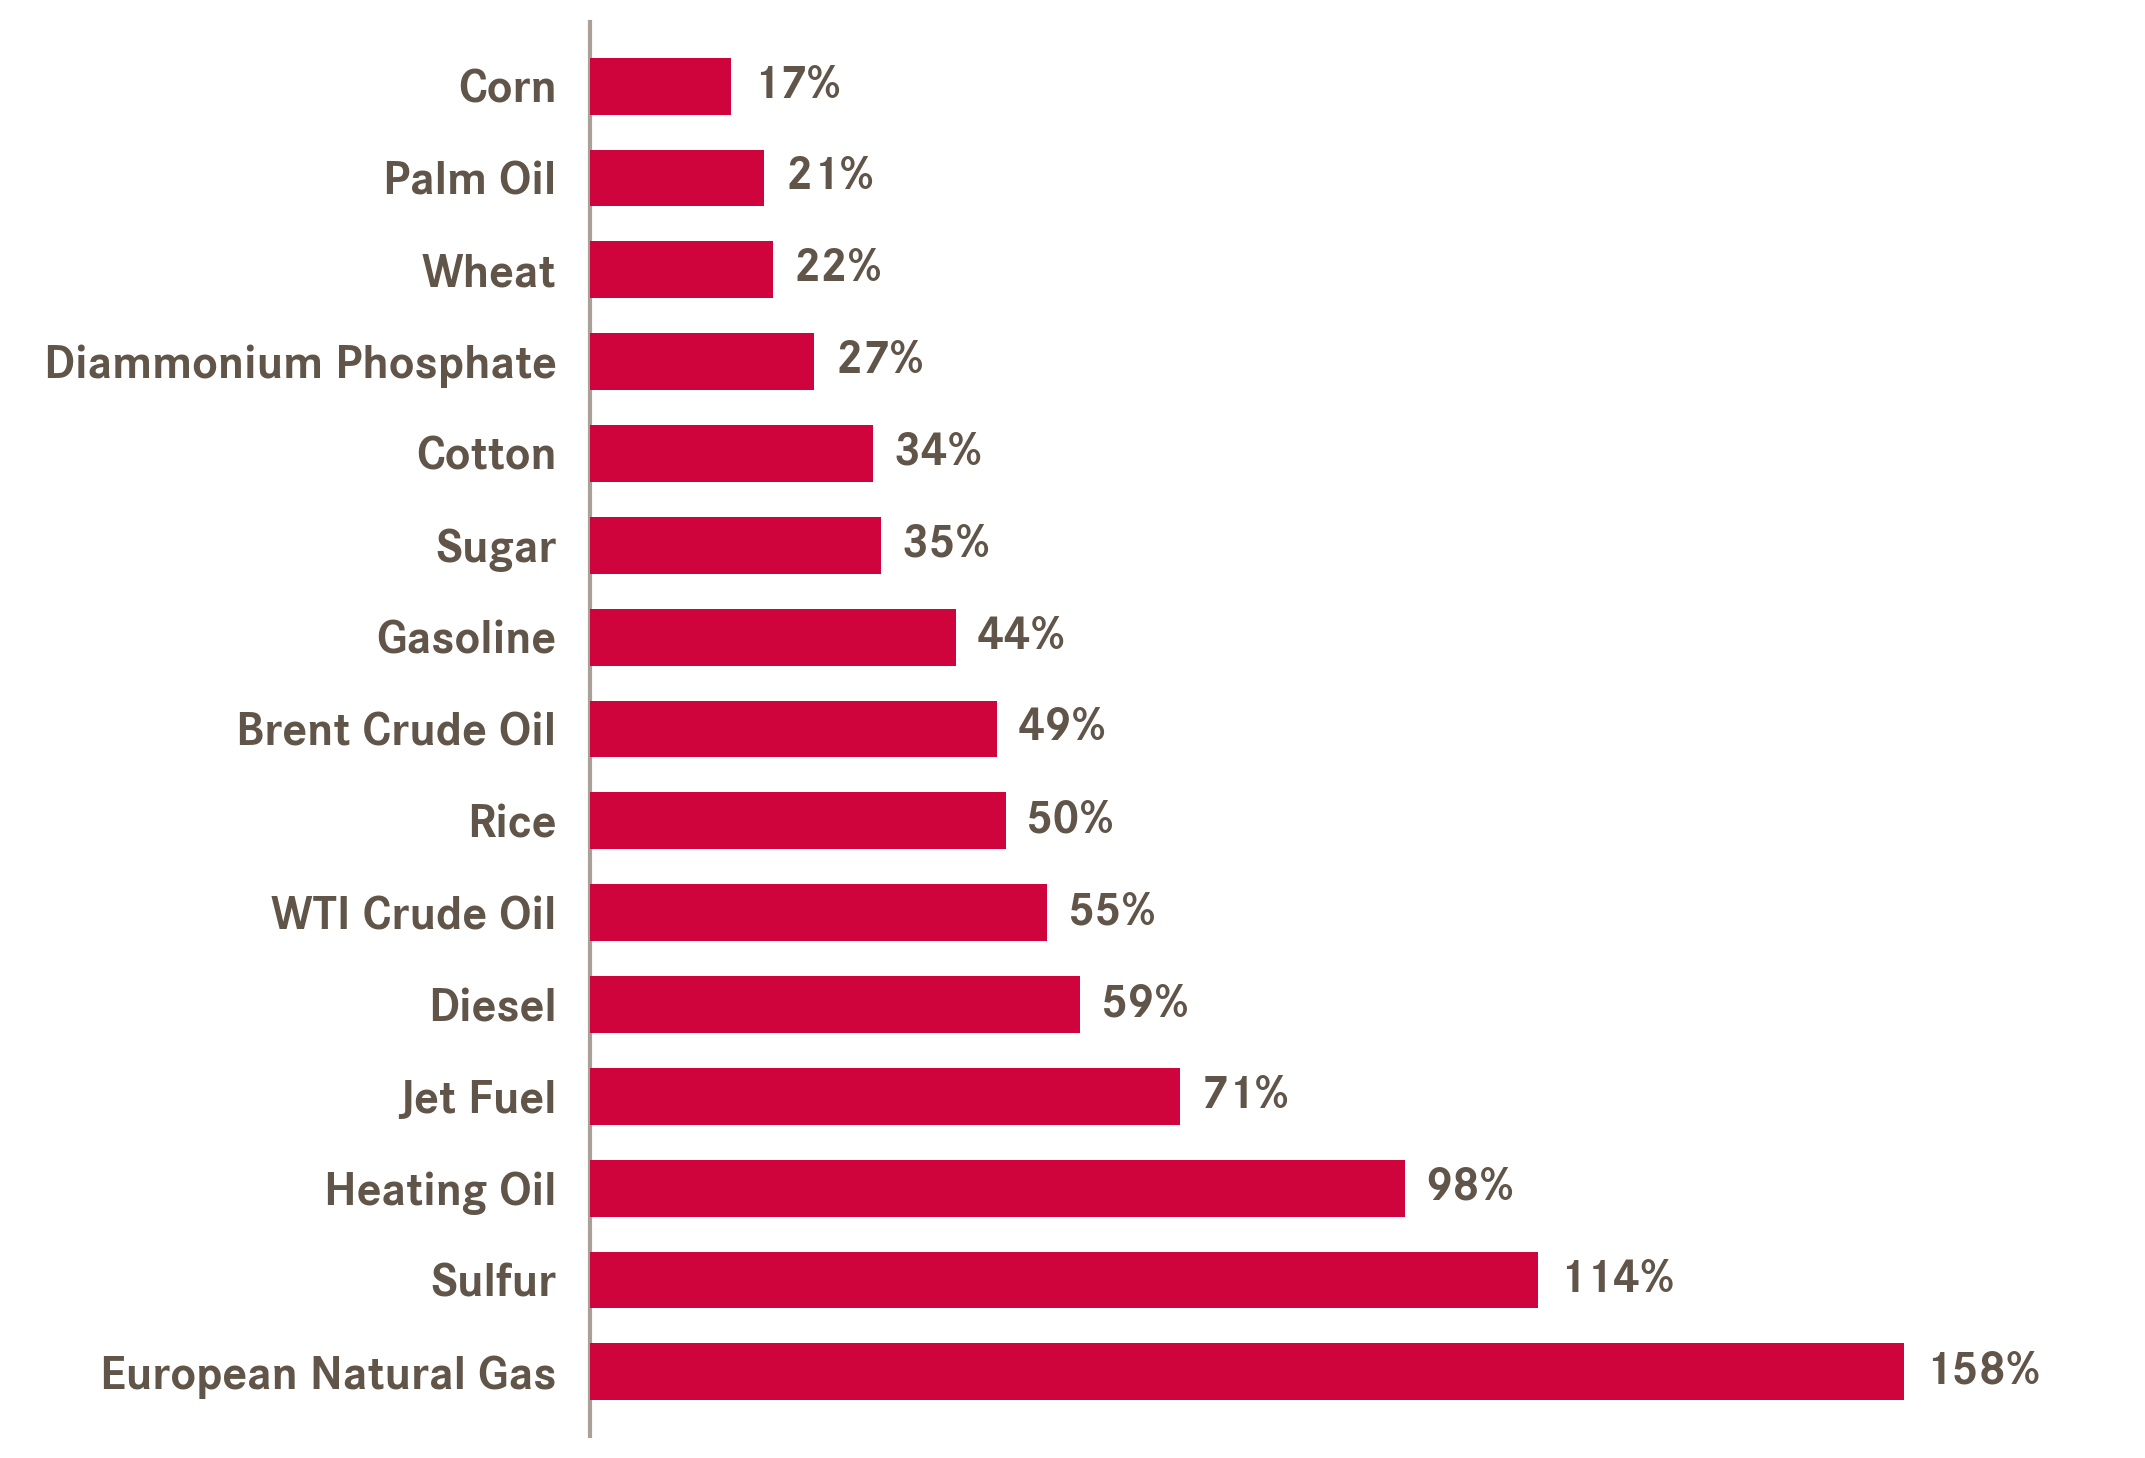
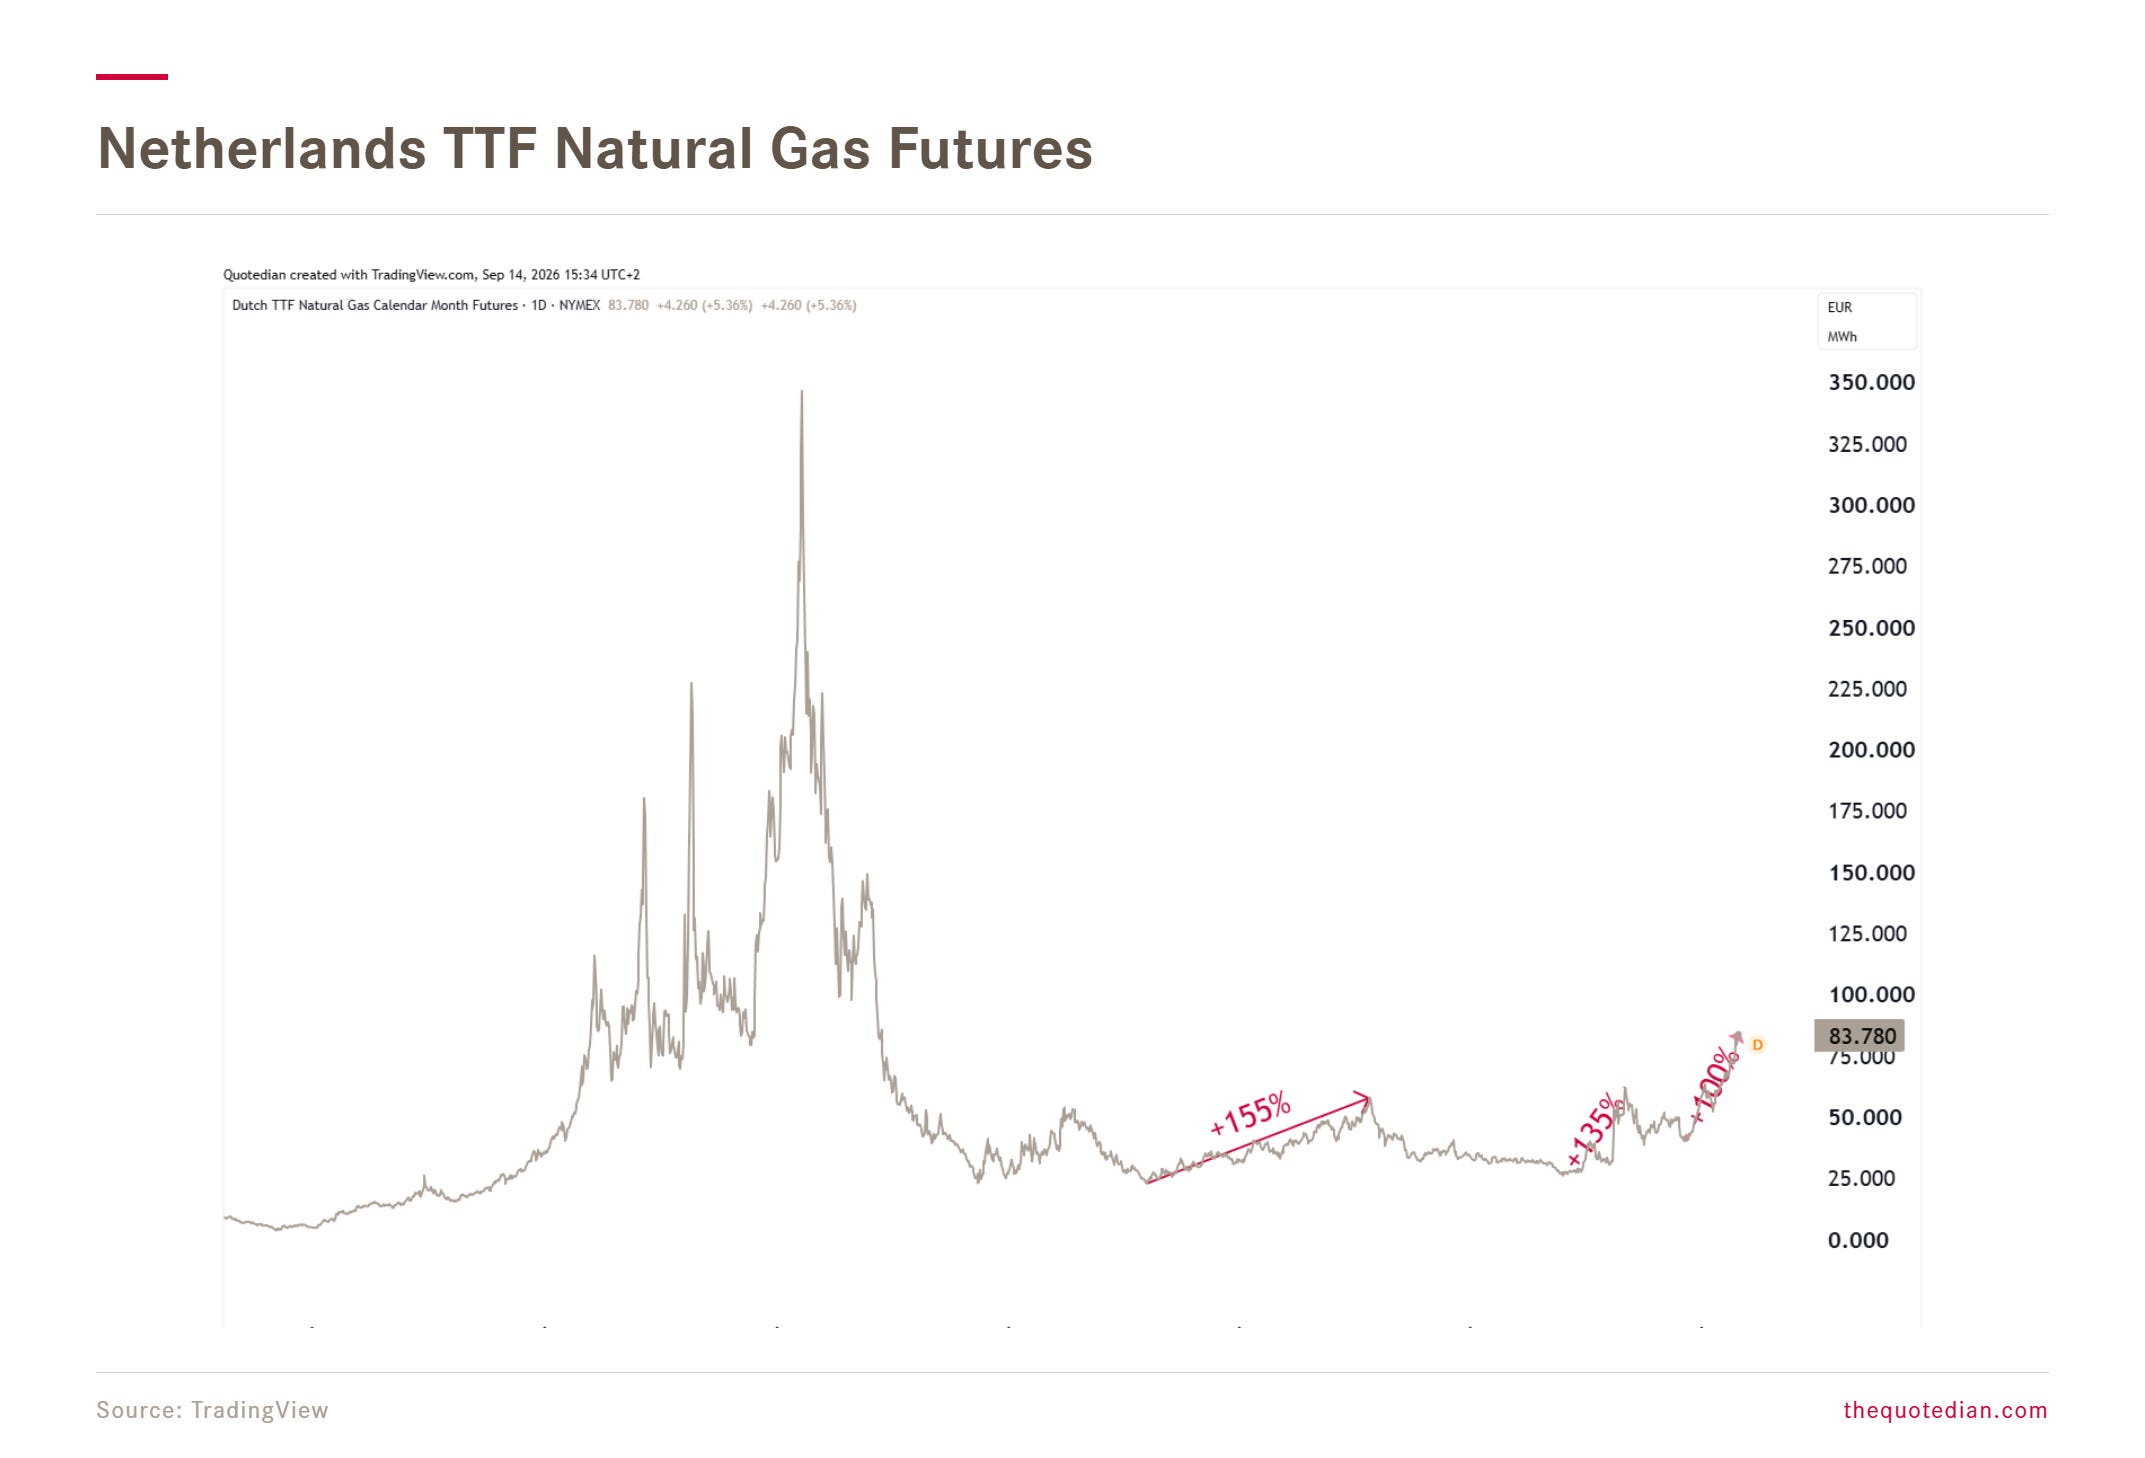
Let’s look at that last item for a moment … TTF, or European natural gas:
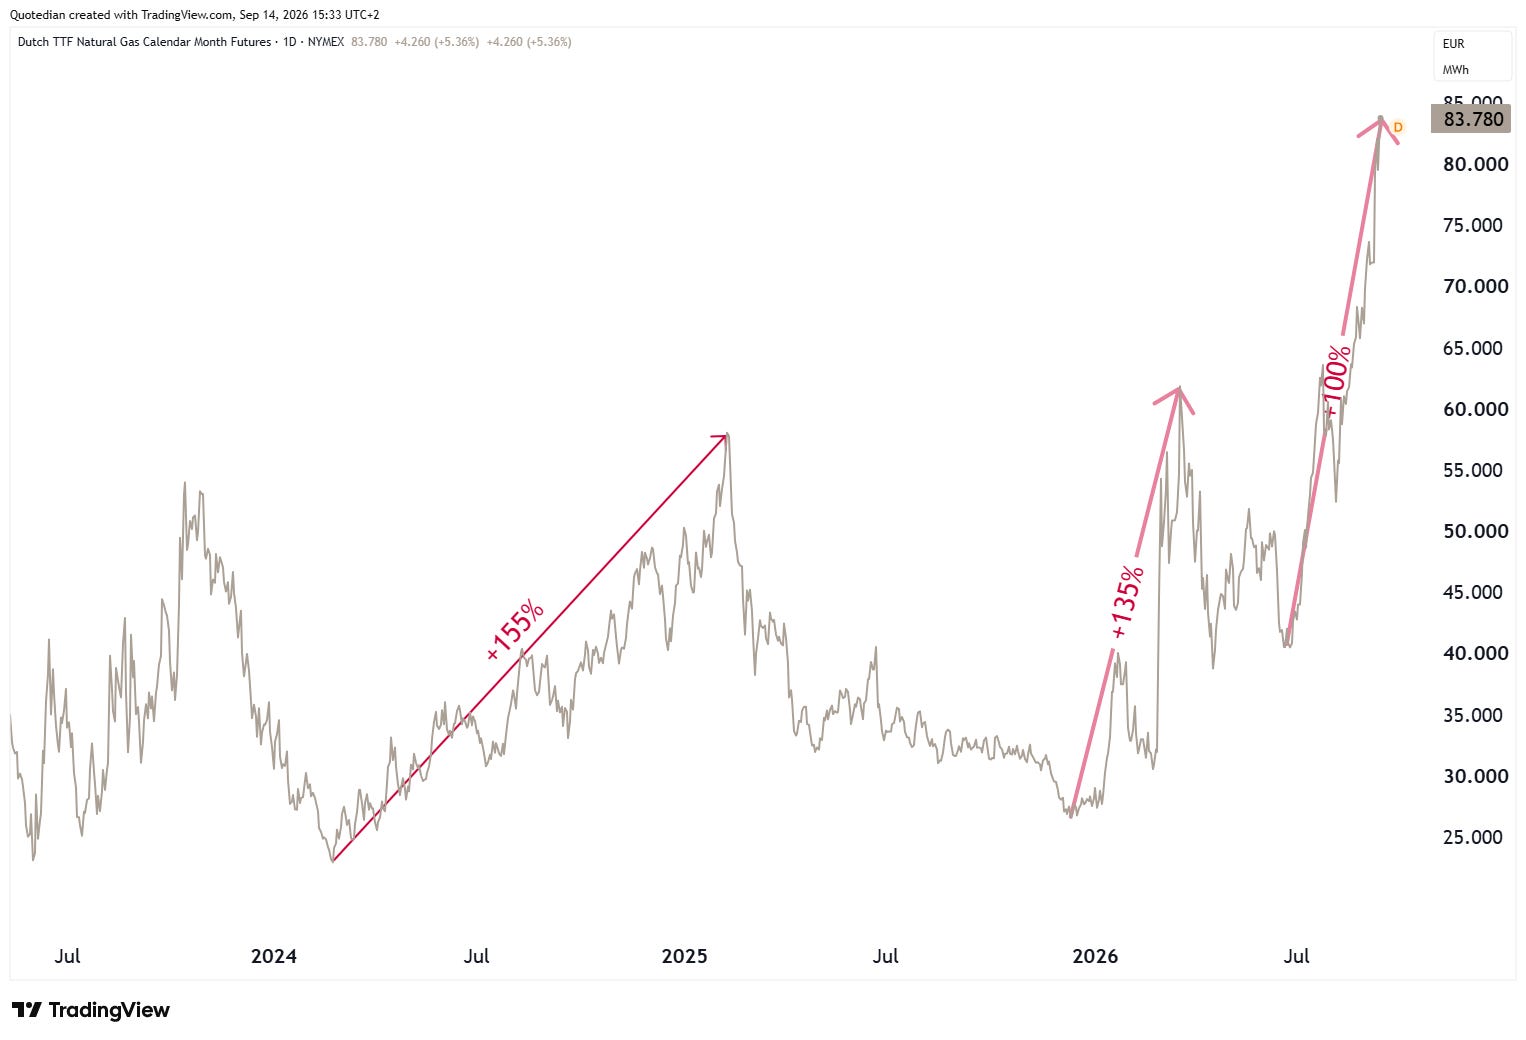
Ouch, that hurt’s!
Though we could argue that we are well below the panic levels post the Russia invasion of Ukraine:
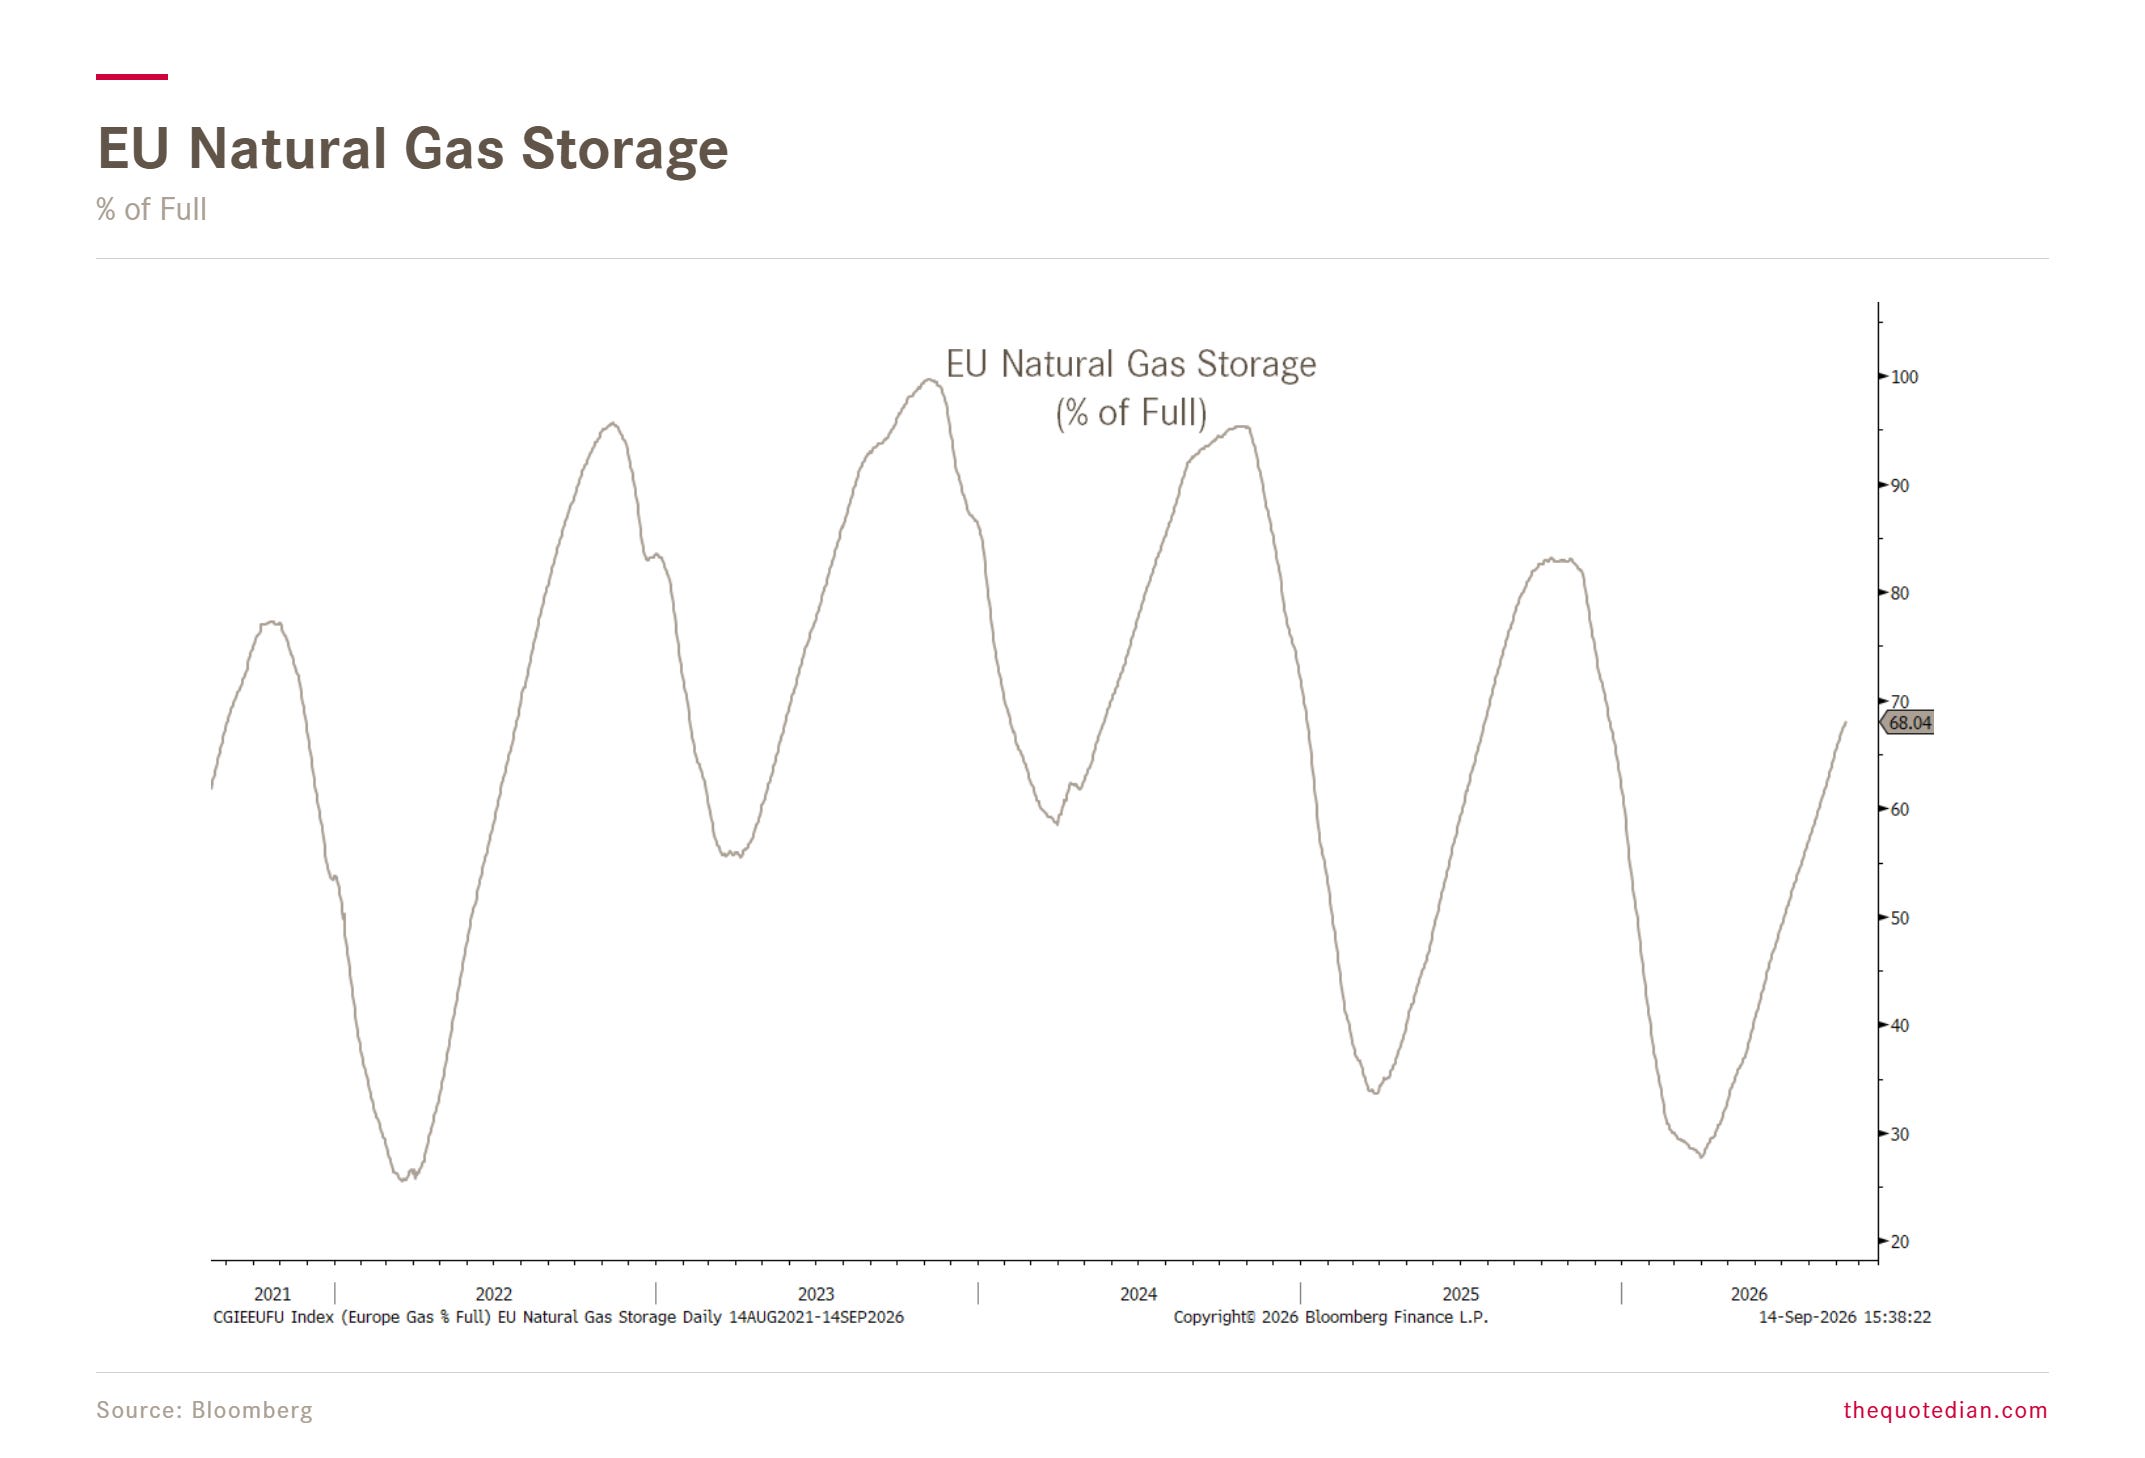
However, we have to be aware that EU gas storage is at its lowest of the past years running into winter:
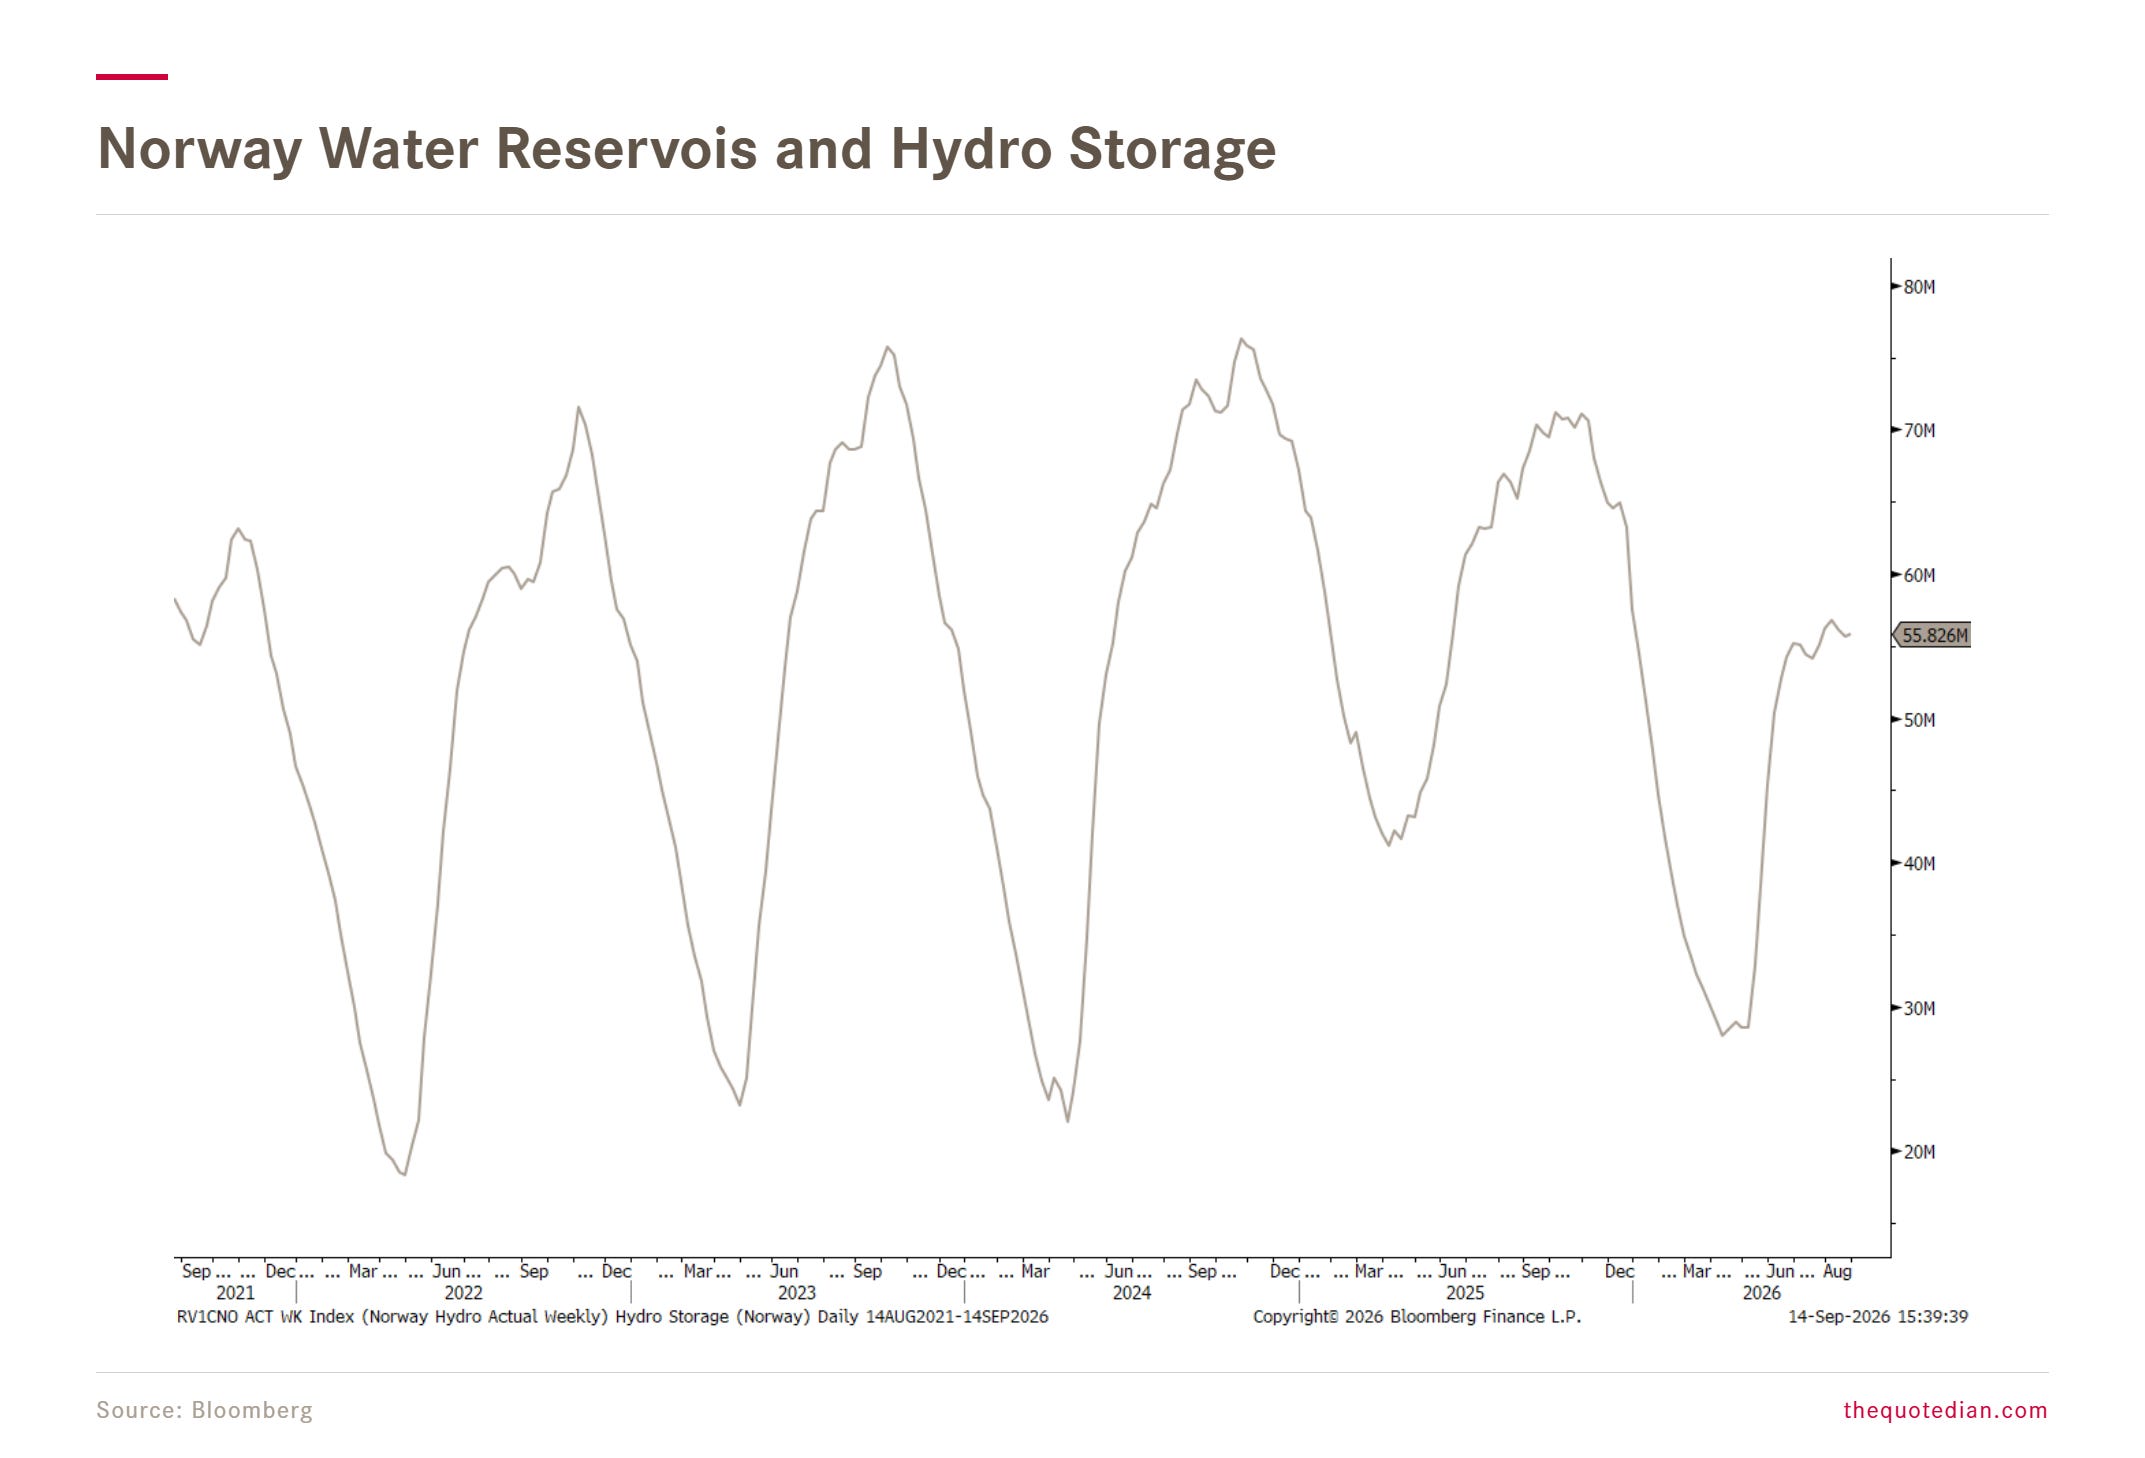
And, as a proxy for the drought we have lived through in Europe this summer, we also note that water reserves for electricity production via hydro in Norway had its lowest cycle peak of the past years:

So, where does all of this leave us?
At the risk of repeating ourselves: 5% is not the problem. Getting to 5% is.
The Old Normal may ultimately be perfectly survivable, but markets, companies and governments have spent the better part of two decades adapting to anything but normal. The adjustment back comes with casualties — and deteriorating equity breadth, battered long-duration assets and suddenly-wobbly French bonds are warning shots.
For now, that argues for some caution on equities and continued avoidance of duration. But it does not argue for hiding under the bed. Energy and commodities are telling a very different story and remain our preferred hedge against a world of higher nominal growth, fiscal excess and geopolitical friction.
Higher before lower for yields. Lower before higher for equities. And higher for real assets for longer.
Welcome to the Old Normal and May the Trend be with You!
André

Everything in this document is for educational purposes only (FEPO)
Nothing in this document should be considered investment advice
Investing real money can be costly; don’t do stupid shit
Leave politics at the door—markets don’t care.
Past performance is hopefully no indication of future performance
The views expressed in this document may differ from the views published by NPB Neue Privat Bank AG