

Bear Sightings
Vol VIII, Issue 34 | Powered by NPB Neue Privat Bank AG

Enjoying The Quotedian but not yet signed up for The QuiCQ? What are you waiting for?!!

What has Toblerone chocolate to do with investments in general or Bear Sightings in particular?
Everything!
Once you see it, you cannot unsee it ever again:

Hence, this week’s Quotedian will look at some charts across equity markets and other asset classes for evidence of maybe a bear hiding behind the next tree,

or maybe it is already in plain sight:

Off we ROAR!

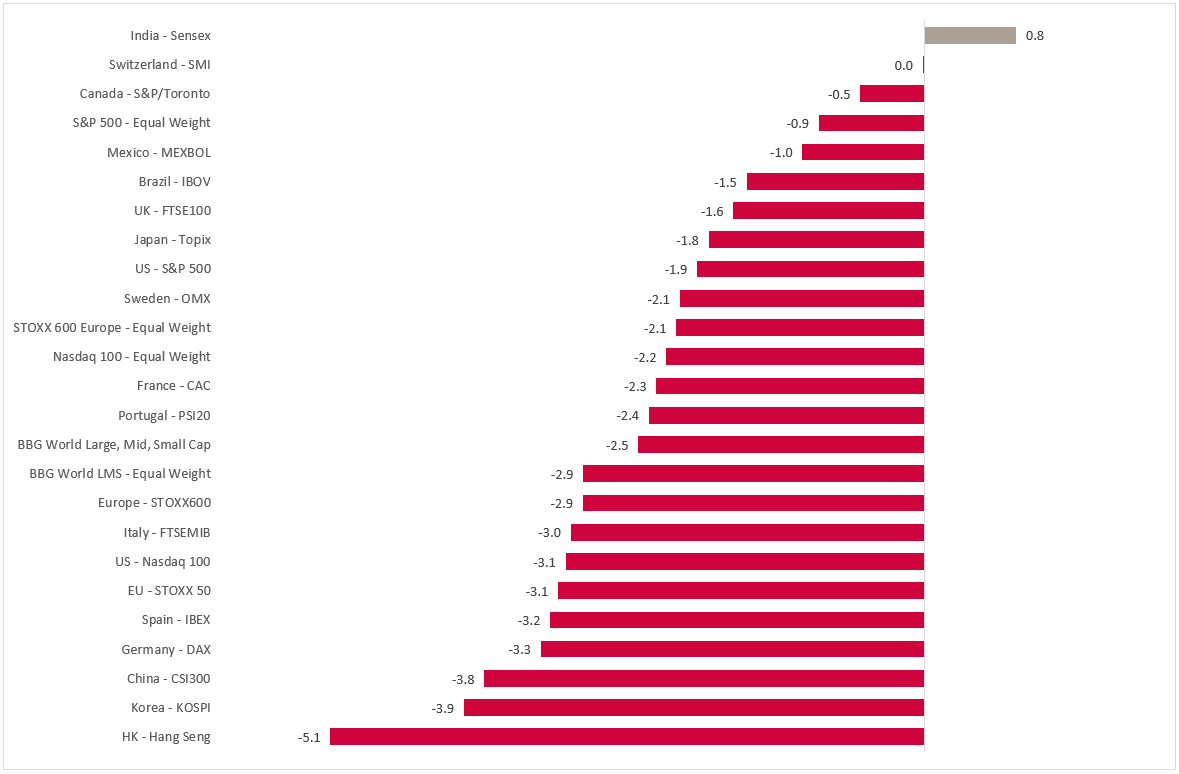
Last week was a rough one for stock markets:
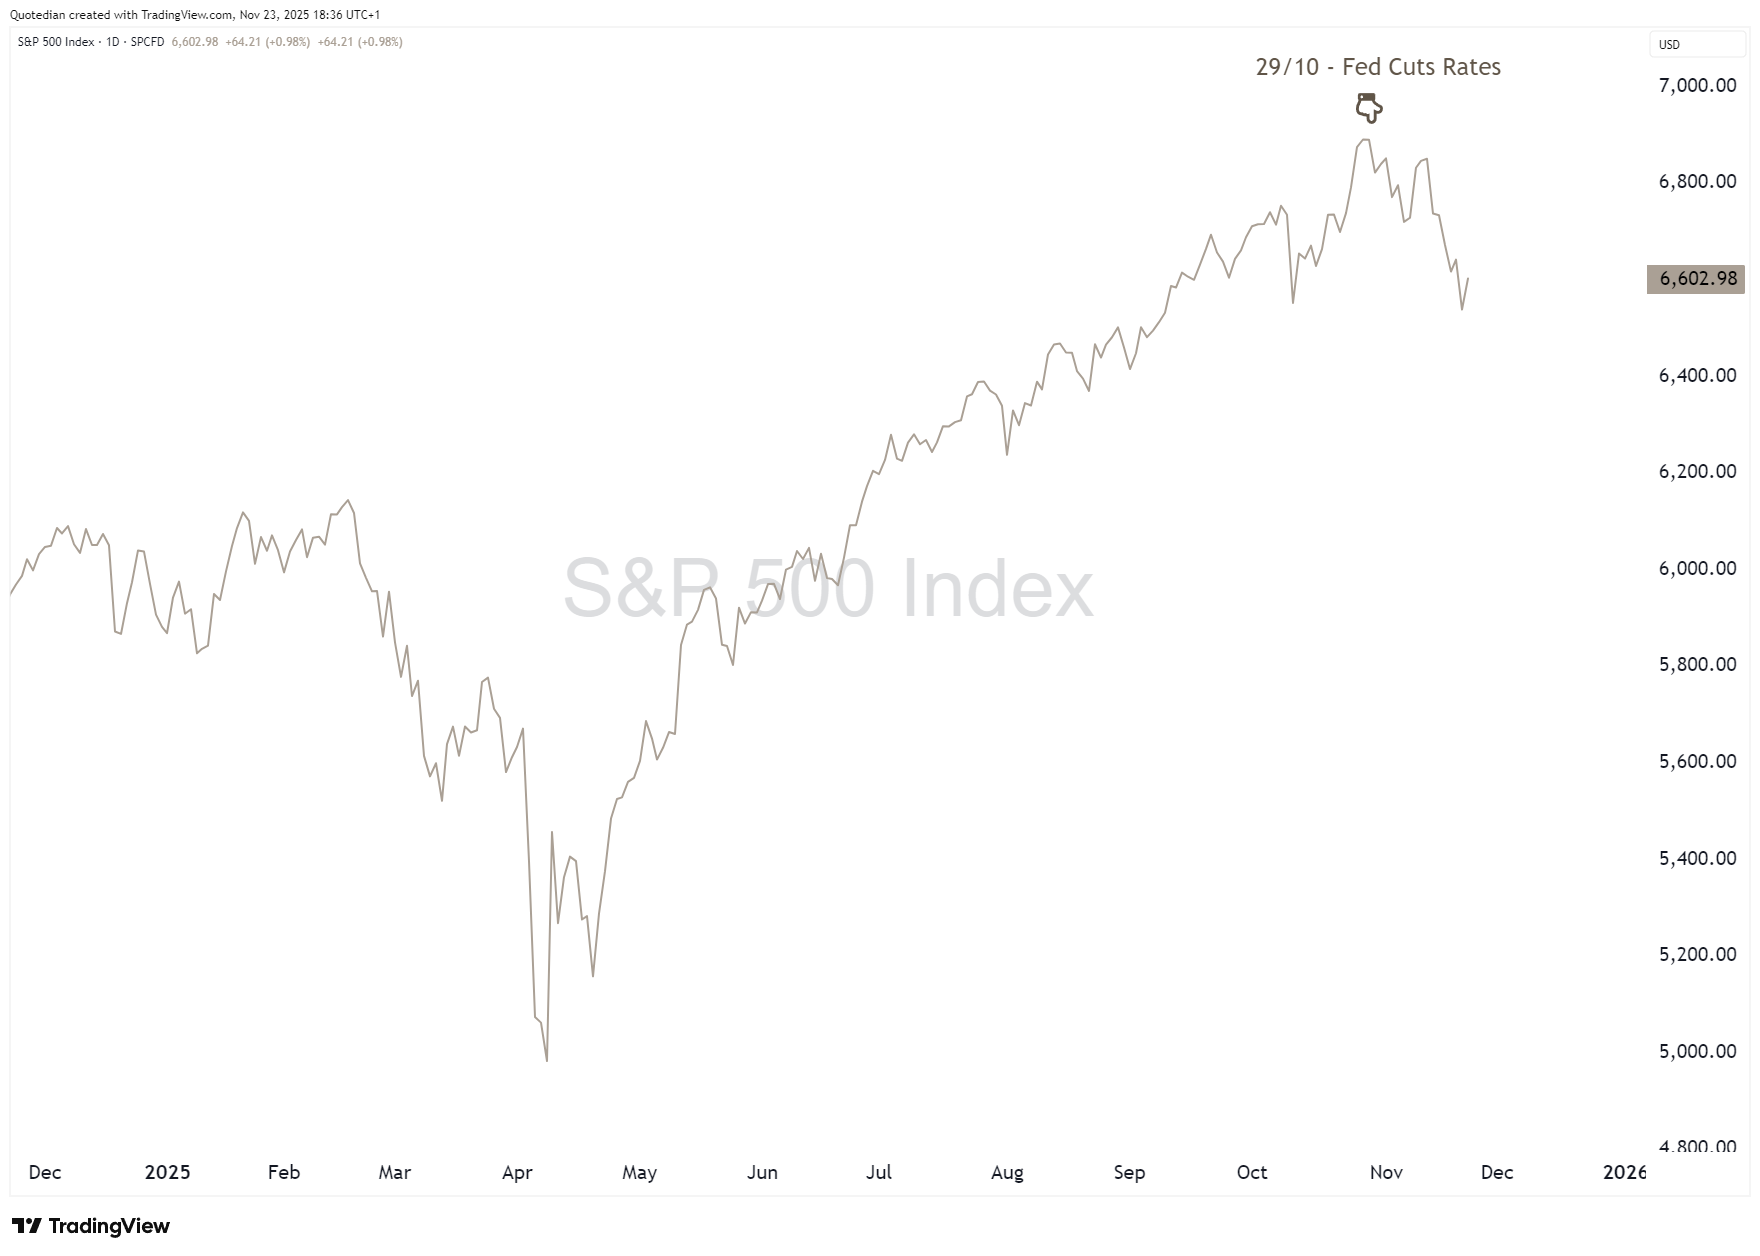
However, equity returns have not only been dismal last week, but really ever since stocks hit the November wall. Or, more precisely, exactly since the Fed cut rates on October 29th:
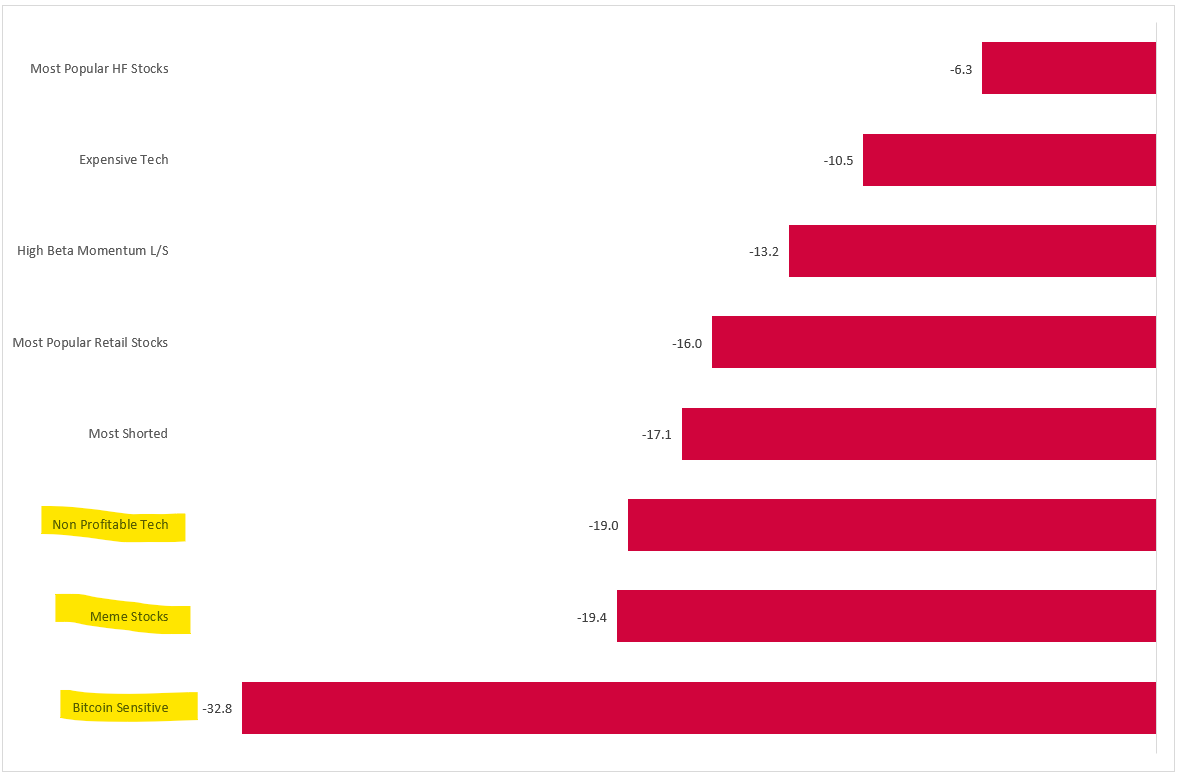
Especially the frothier parts of the markets have seen important reversal, since that late October top. Here are the month-to-date returns for some of those special ‘factors’:
So, what has changed?
Well, first, that October FOMC cut was a hawkish cut, i.e. accompanied by not so market-friendly comments by Fed Boss Powell. More specifically, he mentioned that a December cut was “not a foregone conclusion”. This alone was enough to put equity investors’ into our sour mood.

Secondly, investors have been starting to deliberate if all that AI-spending of the hyperscalers is actually really a good thing. I had posted about that capex-trouble a few weeks ago on LinkedIn:

So, is it all bad news and are the bears about to mess-up our surprisingly good year?
Perhaps.
But not necessarily.
All this talk about whether the AI bubble is bursting is actually very constructive, as it means we are not in a bubble yet. In analogy to the Dotcom bubble 30-years ago, it feels more like 1996, than 1999. In 1999 nobody was asking whether it is a bubble - trust me, I was there.
But what has changed is that, while the AI bubble isn’t bursting, it is losing some air. That’s actually a positive development for the sustainability of the current bull market, which began on October 12, 2022.
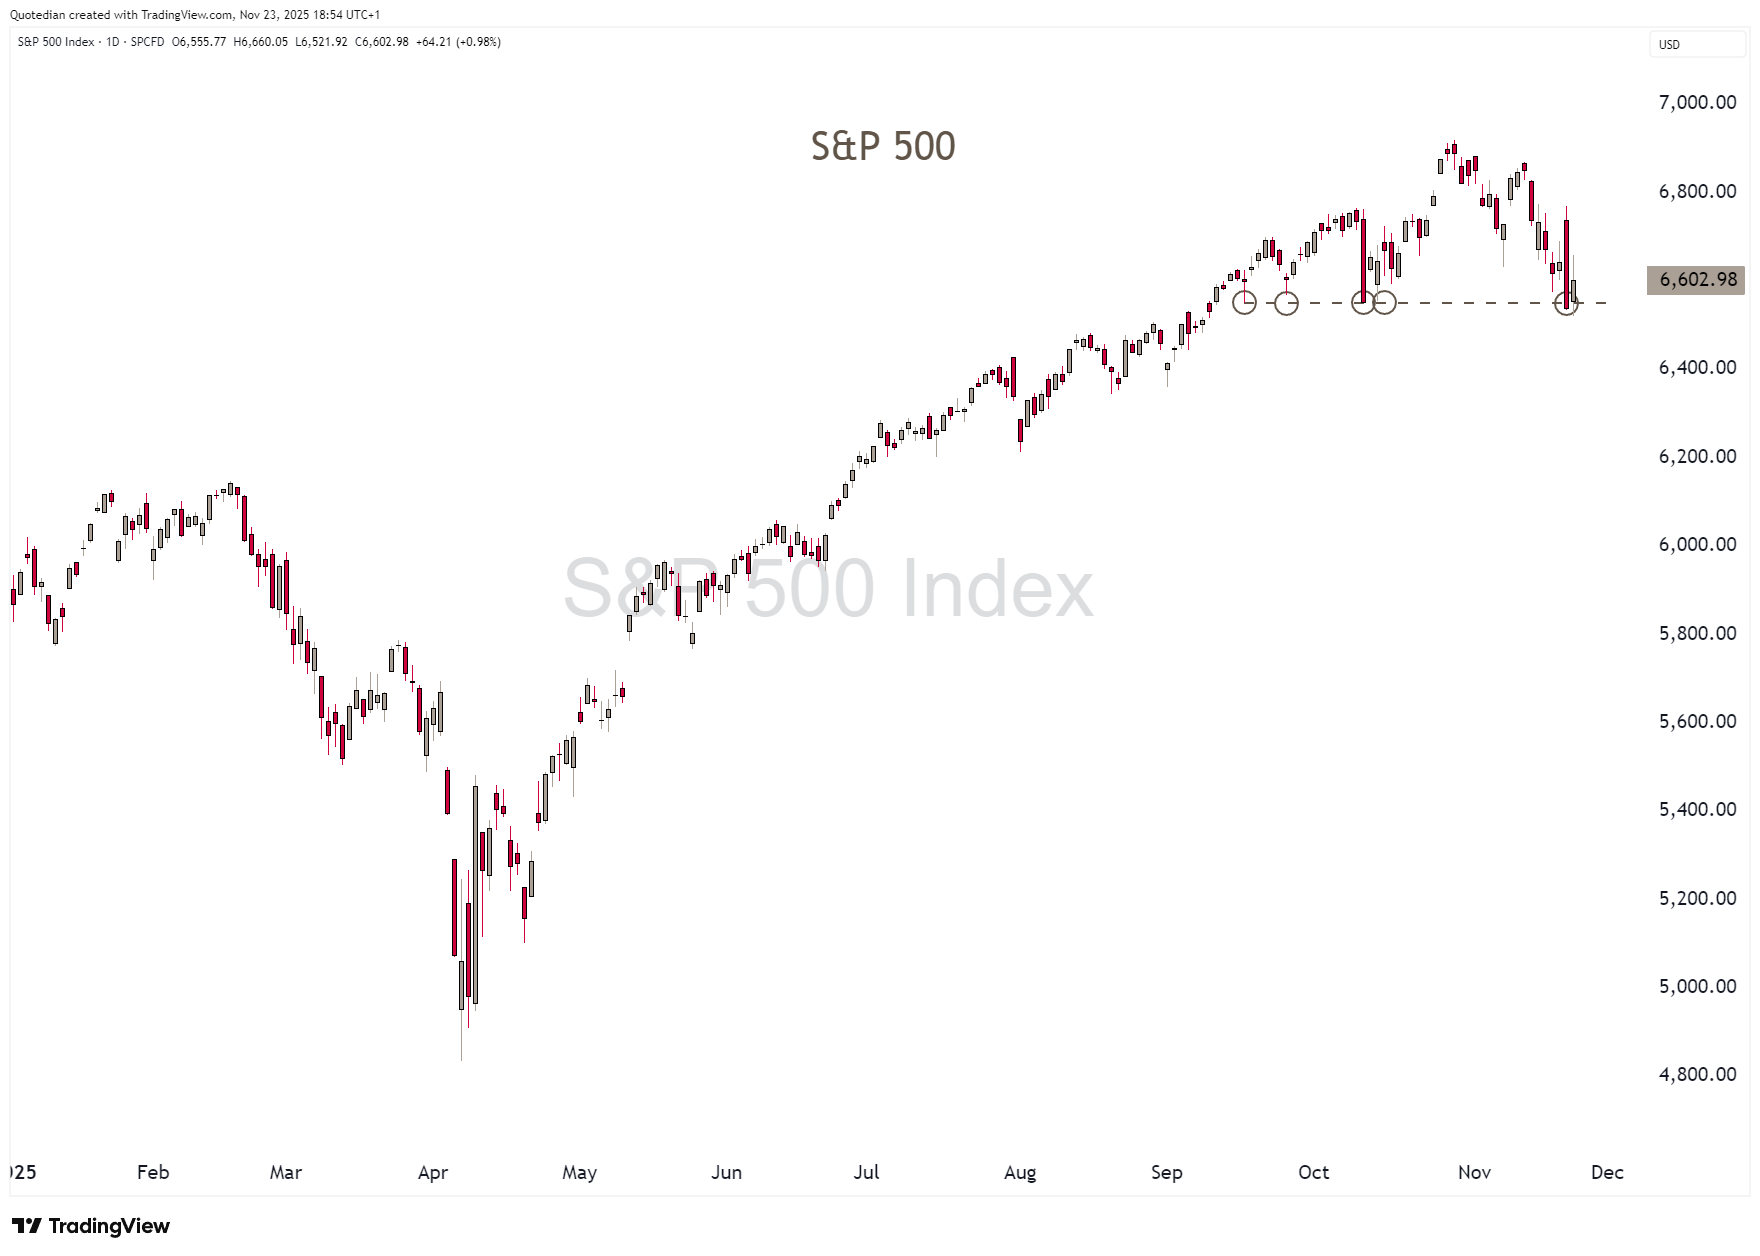
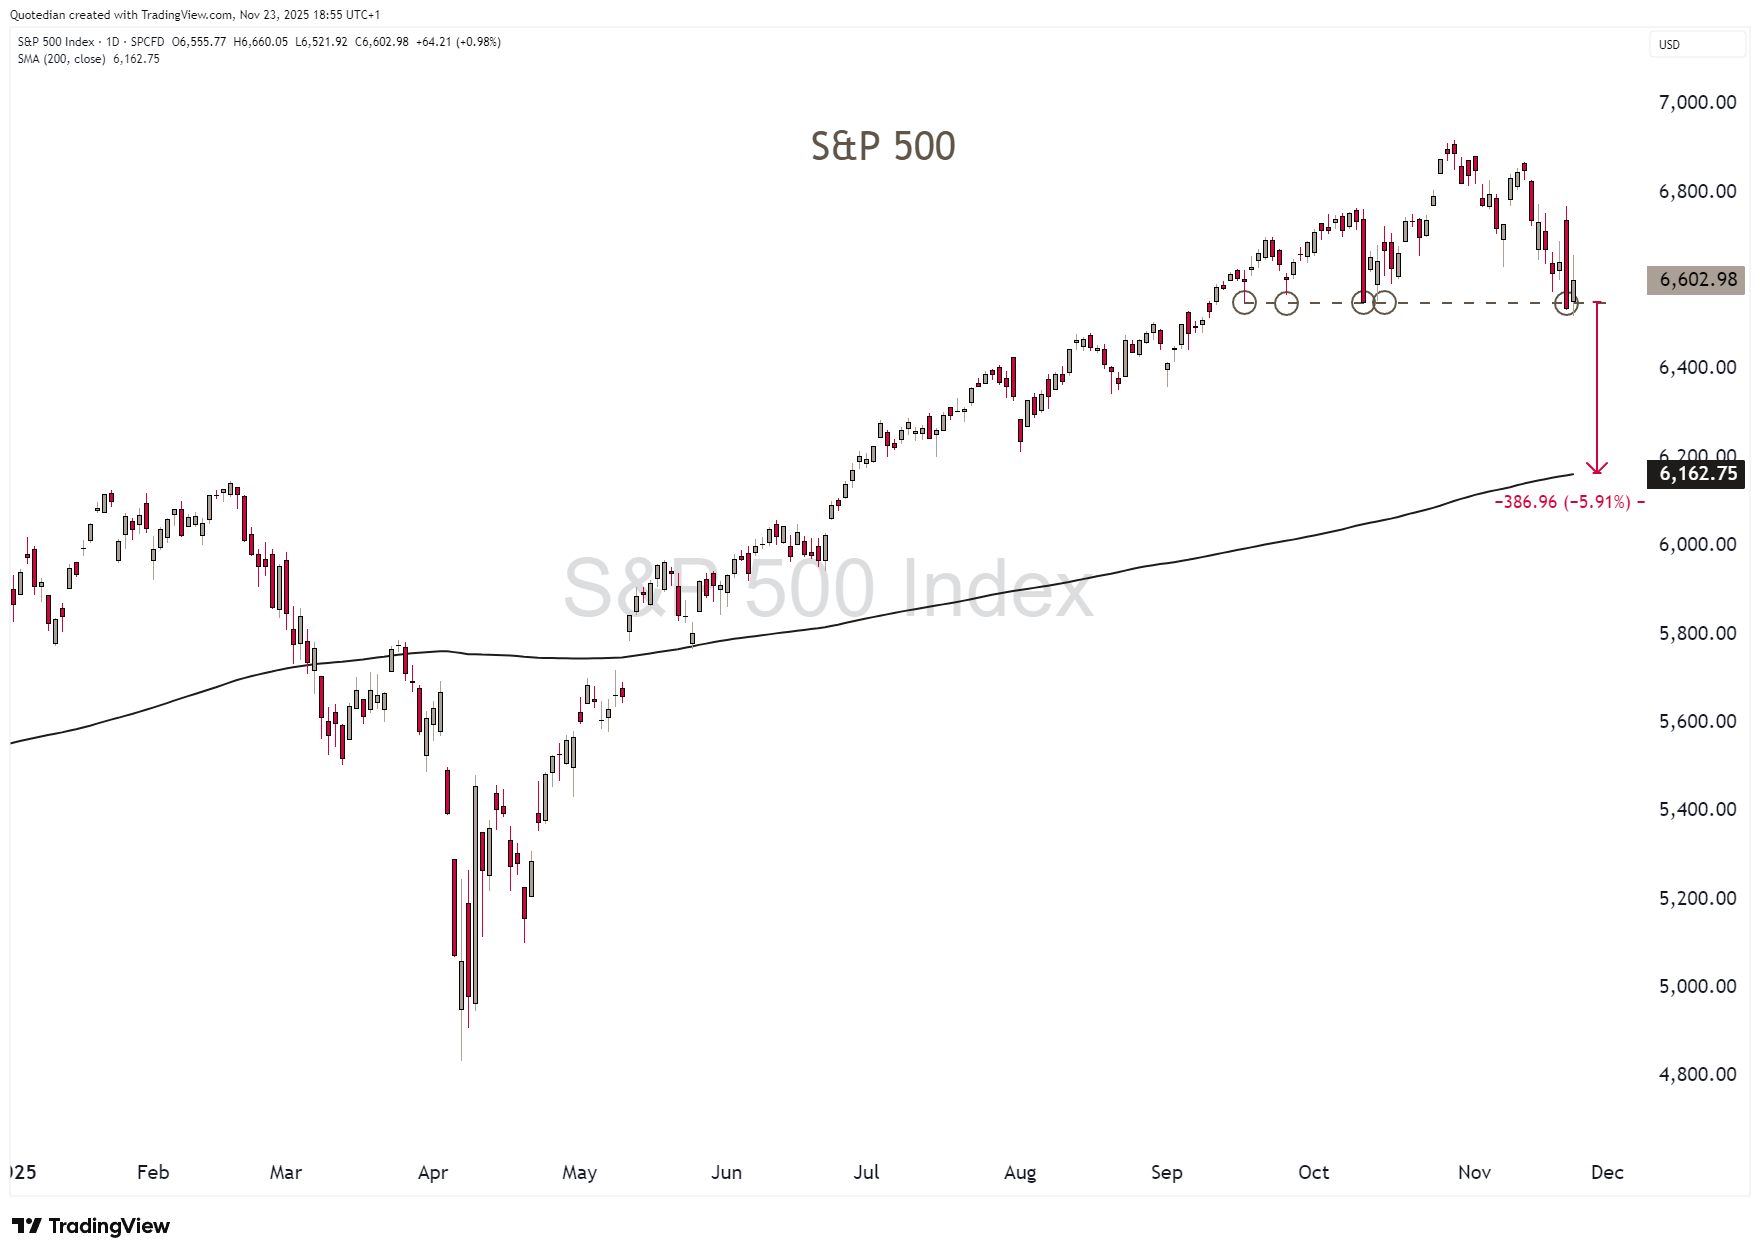
Technically, turning back to the S&P 500, the line in the sand at 6,550 is holding for now:
A break could indeed talk us about 6% lower to the 200-day moving average:
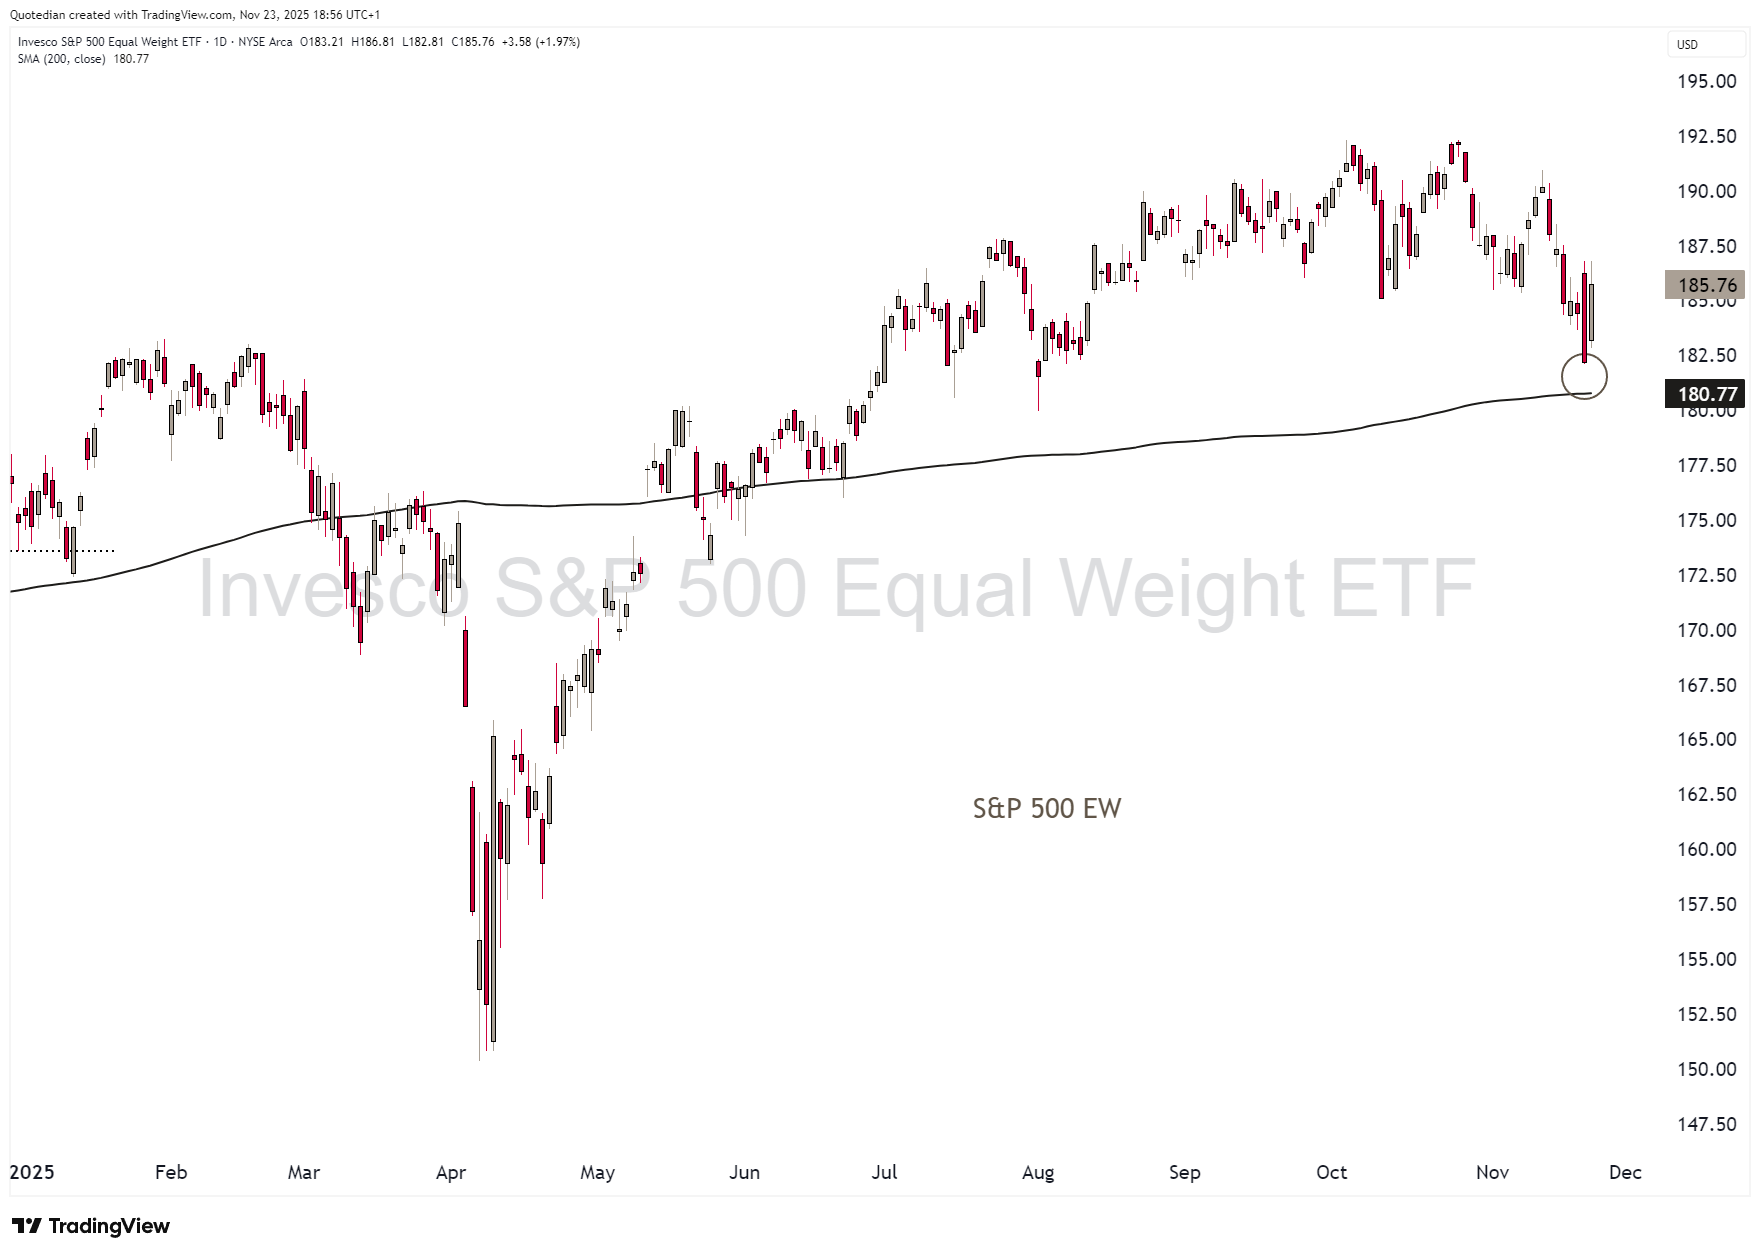
However, here’s the thing. The S&P 500 equal-weight index has already (more or less) achieved that feat last Thursday:
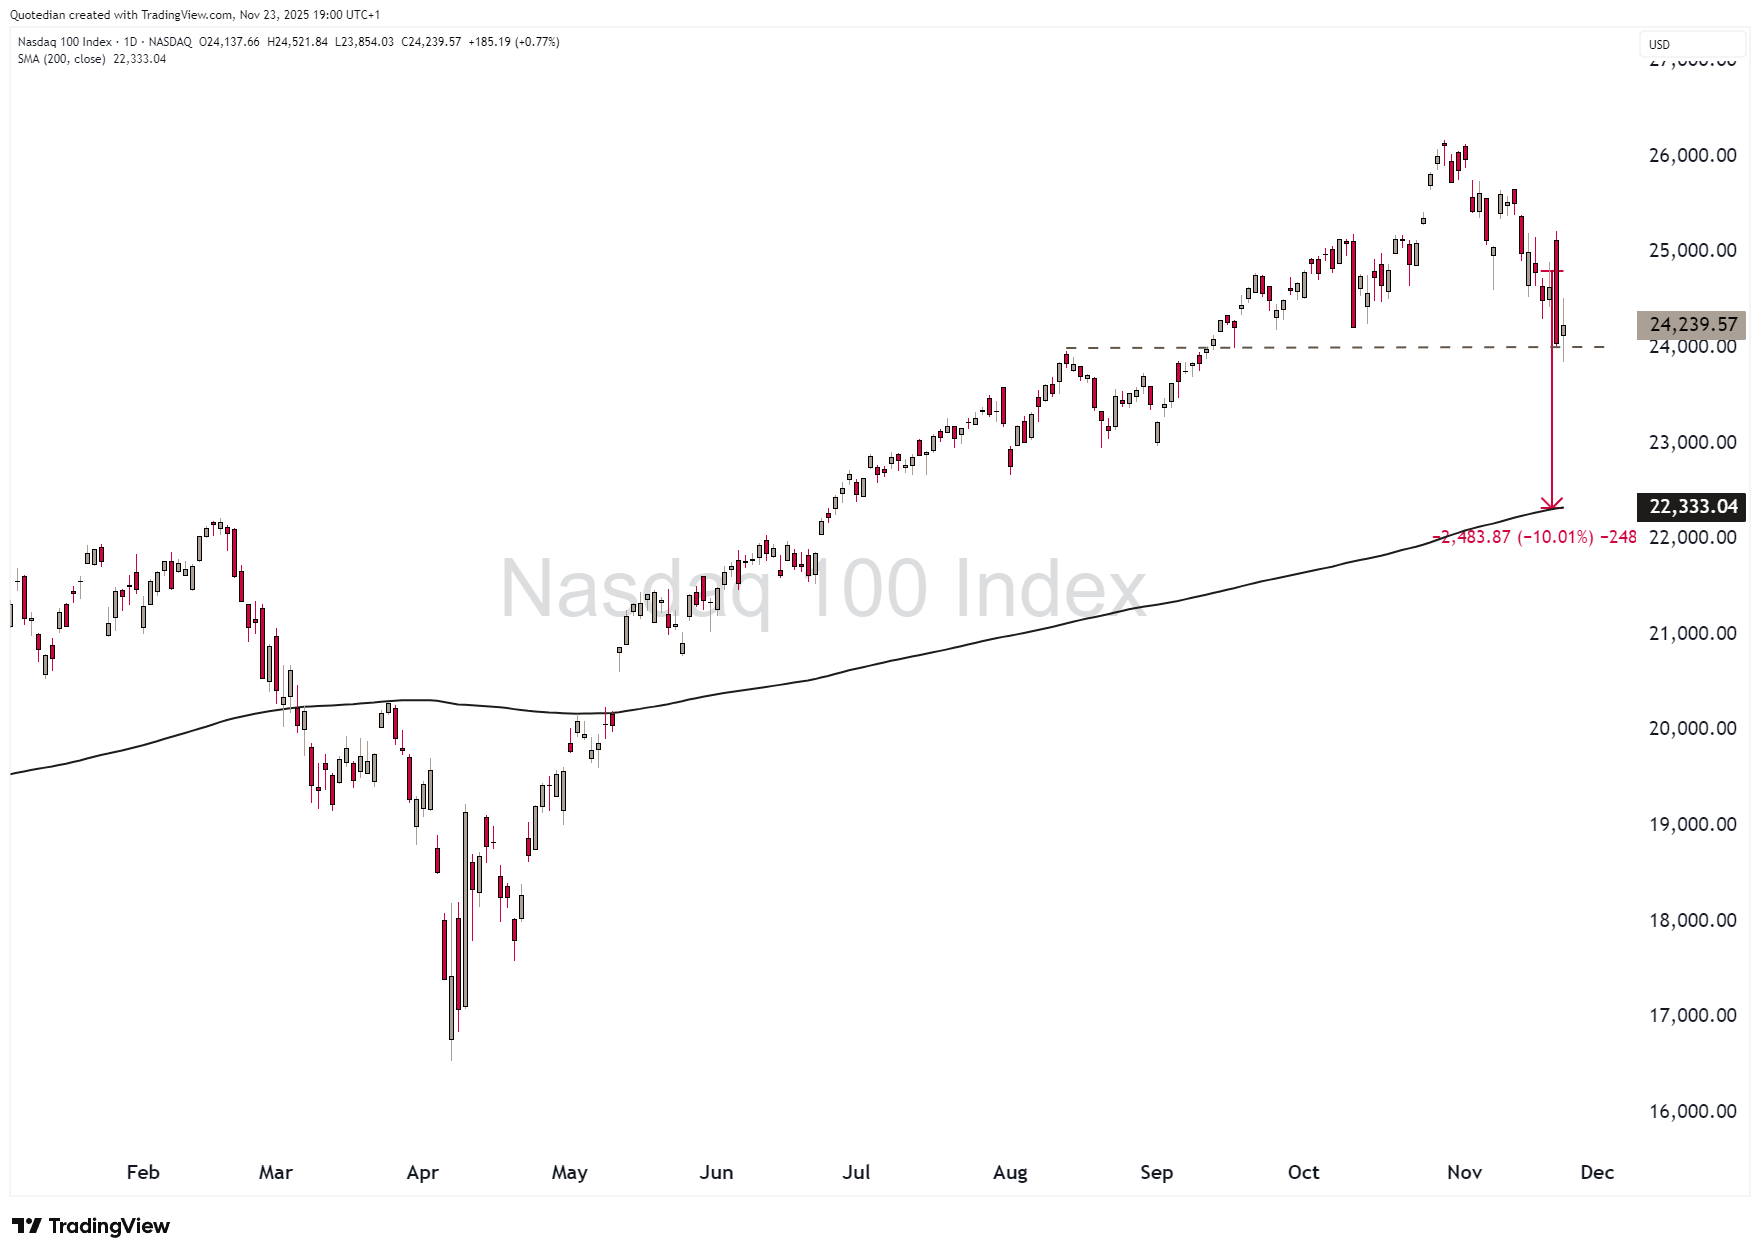
Similarly, the Nasdaq-100, which has been weaker than the S&P 500, is at a “make-or-break” level and a “break” could take the index down another 10%:
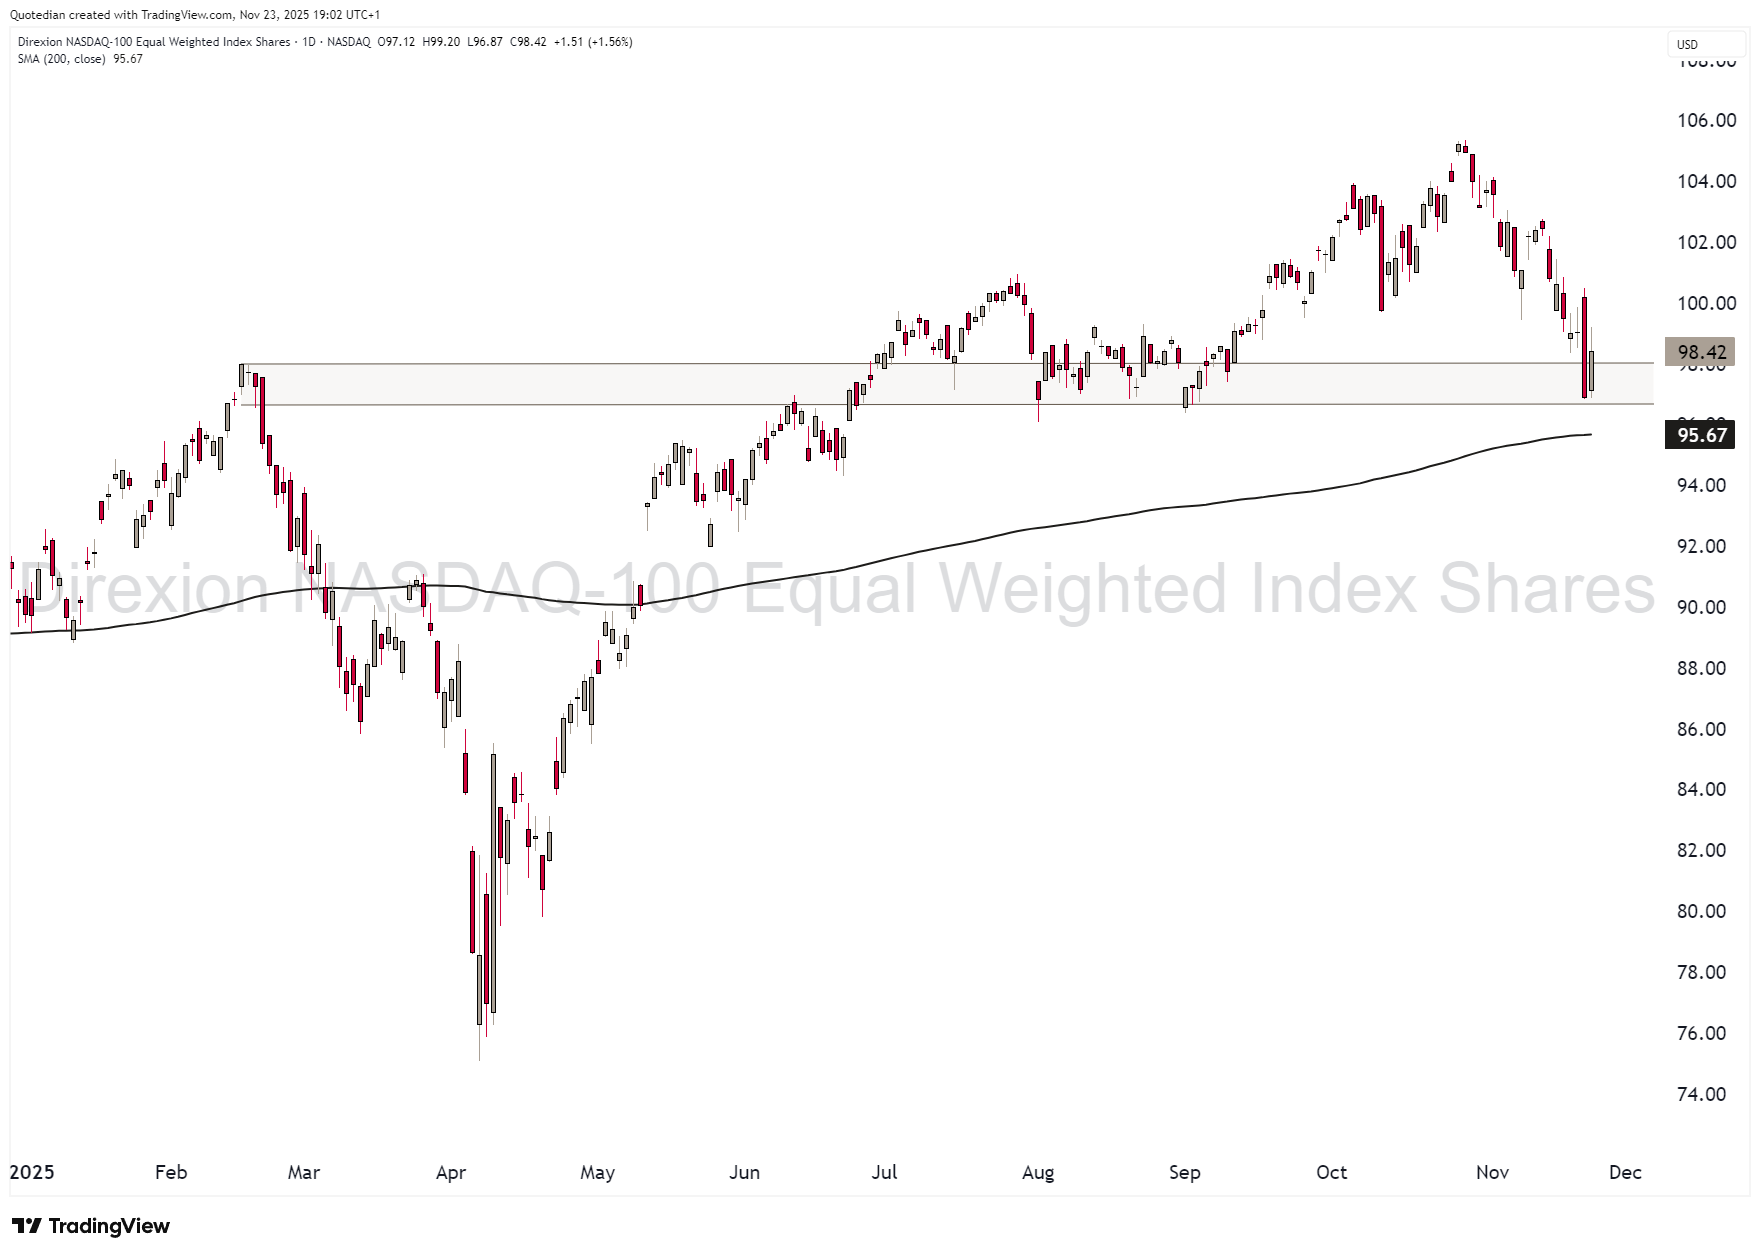
However, here too has the equal-weight version dropped enough already to say a downside target has possibly been reached:
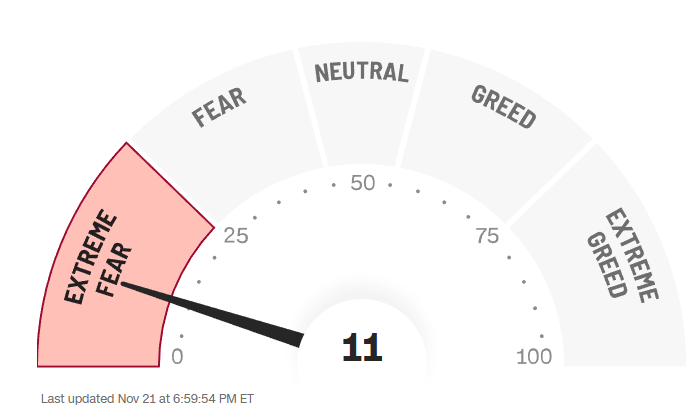
From a sentiment point of view, at least CNN’s Greed and Fear index is at extreme negative levels:
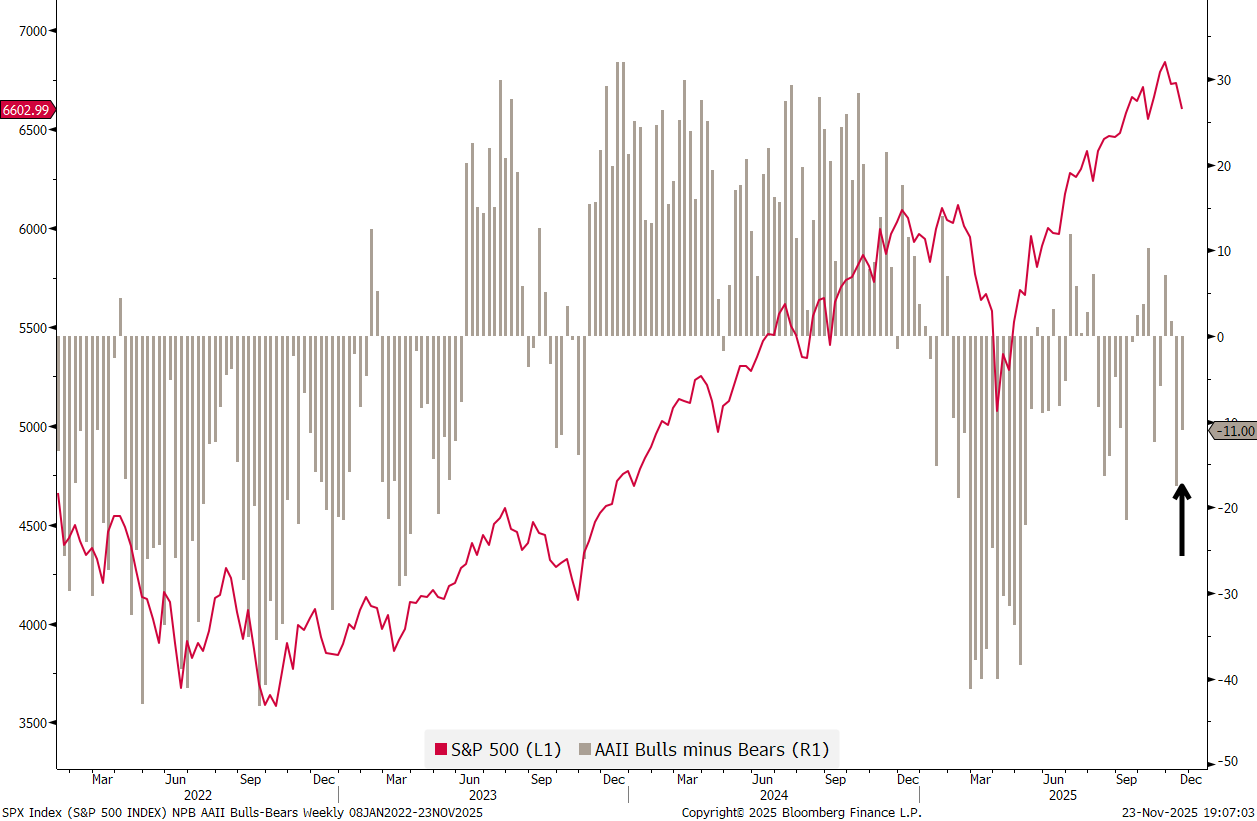
The AAII is not at negative extremes, but also negative enough to support an equity recovery:
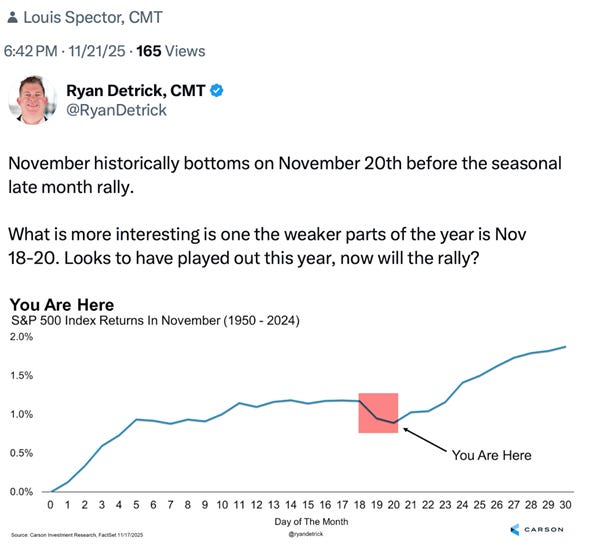
Stocks also have been adhering to the seasonality playbook, as this tweet and chart by Ryan Detrick shows:
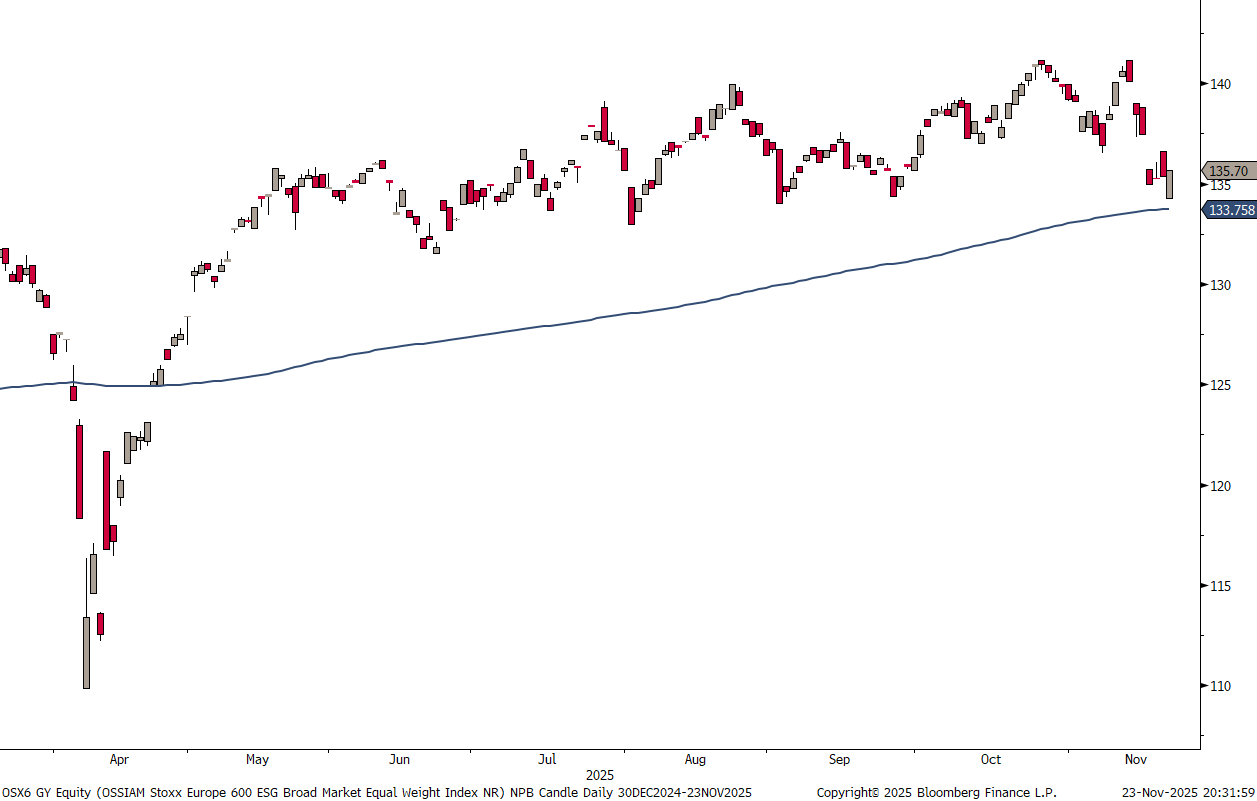
European markets (SXXP) are at a similar pivot-point:
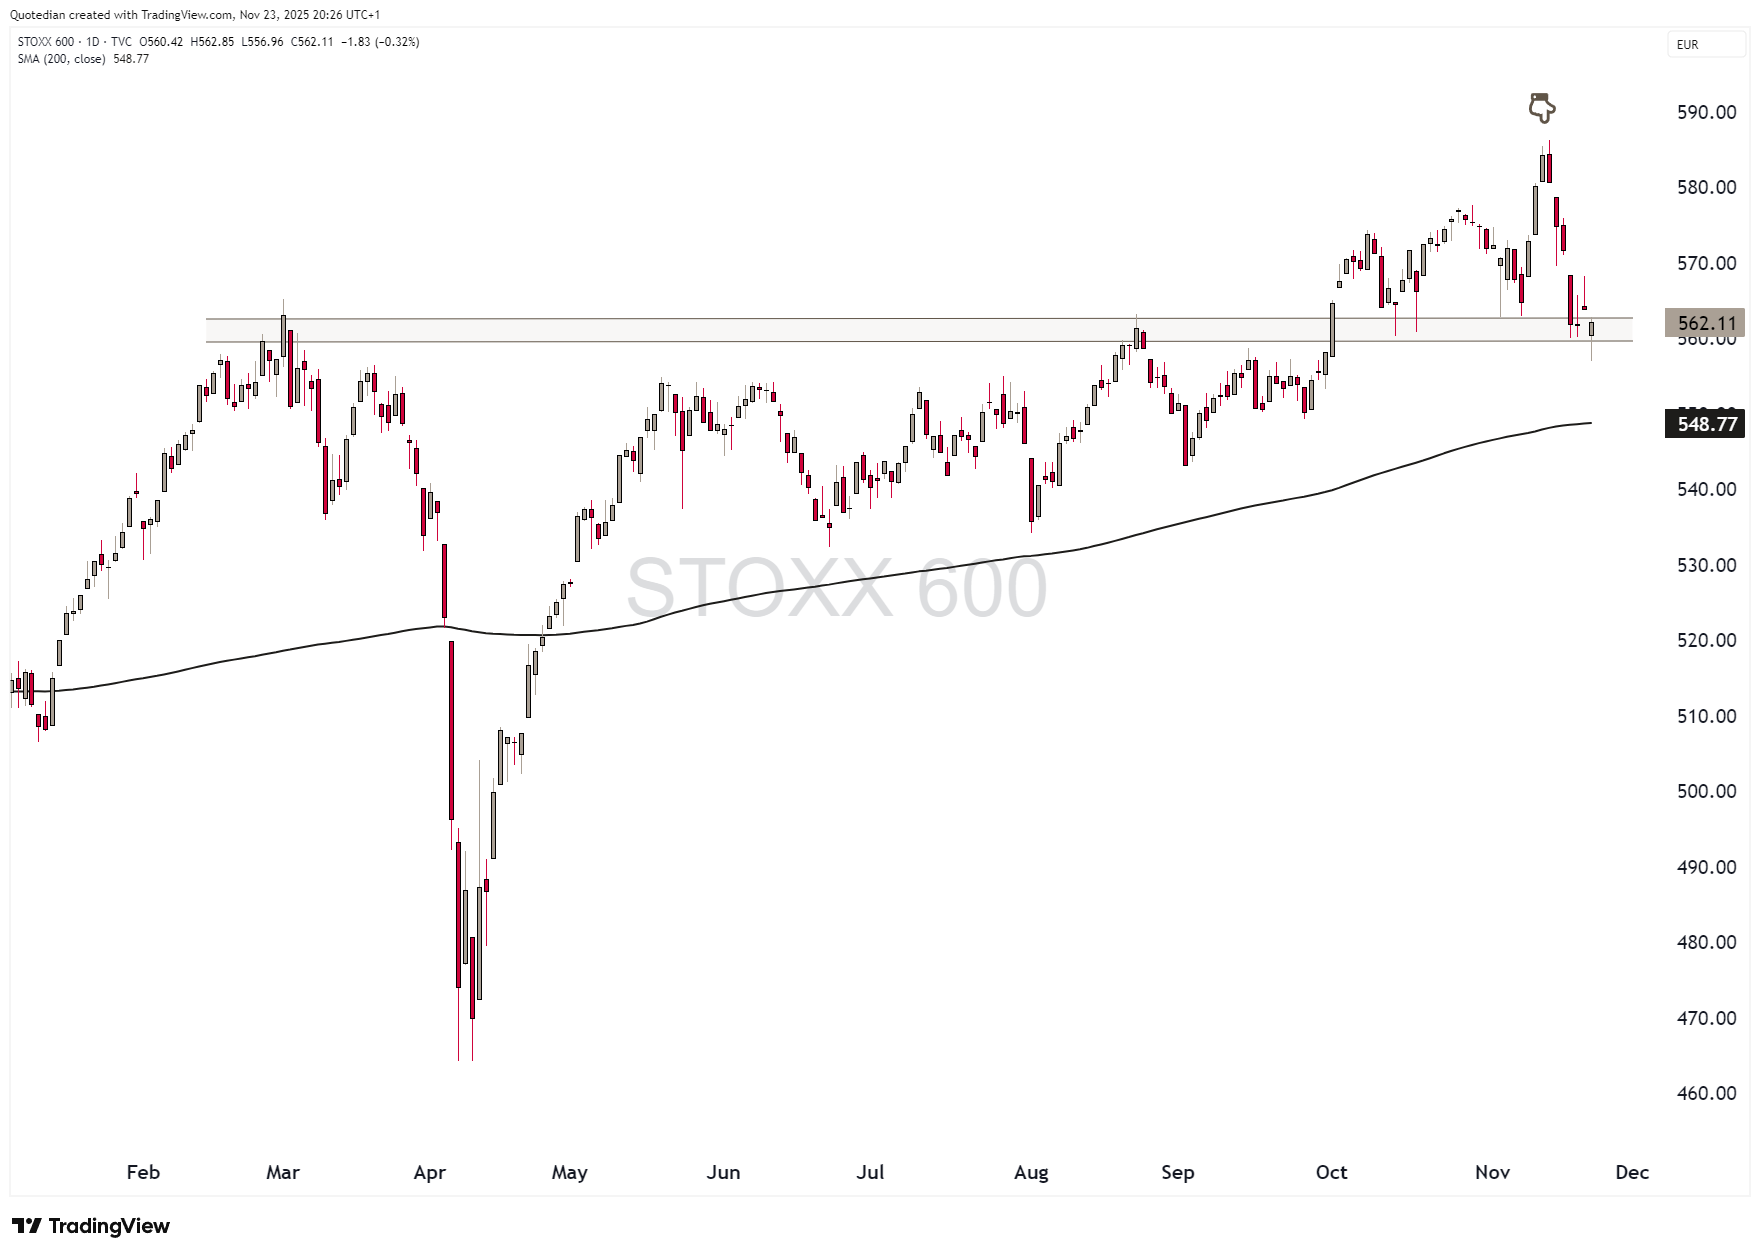
And, again, similar to its US cousins, the equal-weight version of the STOXX 600 has already reached the support zone from the 200-day moving average — and rebounded from there:
Looking under the (regional) had of European equity markets, something strange has happened:
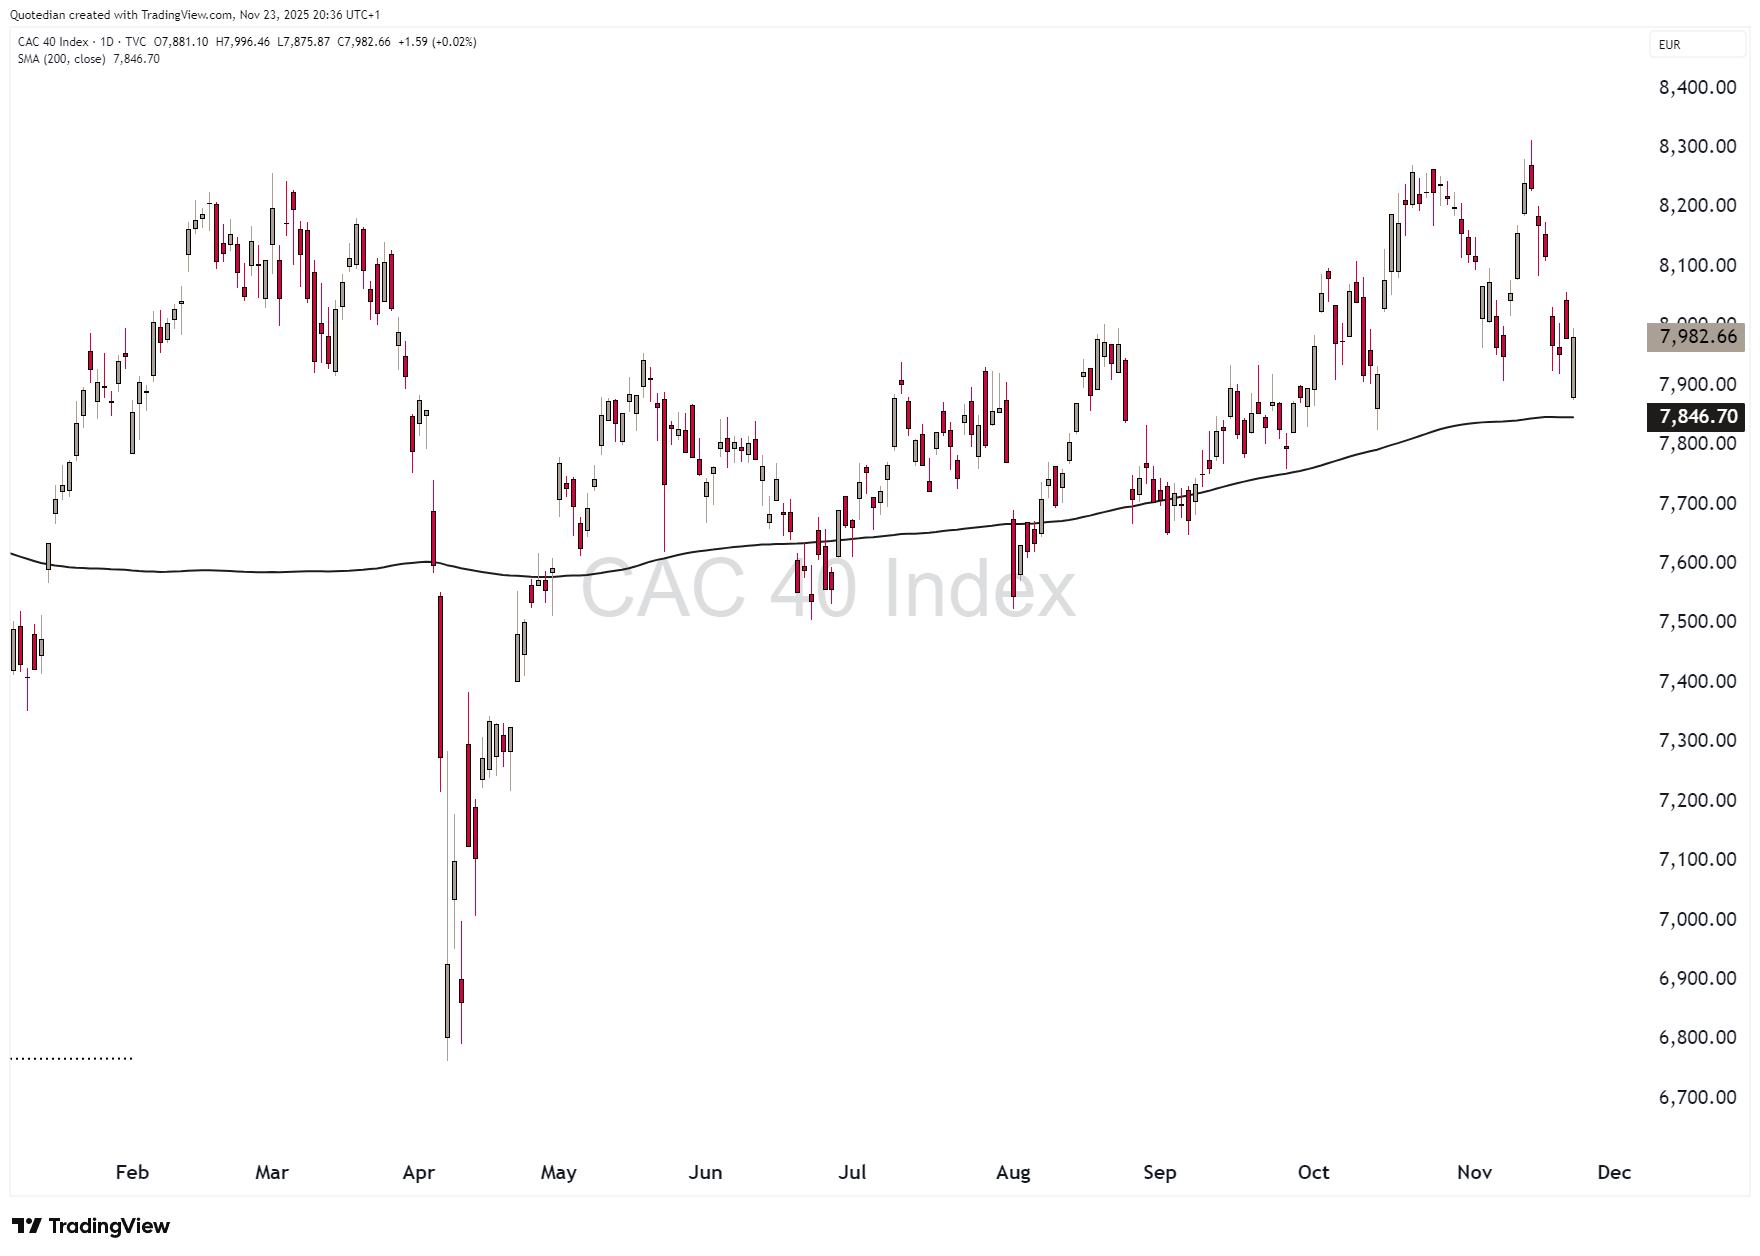
The laggard of the early days of the year, France’s CAC-40, is holding above the 200-aday moving average,
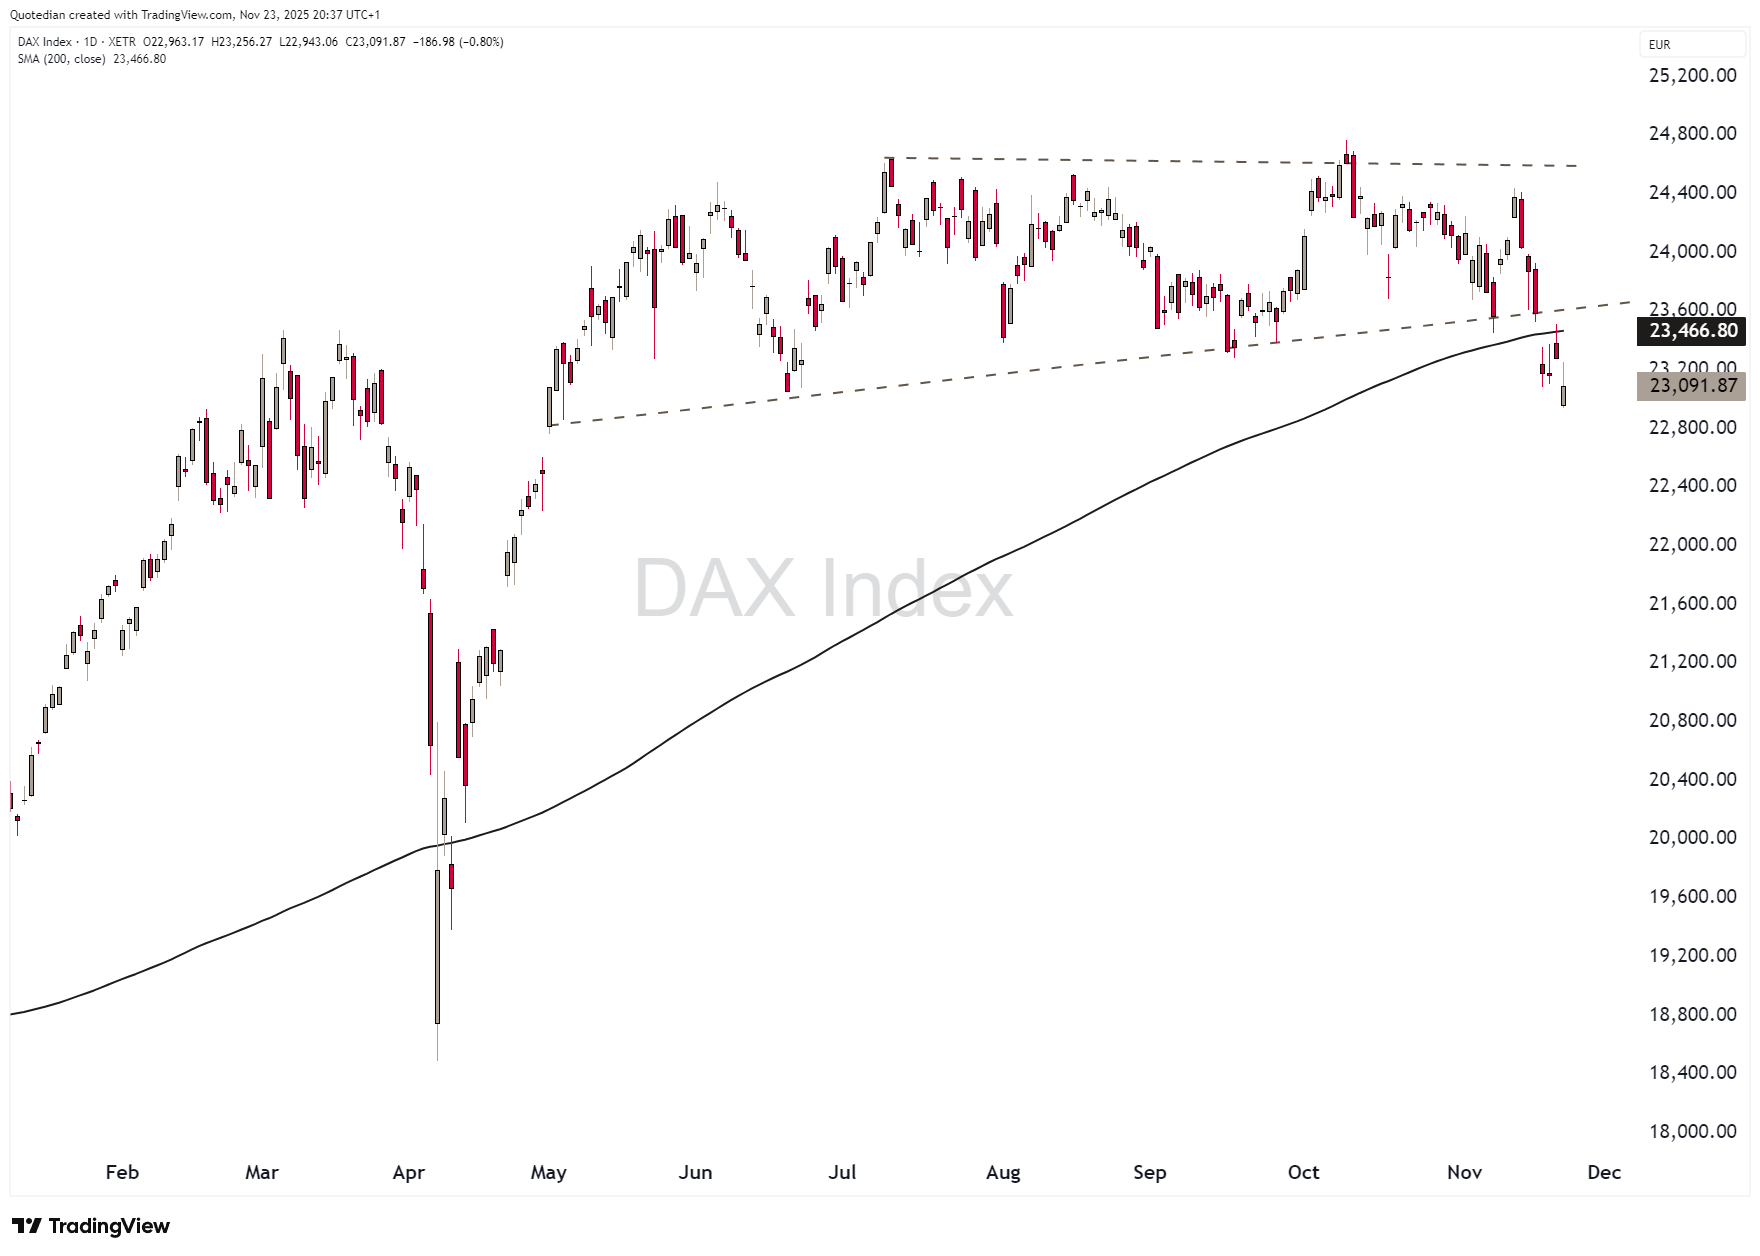
whilst one of the early star performers, Germany’s DAX, is falling apart on many levels:
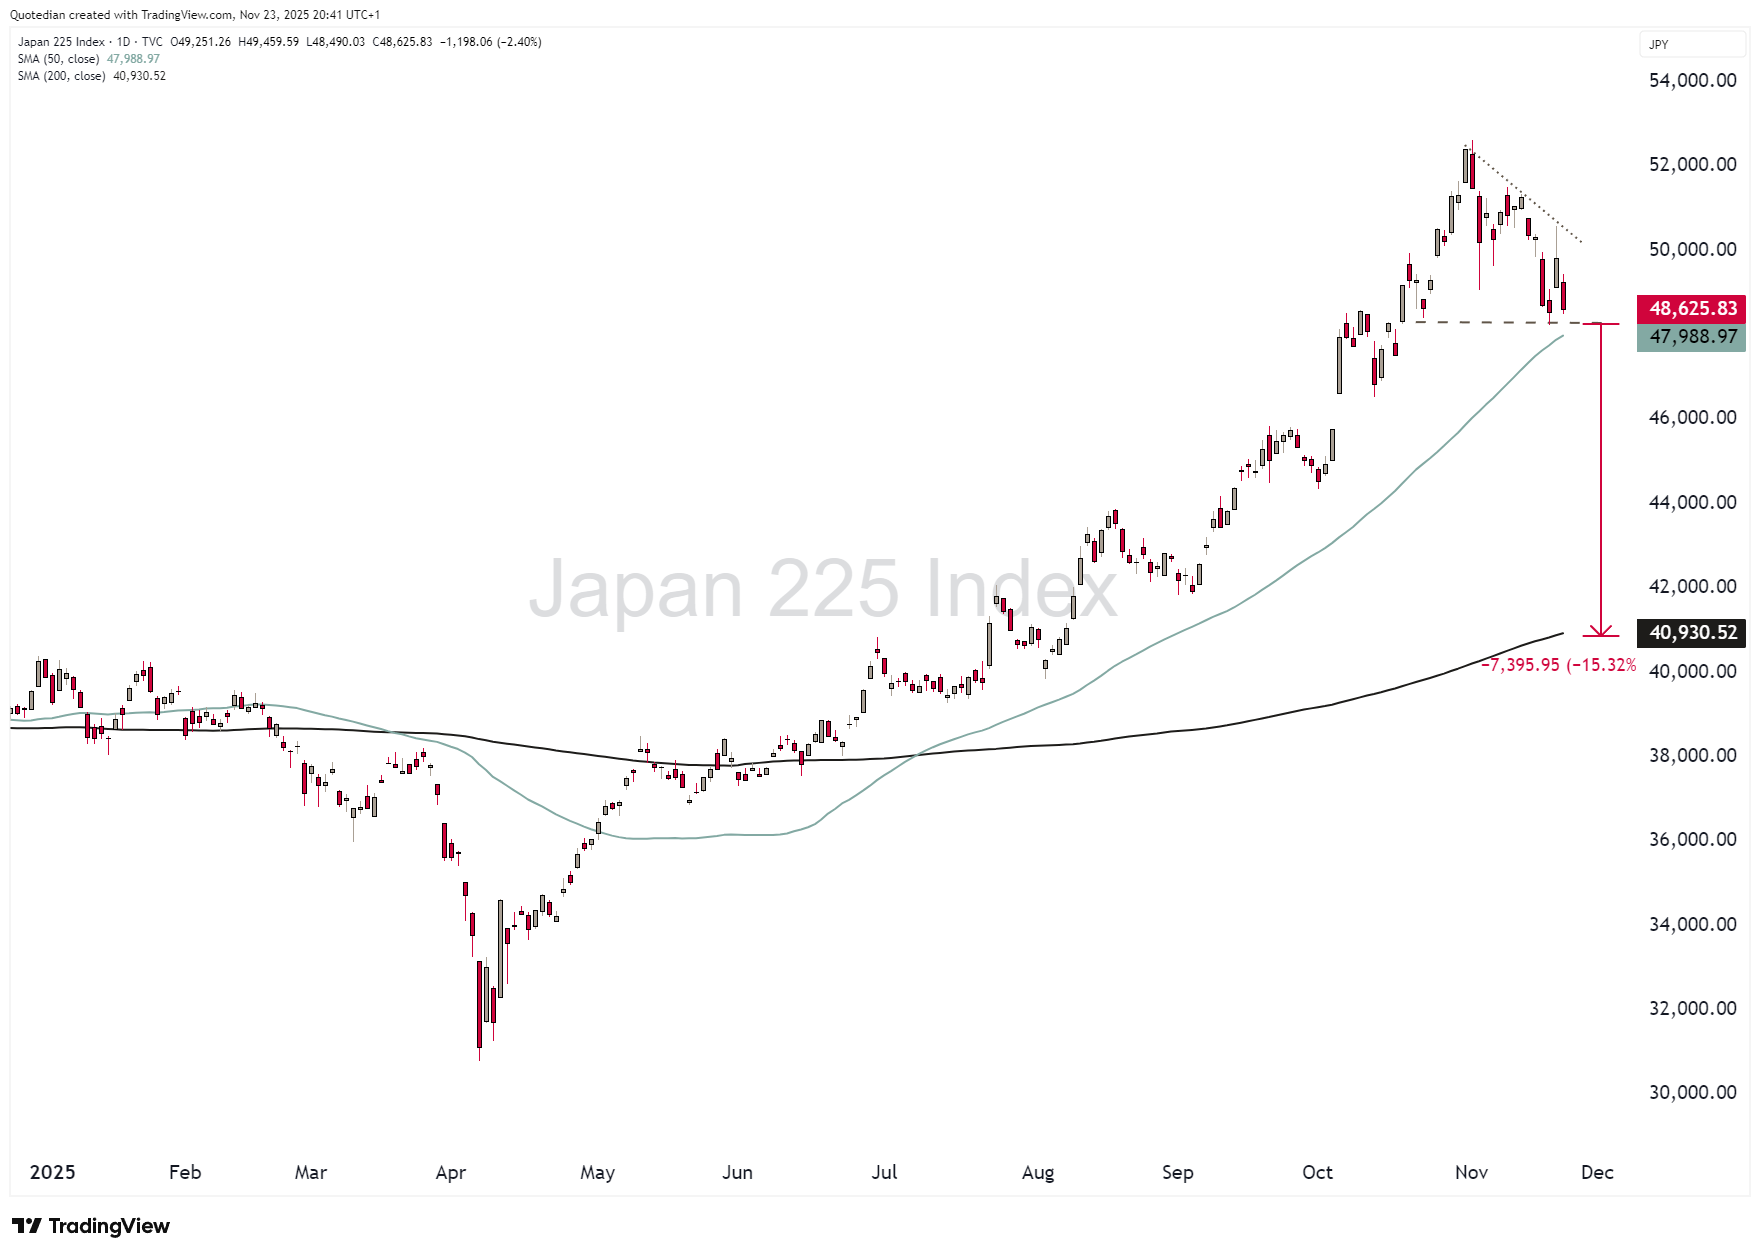
In the FAR East, Japan’s Nikkei-225 the is holding above the 50-day moving average despite a nearly 8% drawdown from all-time highs, but a break down here would mean a FAR way down ahead:
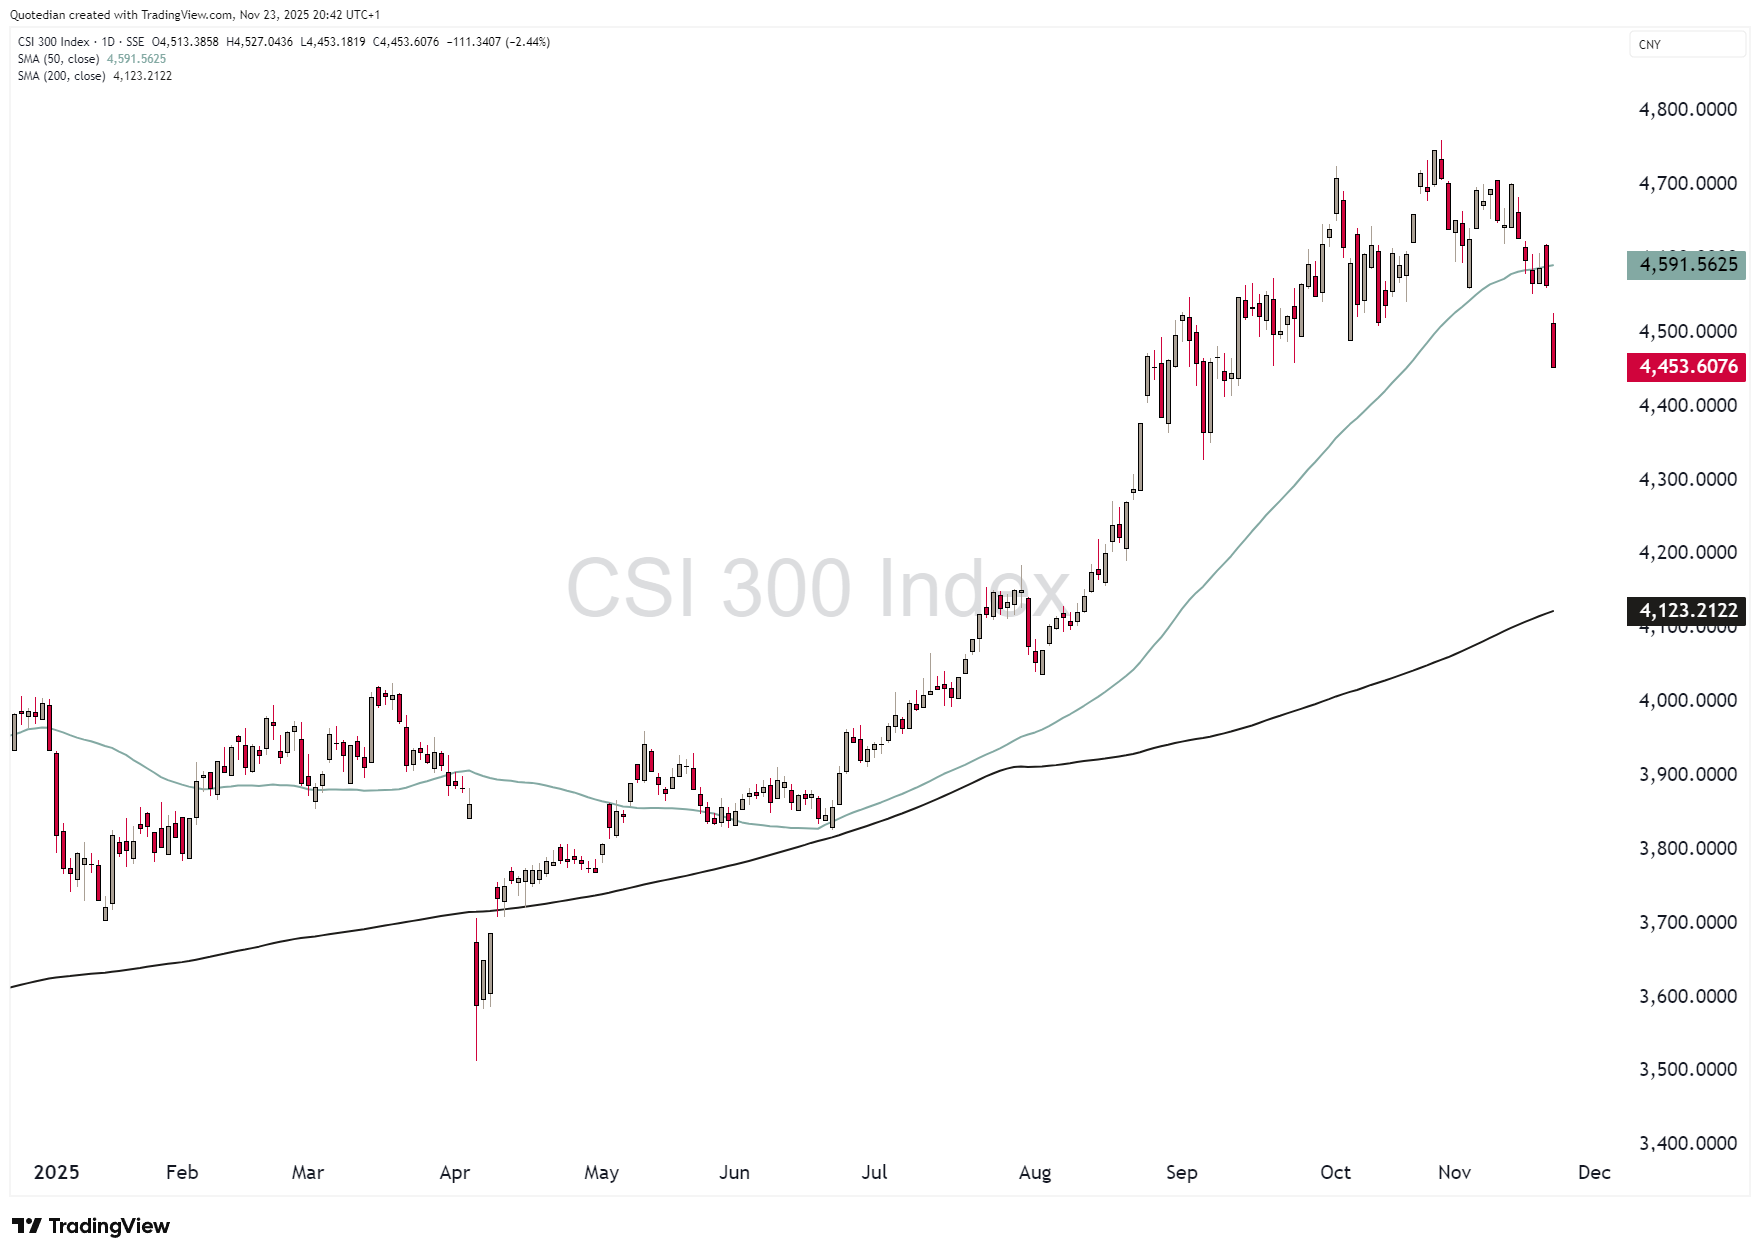
Chinese stocks (CSI300) however, could be in for a spout of trouble:
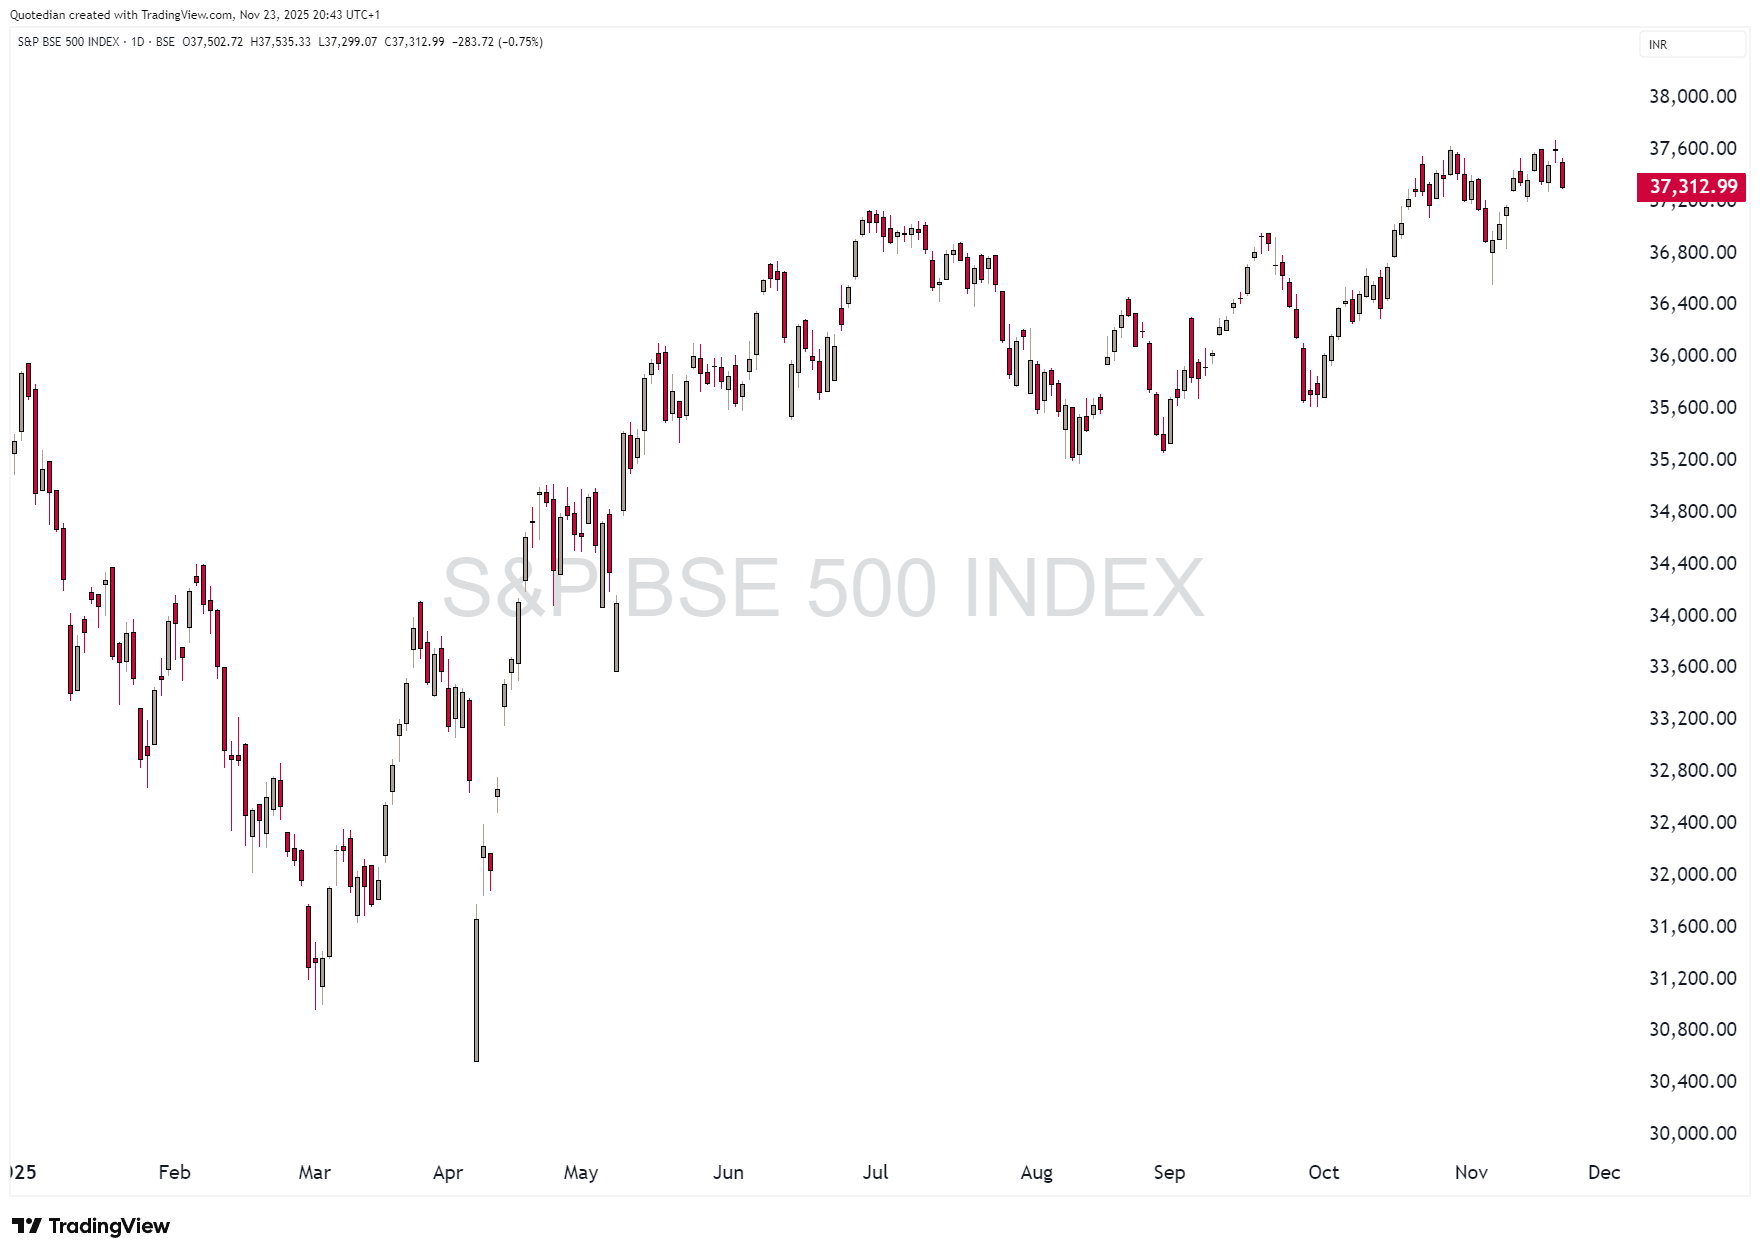
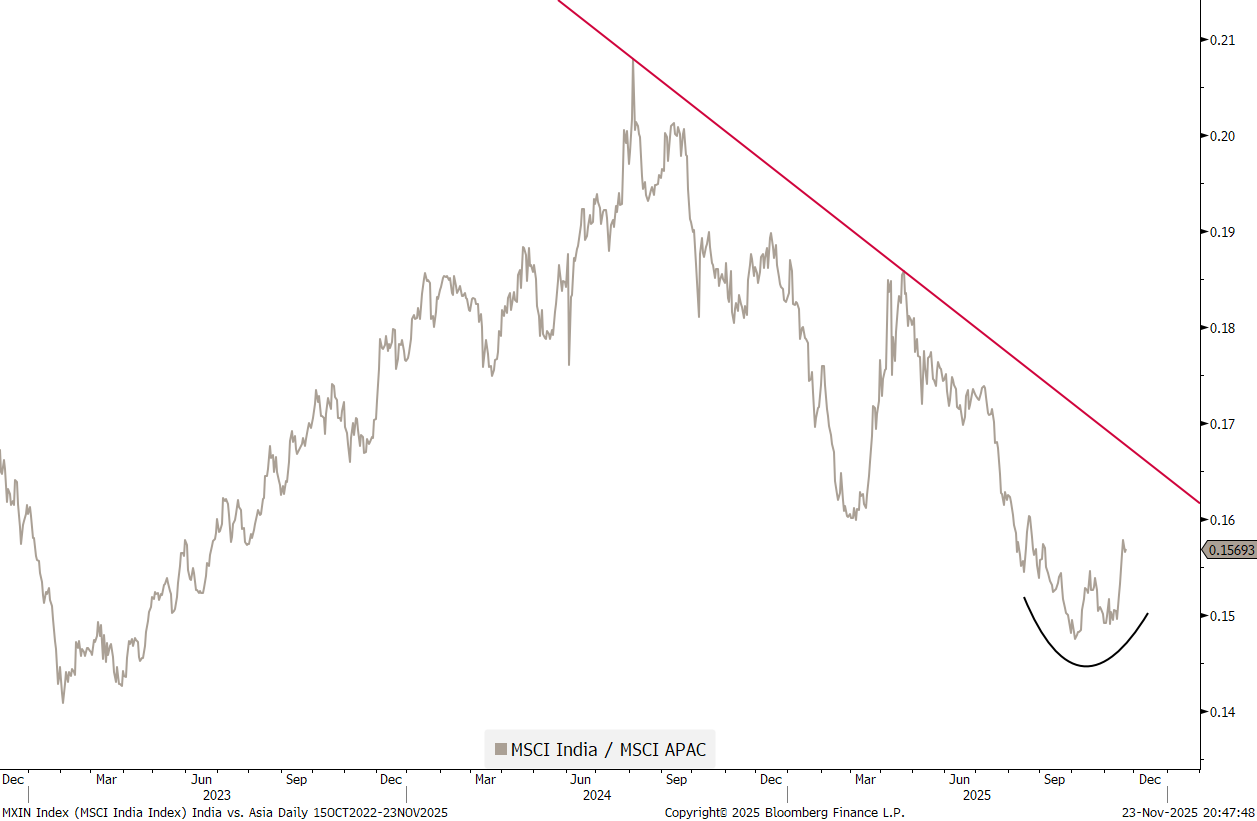
Whilst the Indian equity market seem determined to reclaim the ‘Asian Crown’,
also in relative terms:
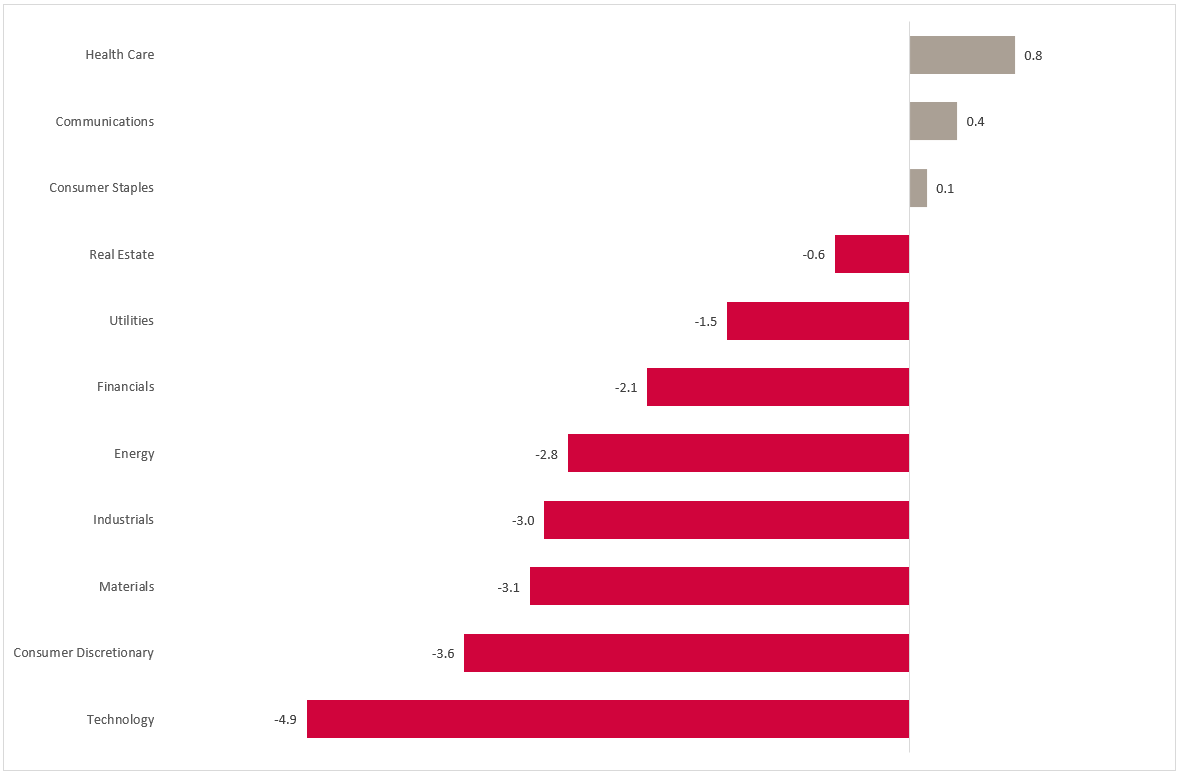
In terms of sector performance,
rotation is more than obvious - and -
also somewhat ominous,
as the market seems to position more cautious.
(oh, I feel so rapper now):
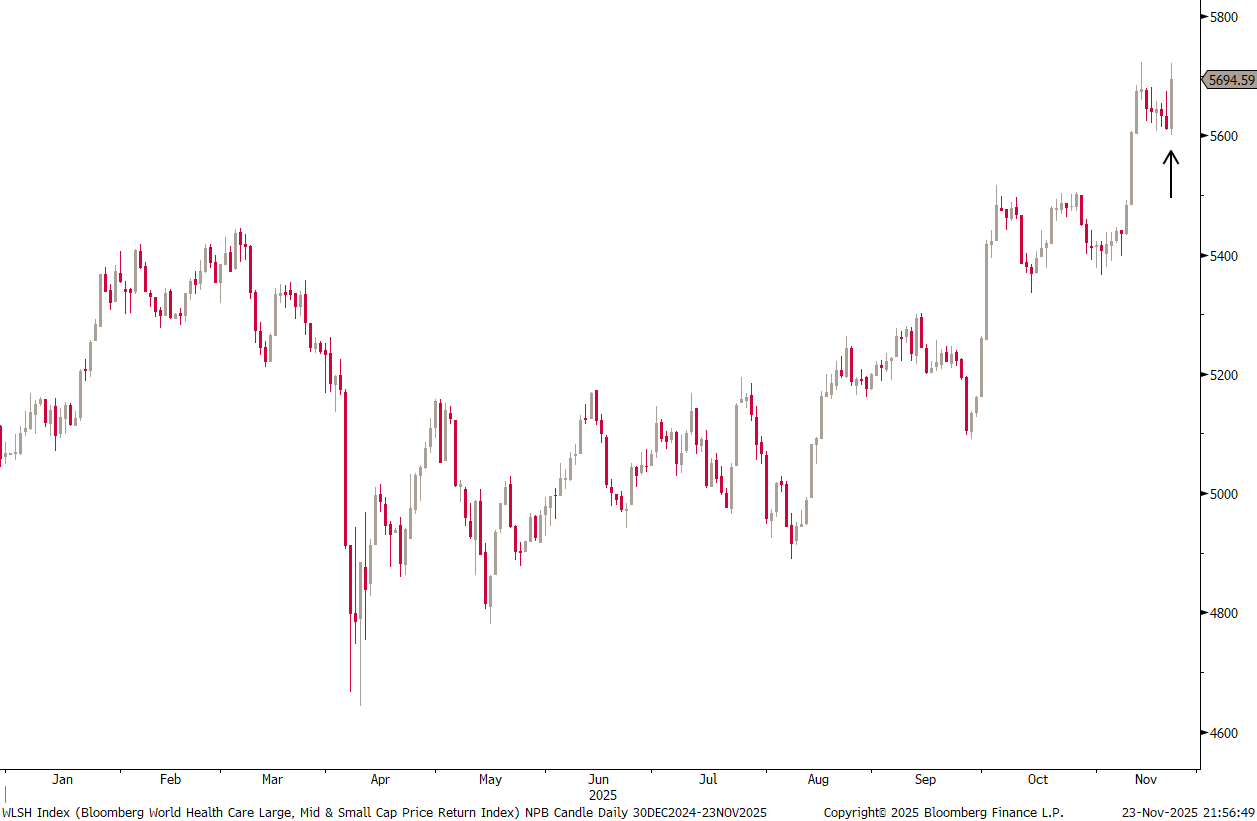
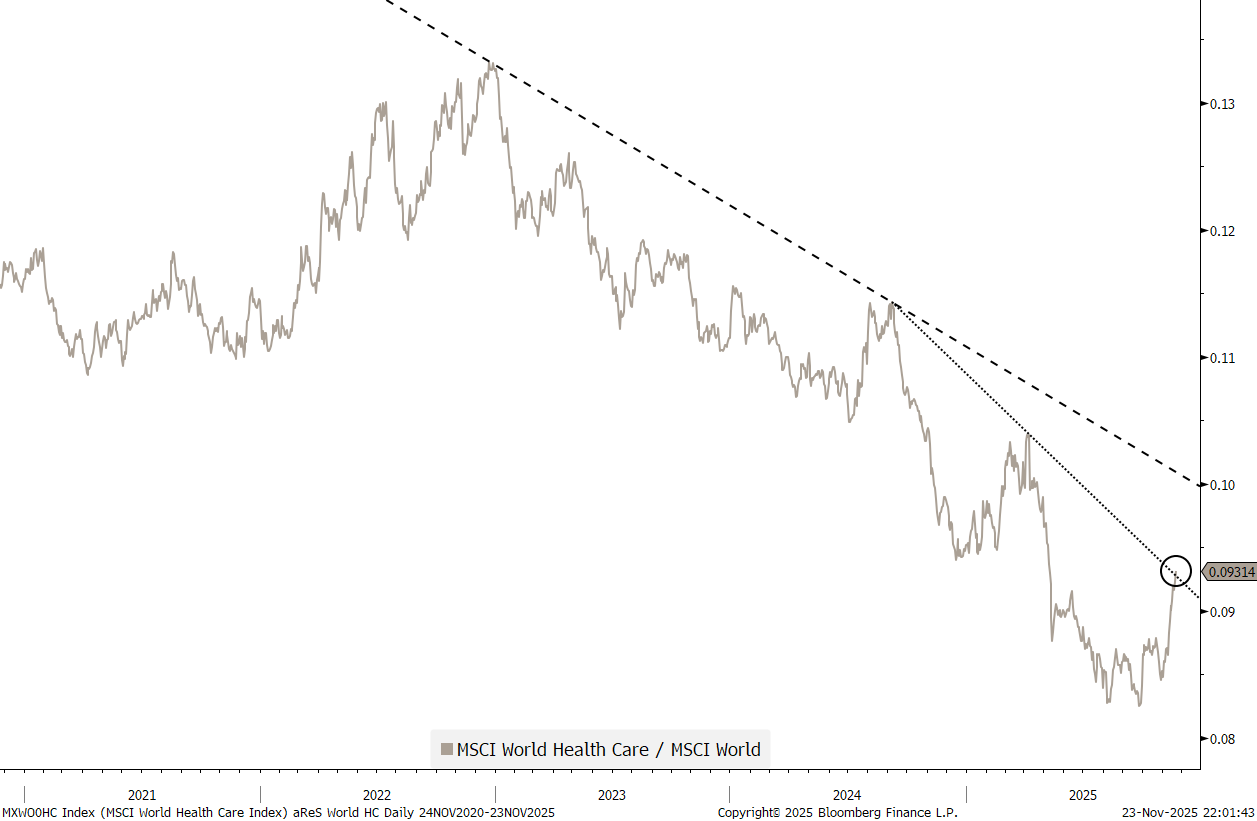
As I had shown in other instances, the health care relative bull could be only in its earliest innings. Here is the Bloomberg Word Health Care Large, Mid and Small cap index, showing a very nice positive reversal candle on Friday:
And also in relative terms we just may be getting started:
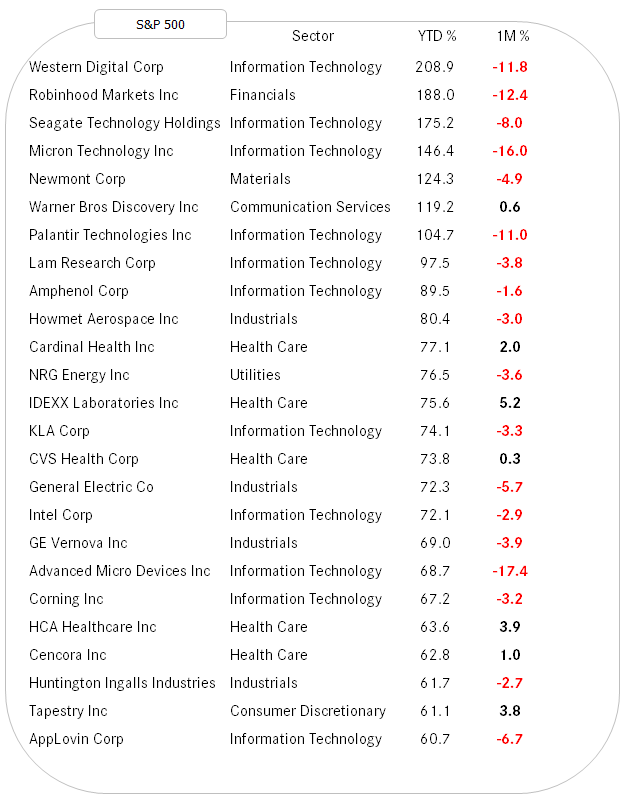
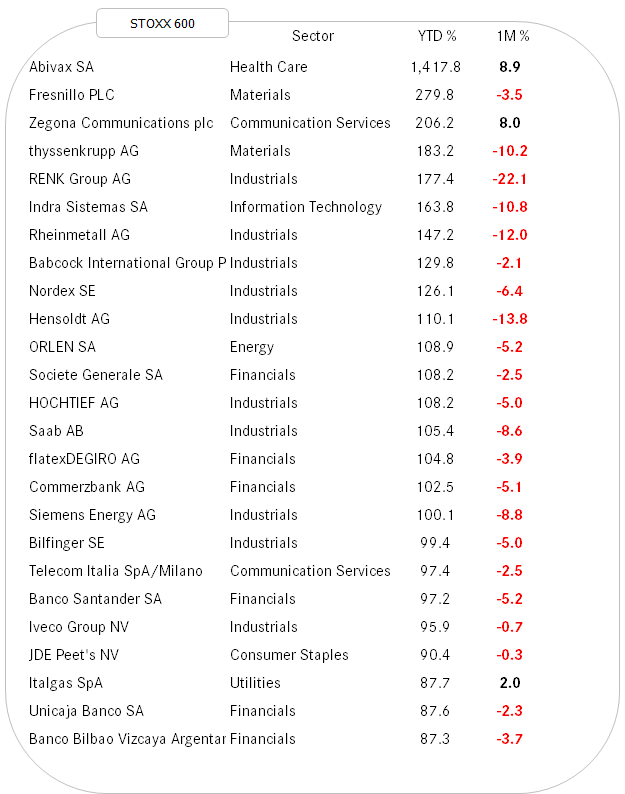
Now, let’s finish off the equity section via our usual glance at the best performing stocks in the US (S&P 500) and Europe (STOXX 600).
Checking the US table first, I would note that those who remain bullish have some great entry opportunities to the best performing stocks YTD now:
Ditto for the remaining European equity bulls:

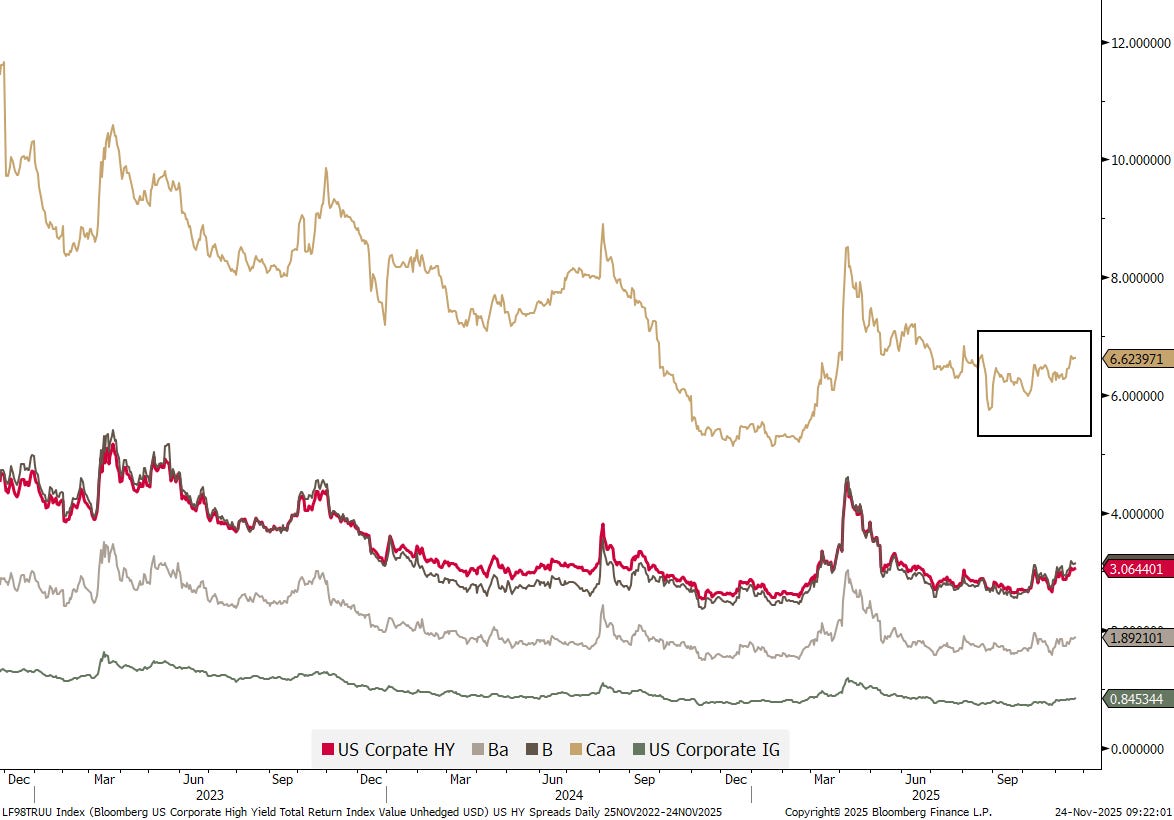
In the fixed income realm, the focus has been a tad more on the credit than the interest rate risk side at least in Western markets.
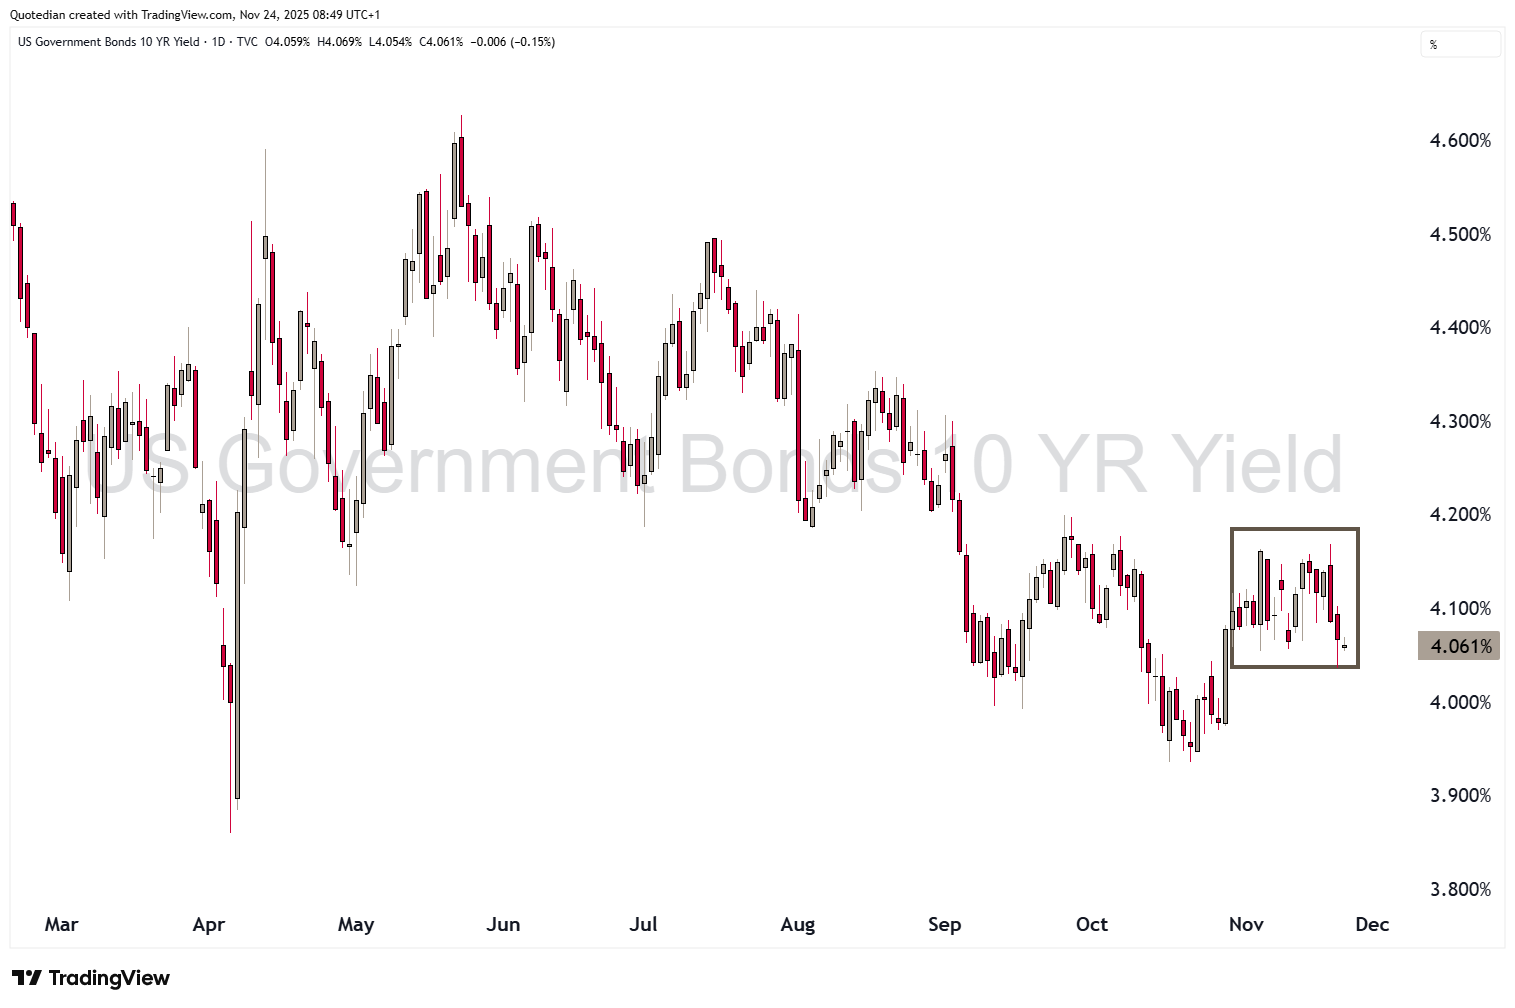
Yields have come lower in the US,
and Europe,
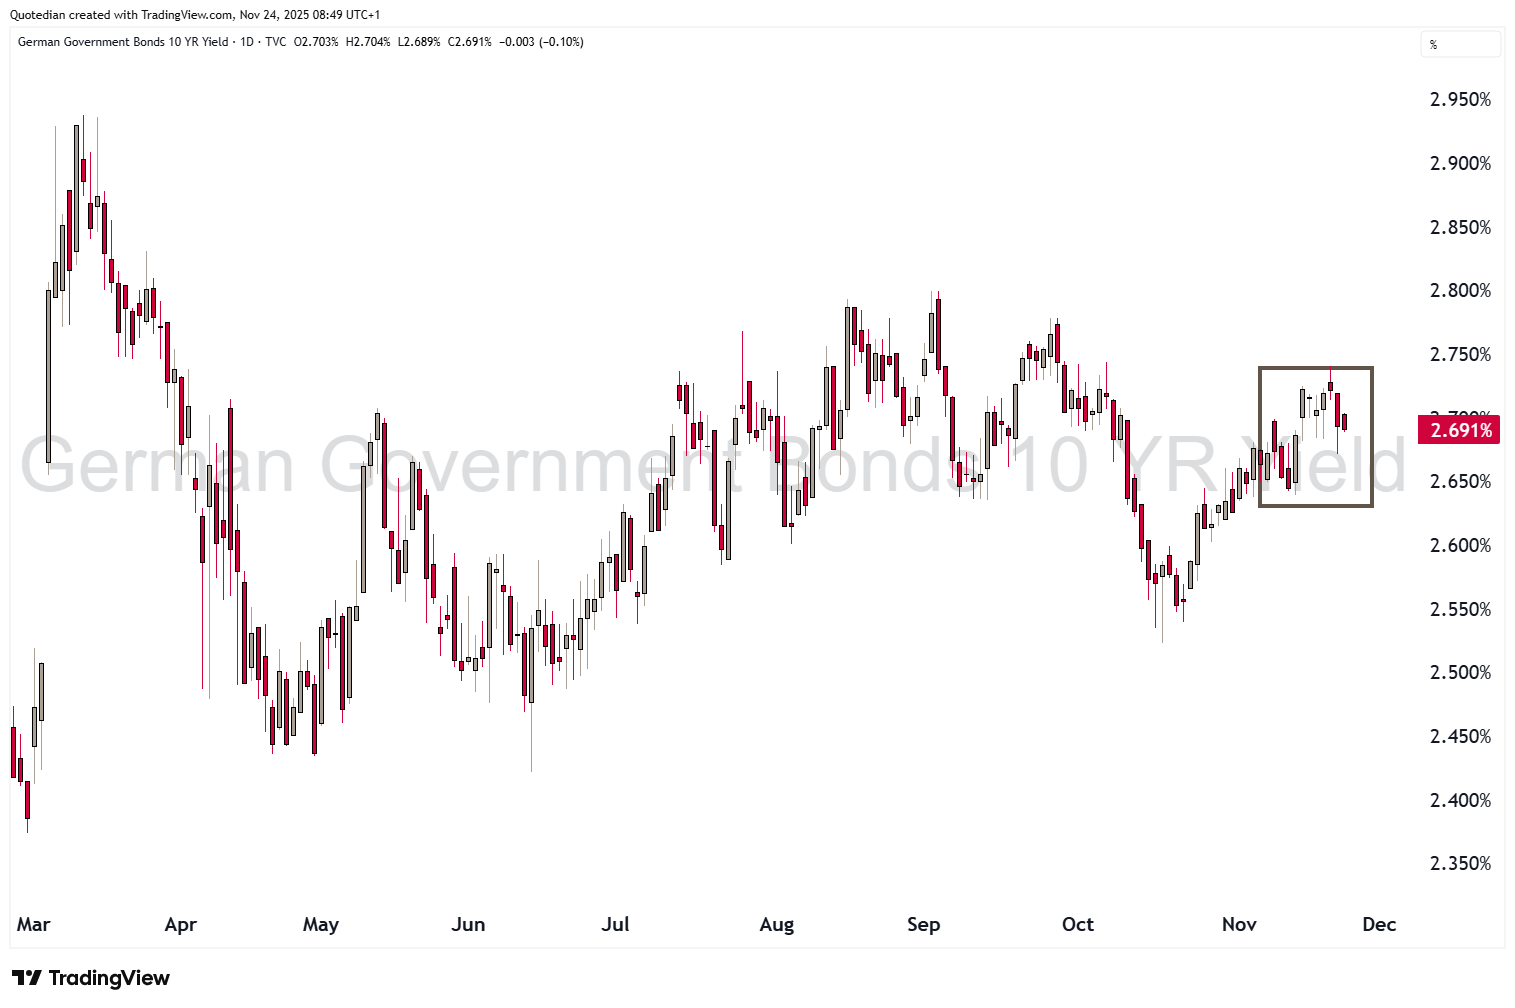
but overall they (the 10-year yields) have been trading in a wide range (respective black boxes) since the beginning of the month.
As mentioned, the focus was somewhat more on credit side, with especially this chart on CDS (Credit Default Swaps) pricing on Oracle making the rounds:
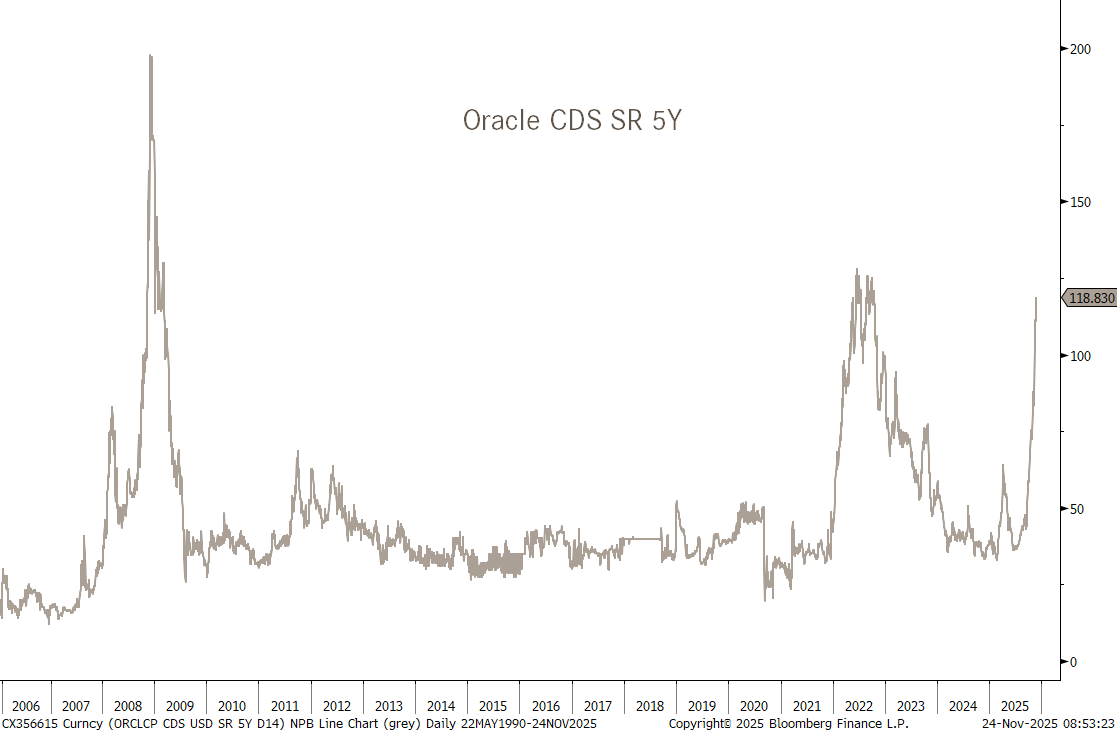
Now, for effect, that is impressive, however, its just one company. More important would be a glance at the overall market, where there is overall still a lot of calm to be detected:
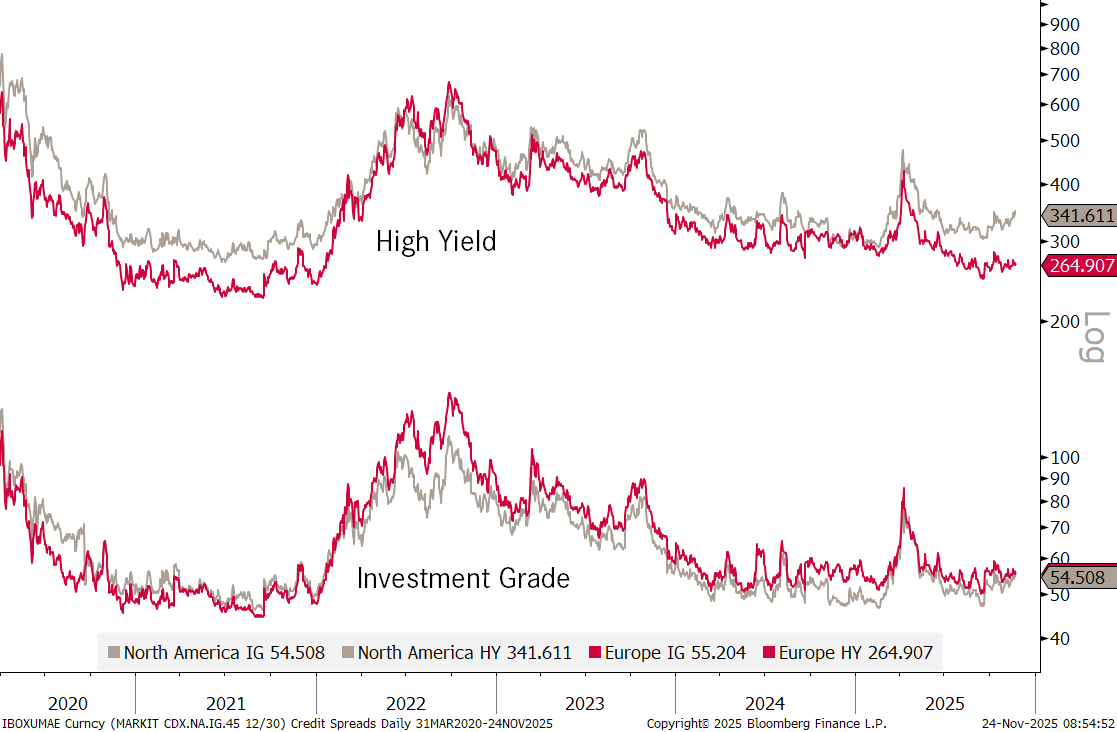
A possible divergence is noted between US and European high yield, which mostly stems from a widening in the lowest grade part of US high yield (brown line):
Is the spread widening due to fears over the technology sector and too much capex only?
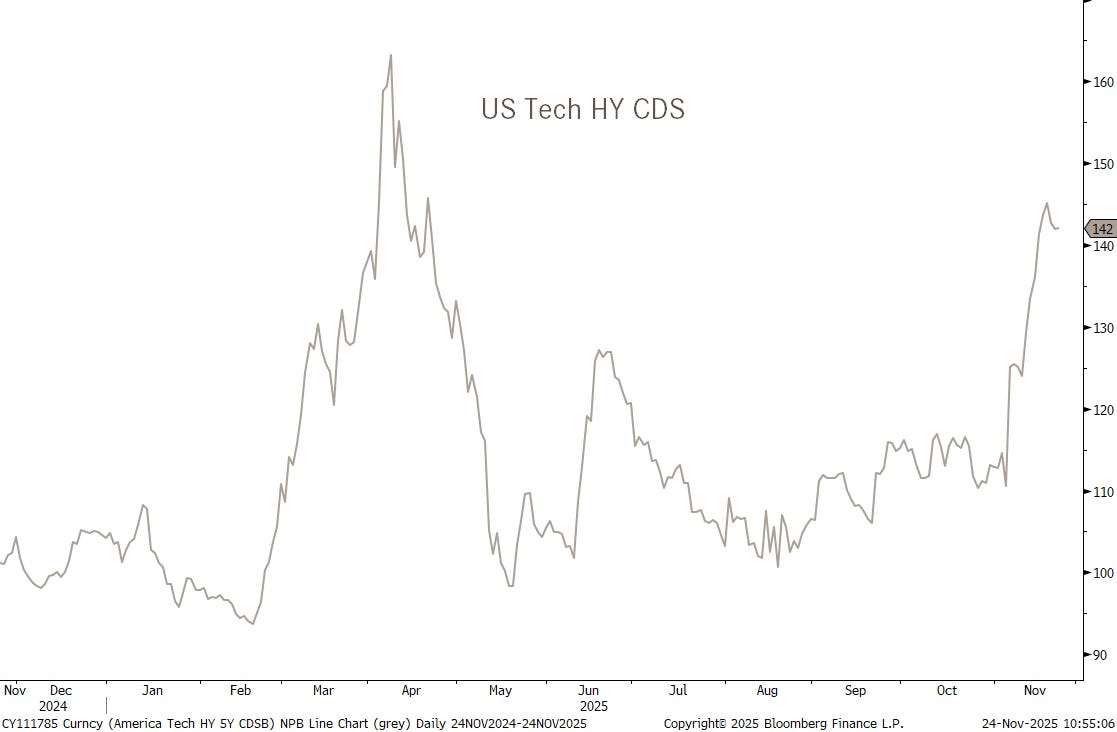
Perhaps.
But even though no specific stress is visible in the Financial sectors CDSs (yet), the private credit/debt part continues to fall apart as for example witnessed by the VanEck BDC (Business Development Company) Income ETF and its components:
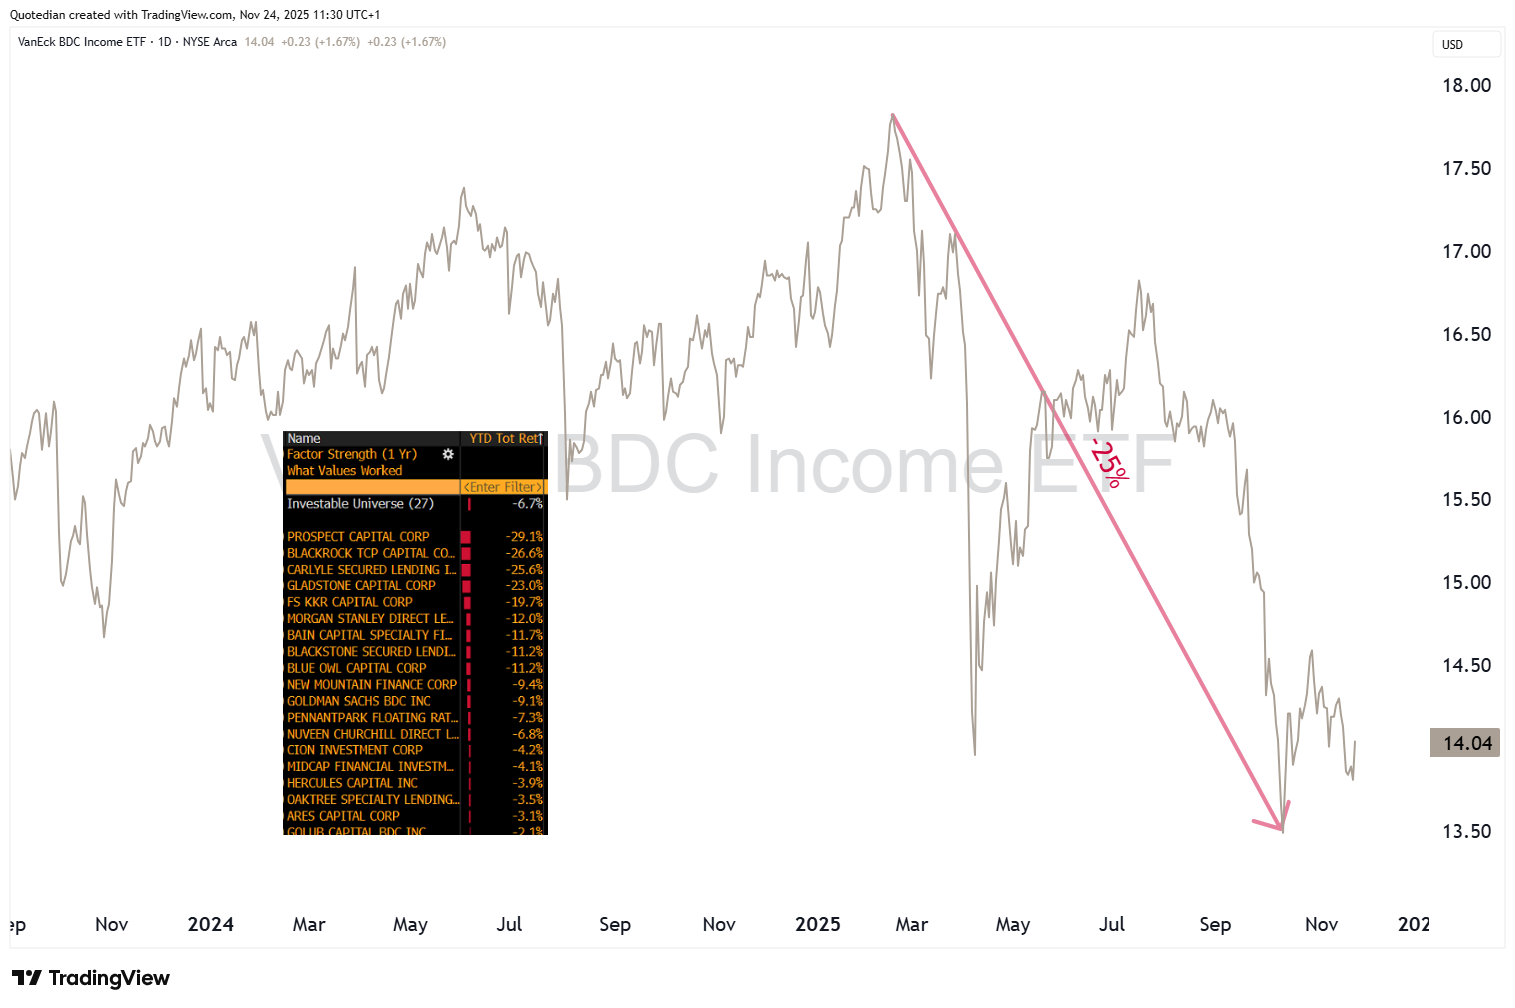
Blue Owl has become the black sheep of the sector, or maybe better said, the black cockroach?
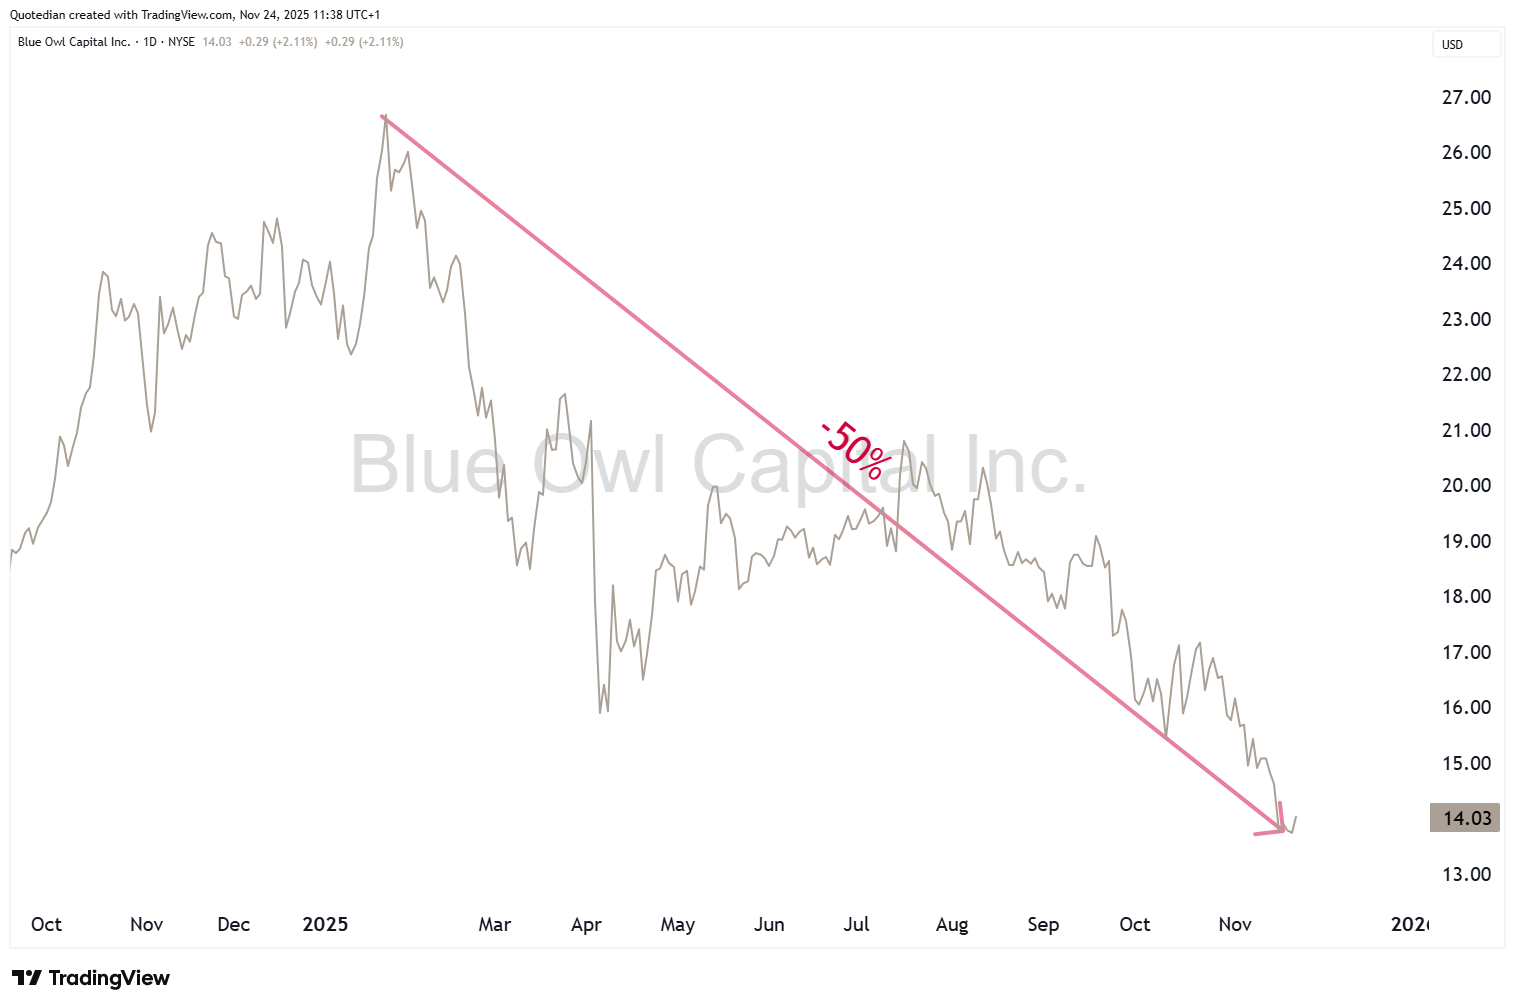
Zooming out on the same chart, a technical analyst may be inclined to attribute an additional 50% decline from the current level:
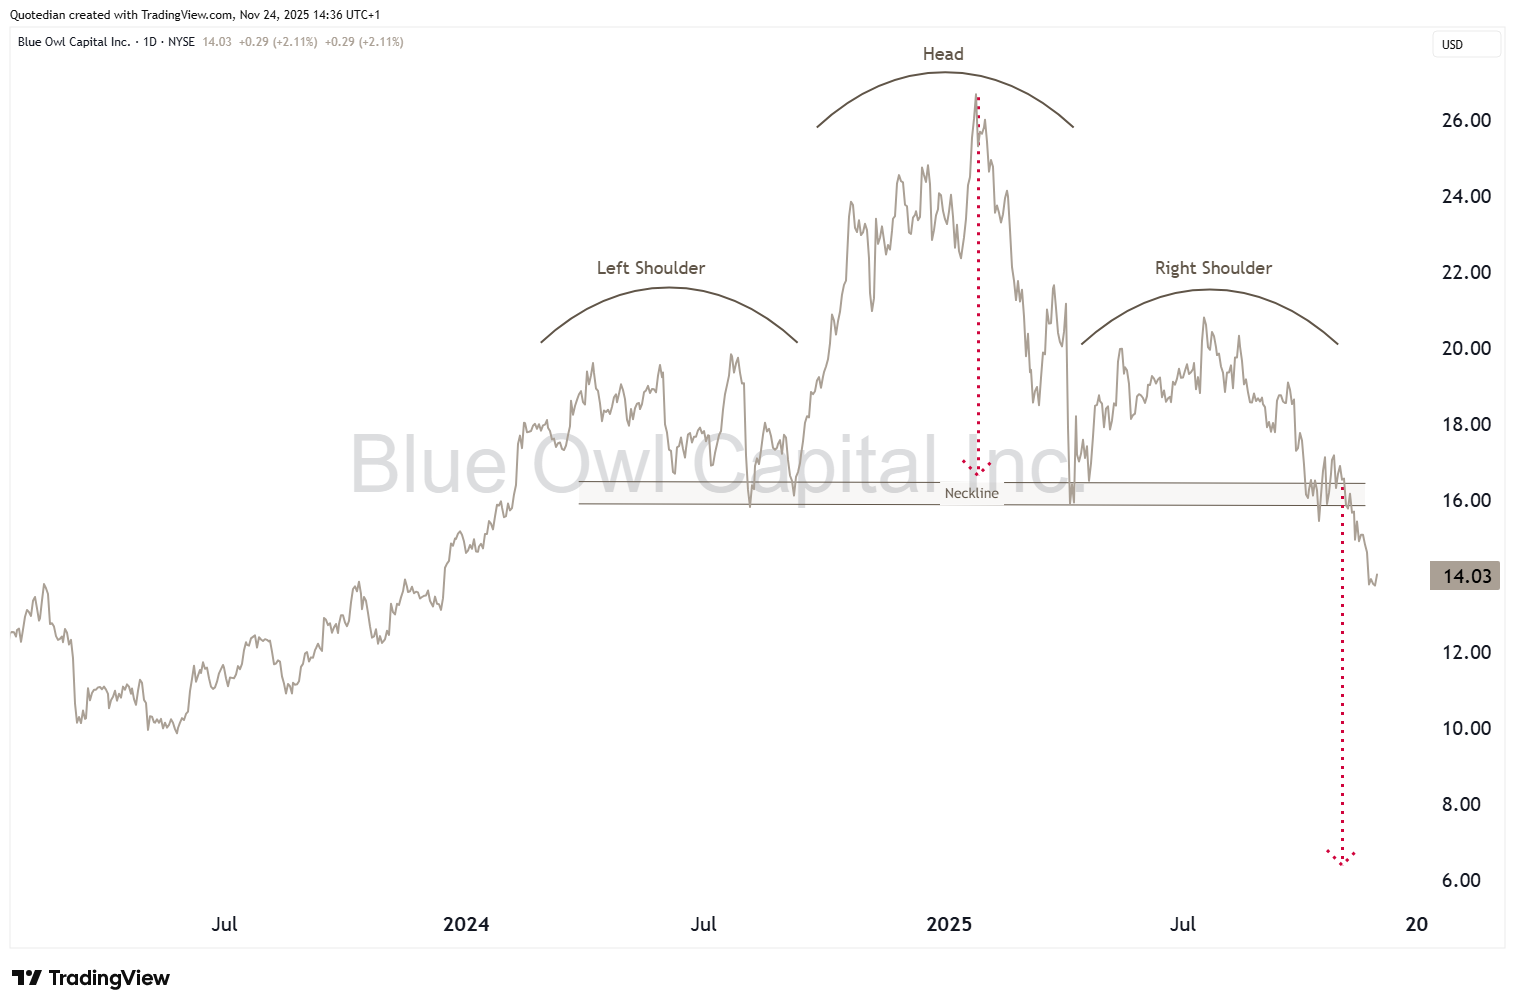
The chart seems to say Hoothoot (=Goodbye in Owlish)

Two more things before we head over to the currency section.
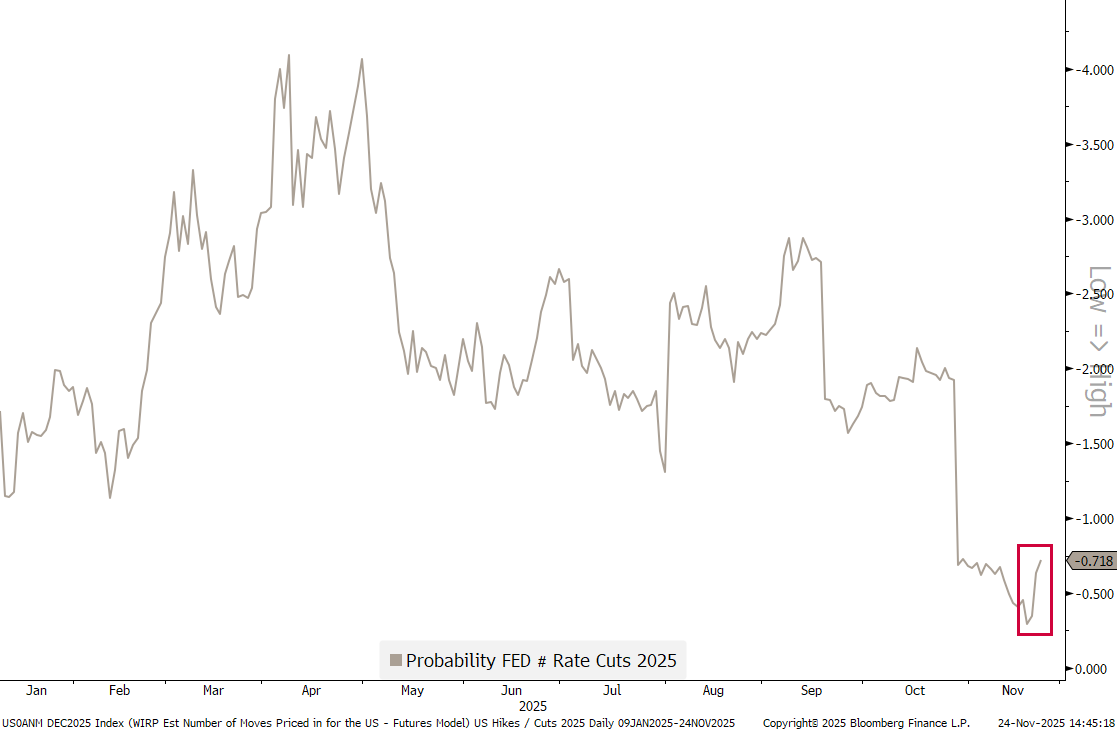
For one, NY Fed President John Williams said on Friday that he is leaning to a December rate cut (without actually mentioning December but saying ‘near term’ instead). As a function reaction to that, futures markets are now anticipating a 25 bp cut in December with a 70% probability, sharply up from only 30% the previous day:
Secondly, I mentioned at the outset of the FI section that credit has been more in focus than interest rates over the past weeks, which is however not true when it comes to Japan.
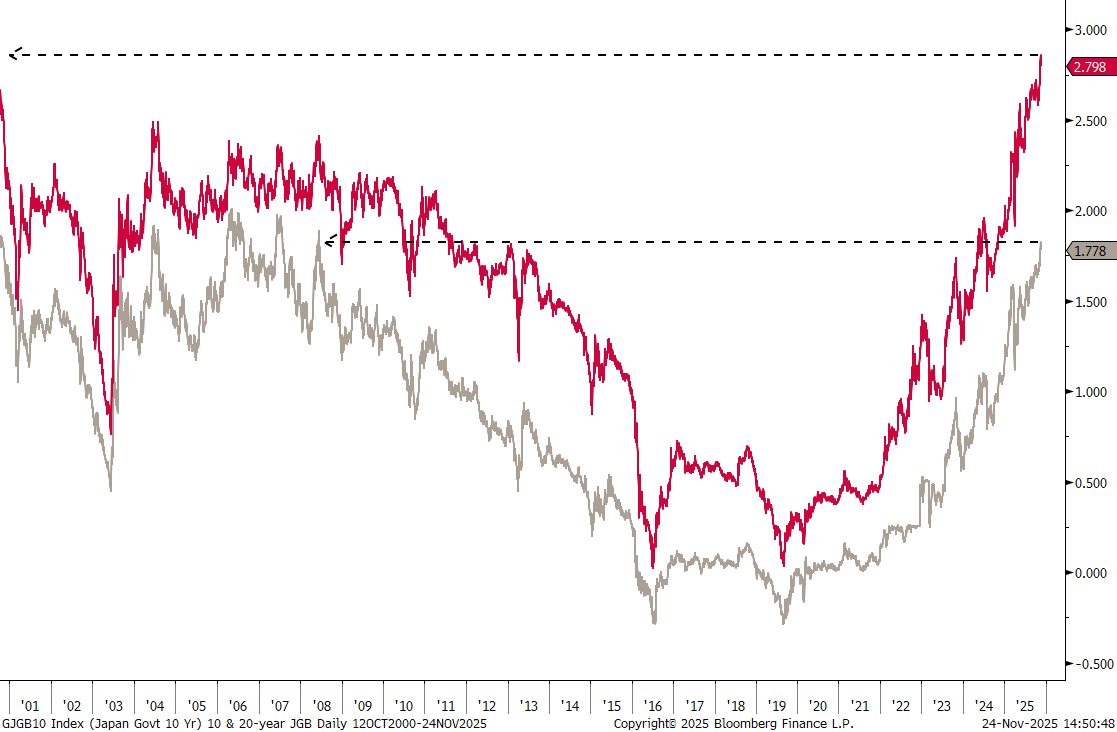
10-year JGB yields are hitting their highest levels since 2008, and make that since ‘forever’ for the 20-year version of the same Japanese Government Bond:

This study of Japanese yields serves as perfect segue into the currency section, where we observe that despite the rising 10-year JGB yield (grey), and a shrinking US-Japan yield spread (not shown), the Japanese yen is weakening versus the US Dollar (red line):
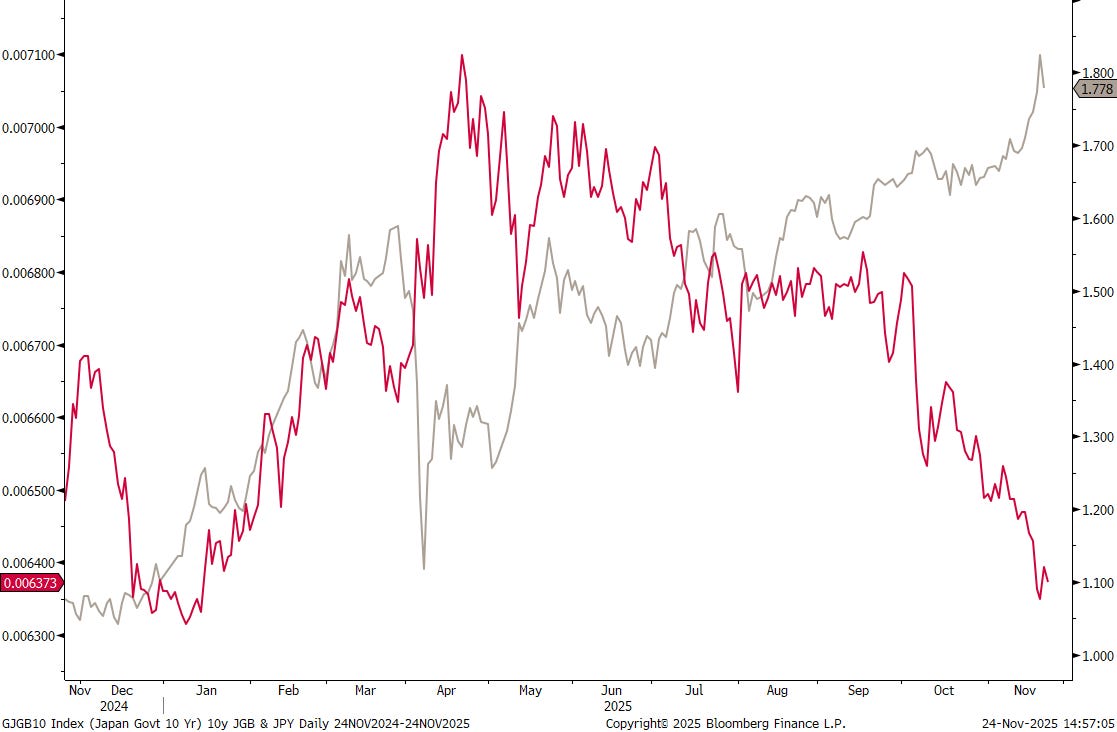
I wonder where on earth I have seen this before a few years ago?
Oh. Yes. Right.

Damn!
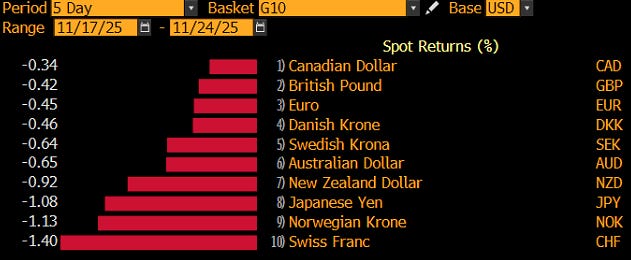
Anyway, the US Dollar has not been strongly only versus the JPY, but versus all other G10 currencies too over the past week:
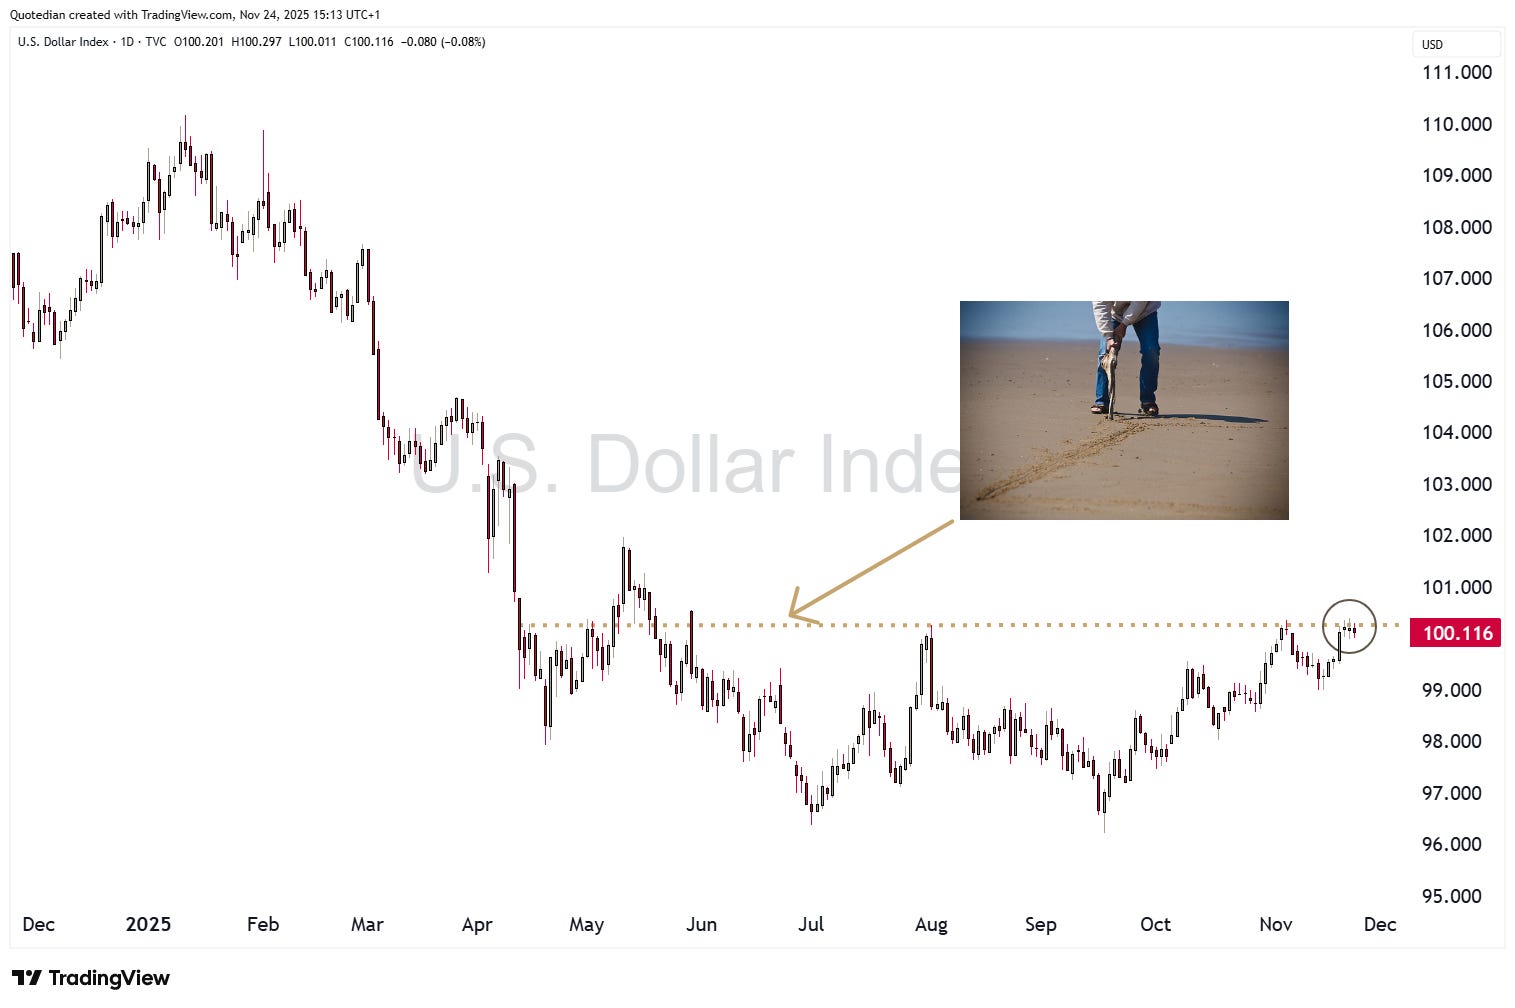
This means the US Dollar Index (DXY) is standing right AT your line in the sand:
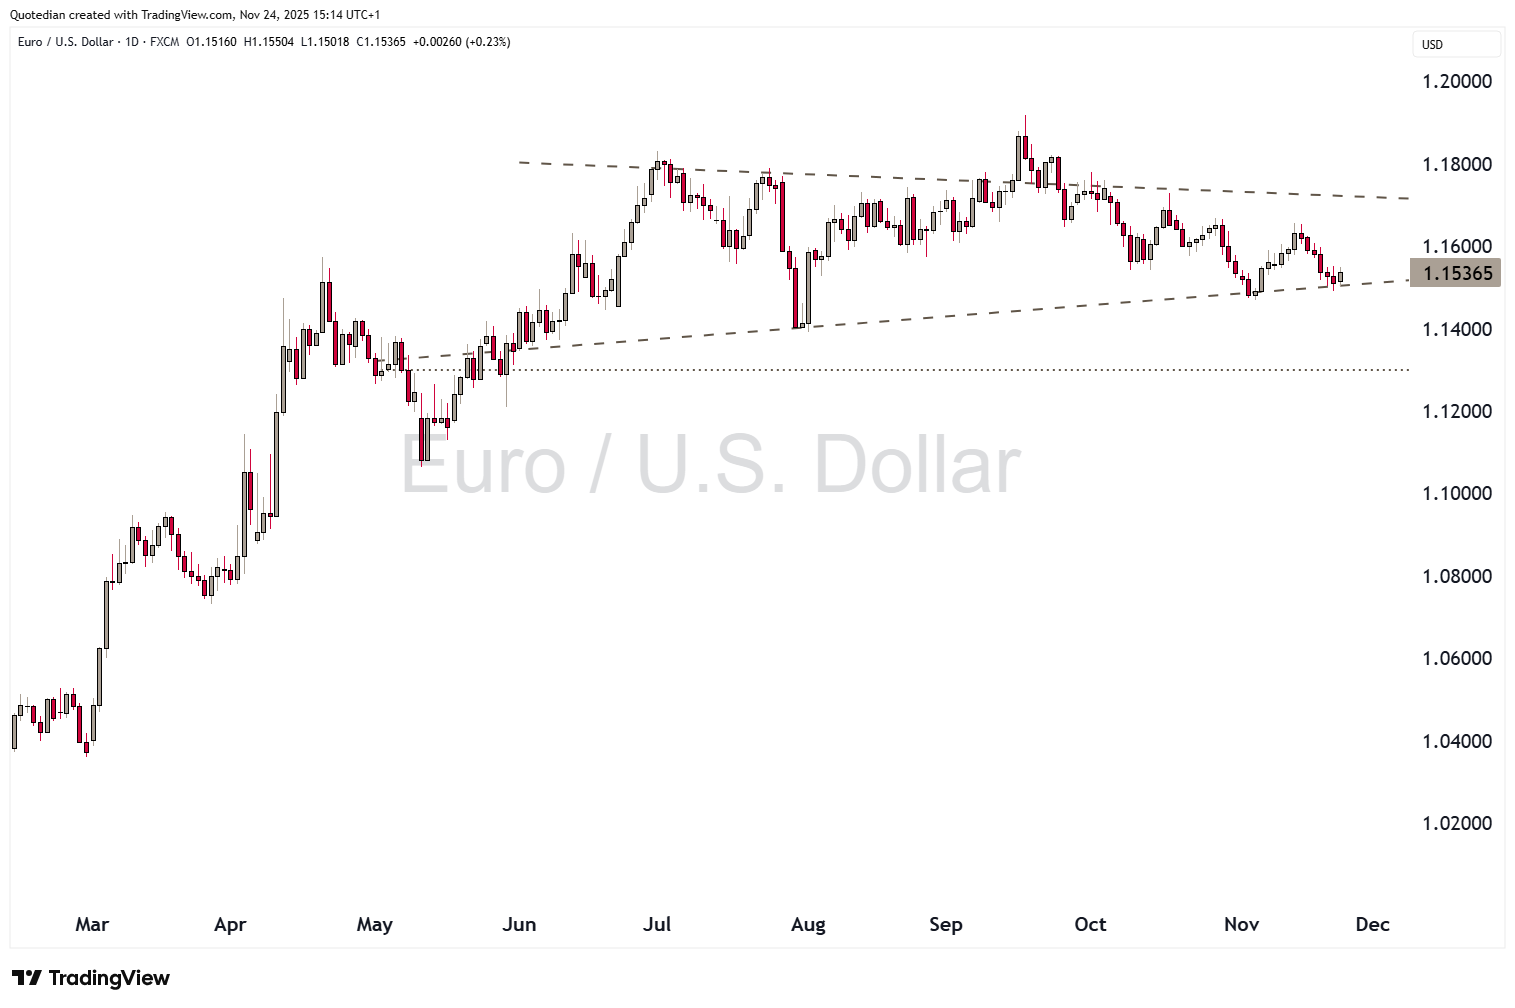
The EUR/USD, rebounding ever so slightly over the past few hours post the John Williams rate cut comments, also still trades within its boundaries:
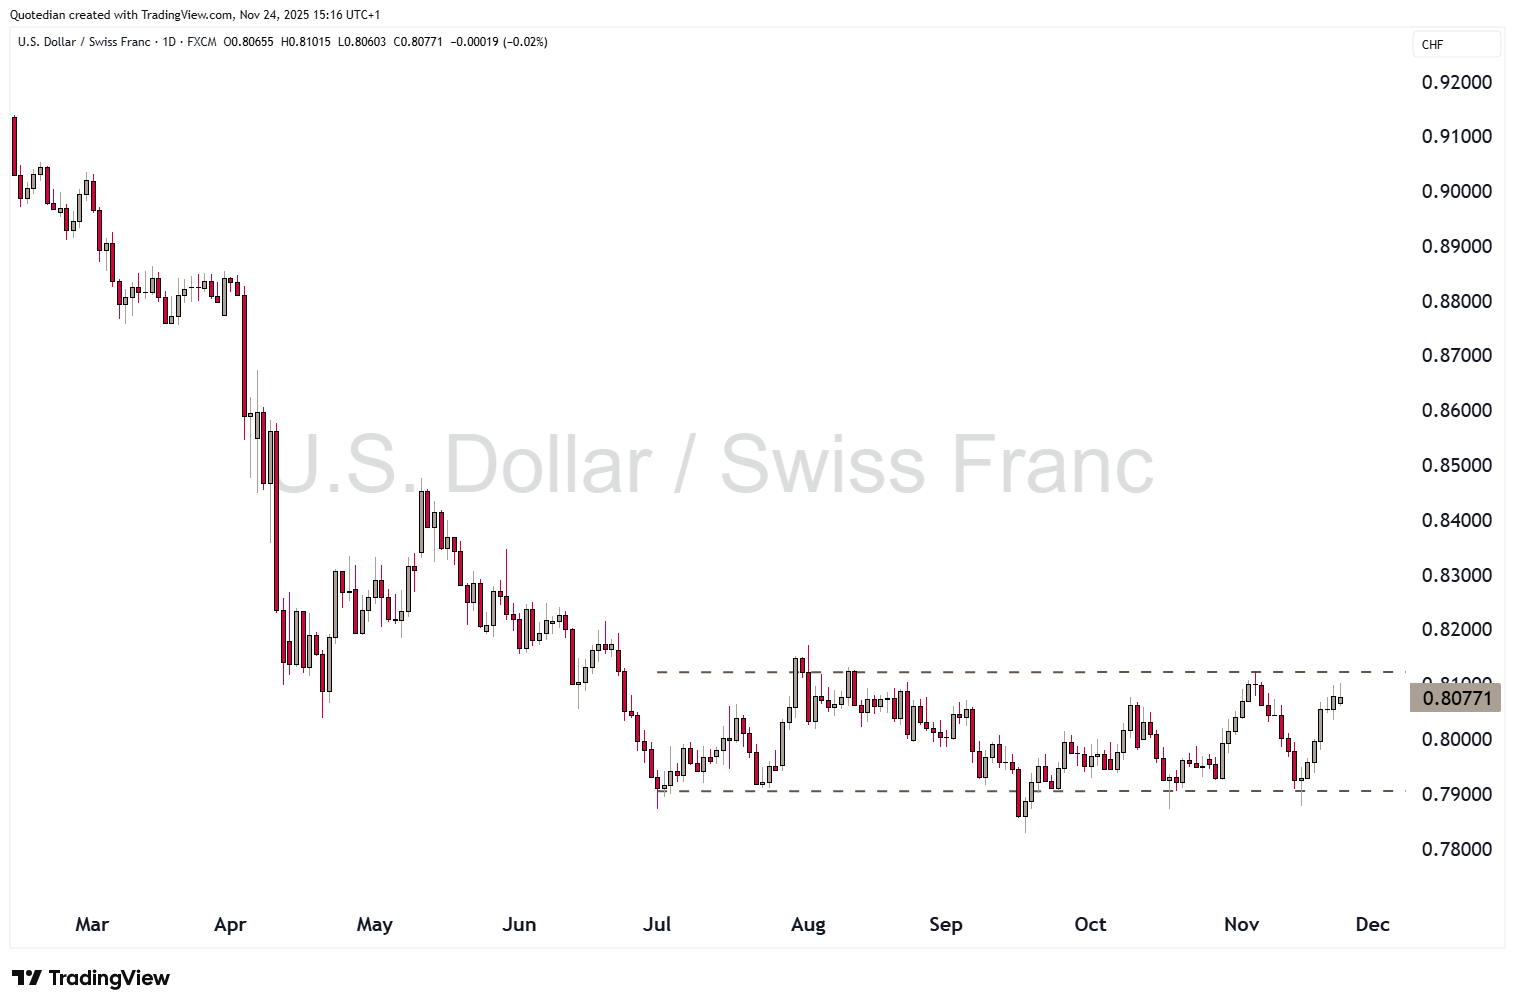
As is Dollar/Swissy:
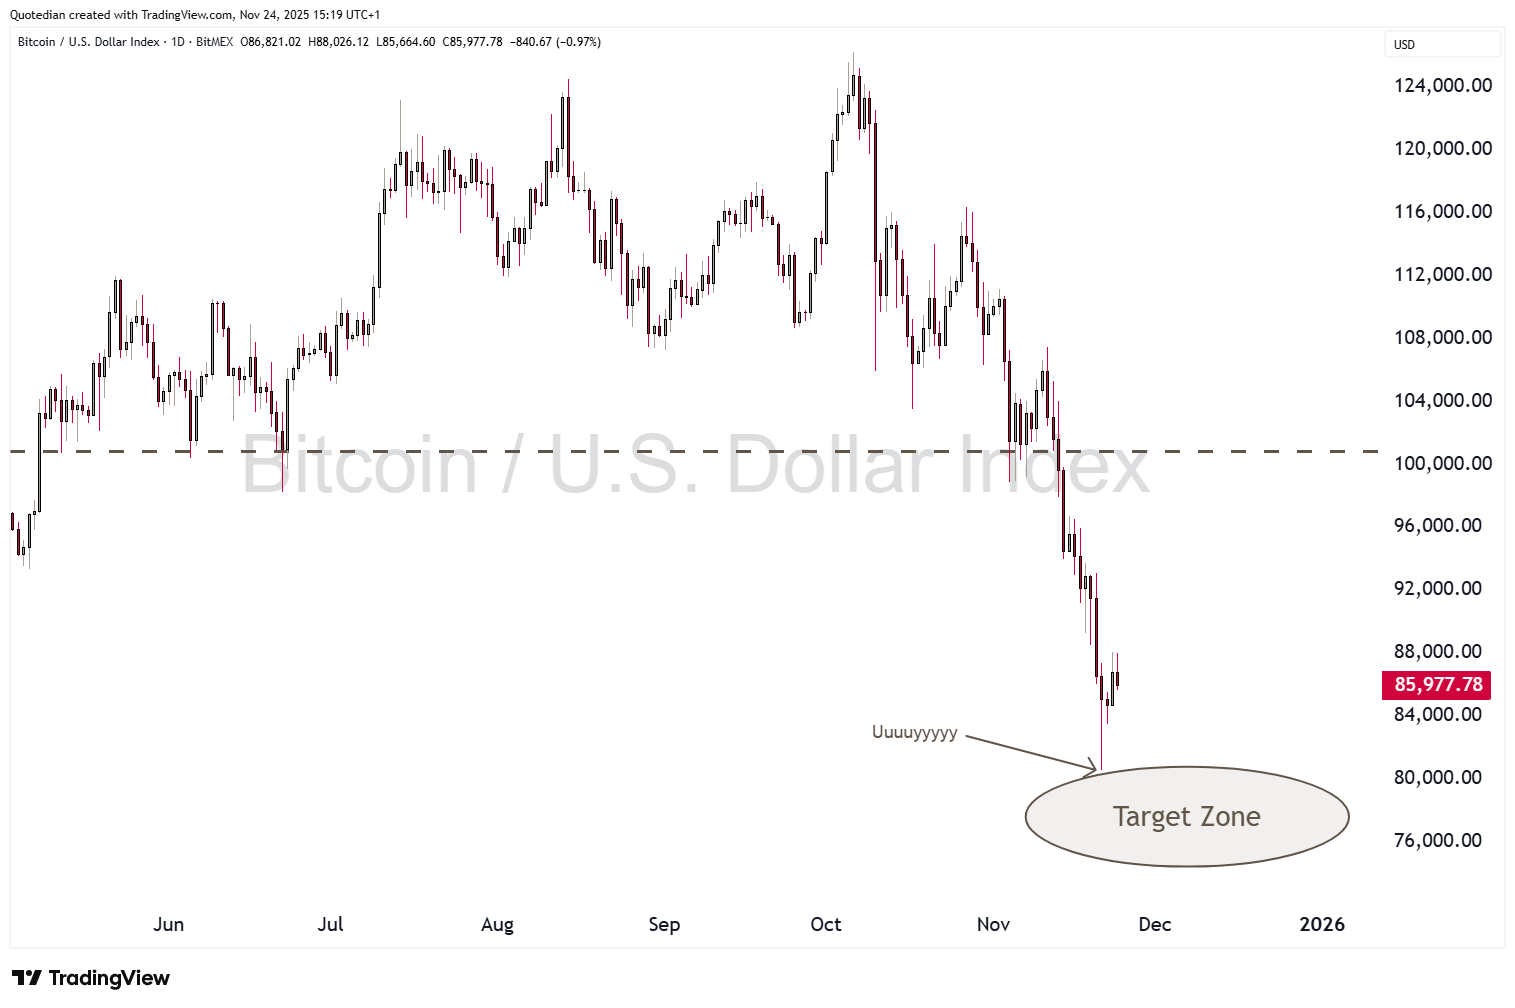
But talk of the town continue to be cryptocurrencies, with Bitcoin missing our target zone by …. nada:

This will have to be all for this week - have a great week!
André

In reality, you need no other Disclaimer than the one above, but just in case:
Everything in this document is for educational purposes only (FEPO)
Nothing in this document should be considered investment advice
Investing real money can be costly; don’t do stupid shit
Leave politics at the door—markets don’t care.
Past performance is hopefully no indication of future performance
The views expressed in this document may differ from the views published by Neue Private Bank AG
Thank you André :) have a great week !