

Blue Monday
Vol VIII, Issue 3 | Powered by NPB Neue Privat Bank AG

"A pessimist sees the difficulty in every opportunity; an optimist sees the opportunity in every difficulty."
– Winston Churchill
Enjoying The Quotedian but not yet signed up for The QuiCQ? What are you waiting for?!!

Apparently, the third Monday of January is the saddest day of the year.
They call it Blue Monday.

What better to fight that sadness than with a batch of fantastically looking charts to brighten our day?!

Let’s dive right in then!

Stocks had a good week, with the S&P closing up one percent on Friday to bring the weekly advance to nearly three percent:

In what is a beautiful picture for us data visualization freaks, the index rebounded precisely from the level where the post-election gap had opened. The odds for a continuation of the 27-month equity market rally have increased sharply this week.
Not least because the S&P 500 equal-weight index increased even more (~4%), indicating a broadening of the rally, which can be well visualized via the weekly heat map:

Hence, in best “yes but, no but, yes but… “ Little Britain fashion, what are the chances for a continued equity rally?
According to the “third year” bull market theory, we may be in for a difficult sideways consolidating market (aka “no but”):

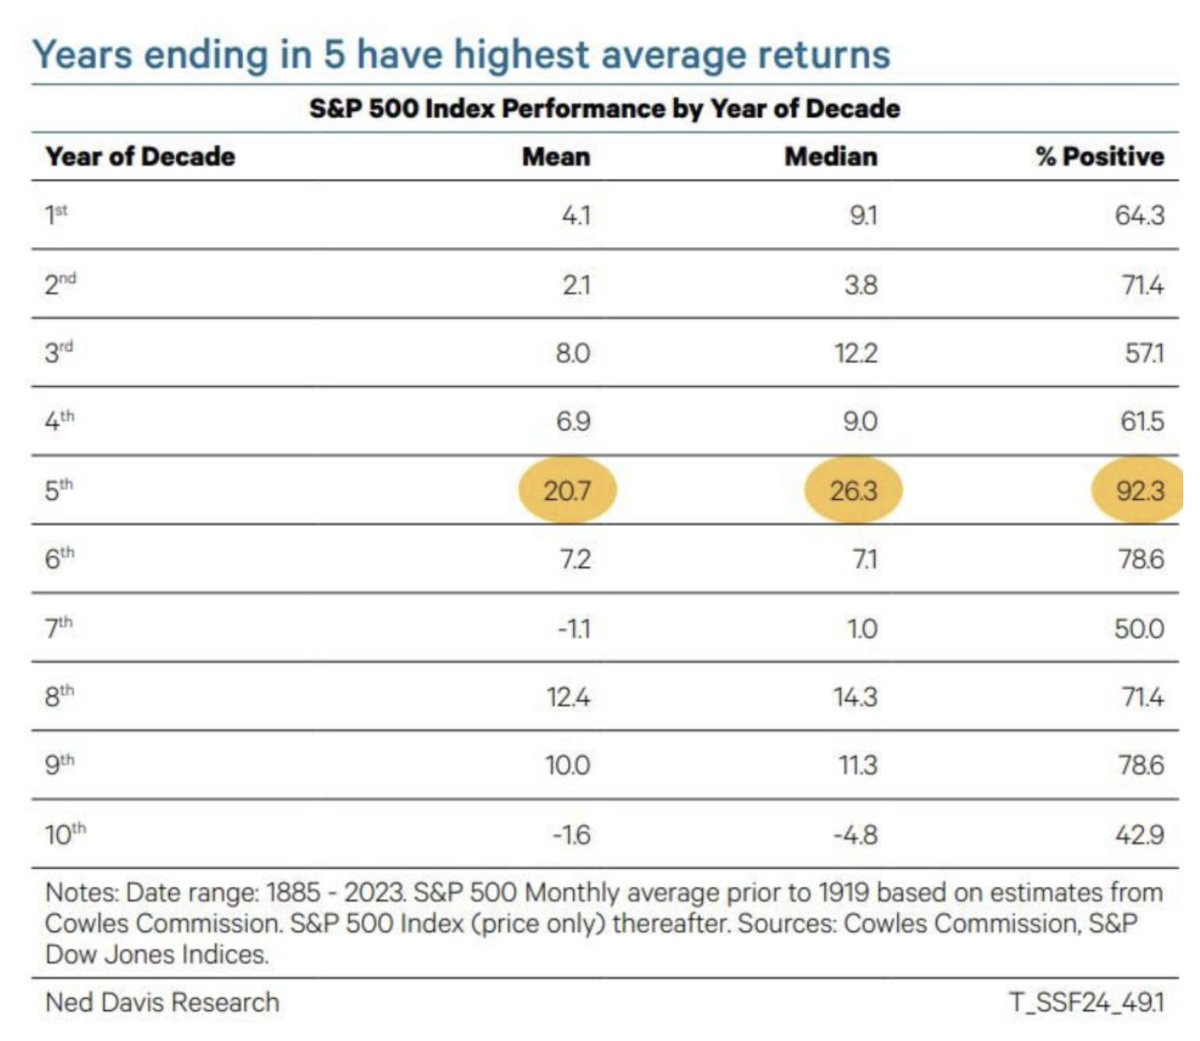
But then, years ending in 5 tend to be the best (aka “yes but”):
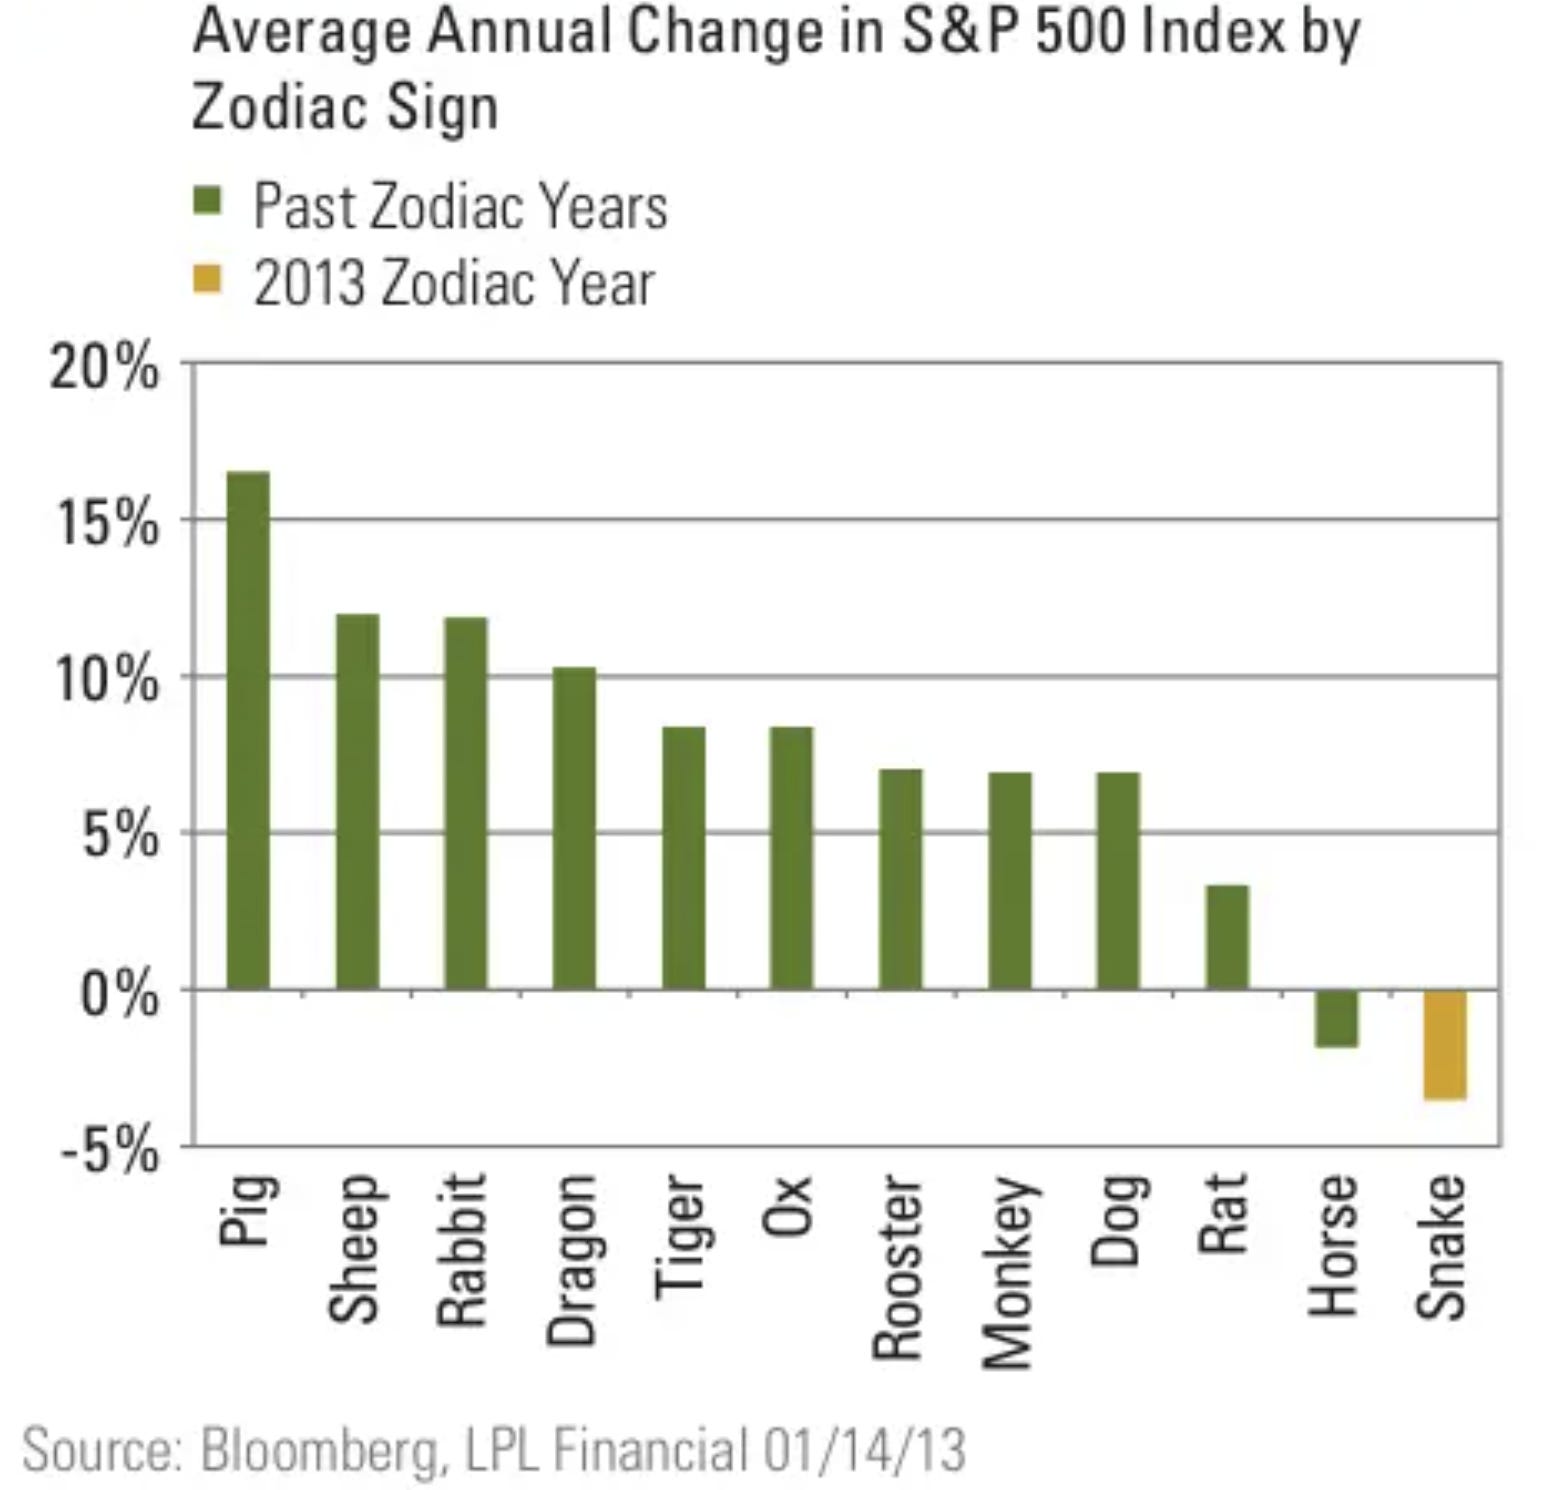
And just as we were taking our “Dow 100,000” caps, we note that the “year of the snake” tends to provide very mediocre returns (aka “no but”):
Well, as we said:

Talking sectors for a moment, as we see from above Health Care nor other defensive sectors such as Consumer Staples, were not the best place to be:

However, last year’s worst-performing sector, Energy, is having a moment of rejuvenation, and financials were flying on the back of excellent earnings reports from large US banks.
On we go …
Let’s continue to Europe, where probably to the surprise to all of us, just as the outlook could not get any darker, we are seeing a massive lift-off.

First, consider the overall European market:

Two or three runaway gaps as just witnessed are NOT bearish.
Let’s look at some of the contributors as individual markets. E.g., here is Germany’s DAX:

Not bearish.
Here France’s castigated CAC-40:

Renaissance is the word that comes to mind …

Even Switzerland’s SMI is showing signs of life:

But now, ladies and gentlemen, please hold on to your chairs as I show you lost Britain’s FTSE-100 chart:

Why does Queen’s “The Show must go on” not leave my head?
Anyway, the right moment to turn our attention to Asia.
We downgraded the Indian equity market to “Neutral” last week due to negative price-performance as the BSE500 dropped below key support (dotted line):

A likely recovery back above that dotted line, given the positive price development in developed markets, would improve the outlook substantially, though a full recovery above the 200-day moving average (MA) would be necessary for a renewed upgrade.
The Japanese equity market needs to react NOW to the upside to keep our double-bullish rating alive:
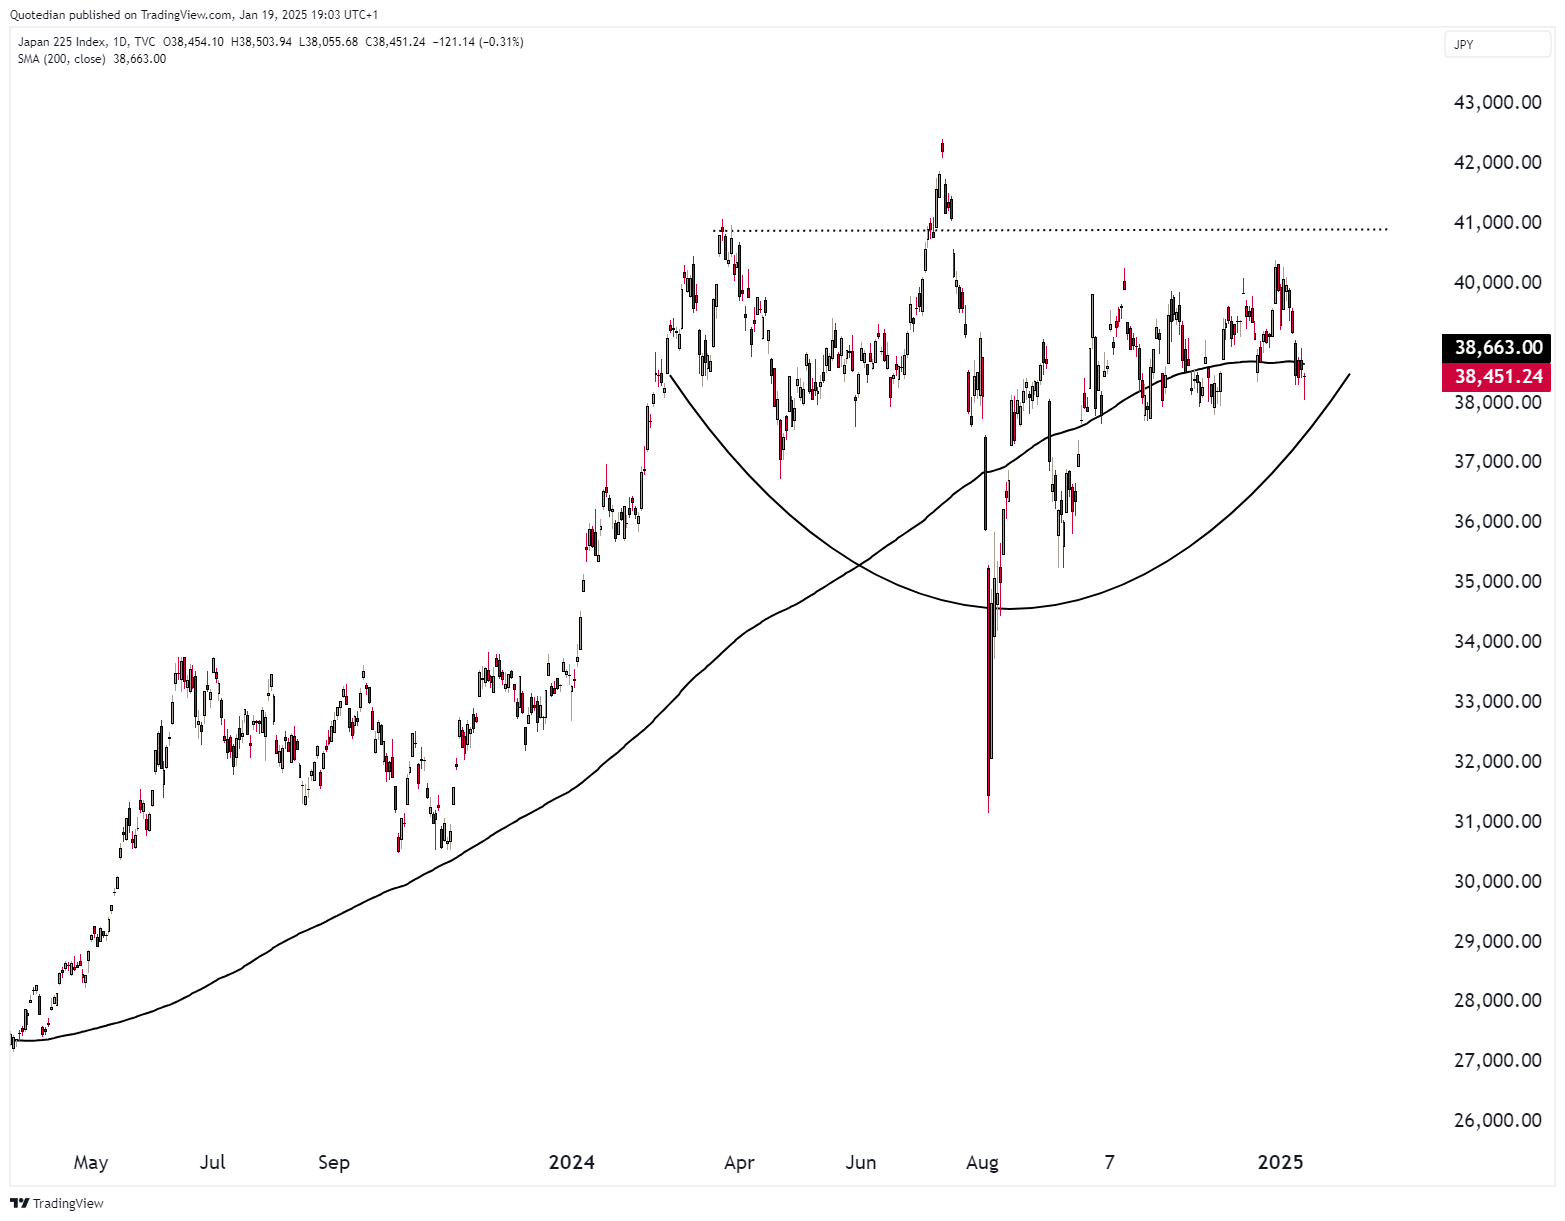
Failure to do so will lead rapidly to a downgrade or two.
To finish the equity section, you know how “pesado” I have been insisting to buy winners for further wins, hence, let’s check what has been going up so far this year:

Time to turn to fixed income/rates markets.
Bonds had a relief week on the back of falling yields after a not-as-bad-as-expected CPI number and some über-dovish talk by Fed governer Waller, who seems to be aspiring for the chairman’s job.
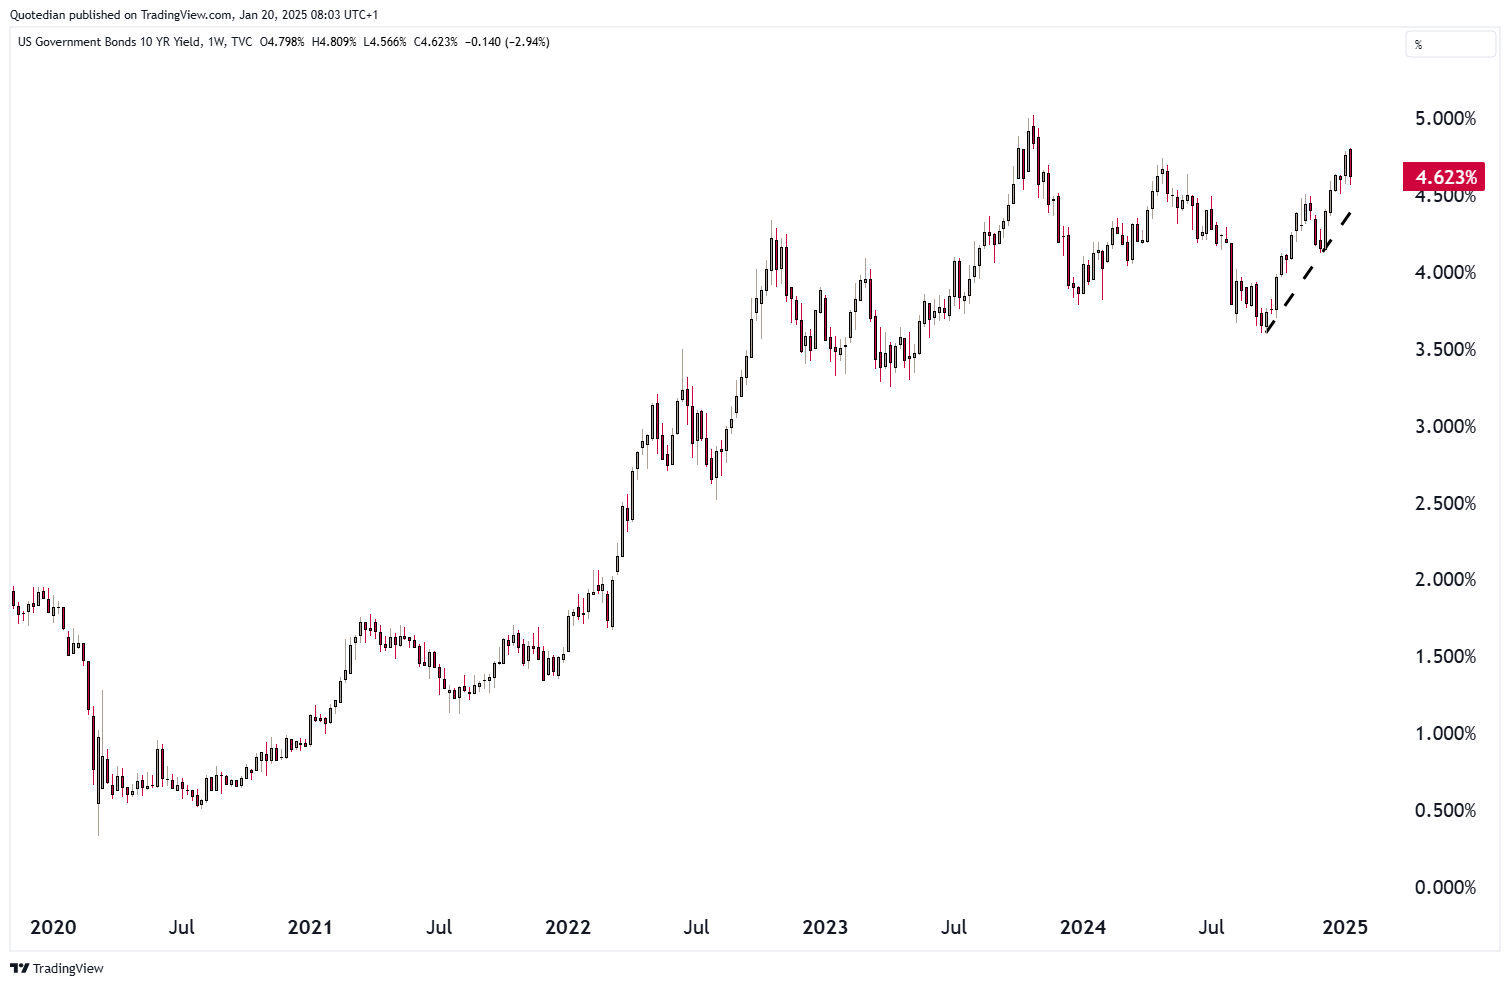
The US 10-year Treasury yield has come down nearly 20 basis points since last Monday’s high, but remains in a uptrend pattern for now:

Here’s the weekly version of the same chart:
A 20 bp drop in yields meant a nearly 3% rally in bond prices as proxied by the popular iShares 20+ Year Treasury Bond ETF (TLT), but the move feels very muted so far:
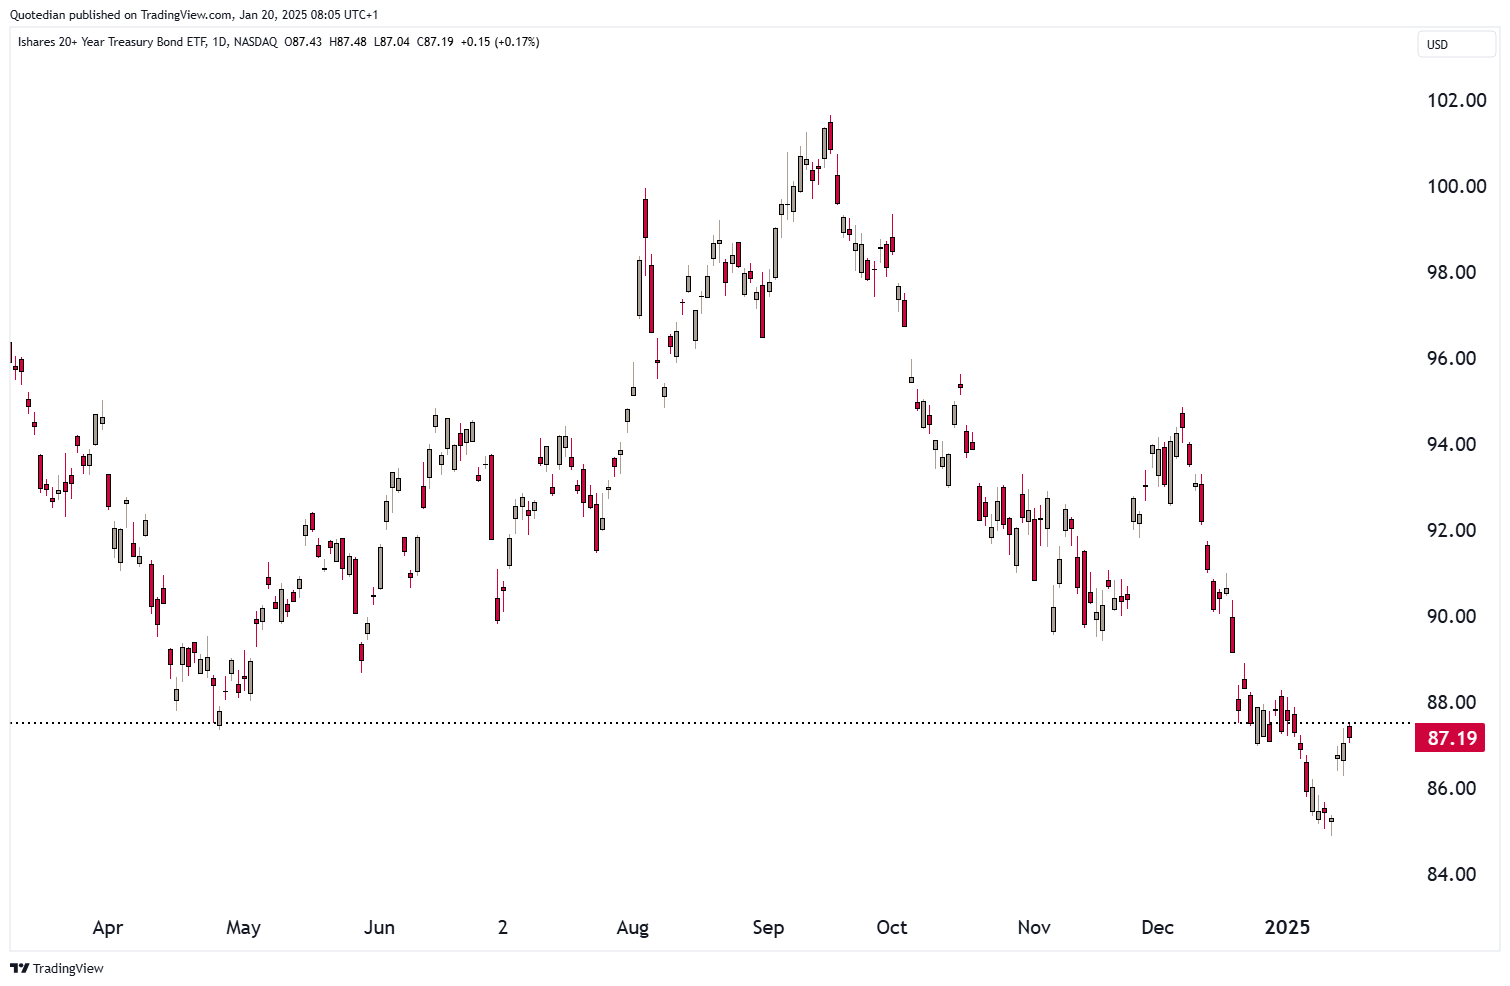
The recent rise in yields following the initiation of the Fed cutting cycle continues to stick out like a sore thumb:

With President Trump being sworn into office later today, many fear that coming tariff announcements will be inflationary. But according to the following chart, those fears are not justified, as the bond market has nearly always risen on the back of such announcements:

A degree of “sell the rumour, buy the fact” perhaps?
German yields, as proxy for the Eurozone, have come down 15 basis points too last week:

And the Swiss 10-year Conf yield, paying nearly half a percent only a week ago, has also come down again:

To finish of the rates section, let’s have a look at the British scenario, where the 30-year Gilt yield had hit a multi-decade high last week:

Not visible on the chart above, but clearly yields have come off those panic highs at nearly 5.50% to now ‘only’ 5.21&:

And the 10-year version has also come down nearly 30-basis points:

One of the worries during last week’s rise, was that at the same time the British Pound was falling. Usually, strongly rising yields and a simultaneously dropping currencies, happens a few months before the IMF comes in to bail out a country …
Let’s use this as a segue into the currency section!

So, how has the Pound (GBP) performed then last week? Any recovery insight? Here’s the GBP chart versus the US Dollar:

Nope, no real improvement. The currency tried to rally in the early parts of the week, but then got sold off again on Friday. Against other currencies, it looks even worse:

Versus the Euro the GBP chart looks really bearish. Having broken the uptrend line (dashed) already two weeks ago and moving below the 200-day moving average last week, key support at 1.1830 (dotted) is now at danger of giving away:

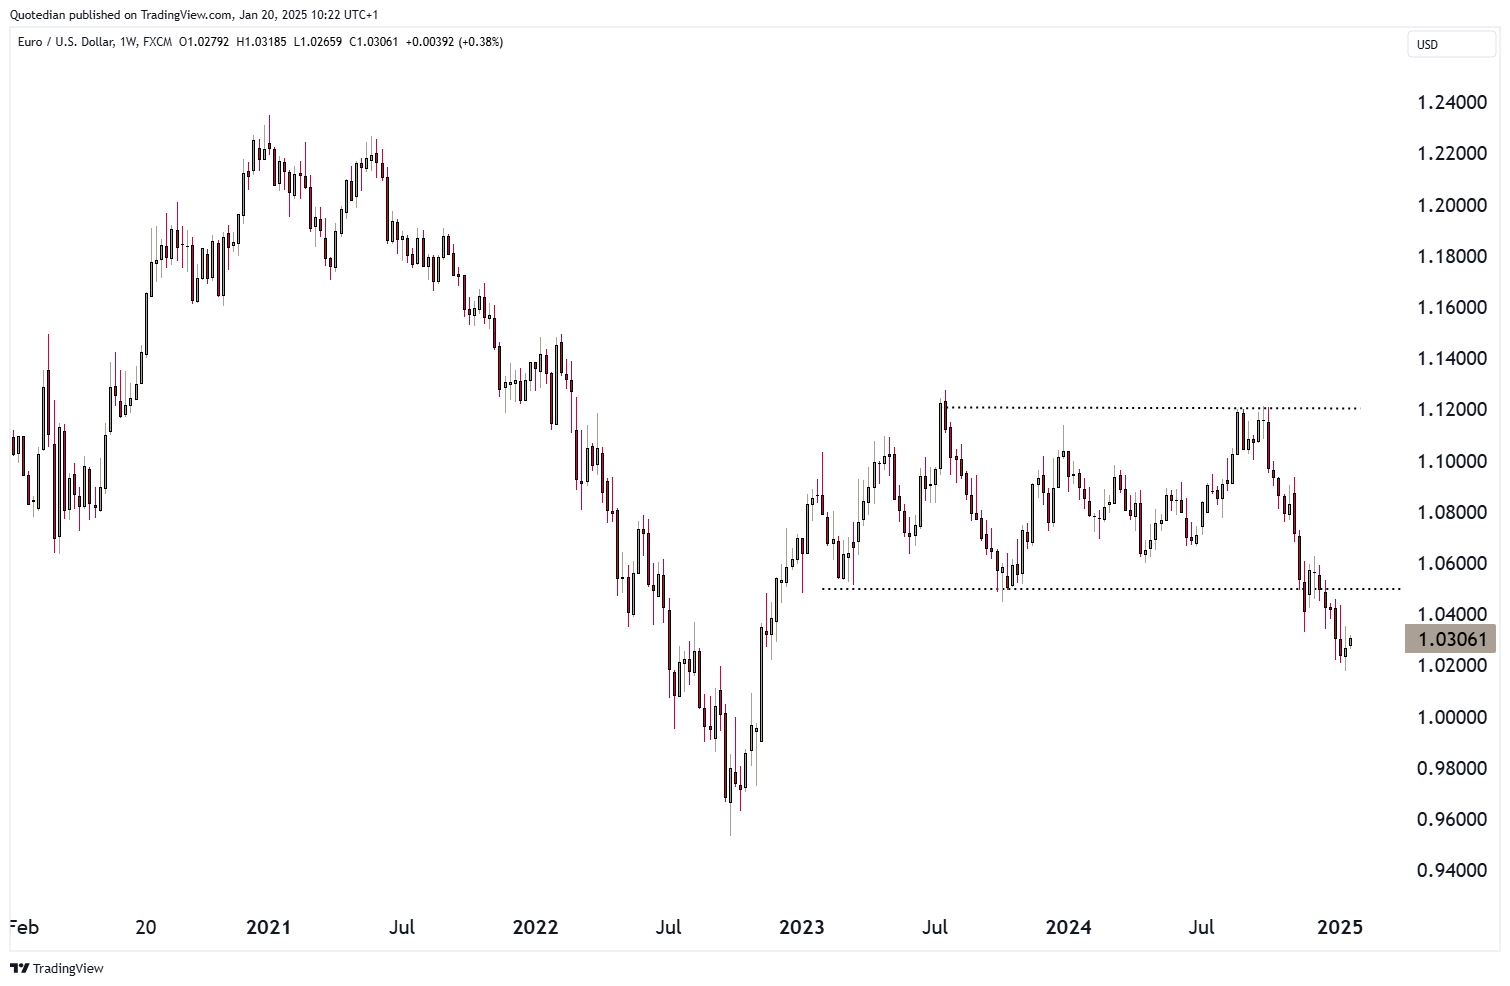
Talking of the glittering wonder that is the Euro, versus the Greenback, the chart ‘smells’ more like a pause in the downtrend then an imminent reversal:

That ‘smell’ does not change when looking at the weekly chart of the same:
The USD/CHF has reversed lower from key resistance (dotted line):

For now …
But, of course will most eyes have been (and will be) on cryptocurrencies over past few days (next few days), as Mr Trump and his supposedly crypto-friendly administration is being sworn in today. Bitcoin has gotten out of bed early today to celebrate:

However, maybe Bitcoin investors are ignoring the unexpected (to me at least unexpected) twist of Mr Trump launching his own cryptocurrency last Friday. Of course, the ticker could be no other than $TRUMP:
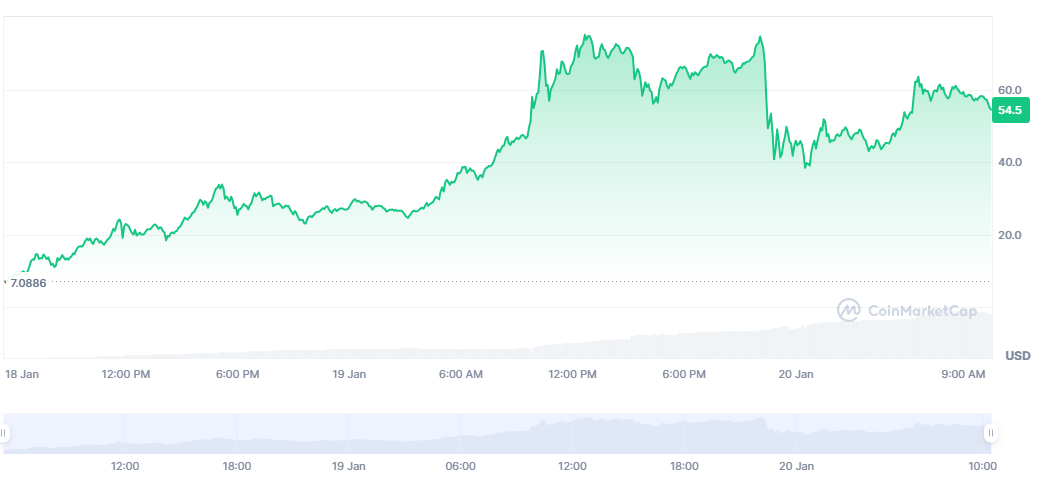
All went well at the cryptocurrency launch, with the market cap of $TRUMP quickly rising from a few hundred million US Dollars to $15 Billion by Sunday afternoon:

But in yet another twist to the plot, and as Aristophanes warned us in his Lysistrate comedy …
“This is why we women are always better than you men: you are content to bluster like fools, while we think and act with wisdom."
… Mrs Trump launched here very own cryptocurrency on Sunday, aptly called $MELANIA:

It immediately nagged about USD2 billion of market cap away from her husband’s coin…
Please unmelt me from my self-imposed exile in Siberia once this madness ends.


As we can deduct from the sector performance shown in the equity section above, energy-related commodities must have had a decent run recently. Let’s check by having a look at crude oil (WTI) first:

Indeed is the black, sticky, stinky stuff up 15% since early December, despite the “Drill Baby, Drill” promise, a ceasefire in Israel/Gaza and the war in Ukraine being over tomorrow …
Some other forces must be at play then …
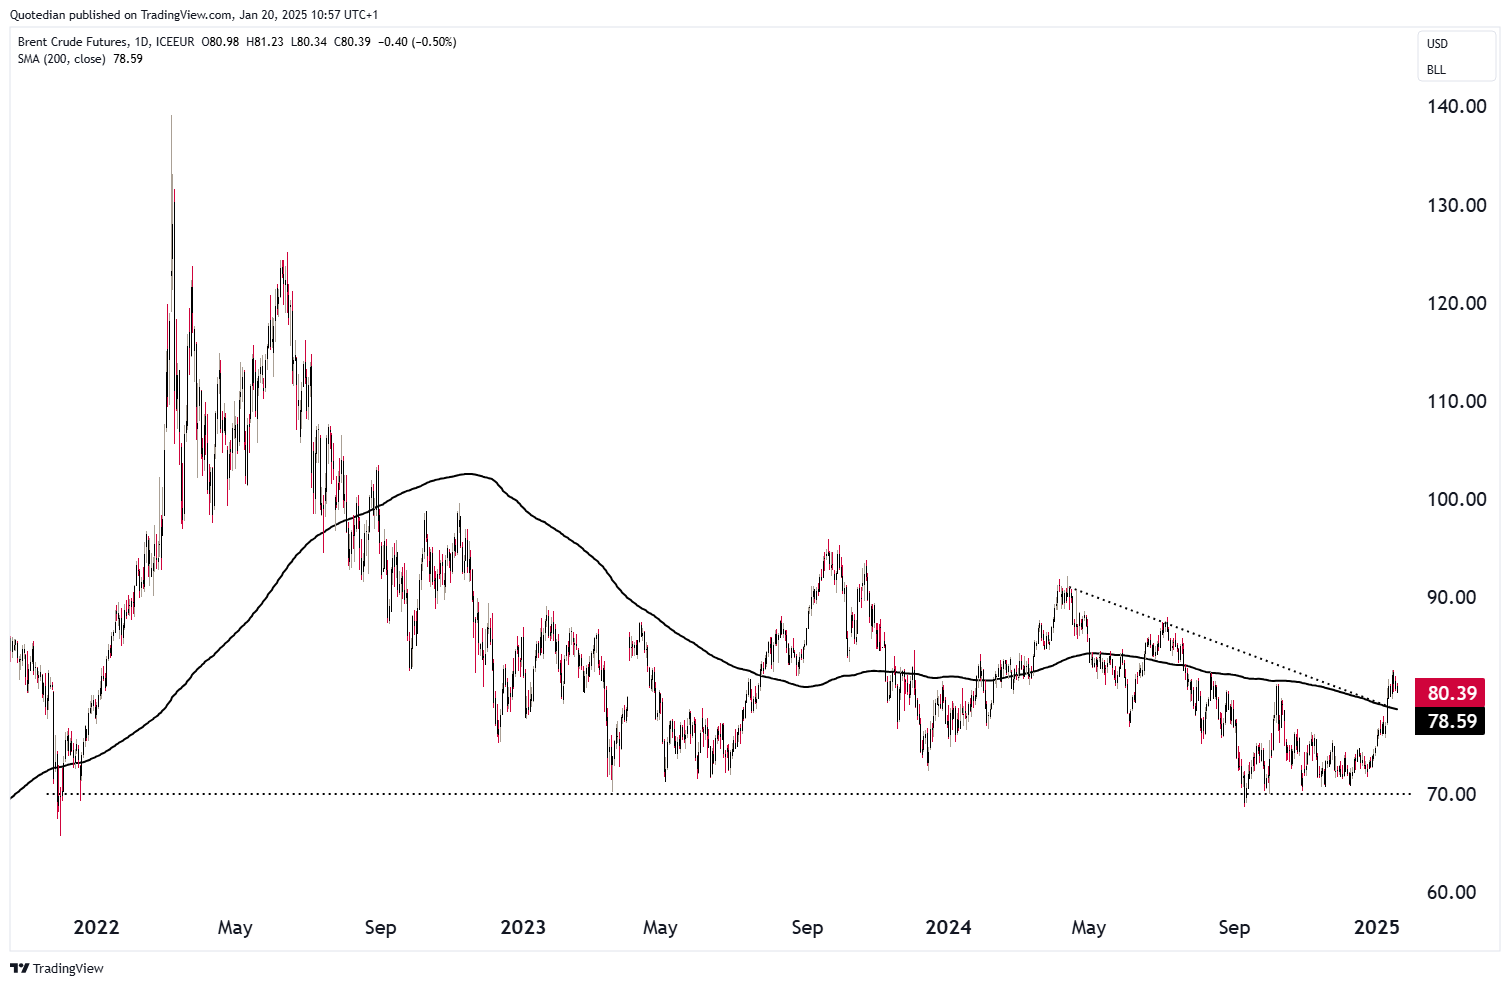
The longer-term chart (Brent below) suddenly looks a lot more constructive again:
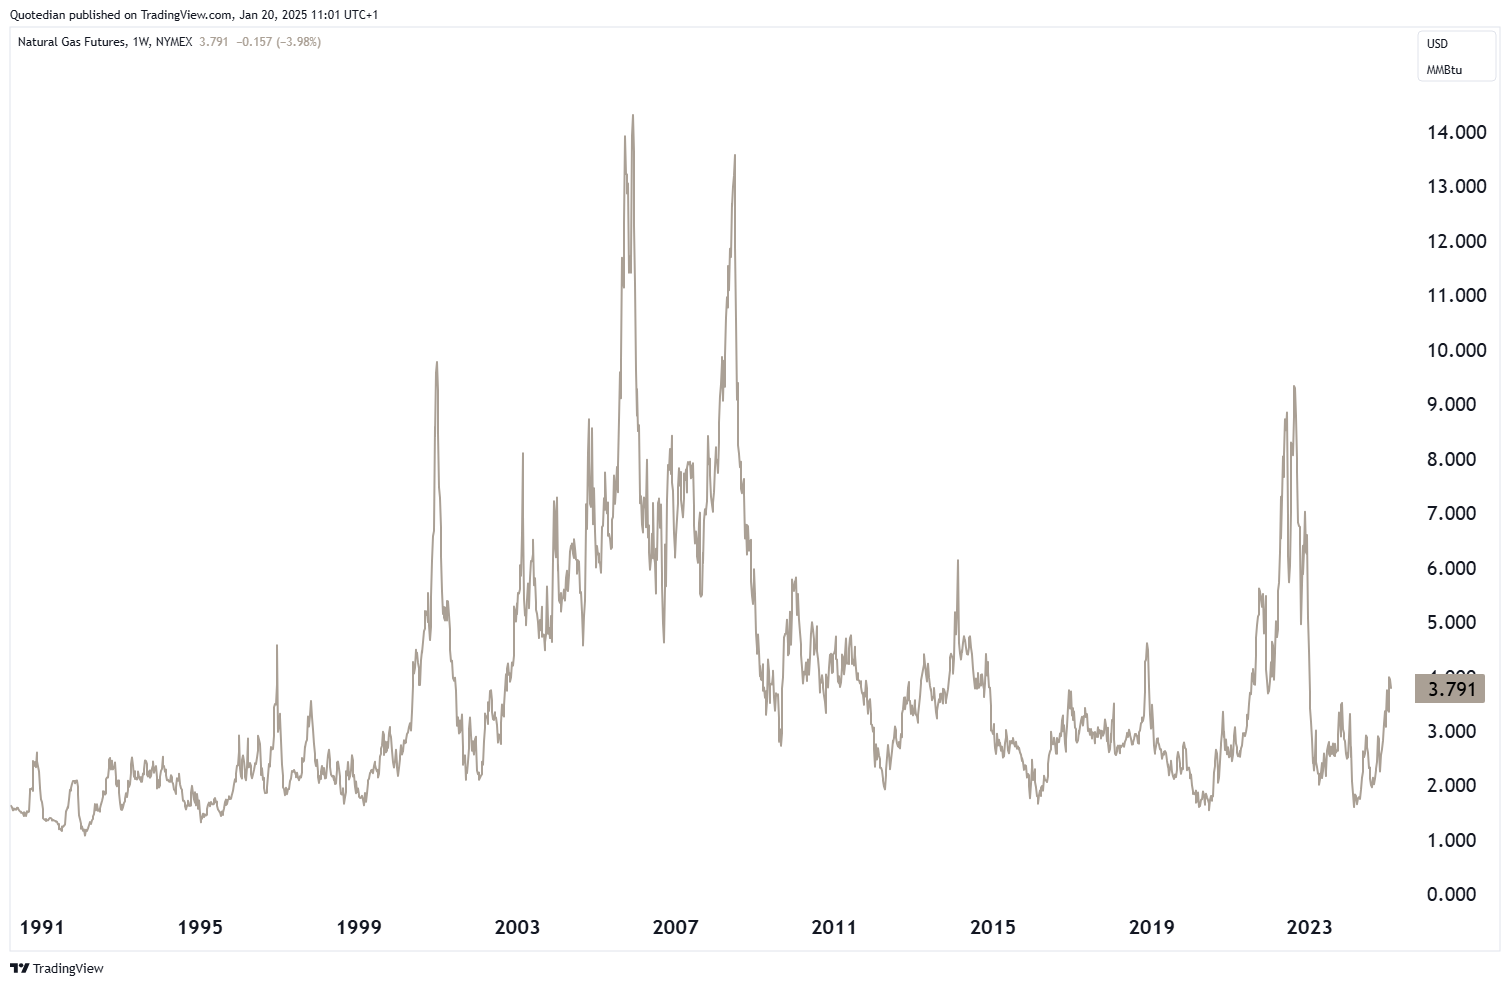
One of my favourite commodities, Natural Gas, which I have been highlighting for a few months now, is up more than 150% in a year:

Zooming out on the same chart, our fantasy for a further price spike increases:
A move above $2,720 would confirm that Gold’s next upleg is underway:

Copper (red) has been trading in function of bond yields (grey):

That’s all for this week, but make sure to sign up to our daily letter (Tuesday through Friday) here: www.quicq.ch
André

Everything in this document is for educational purposes only (FEPO)
Nothing in this document should be considered investment advice
Investing real money can be costly; don’t do stupid shit
The views expressed in this document may differ from the views published by Neue Private Bank AG
Past performance is hopefully no indication of future performance