

Breaking Bad
The Quotedian - Vol VI, Issue 75 | Powered by NPB Neue Privat Bank AG


“There’s the easy way, and then there’s the right way.”
— Walter White


Apologies for the radio silence this week, but between the month-end issue on Monday and our 2-day long quarterly investment committee at the bank, it got a bit to tight to gobble anything of value together.
But I am sure the wait was worthwhile because a) we have a lot of interesting “stuff” to discuss in today’s issue and b) you will receive NPB’s Quarterly Investment Outlook by Monday.
It’s all peace, joy and pancakes!
Looking for tasty pancakes? Check this recipe!
Looking for sound investment advice? Contact NPB!

Contact us at ahuwiler@npb-bank.ch
This week saw some of the key levels we have been observing breaking bad(ly), so instead of focusing on yesterday’s session, which was comparatively dull, let’s do a round of damage check … off we go!

To be sure, the entire macro spectrum including many asset classes got moving because of a big, rapid up move in bond yields, mostly likely with the bond vigilantes coming back on the plain. Nevertheless, we adhere to our usual routine and start with equities.
The S&P 500, since breaking the neckline (dashed line) of the shoulder-head-shoulder (black arcs) we had been observing for a few weeks now, is following the textbook definition of this pattern, including a retest of the neckline (circle), aka kiss of death:

The ‘official’ price target of the pattern is at 4,075 (-4.5% from current), however, the 200-day moving average could also already end the down move or at least halt it for a few sessions.
The Nasdaq, exhibiting a similar, though less clean shoulder-head-shoulder pattern has yet to break to neckline and hence looks more constructive:

Intuitively that doesn’t make sense given the up move in interest rates and the long-duration nature of this index, but hey, who am I to judge …
One segment of the (US) market that is breaking really bad is small cap stocks. Consider the Russell 2000/S&P 500 (IWM/SPY) relative chart, which just broke below its 2020 pandemic panic lows:
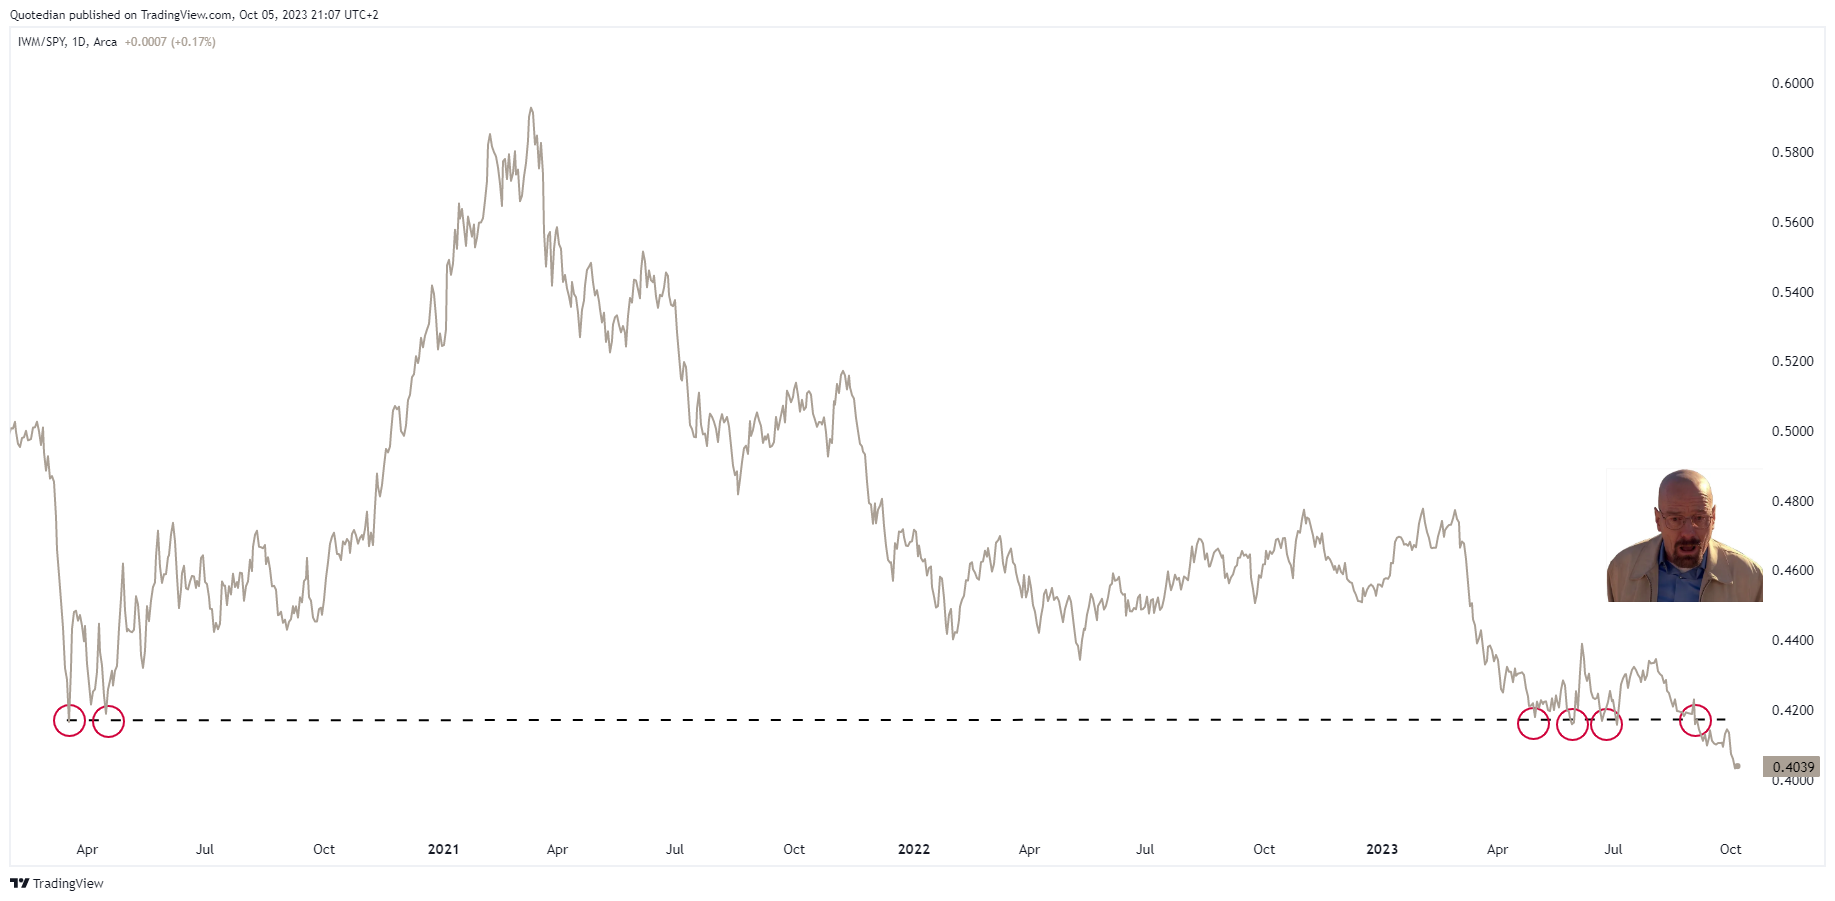
This, in general, is not a good sign for the overall economy and maybe the canary in the coal mine regarding what is about to happen in credit markets. This makes sense as smaller companies tend to be more sensitive to higher interest rates than the mega-caps.
Quick check then how bad things are breaking in Europe. Here’s the narrow Euro STOXX 50 index:

Trendlines 1 and 2 broken, 200-day moving average broken … whichever way we slice and dice it, not much support available until 3,980ish (-3%) and even that seems delicate.
What about the broader STOXX 600?

Not much better, really. Actually, both charts look like the classical rounding tops of stock markets slipping into cyclical bear markets … but for now, it is just the look of …
Over to Asia for a moment, where some heavy profit-taking has set in on the Japanese stock market. Here’s the Topix:
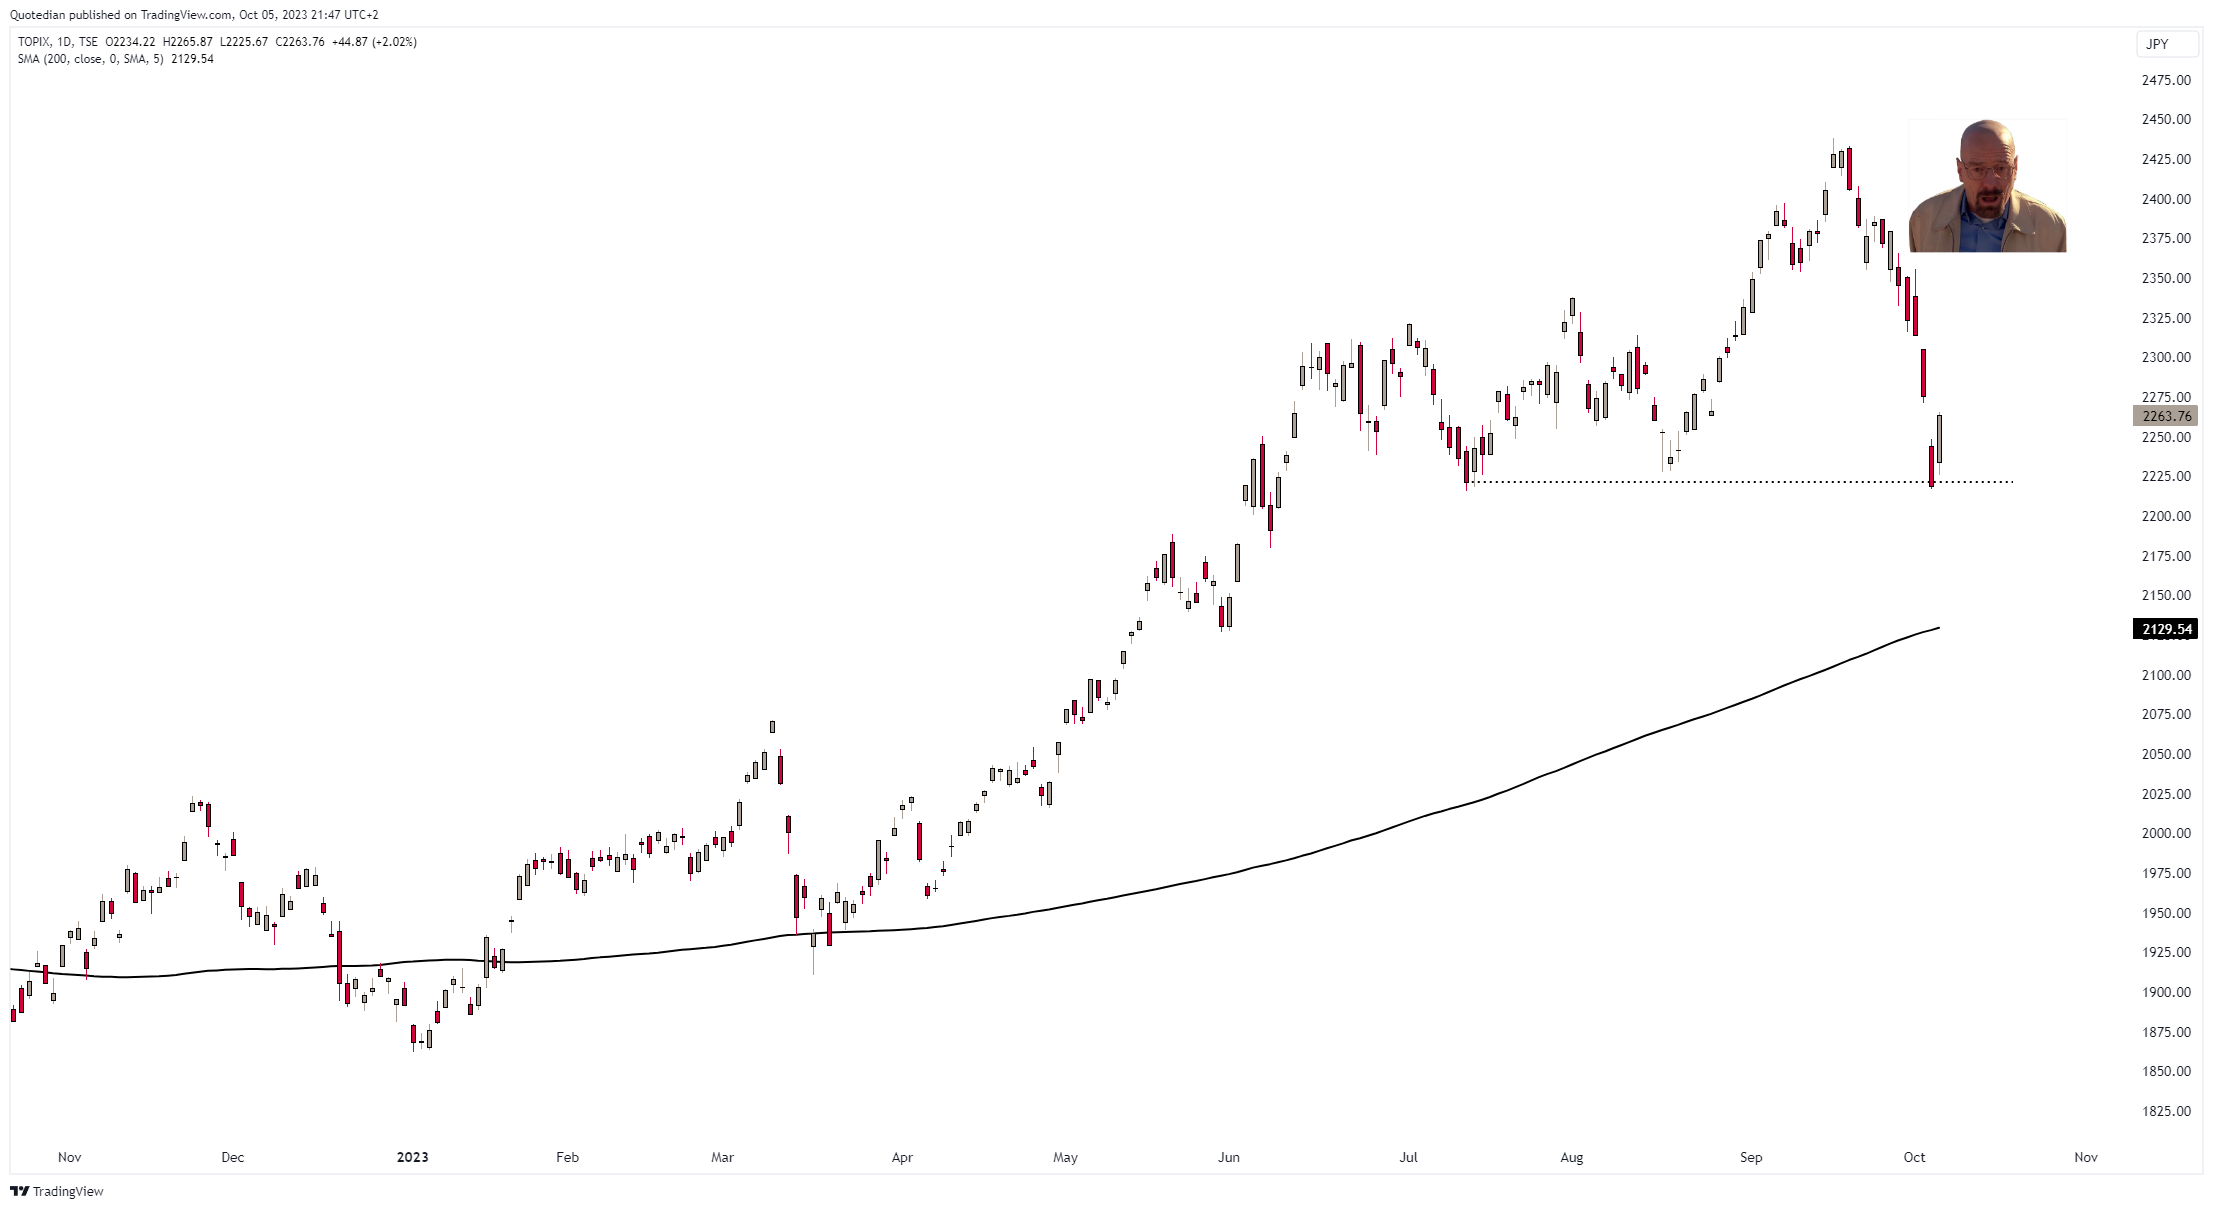
Wow, that was a quick 9% downside! Luckily, the preceding rally was really strong too and investors still hold on to a healthy 20% gain. Oh, shoot, wait! That’s in Yen, in US Dollar the same YTD return is reduced to below 6% …
But, there is some good reason to expect that current support (dotted line) could hold, and if not, the 200-day MA is not far off.
Time for some sector and individual stock charts.
Utility stocks (XLU) for example, which often trade highly correlated to bond prices, were in free fall the past two weeks and are down 30% from the 2022 highs:

Oil stocks topped out exactly where (dotted line) they ‘ought’ to and quickly dropped down to the 200-day MA, finding a temporary straw to clutch onto there yesterday:

The decline in some of the discretionary consumer ‘darling’ stocks has been quite meaningful:
LVMH for example, where did the rich go?

And the drunk?

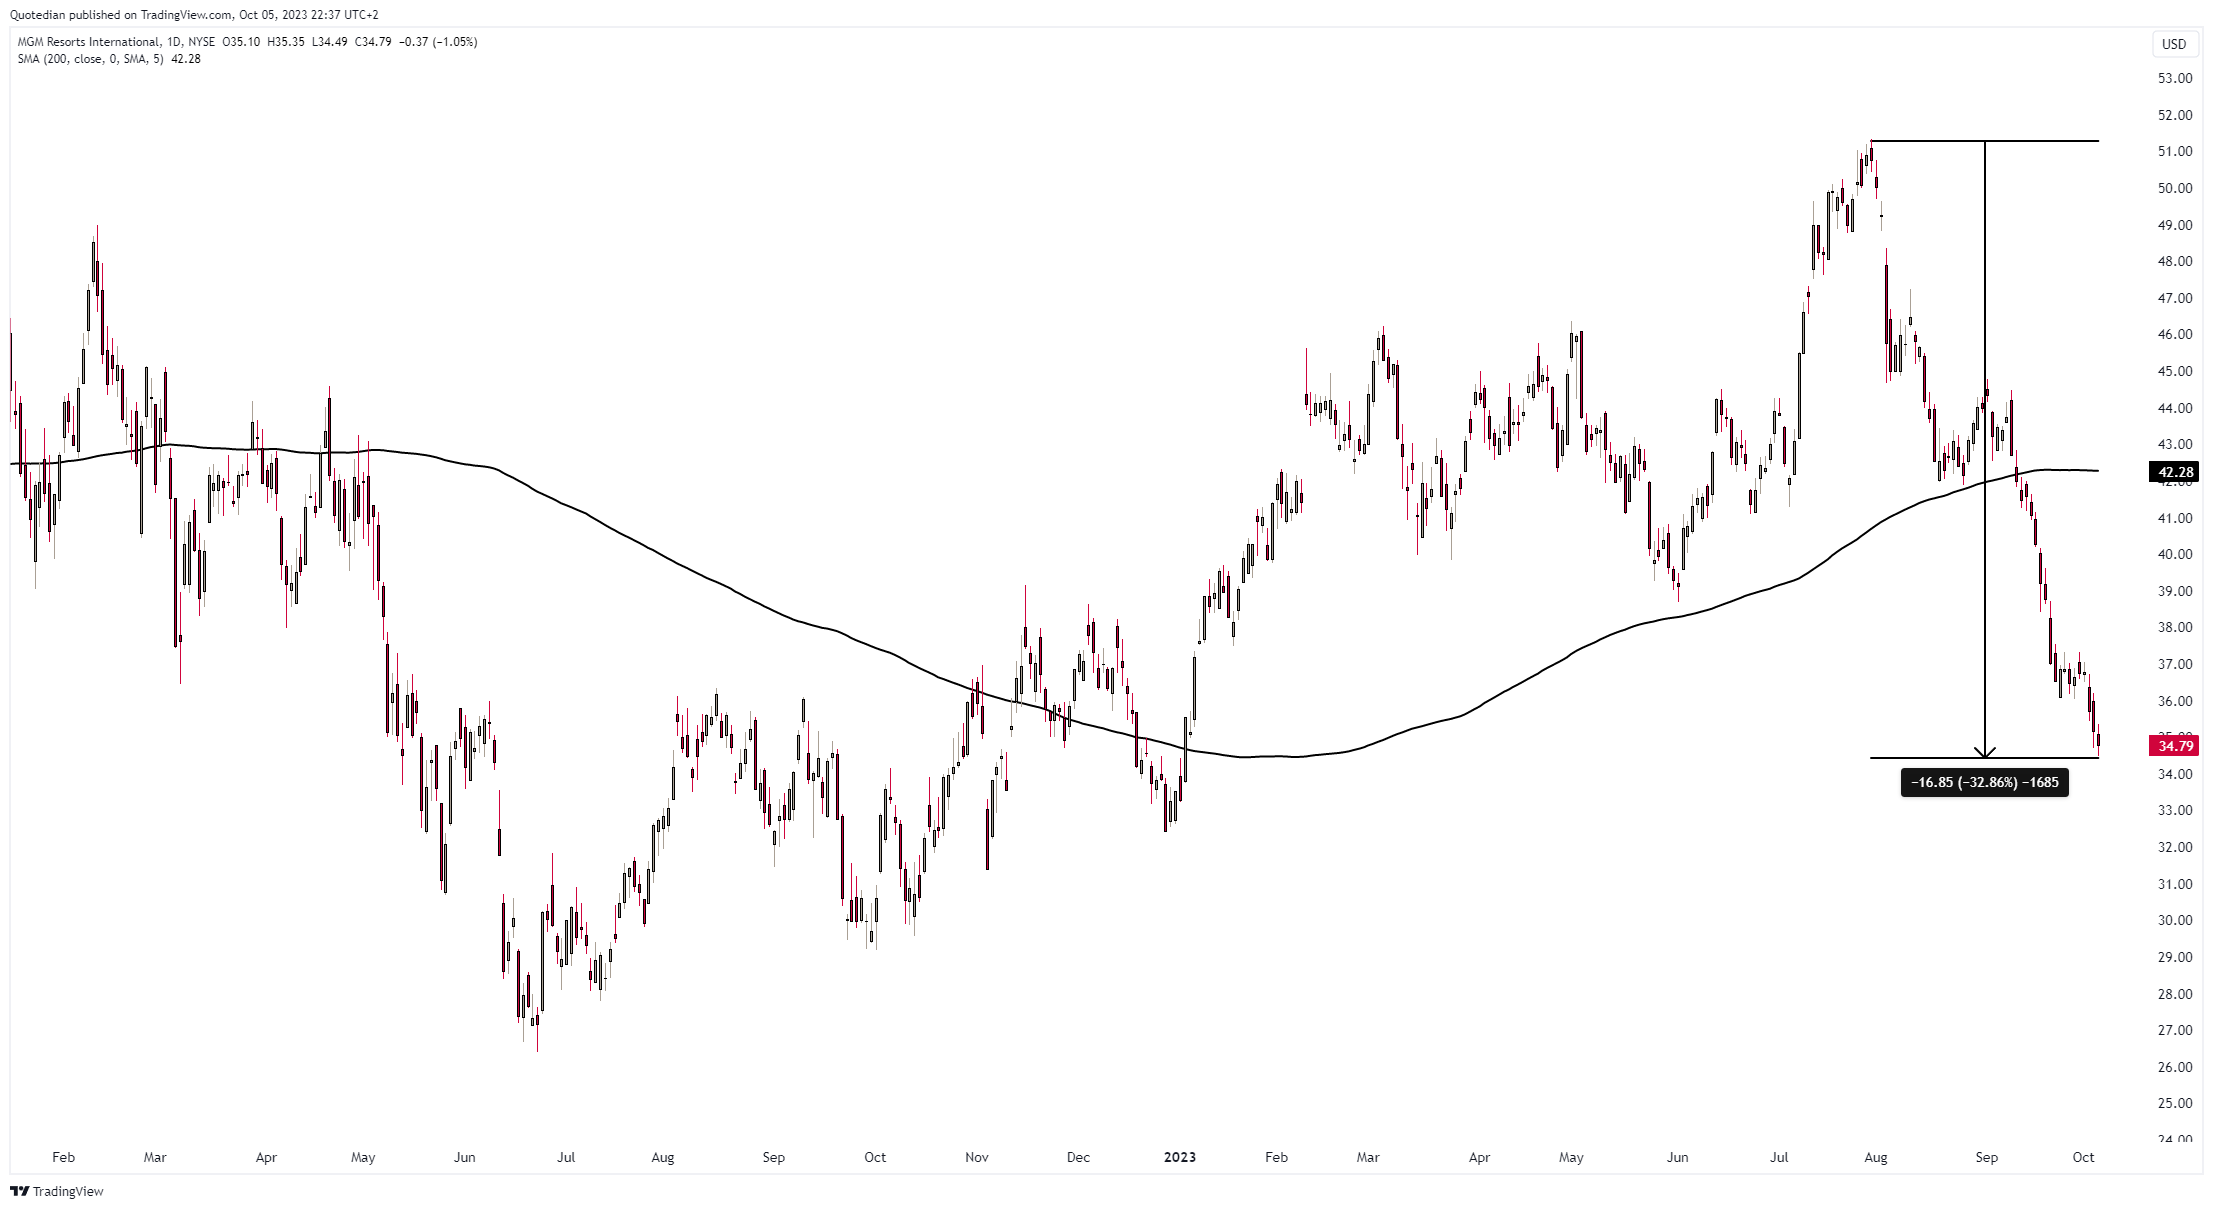
MGM Resorts - empty casinos? Empty Las Vegas?
Even ‘cheap’ places such as Dollar Tree are looking for the missing consumer:

Consumer, where are thou?!
And then there’s this:

London-listed shares of Metro Bank closed down 25% yesterday, as they struggle to raise capital, with the stock down 66% mid-September.

Ok, turning to fixed-income/rates now … please fasten your seat belts!
Versions of this chart has been making the rounds:
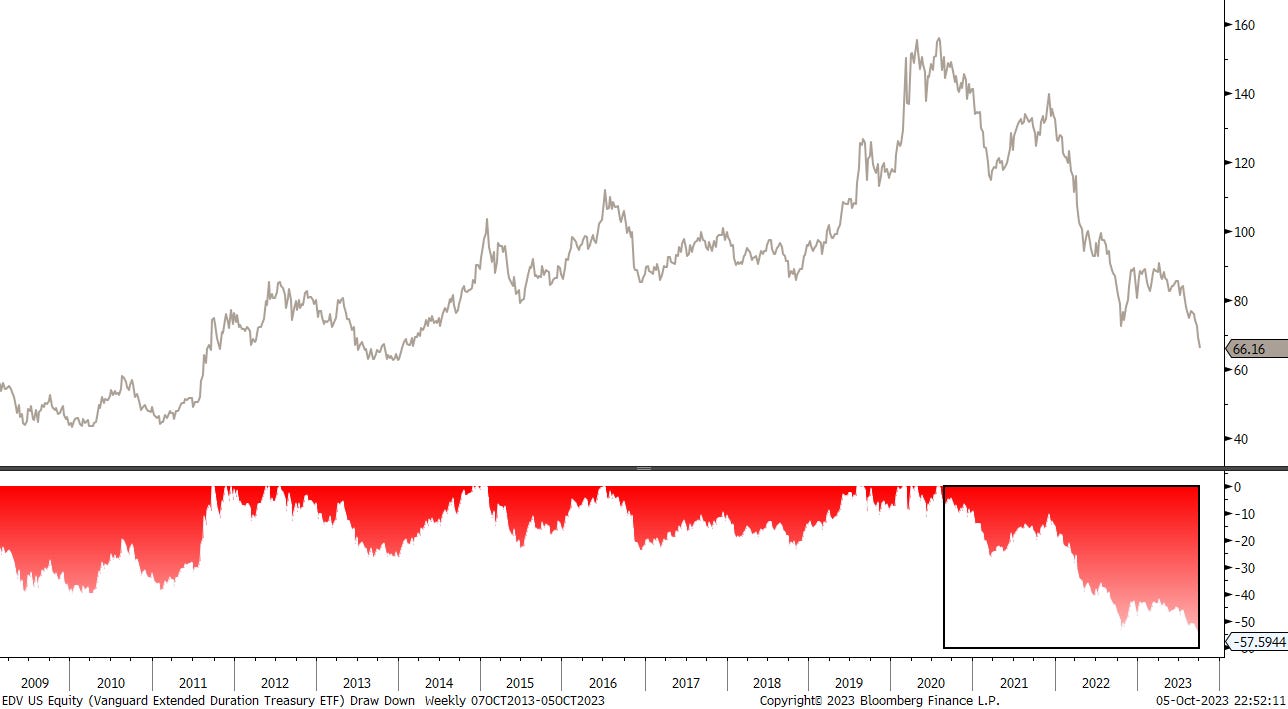
The Vanguard Extended Duration Treasury ETF (EDV) shown above has now a 57% drawdown on the weekly chart - comparable with the S&P 500 drawdown in 2008:

Yields have been skyrocketing and have started looking parabolic, in our view mainly due to a too quickly rising US debt (check out NPB’s Quarterly IC Chartbook, out on Monday):

Let’s put this in Walter White terms, using the iShares 10-20 US Treasury bond ETF (TLh), which has a duration of about 12, as proxy for bond prices:

Not much better elsewhere, with that 100-year Austrian Government bond launched in 2020, betting just about any practical joke regarding “on the long-run we are all dead”:
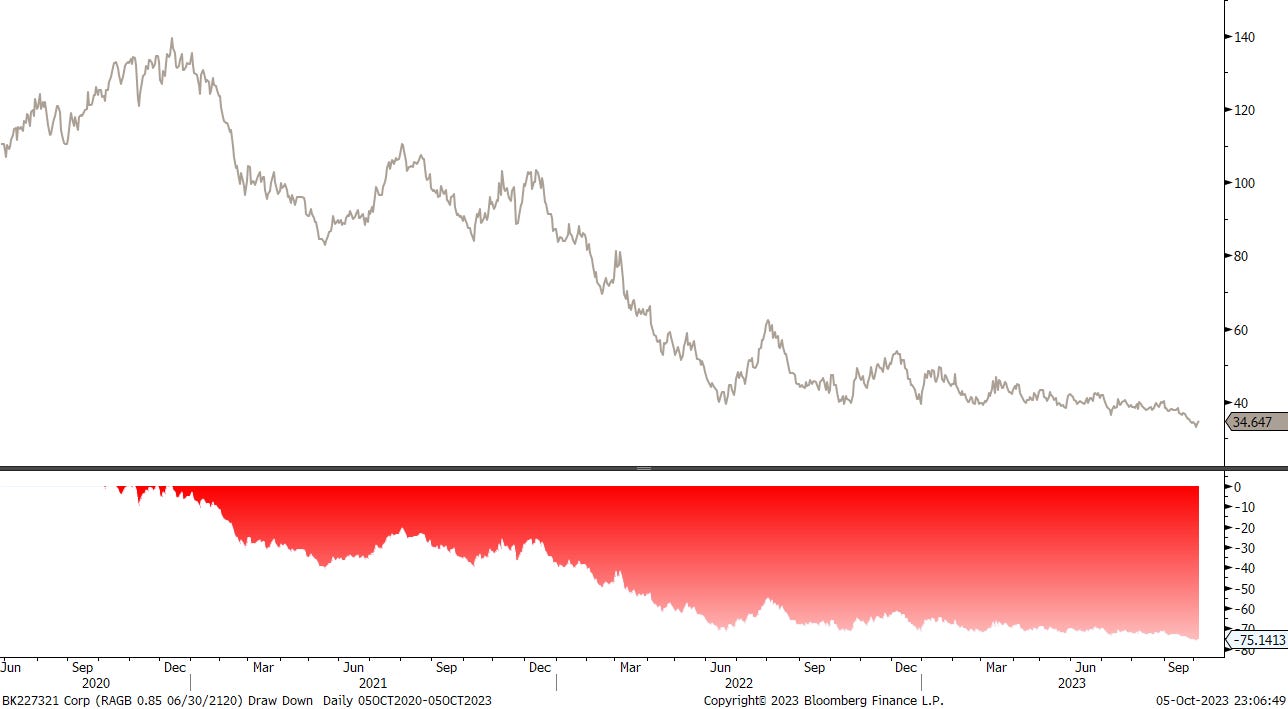
-75% and counting …
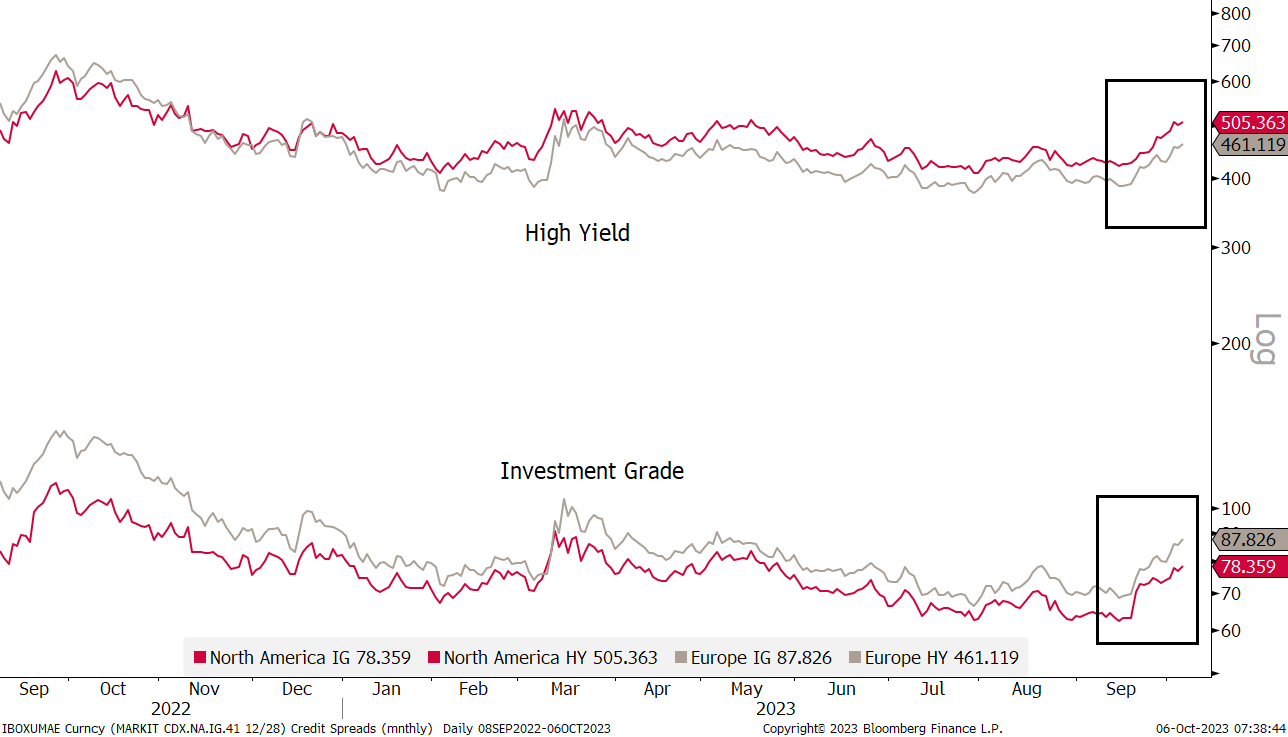
At the same time, but this is also a theme for Monday’s Quarterly update, credit spreads have started widening:

Meanwhile in currency land, the Dixy (USD Index - DXY) is in a perfectly defined uptrend:

At the danger of over-repeating myself: Trends are most persistent in the FX space.
As we laid out in the previous Quotedian, in the USD/JPY we are at intervention levels for the BoJ/MoF. Check out the candle (circled) as the currency pair hit the 150-level on Monday (the in-graph shows that move close-up):

It may be that the BoJ never intervened physically, but verbally at least something happened for sure.

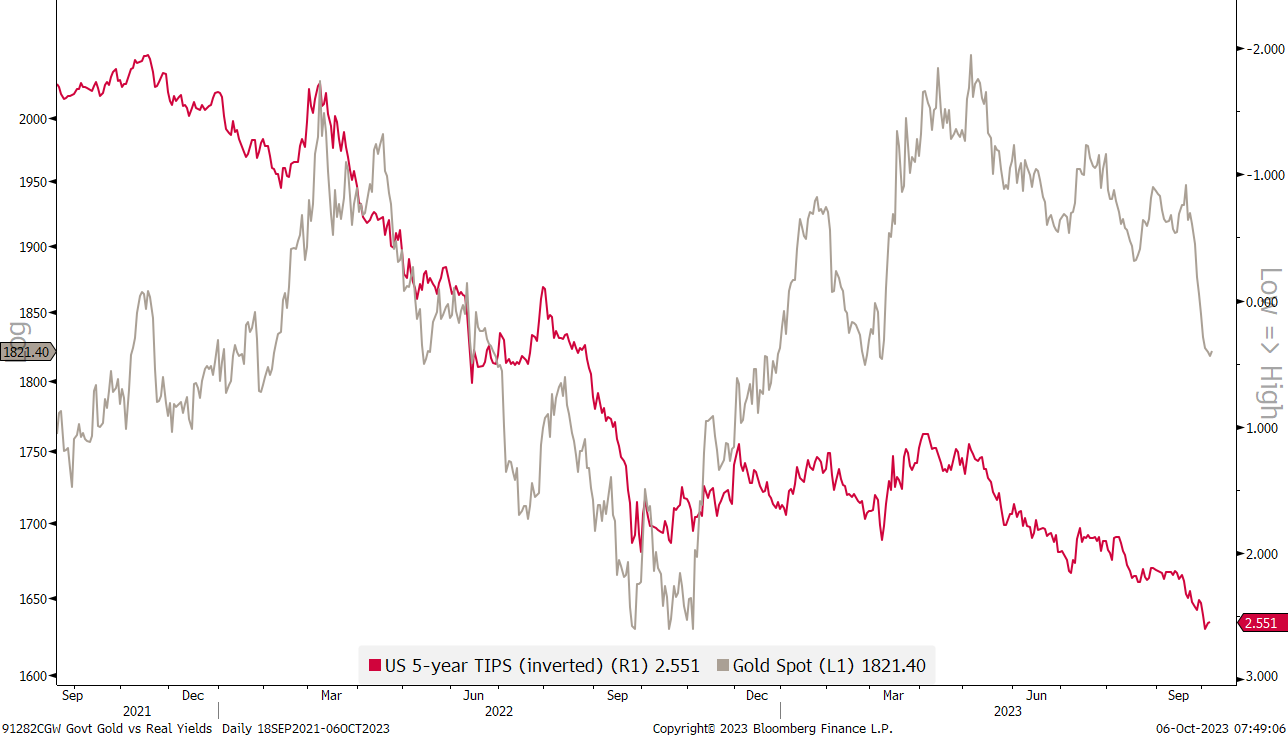
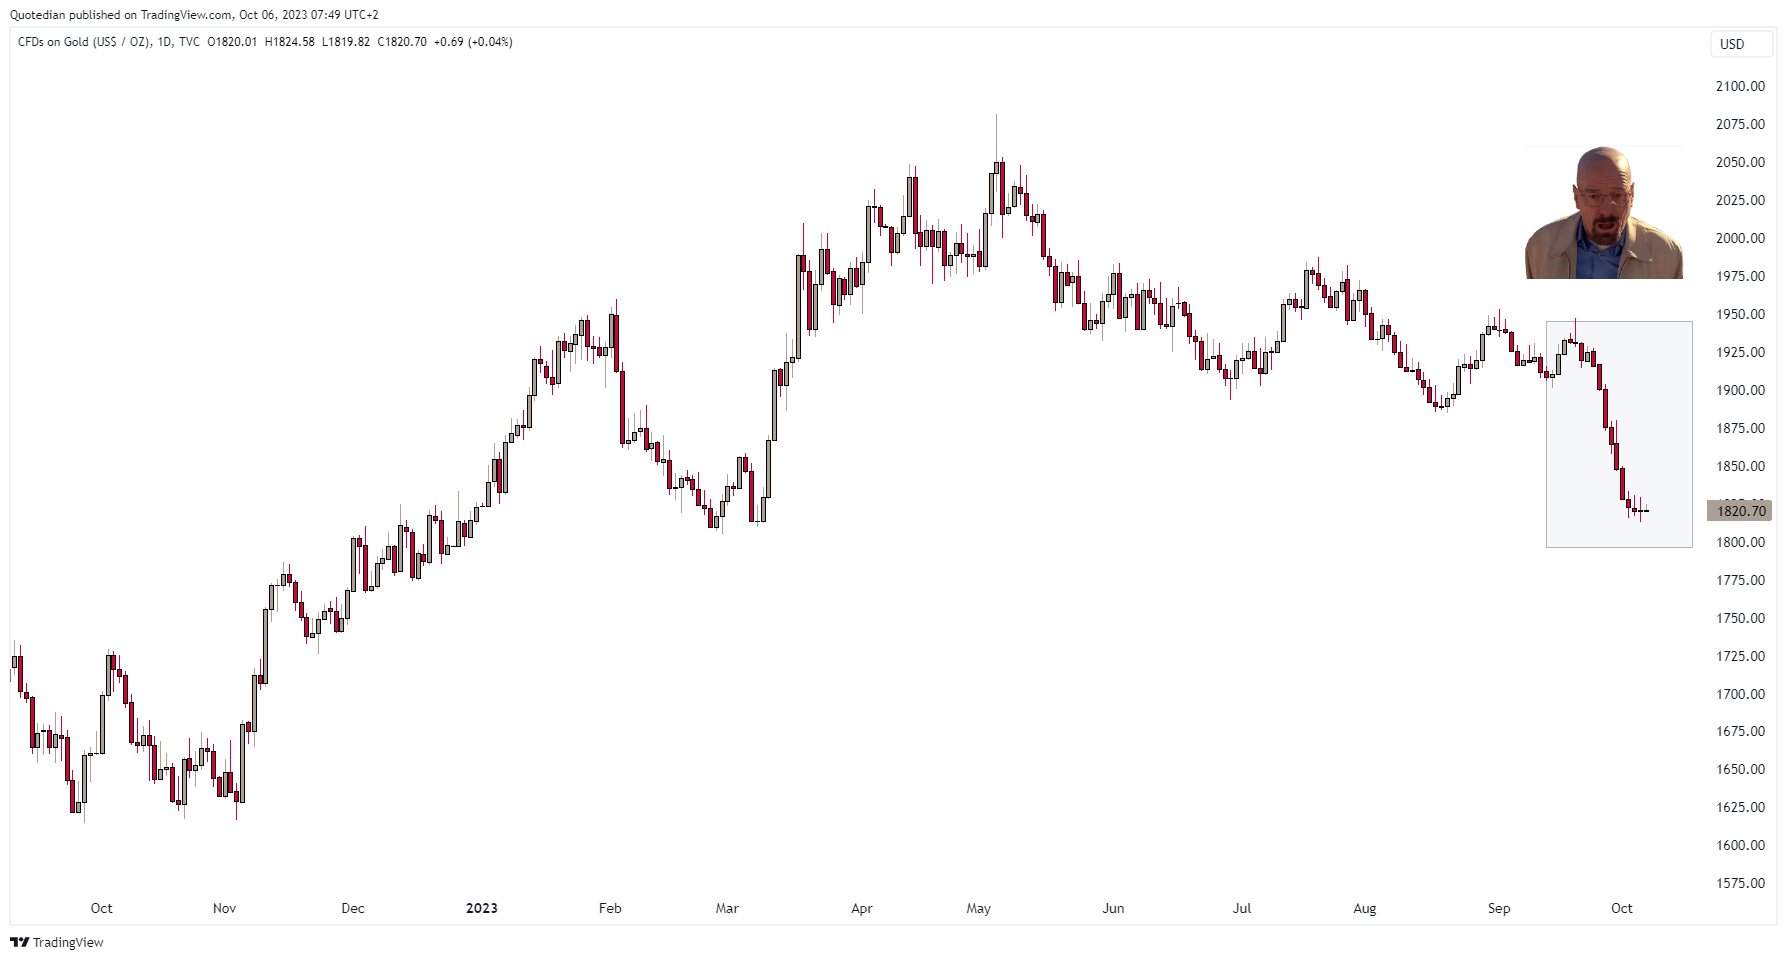
In the commodity space, the price of Gold (grey) is catching up with the real-interest (red) reality:
Here’s the pure price chart of Gold (in USD):
And finally, we also need to speak about oil … one of our favourite commodities (investment-wise) got hit badly on Wednesday, probably mainly due to a wash-out of long positions, which had reached an extreme. Here’s the chart of WTI:
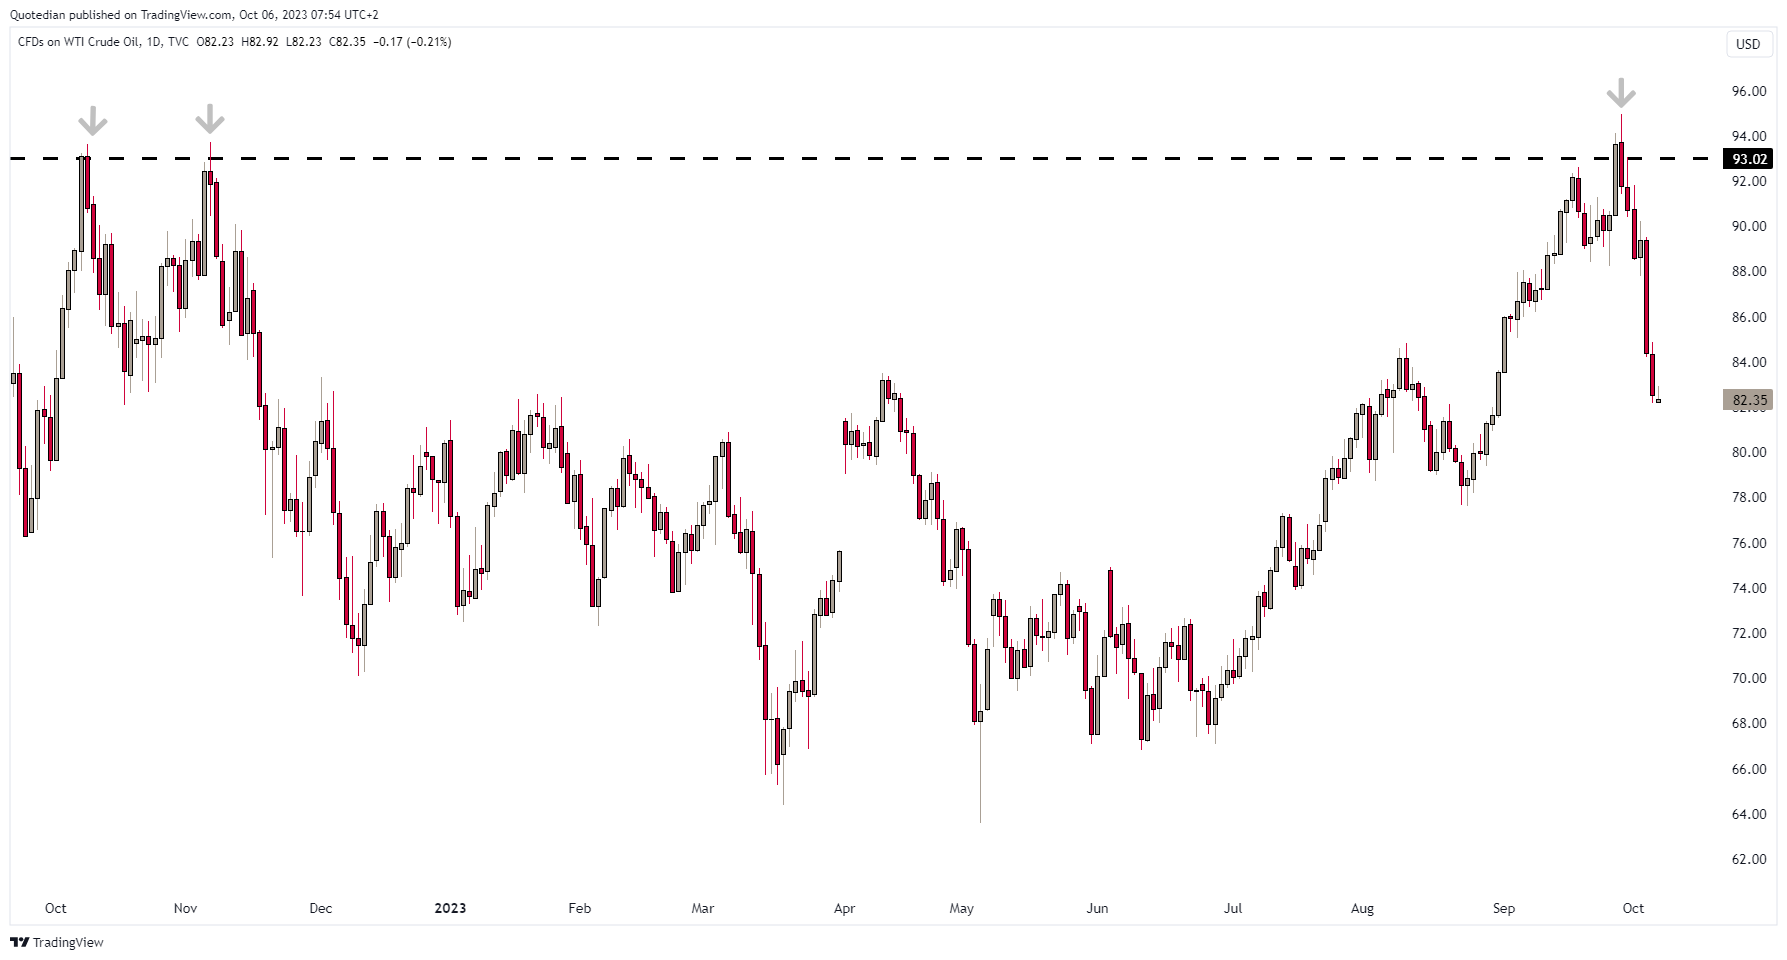
For now, I think it is only a correction and may offer another entry opportunity to oil stocks - as ever though, don’t forget your risk management.
One more, sorry.
Nat Gas broke higher yesterday:
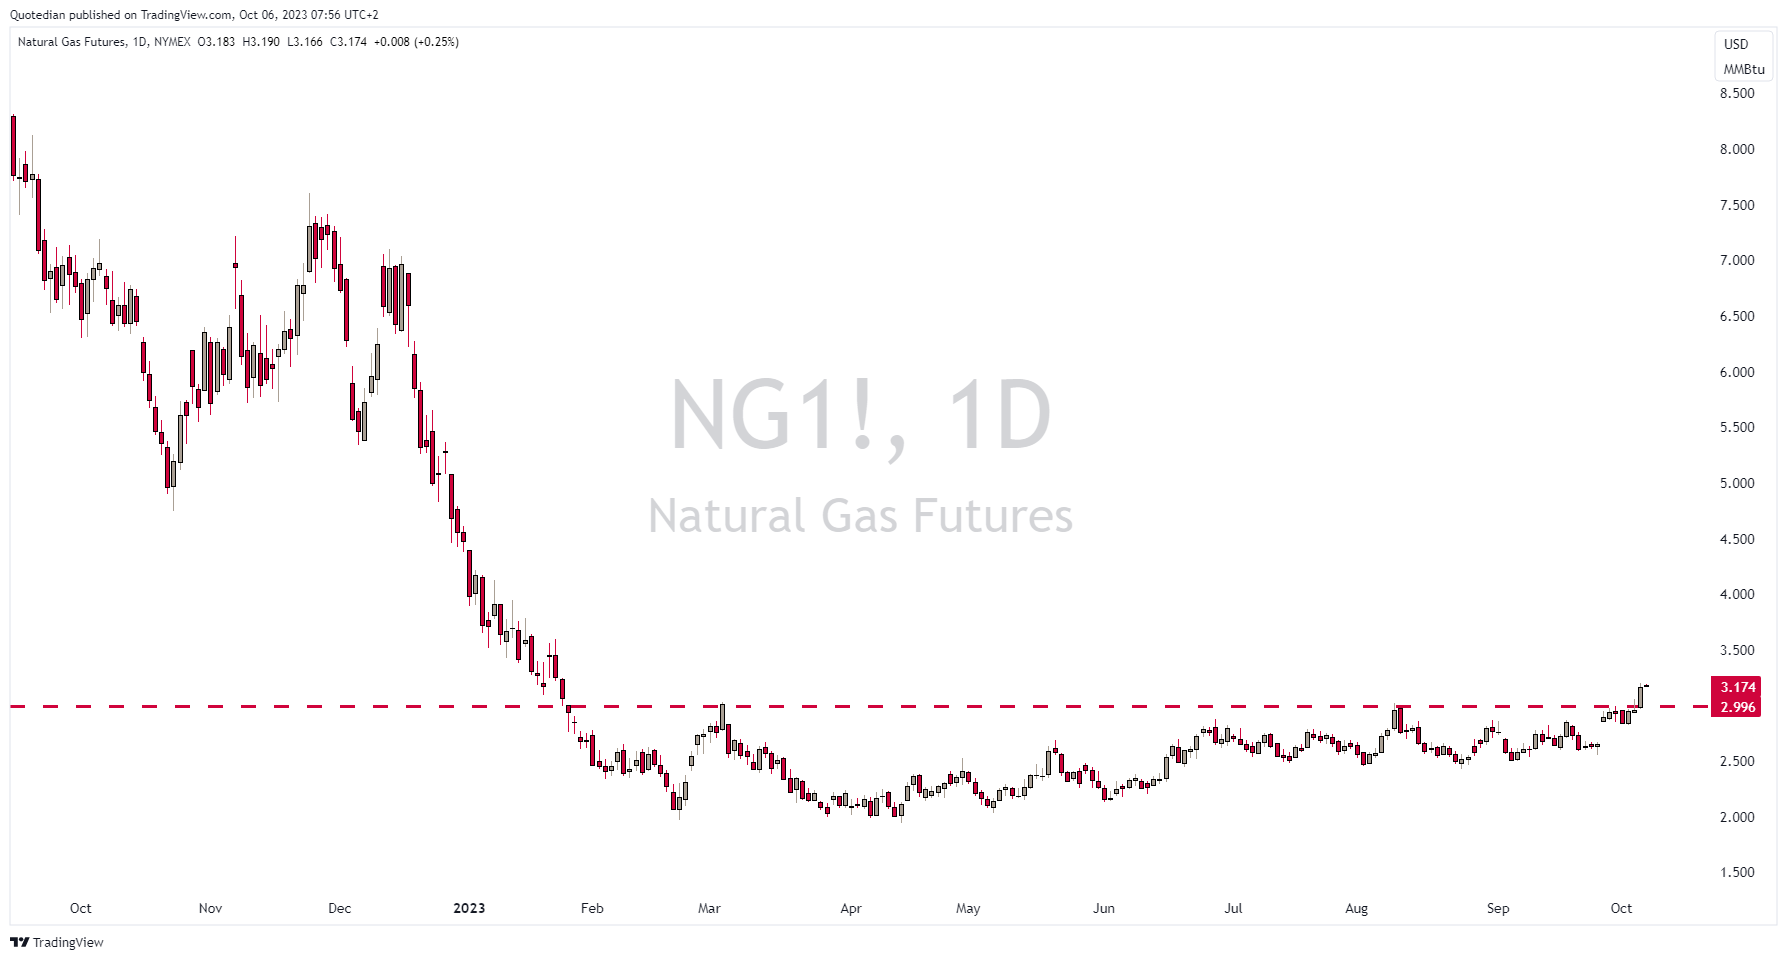
This is worth a trading buy and I add it to the trading blotter. Whilst we will follow that idea via the futures price, there are several ways to implement, including via the US Natural Gas Fund (UNG) or NG stocks such as Coterra (CTRA), Antaro (AR) or Range Resources (RRC).
Ok, that’s all folks!
Just as a sweet reminder, today is NFP (non-farm payroll) day in the US. The ADP number reported a few days ago came in below expectations and especially below 100k. Should NFP come in below 100k also (not a prediction), yields on bonds could move quickly lower and credit spreads quickly higher. A surprisingly high number (>170k) would provoke the contrary.
Stay tuned …
André

After having looked at so many charts breaking bad, maybe it’s time to change the channel and watch some “The Good Place” (and hope it does not turn into a “House of Cards…).
For example, on Wednesday the number of stocks trading above the 50-day moving average dropped below 10%. In recent past, this meant a tradeable bottom was not far away:


Everything in this document is for educational purposes only (FEPO)
Nothing in this document should be considered investment advice
The views expressed in this document may differ from the views published by Neue Private Bank AG
Past performance is hopefully no indication of future performance
Interest rates now play the role of Walter White and say "I am not in danger, markets (Skyler). I am the danger"🤣🤣