

Brobdingnagian
The Quotedian - Vol VI, Issue 33 | Powered by NPB Neue Privat Bank AG


“Every man desires to live long, but no man wishes to be old.”
― Jonathan Swift, Gulliver's Travels
DASHBOARD

AGENDA

CROSS-ASSET DELIBERATIONS
The (ever so) slightly softer than expected US CPI data dominated financial markets yesterday, albeit arguably more on the bond side than on the equity side of things. So let’s start with fixed income first for once today.
Bond yields dropped after that said CPI reading, here’s the 2-year US Treasury bond yield (I highlighted where the inflation number was released, just in case you couldn’t spot it):

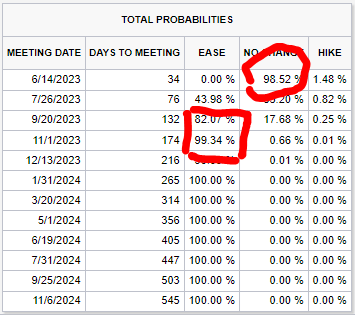
Interestingly enough, at one stage after the number release, the futures markets were pricing in a 98.5% probability for no hike in June (badly drawn circle) and an over 80% probably for a cut in September and basically a 100% chance for a cut in November (even worse painted square):
German yields (as proxy for European rates) came slightly under pressure to after the US CPI, but then continued to slide, with the downward trend acceleration in the past hour or so. Here’s the intraday chart of the 2-year Bund:

Which reminds me of an interesting chart pattern I looked at on the German 10 year Bund just two days ago:

It’s not really my top scenario, but a break of the neckline at 2.30 would imply a 1.50ish price target from this shoulder-head-shoulder reversal pattern …
The good old Quotedian, now powered by Neue Privat Bank AG

NPB Neue Privat Bank AG is a reliable partner for all aspects of asset management and investment advice, be it in our dealings with discerning private clients, independent asset managers or institutional investors.
Turning to equities and as the dashboard above would reveal a mixed session for equities, with the best and most constructive progress made on the Nasdaq:

The sideways consolidation and resistance have now clearly been broken and unless it is a bull trap, as much as the breakdown two weeks ago was a bear trap, the question would be will it be enough to lift the broader market (S&P 500) out of its consolidation range too?

Going back to the Nasdaq, and comparing the NDX (grey) to its equal-weight version (NDXE, red), may suggest that the notion of a confirmed breakout for a broader range of stocks may be premature:

Similarly, looking at yesterday’s performance heat map of the S&P 500, we somehow cannot shrug of the feeling that all the heavy-lifting is still done by the few usual suspect only:

Asian markets are printing mostly red this morning, with index futures on Western markets flattish a few minutes before opening of cash trading.
The US Dollar softened, as would be expected, after yesterday’s CPI release - once again I have marked the spot for your ease ;-) - but has made back all the losses in the past trading hour or so:

I have not been able to identify the source yet of this USD strength, but it seems to be quite broad versus all other major currencies.
All the more a feat then that Gold is continuing to try to push higher. We will likely look at some interesting charts in that regard in this weekend’s Quotedian.
Later today we have the Bank of England announcing their monetary rate decision and whilst a like is widely expected with inflation still running in the double-digits, the market will focus on whether a pause will be signaled.
Time to hit the send button. Be good.
André
CHART OF THE DAY
This is a monthly chart (each candle represents one month worth of data) of Japan’s TOPIX index. All other necessary information is written on the chart …
Stay tuned!

Thanks for reading The Quotedian! Subscribe for free to receive new posts the moment they are published.
DISCLAIMER
Everything in this document is for educational purposes only (FEPO)
Nothing in this document should be considered investment advice
The views expressed in this document may differ from the views published by Neue Private Bank AG
Past performance is hopefully no indication of future performance