Calm before the storm?
The Quotedian - Vol V, Issue 98
Inflation is taxation without legislation.
— Milton Friedman
DASHBOARD
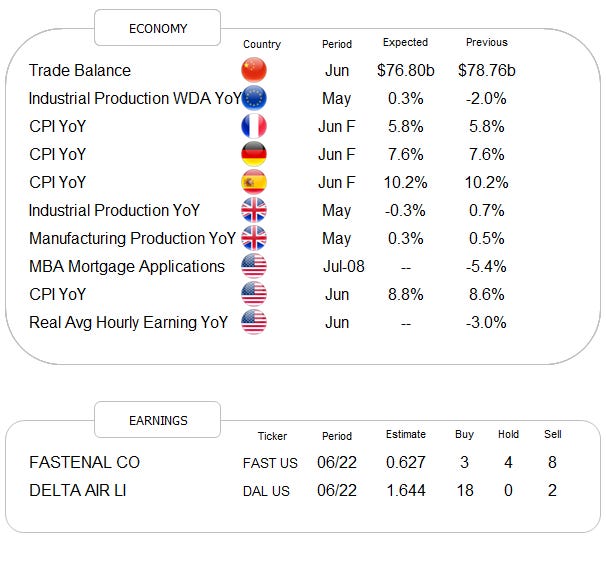
AGENDA
CROSS-ASSET DELIBERATIONS
I am absolutely flattered by the number of new subscribers after yesterday’s LinkedIn mention and give my heartfelt thank you to a) all new subscribers and b) the endorsement by so many existing subscribers. Thank you.
Though as Mr Murphy would have it (the guy from Murphy’s law) yesterday, we get to kick off this inaugural “expanded family” issue after a pretty boring session yesterday, where most investors seemed to be sitting on the sideline, waiting for today’s US CPI print and Thursday proper kick-off of earnings season. Let’s make some observations anyway …
Talking inflation, the S&P 500 closed down nearly one per cent, but only due to a steep sell-off in the last hour of trading, as a rumour about a CPI leak swept through social media, with the leak apparently hinting to a 10%+ reading today. It will likely turn out to be fake news, but hurt stocks along the way anyway. Here’s the intraday chart of the S&P:
In terms of market breadth, volumes were a tad higher than the previous session (where they were the lowest in weeks), but still below the average of recent past. Decliners outpaced advancers by about two to one and all eleven main economic sectors closed lower on the day:
The market carpet of the SP also reveals how much of a fragmented session it was, and how much mega-cap Microsoft got hammered on rumours of a hiring slowdown (which in the meantime actually was confirmed not for MSFT but for Alphabet):
Little more to say on the equity side, other than Asian markets are mostly higher this morning, about somewhat shily so. Index futures on European indices would suggest a flat to a slightly lower start to our cash session here, whilst their US counterparts are currently printing a small green.
Moving into fixed income markets, all eyes on the CPI print out of the US today of course. Not sure what happened to the Fed’s favourite inflation measure (the PCE deflator), but apparently it has been completely abandoned in favour of the more rockstar-style CPI (as so many rockstars, it is probably full of sh.t though…). As usual, more important than the actual figure will be the market’s reaction to that number. As mentioned above, there was a rumour of a 10%+ reading yesterday (arguably, it has been mid-double digit teen numbers for months now), which probably indicates that the real surprise would be in a lower number. Aahh, psychology!
A few more inflation thoughts:
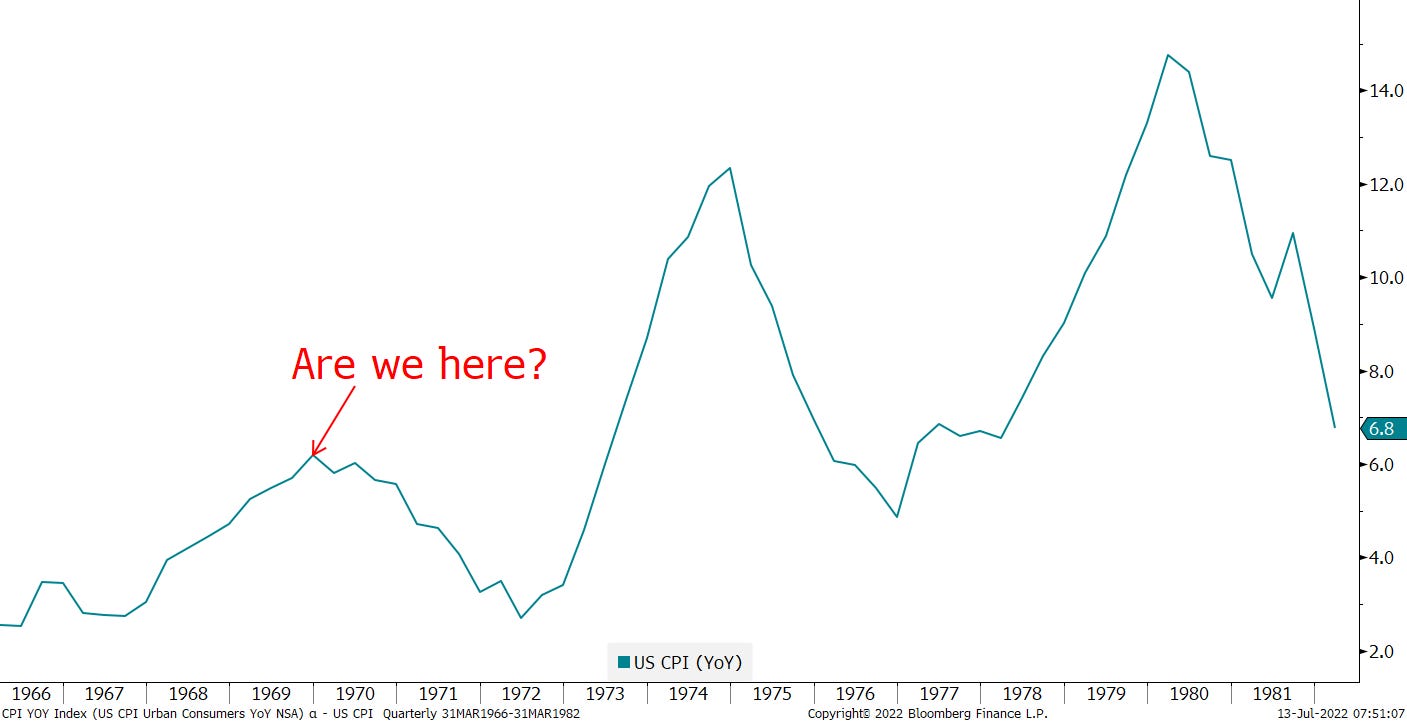
We know that at some stage the number has to come lower due to the base effect and with commodity prices having peaked in June, this moment is moving closer. But we also know that inflation is like toothpaste and once out of the tube, it is hard (impossible) to get it back in. Hence, one of my main scenarios for the path of inflation remains a repeat rhyming of the 1966 to 1982 period:
And as the Fed can only address the demand side, but not the supply side, they have been telling us for months that they will ‘reduce’ the wealth effect, which over the recent years has exploded (thanks to the same Fed):
The above chart is updated through Q1 of this year only - an updated version will of course show a new downtrend - but probably not enough yet. Continue to keep your helmets on.
A very uninspiring session for bonds yesterday, with yields on the US 10-year treasury pushed a tad higher after a weak bond auction. For the benefit of our newcomers, here’s a quick repeat of our defined range (2.75%-3.20%) on the 10-year treasury, where we took the oath :-) not to go aggressive until a break on either side:
Moving into currencies, this Tweet from the always hilarious Dr Patel sums up the situation around the EUR:
In what is an exhibition of absolute sarcasm, the low print on the EUR/USD rate (at least according to Bloomberg) was actually 1.000:
We suggest yesterday that we would close our EUR-dislike if parity is hit, and whilst I think we will move below one over the coming hours/days, let’s stick with that original idea.
The other currency ‘patient’ currently under observation is of course the Japanese Yen, which saw a small bout of strength yesterday, but continues to trade close to multi-decade highs:
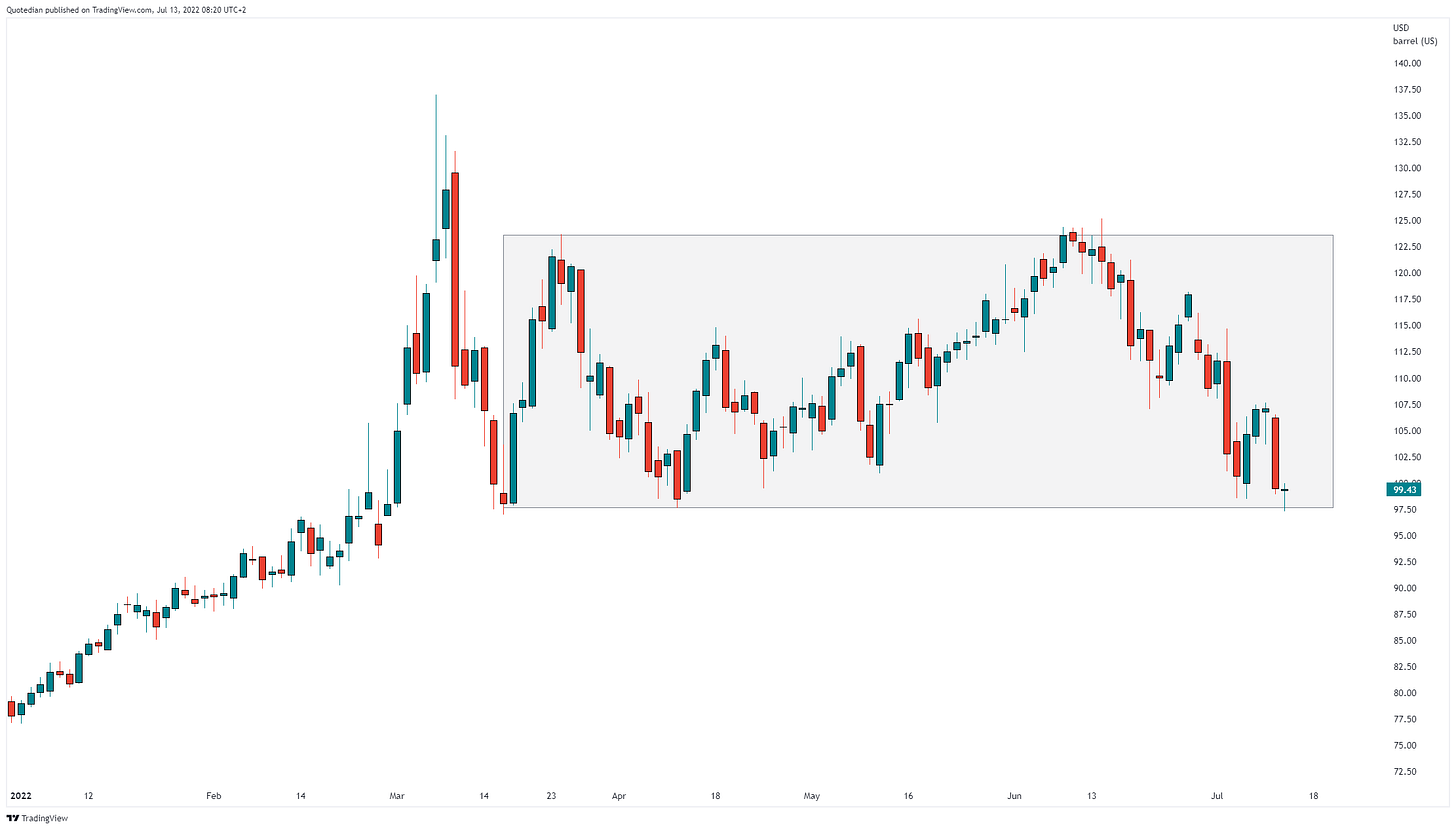
And finally, looking at the commodity complex, where we witnessed an 8% drop in the price of oil yesterday as _______________ (fill in your favourite reason here). Seriously, it was difficult to identify one singly trigger for the sell-off, hence it was most likely on the back of some bad positioning and low liquidity. In any case, oil has dropped right back to the low end of its range box of the past four months (Brent example below):
Ok, time to hit the send button - all eyes on the CPI number now (14:30 CET), as nothing else matters.
CHART OF THE DAY
In the above deliberations section, we mentioned inflation and toothpaste. Today’s COTD, courtesy of Strategas, shows that it took a double-dip recession in the early 1980s to eventually reign in runaway inflation. Stay tuned…
Lovee the Quotedian? Share the love:
LIKES N’ UNLIKES
Likes and Dislikes are not investment recommendations!
Long China equity (FXI) / short India equity (PIN)
Biotech (XBI); trailing stop now at $66
Energy stocks (XLE); 1/2 usual position size
Long some Gold (direct or via short puts)
Euro(temporarily) closed
DISCLAIMER
Everything in this document is for educational purposes only (FEPO)
Nothing in this document should be considered investment advice
Past performance is hopefully no indication of future performance


