C'est Chaud!
The Quotedian - Vol VI, Issue 78 | Powered by NPB Neue Privat Bank AG
"Whenever you find the key to the market, they change the locks."
— Lucien Hooper
The title of today’s Quotedian does not want to imply that we will speak about climate change today. Nor about hot drinks or other hot ‘objects’. Rather it is about that we are starting to feel the heat on the stock market.
Feeling some heat on your performance? We can help!
Contact us at ahuwiler@npb-bank.ch
Events are starting to frontrun the planned title for the next Quotedian, which is planned to be released on All Saints Day. No, the title ain’t “Halloween” or “The Living Dead” (though both would be cool too), but rather I had planned to call it “Rediscovering Price Discovery - First Blood, Part I”. This refers to the bloodshed that had been happening on bond markets over the past months (and years now), as investors are rediscovering that yields can go up meaningfully too and try to find out what R* or R** is or are. Wickedly, I then planned to call a future update “Rediscovering Price Discovery - First Blood, Part II”, as equities, which have largely been ignoring higher interest rates, would start the same process of price discovery.
The price action of the past two weeks may suggest that the sequel has already been released …
But let’s take it in parts.
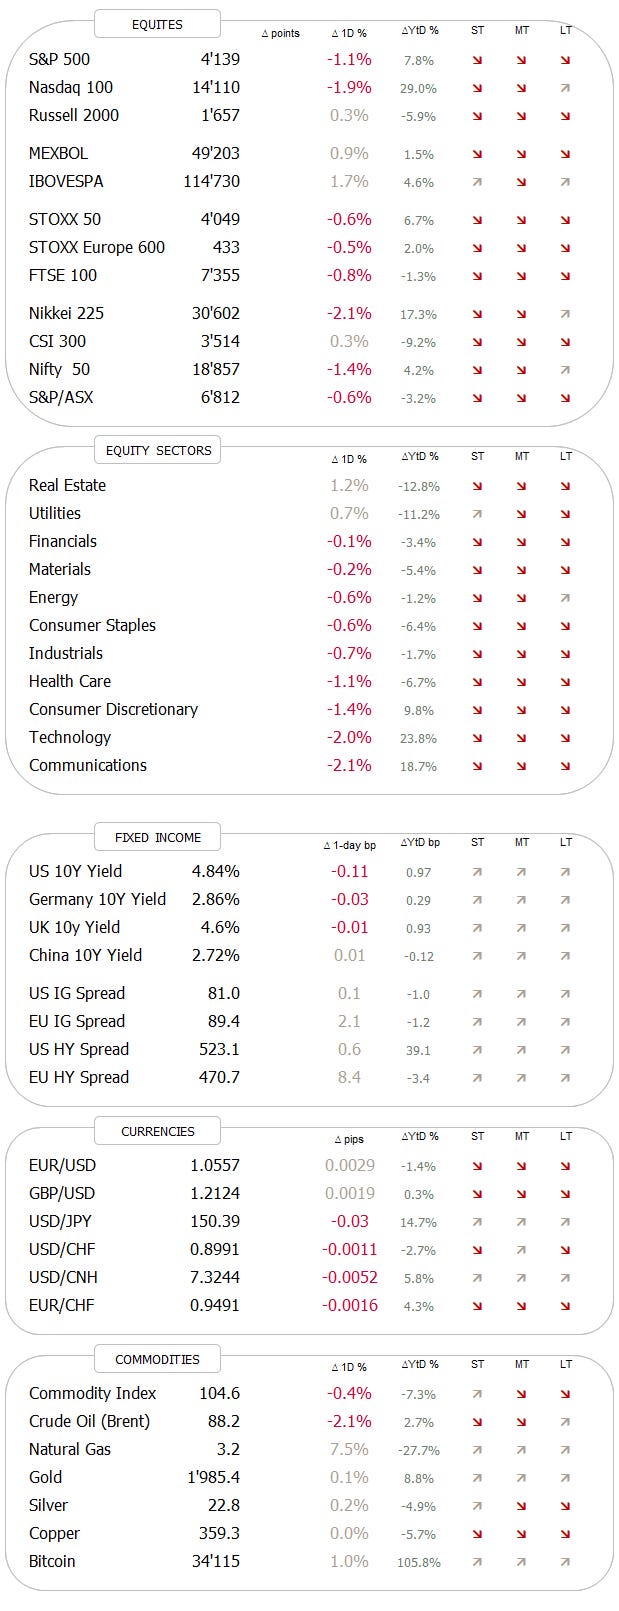
Stocks, as measured by the MSCI World index, are down about 5% over the past 10 trading sessions (= 2 weeks). For the usually lower beta (i.e., more resilient) S&P 500, it is even closer to 6%, as a few of the Magnificient Seven have been shot or are seriously wounded:
Will, as in the movie, only three survive in the end?
Looking at the chart of the S&P 500, we get some good and some bad news:
Good news: We are now less than 2% from our shoulder-head-shoulder pattern implied price target.
Bad news: We have now clearly broken the 200-day moving average. Nothing ever good happens below the 200d MA. A swift recovery above would be needed, and with swift I mean the next two to four sessions….
What is giving some hope for a possible recovery are not only the upcoming positive seasonals we have spoken about over the past few Quotedians, but also that in yesterday’s sell-off for example, about the same amount of stocks were up (241) and down (260). I.e., it follows then, and returning to the Mag 7 for a moment, that it is those who are dragging now down the index, but the brother market may be bottoming. Here’s yesterday’s heatmap of the S&P 500 for illustration purposes:
Or, as a matter of fact, the hard-beaten small-cap stocks actually eked out a tiny advance yesterday and looking at the chart of the Russell 2000 also just at about the right level:
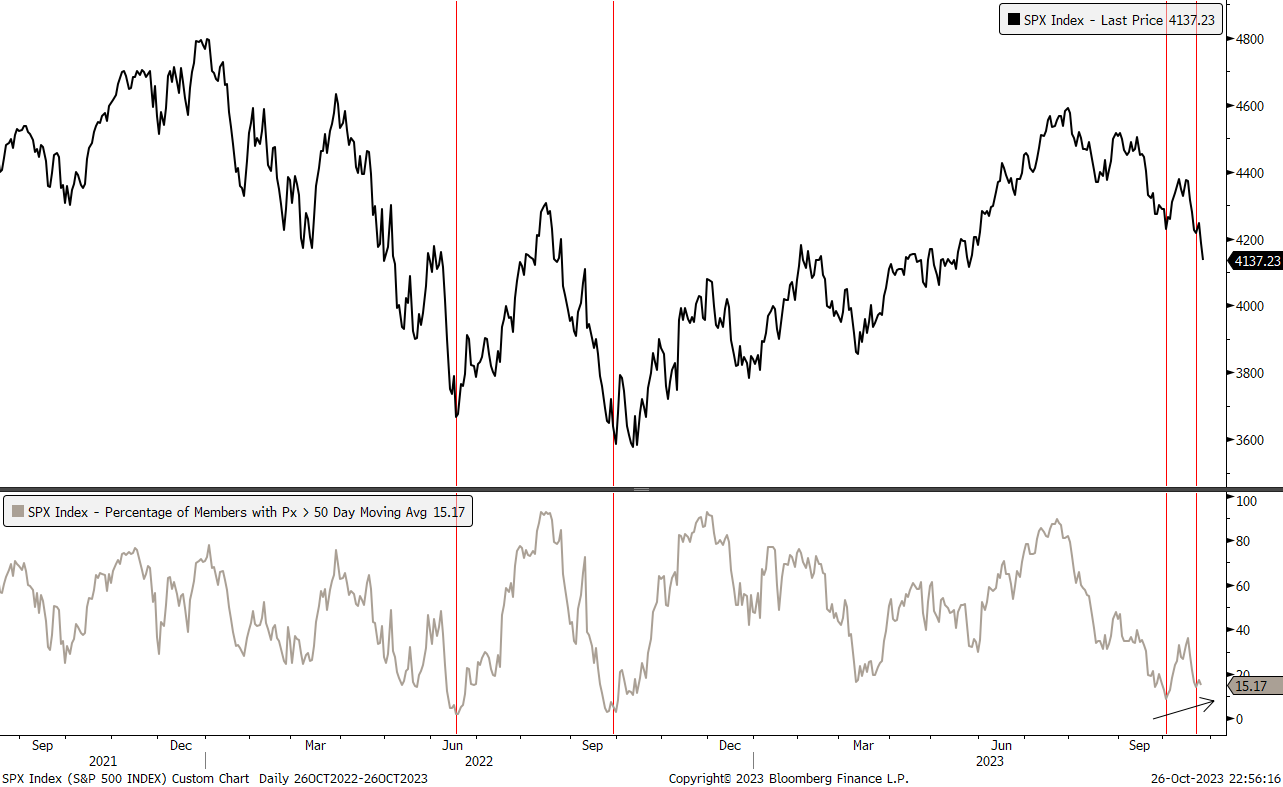
Or, as another possible positive, is that the measure of stocks below their 50-day moving average (15%) is at levels usually associated with (ST?) market recoveries:
End-of-month rebalancing, negative sentiment, strong GDP driven by consumption and the end of the blackout period of share buybacks could all be small factors adding to a relieve rally at this stage.
Or maybe I am just sliding down the ‘slope of hope’
Onwards with some fixed-income observation, with the first being that yesterday bonds saw a very decent rally (i.e. yields slipped), which net-net should/could have been possible for stocks … but wasn’t.
The slide in yields started with the rate hike pause announced by the ECB (or E zzzzz B, as it was a very dull press conference following the rate decision), followed by a very strong 7-year US treasury auction, showing solid demand.
As the following chart shows, yields dropped 15 basis points high-to-low yesterday (second last candle) and maybe, just maybe, that divergence between price and momentum indicator (black arrows) we looked at in the last Quotedian is really on to something:
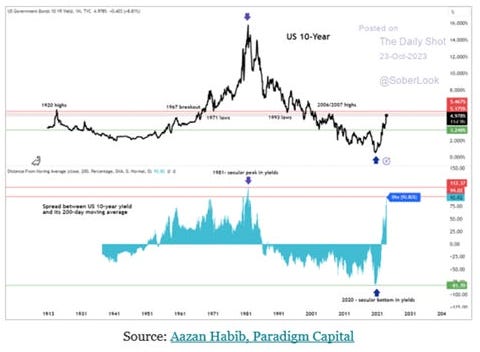
Further strengthening that message of an intermediate top for yields is the following chart, showing that spread between 10-year yield and its 200-day moving average is the most extreme since its cycle peak in 1981:
We already noted in the last issue that the German 10-year Bund, as proxy for European rates, failed to make a cycle high as compared to its US cousin, and yesterday saw some downside (yield) acceleration:
A drop below 2.80 could provoke a deeper correction for yields (rally for bonds), to for example the 2.50% to start with.
Credit spreads, which continue to widen, should remain our focal point to “see” the future of equity prices:
Another chart we need to watch is the US Dollar, which has been remarkably strong over the past three sessions:
A shift lower would be necessary here to support a turnaround in risky assets.
Unfortunately I already need to hit the send button as I am heading into a meeting, but I think we had some great charts up today. Agree? Or not? Leave your comment:
Happy Friday!
André
Today’s chart of the day compares US and European large and small caps and their re-financing needs over the coming years. Clearly, only US large caps were able to cut themselves a good deal. Everybody else is facing a steep re-financing wall.
Everything in this document is for educational purposes only (FEPO)
Nothing in this document should be considered investment advice
The views expressed in this document may differ from the views published by Neue Private Bank AG
Past performance is hopefully no indication of future performance


Nice form of Quotedian, exactly what I voted for (democracy prevailed). However, the lack of memes today was slightly disappointing.. Thanks André!