

Chip, Chip, Hooray
Vol IX, Issue 20 | A NPB Original

“Exponential rapidly rising or falling markets usually go further than you think, but they do not correct by going sideways.”
— Bob Farrell (Rule #4 out of Bob Farrell’s 10 Rules)

This week’s letter is mainly dedicated to update us on the happenings in markets during the month (May) just gone by, using our usual statistical tables and some longer-term monthly charts. However, just we before we do that, let’s have a quick look at the crazy, crazy rally in tech stocks in general and semiconductor-related companies in particular.
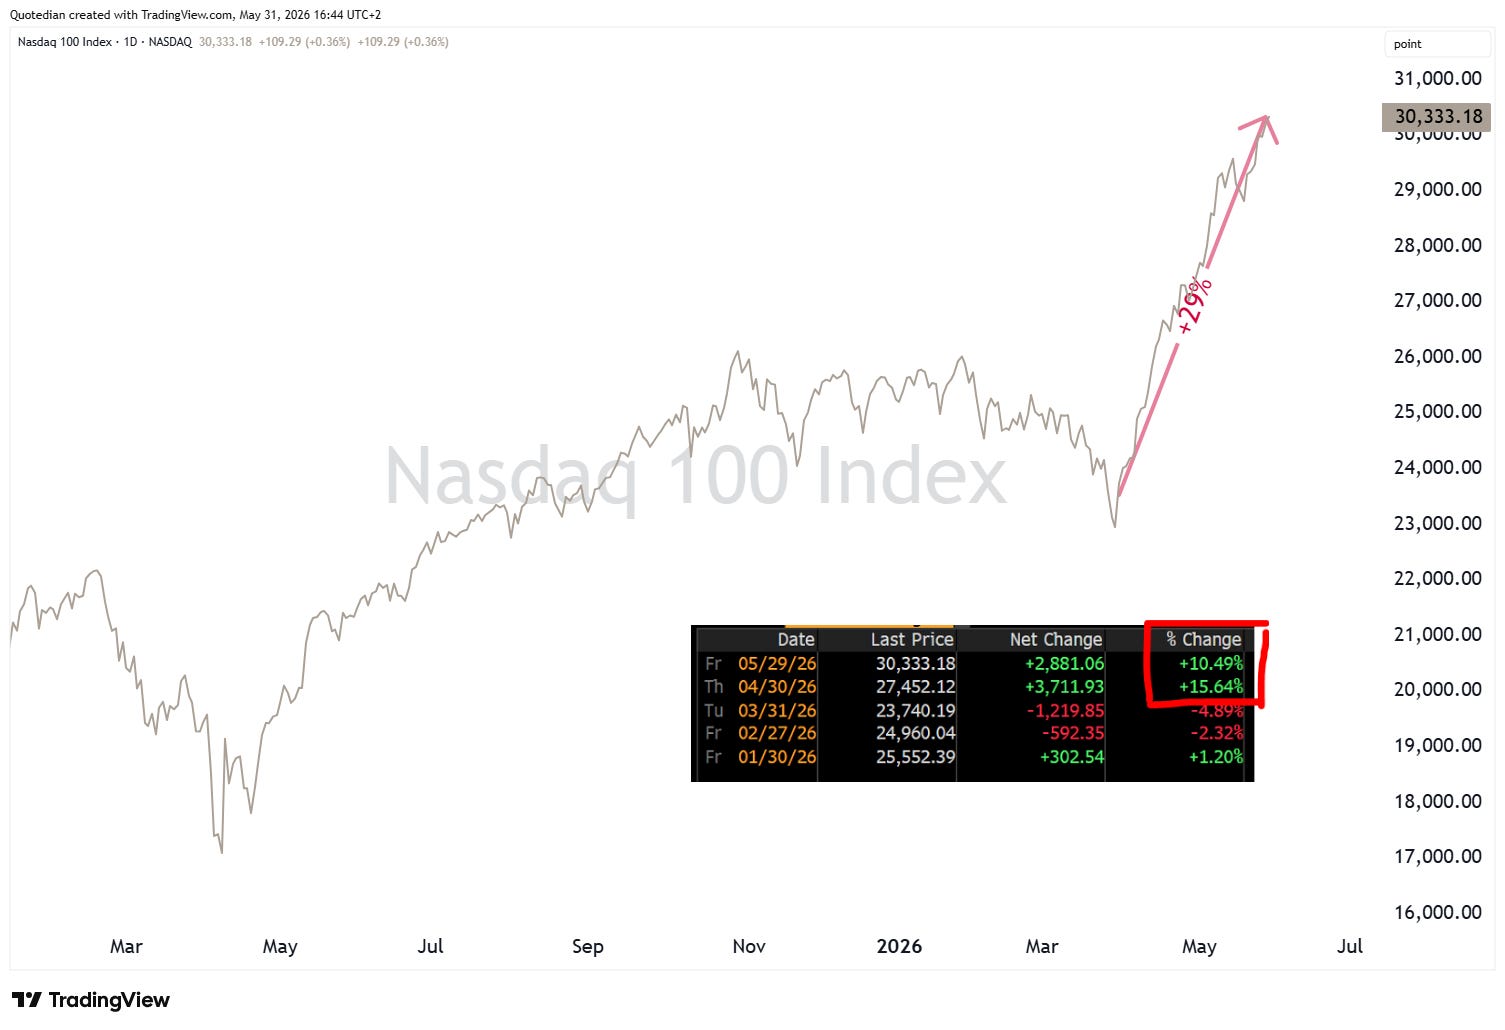
Starting with the broader technology market and using the Nasdaq-100 as its main representative, we note the back-to-back double digit gains in April and March for a nearly 30% advance:
So, how common are back-to-back double-digit gains on the Nasdaq? Turns out, not much:
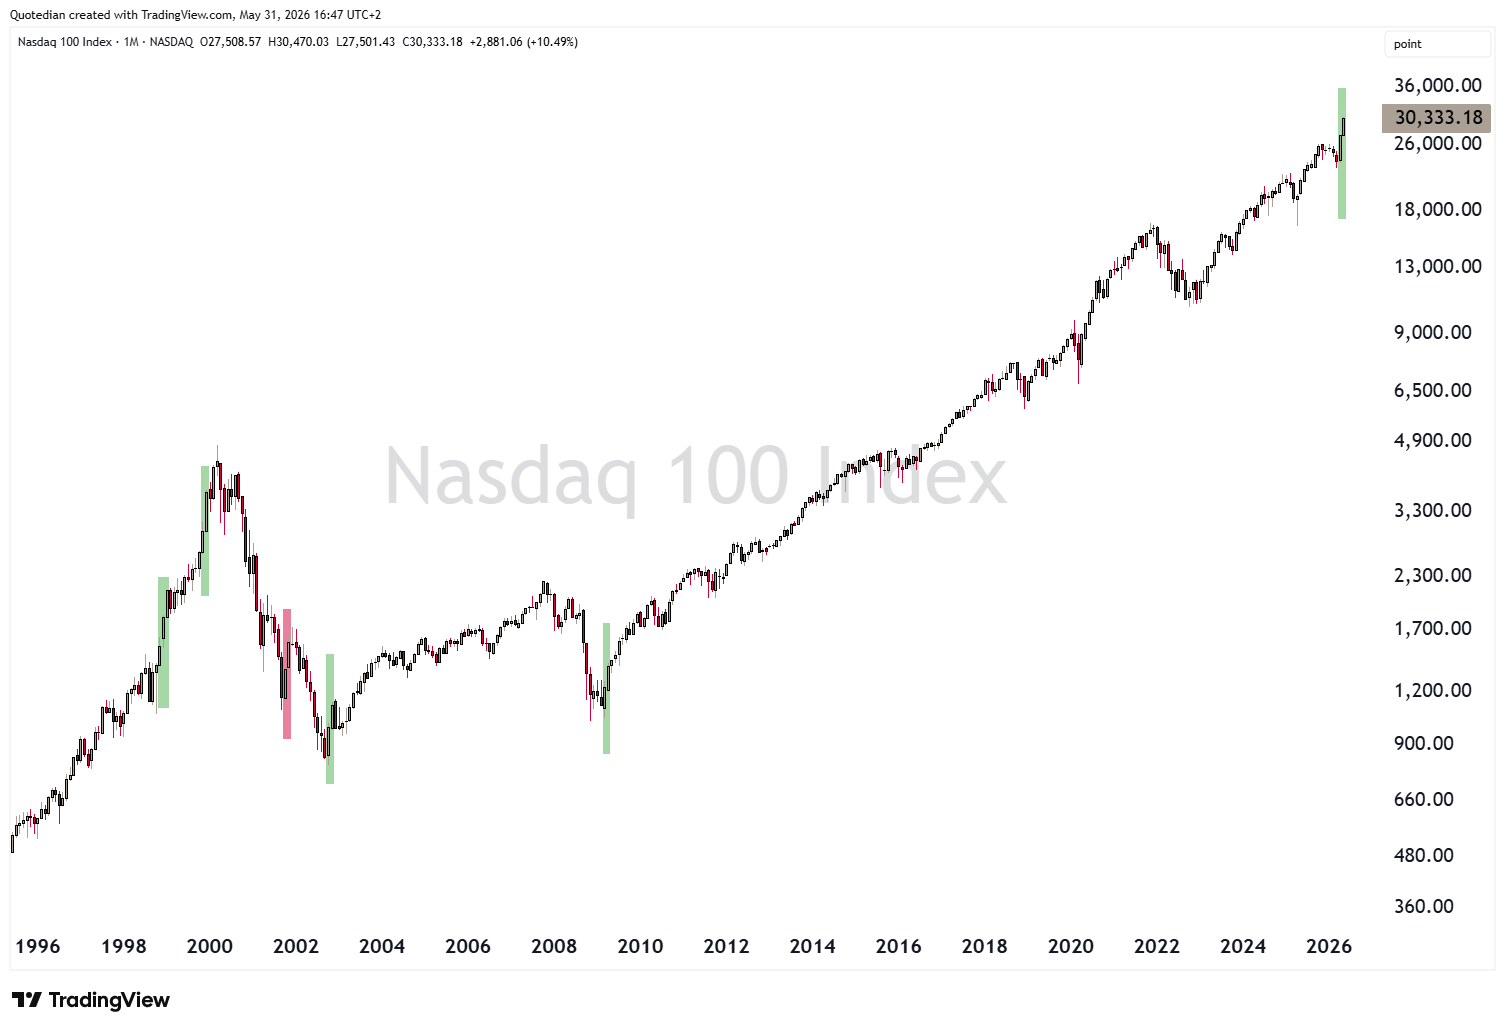
The chart above shows those moments (shaded areas) of two consecutive months of double digit gains. With the exception of the October/November rally in 2001, these were not bad times to continue to pile on further tech exposure. Even the November/December rally in 1999, so close to that ominous Dotcom-bubble top still had legs for another 30% …
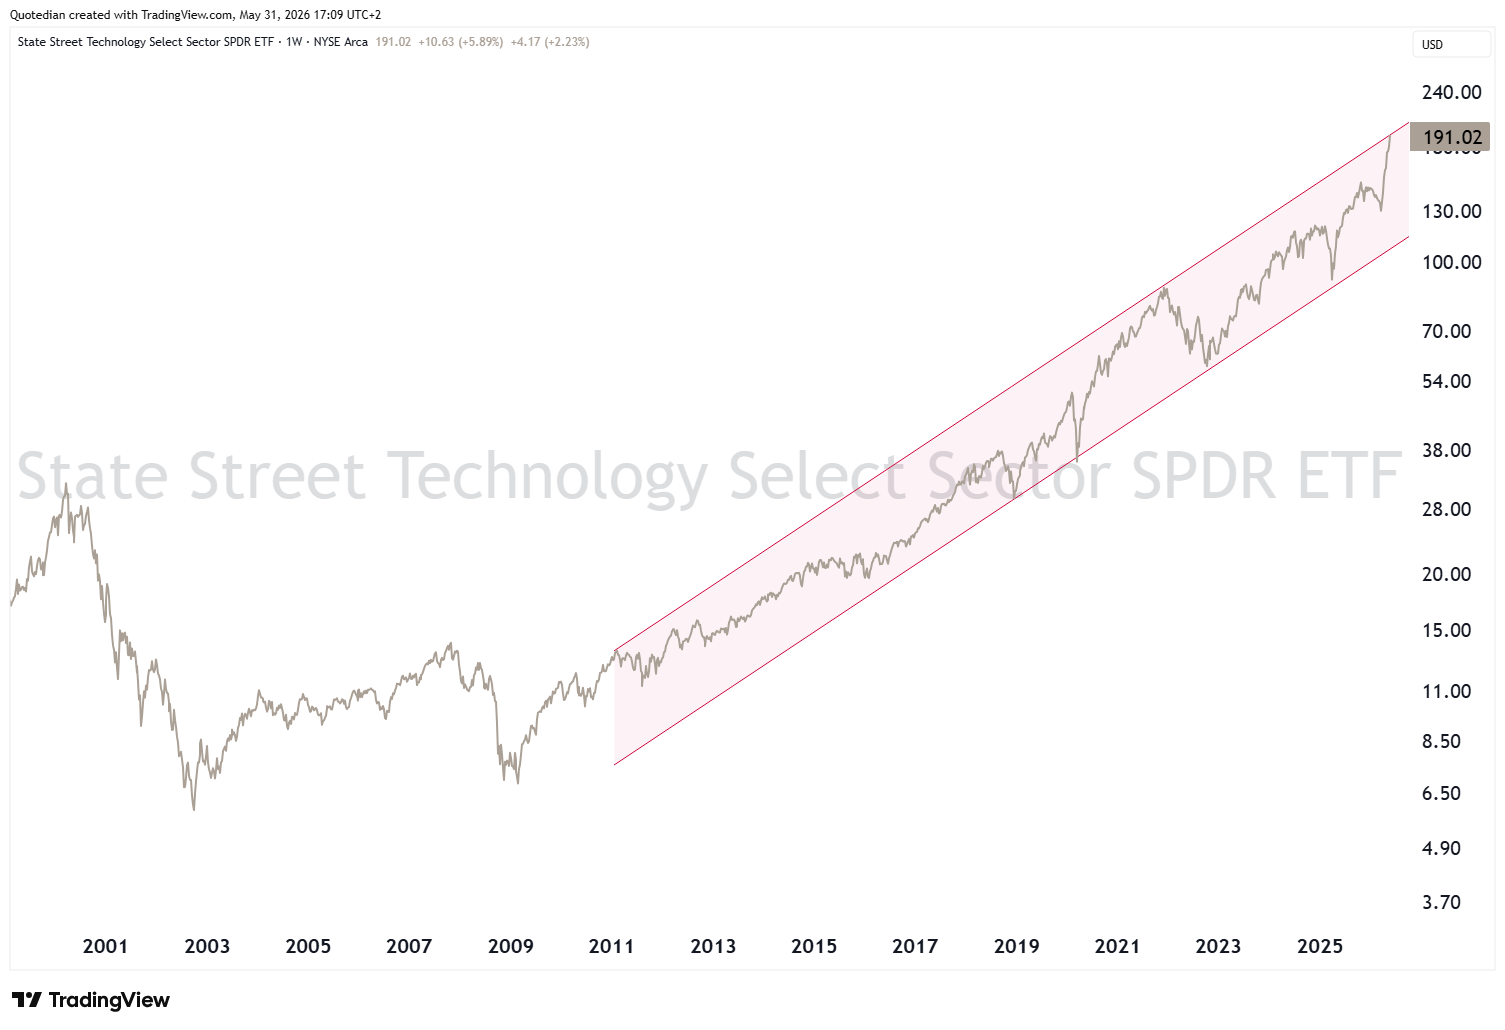
Now, having said that, the following chart of the suggest that maybe it would not be a bad idea to take at least some chips of the table (aka partial profit taking), as the secular bull trend has reached its upper trend channel, coinciding with also the 4th Fibonacci extension (685.4% - not shown) from the 2000-2002 decline:
Now, turning to the semiconductor market and using the Philadelphia Semiconductor index as a proxy, we are in awe about the move that just occurred over the past two months:
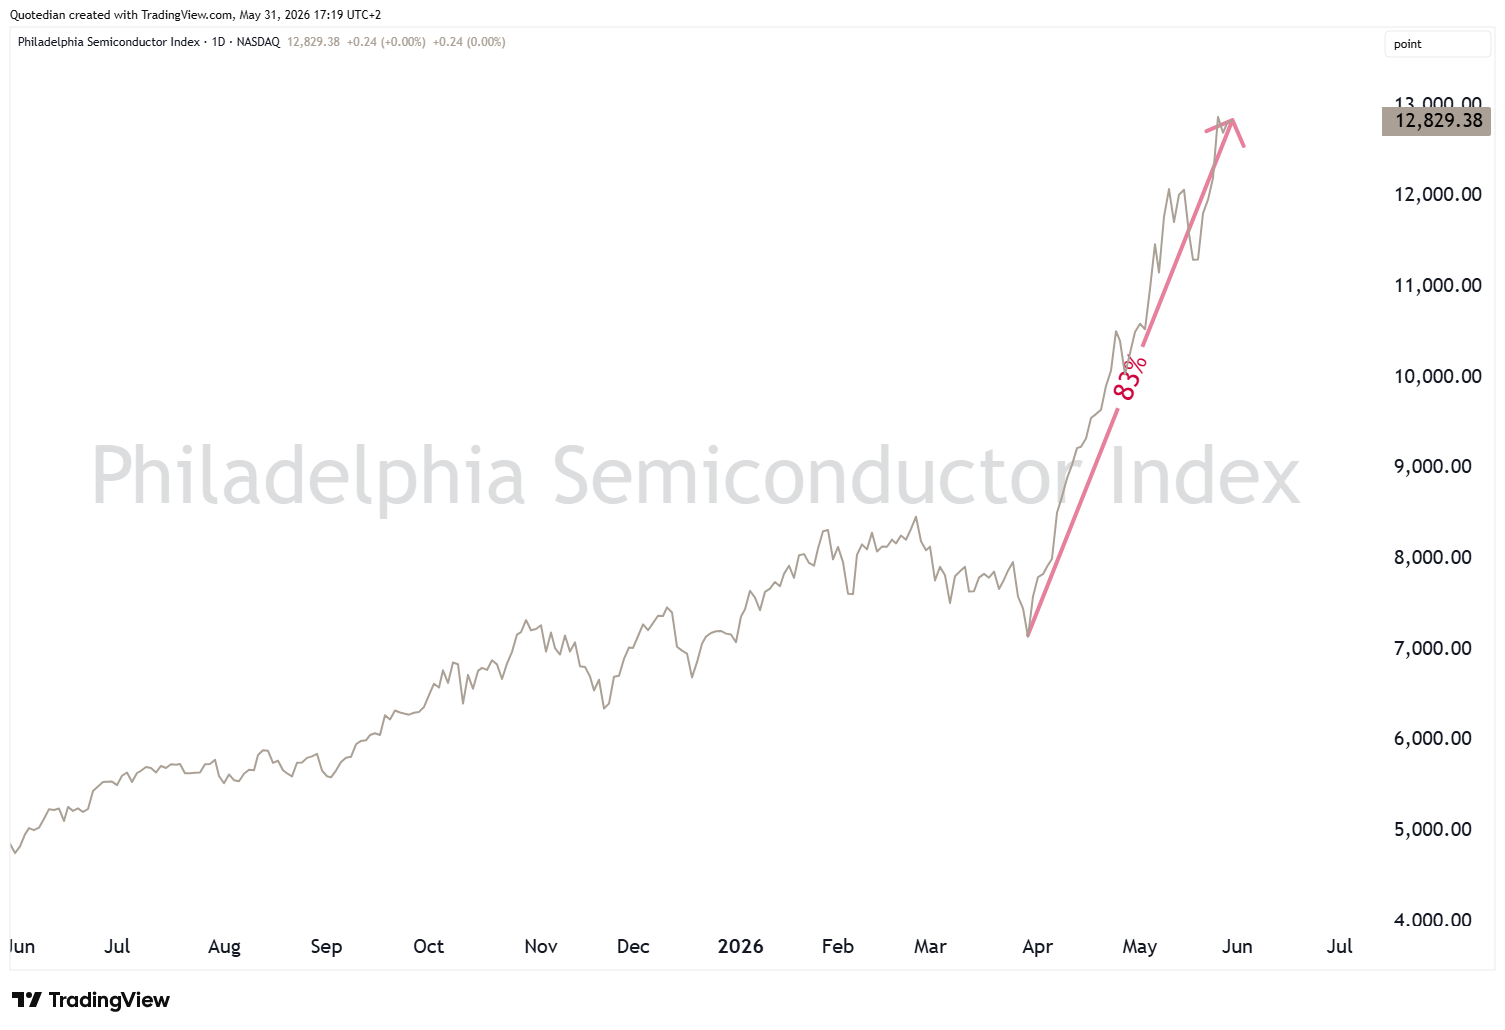
Ladies and Gentlemen, that’s close to a doubling in just two months!
Looking at the thirty constituents of the index, we should be not surprised that many have of course done even better than the index itself:
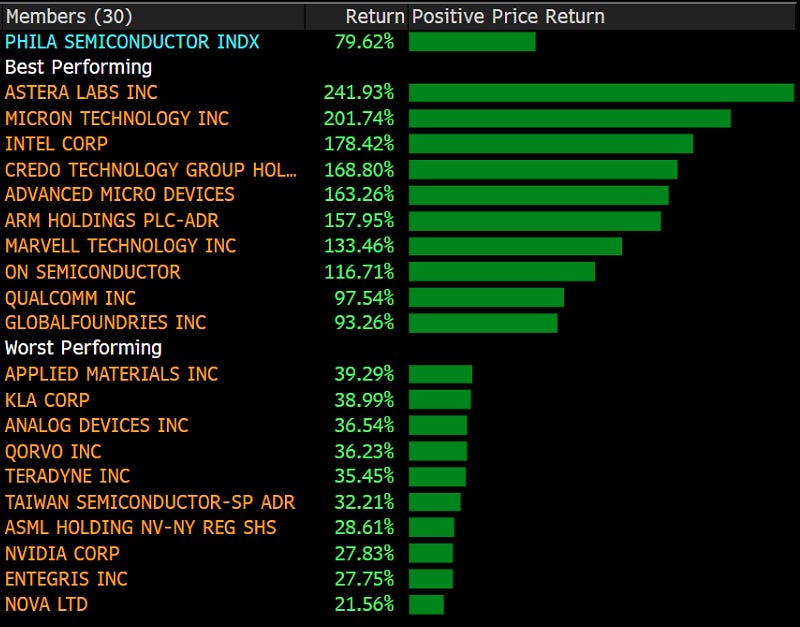
Well, hell, I think many of us would be happy having had just the 10% worst performing in our portfolios!!
So, is it still time to jump on the bandwagon or is it too late to join the party? How much juice is there left in the rally?
Quiet frankly, impossible to know, even if I commit chart crimes by overlaying completely unrelated events such as the Dotcom bubble and burst and the current SOX-rally over each other:
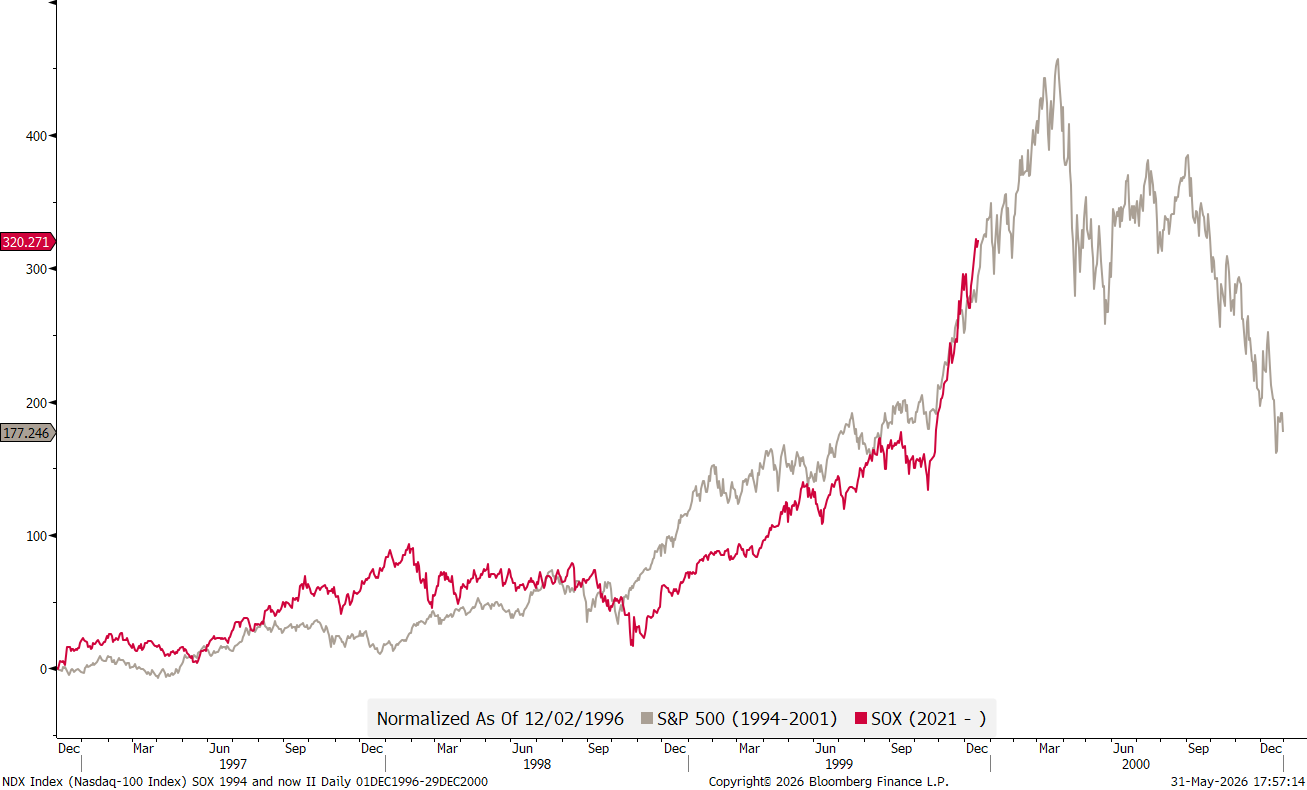
This, at best, is comparable to a snake oil seller pricing his goods to the public …
What I can to anyone willing to listen is a hunch, plus a not-so-bold-but-convinced prediction.
The Hunch: There’s more upside.
The Prediction: Volatility is about to increase.
Regarding the latter, here’s the full statement, which you can print and hang on your wall until true:
We only need one AI data-centre build being cancelled to violently shake-out the weaker hands … and given the record leverage, massive call buying and complacency going on, the maybe not so weak hands too.
Let’s have a look at another, semiconductor-related chart…
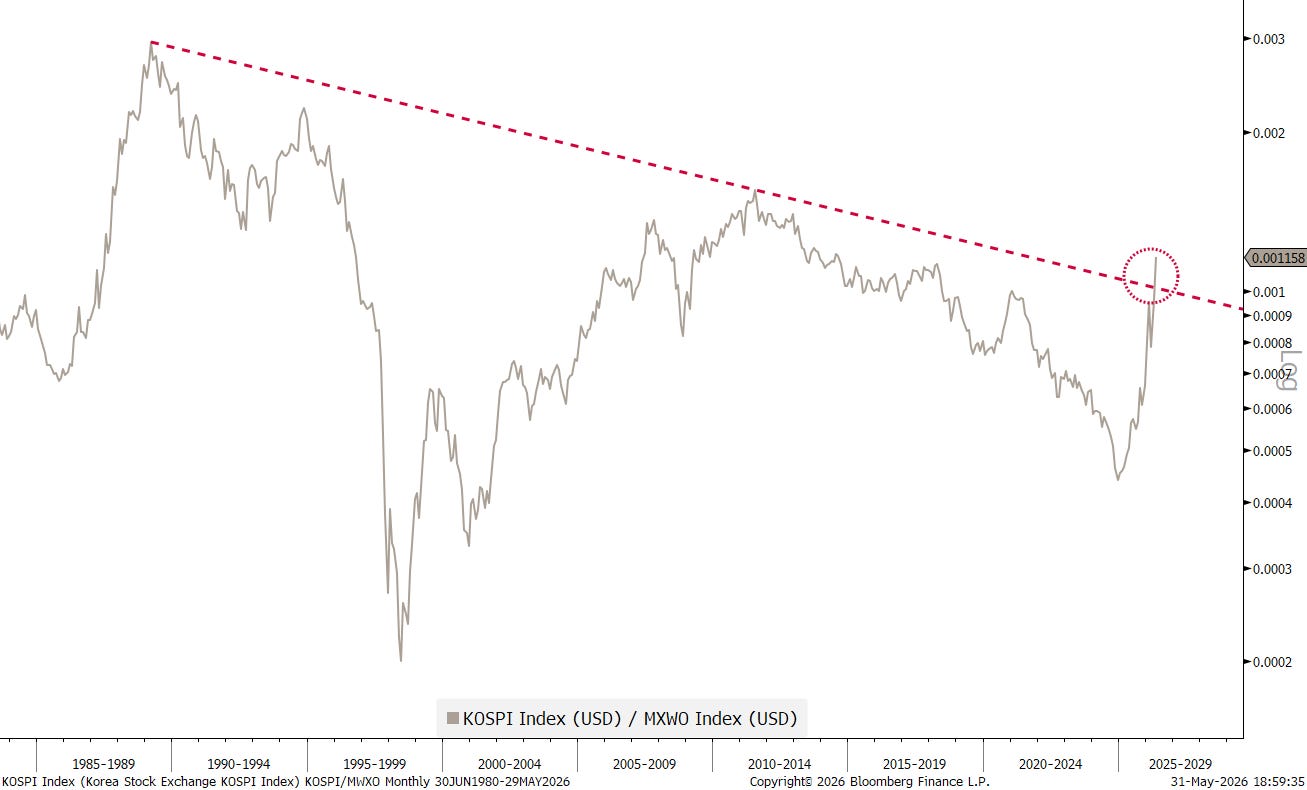
South Korea’s KOSPI index has 835 members (aka constituents). However, the two largest positions are more than half of index in terms of weighting:
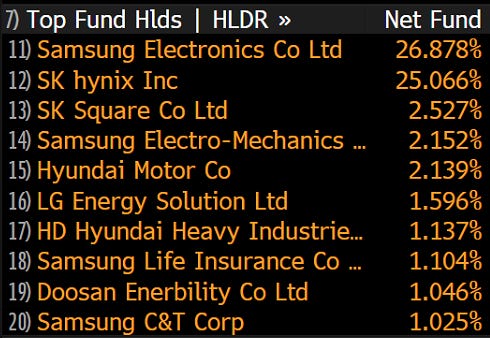
Both stocks are semiconductor companies, hence the index represents another proxy to this industry.
Now, after an ugly, long-winded bear market of over four years, the KOSPI is now up 270% in a bit over a year and up 70% over the past two months alone!
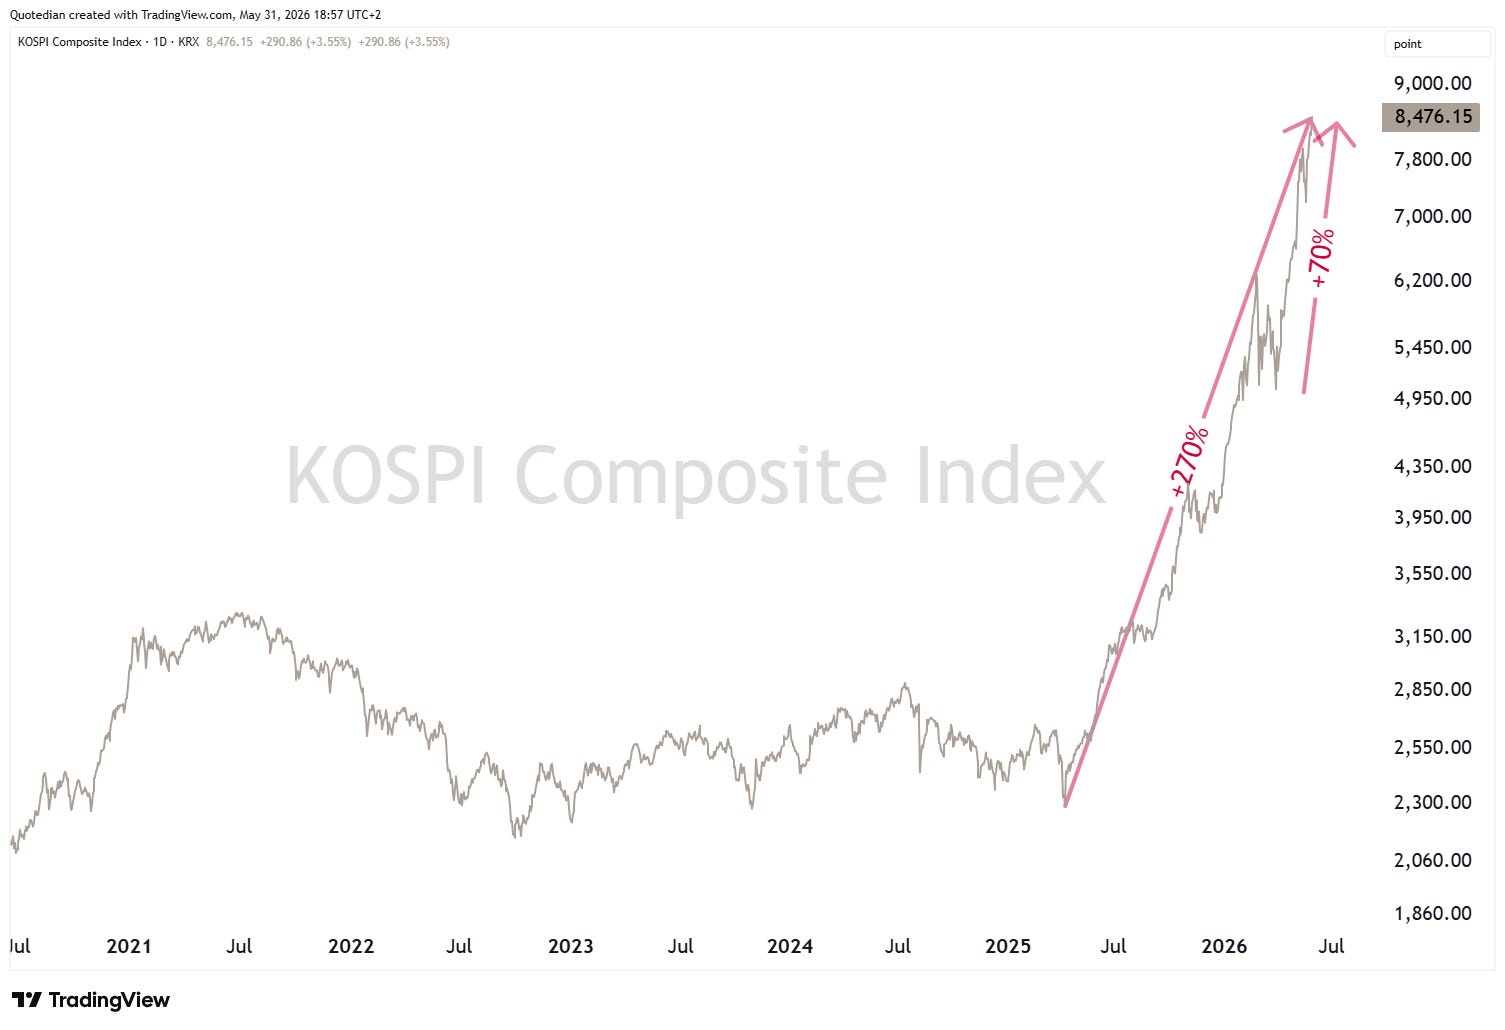
Surely this must be THE top now soon? A top is likely, but THE top, i am not so sure, given that the KOSPI is only now breaking out against the MSCI World after 37-years of underperformance:
Finally, to finish our already longer-than-planned intro section, a few more ‘stunning’ chip-related charts:
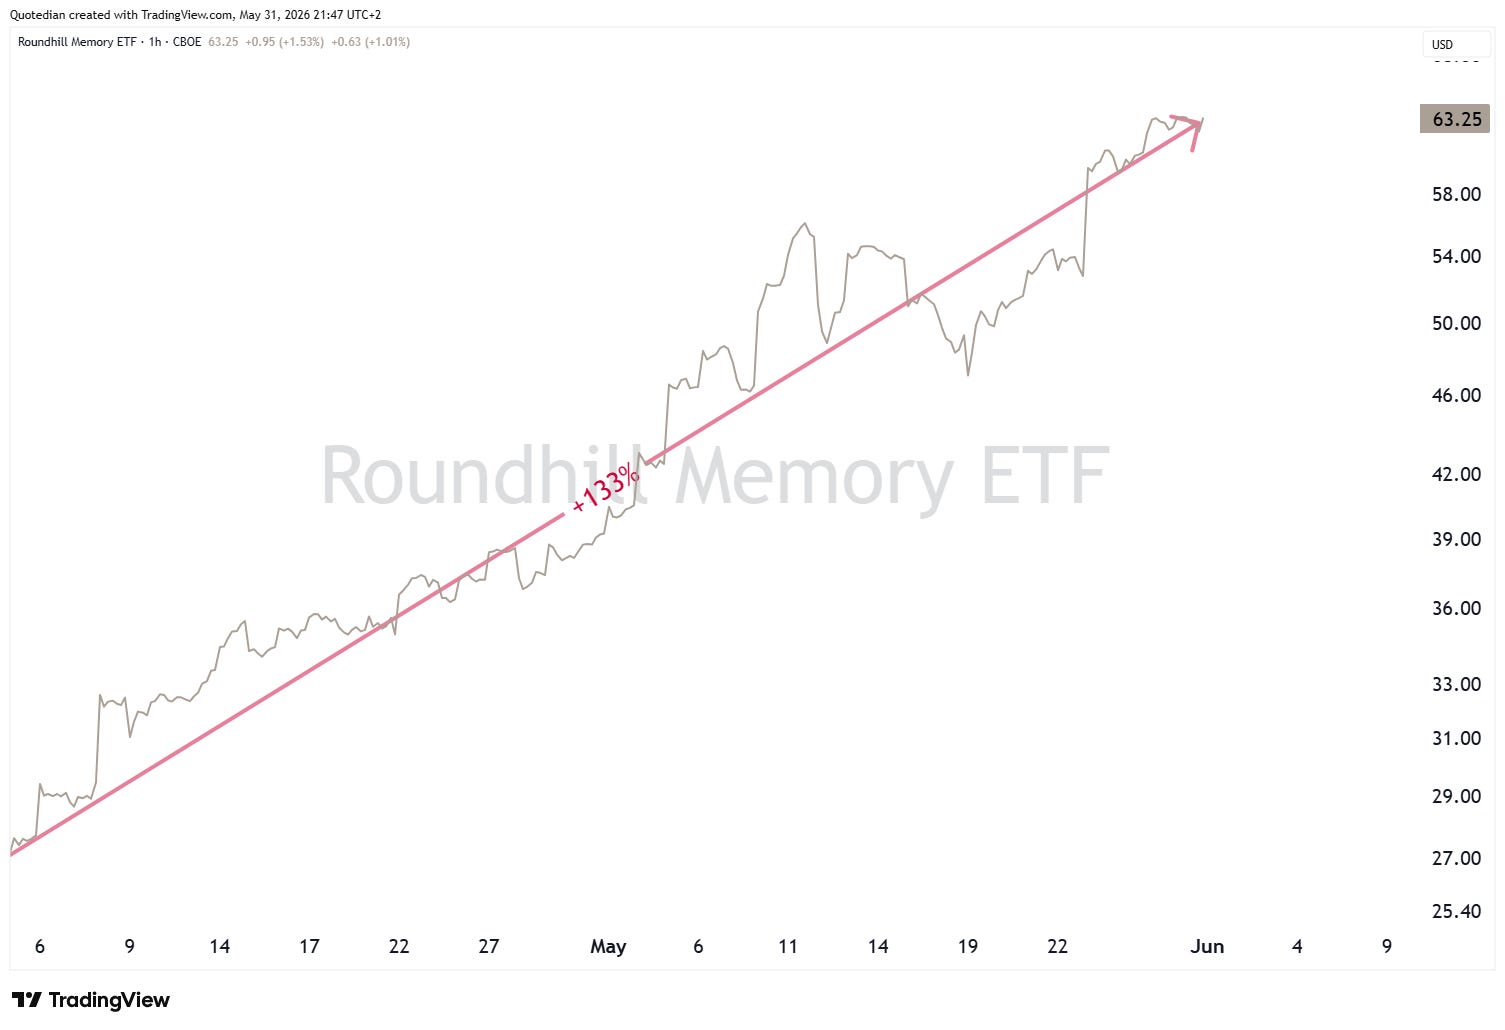
The Roundhill Memory ETF launched on April 2nd (yes, this year) and was up 133% by last Friday:
But maybe even more impressive than that doubling and then some is the growth in AuMs of the ETF:
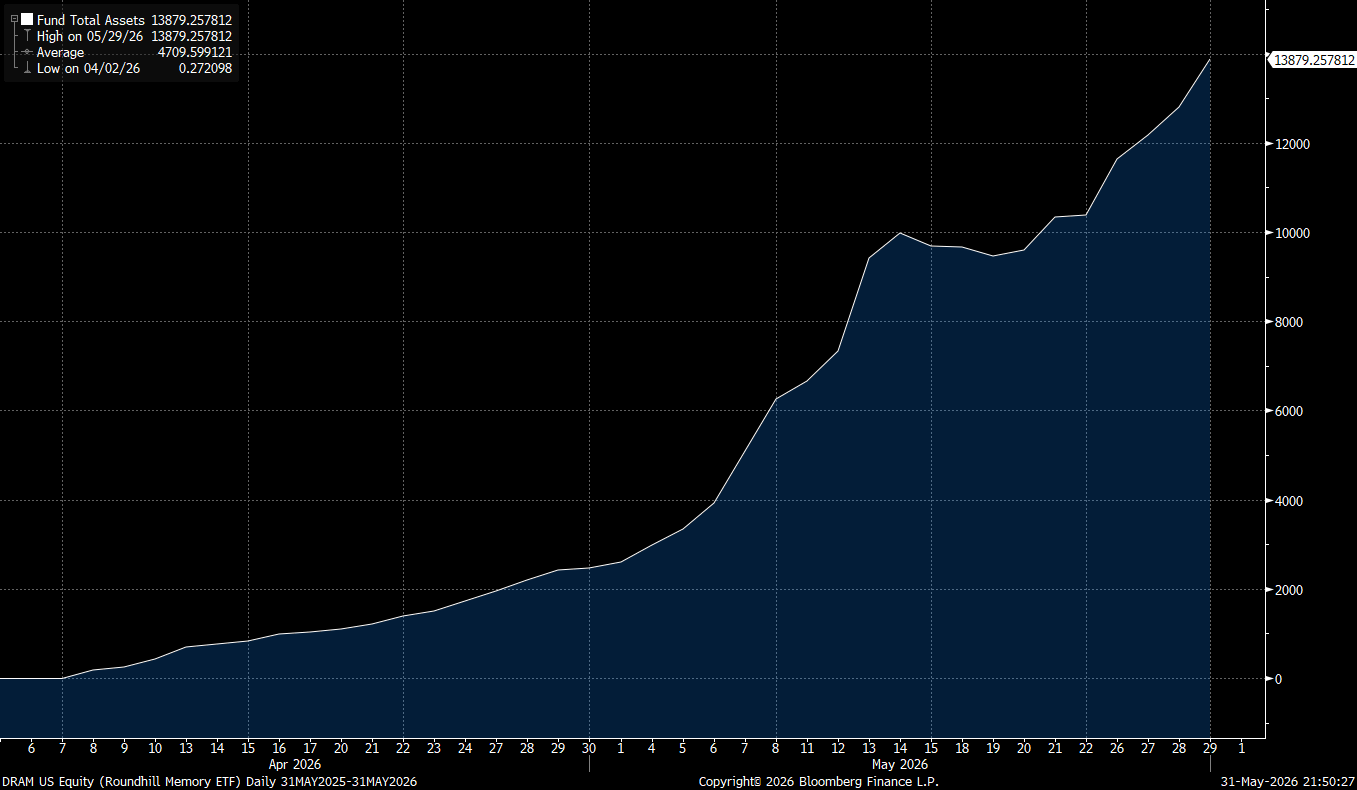
Starting with around USD20 million in assets, the Fund’s total assets were just shy of USD14 billion(!) by last Friday.
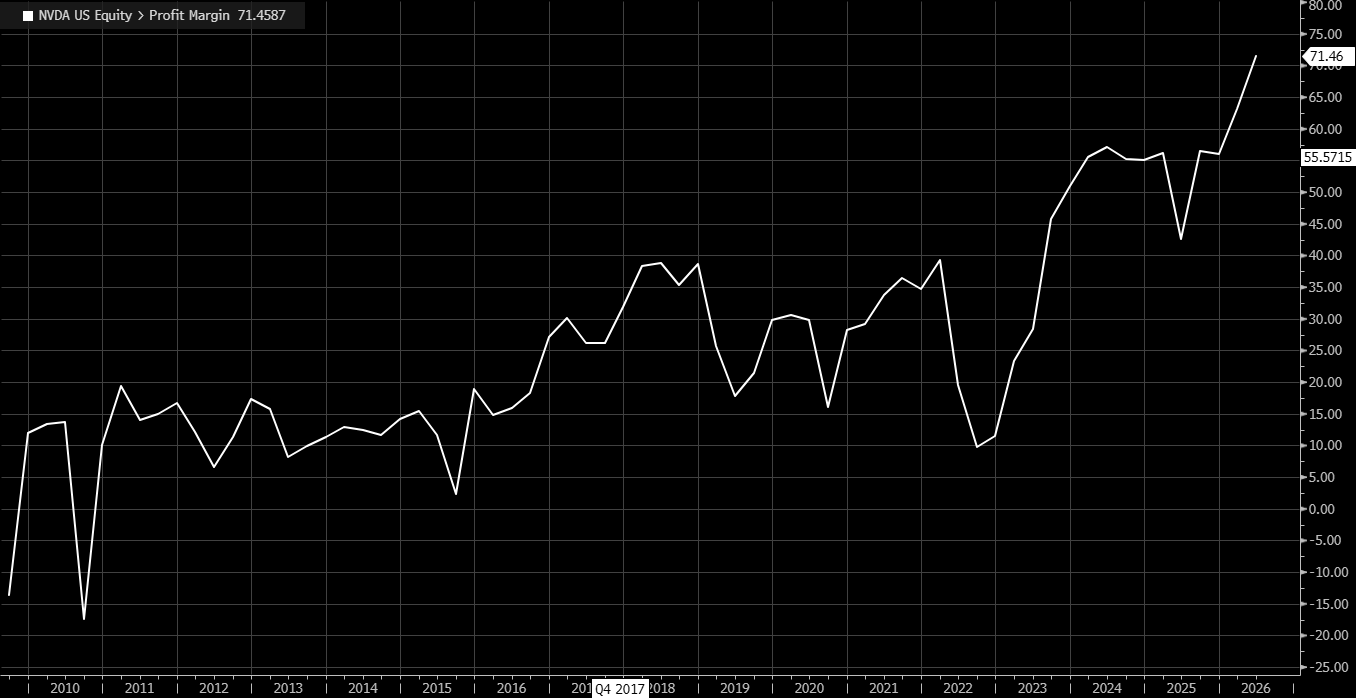
NVIDIA, the poster-child of semiconductor companies and the AI roll-out is boasting an incredible profit margin of 71%!
Staying with NVIDIA, the company stands in a league of its own when it comes to earnings growth and shareholder returns over the last decade, as the following fantastic chart from the equally fantastic Charlie Bilello shows:
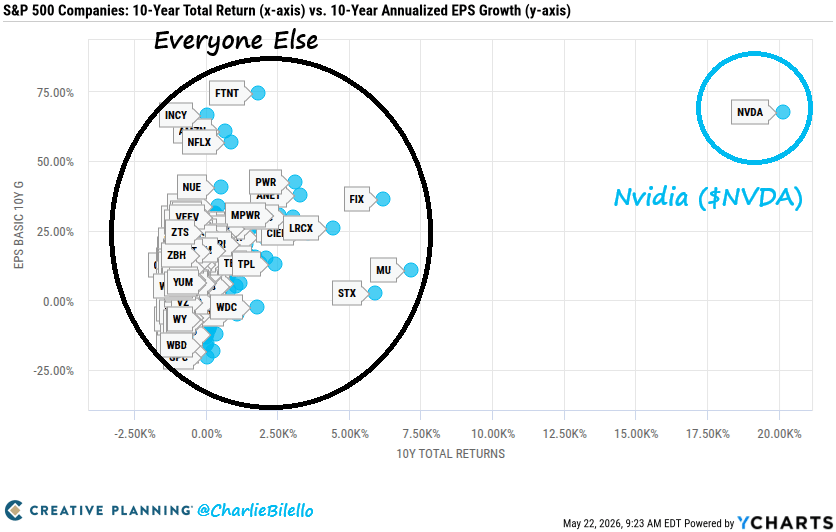
We’ve never seen a company scale this fast at this size.
Sooooo, what will it be? More CHIP, CHIP, Hooray or was that all, folks?
Probably this little GIF out of the Wile E. Coyote universe may be a close parallel of what is happening and may happen:

Time now to make a speed round across the cross-asset macro landscape to see what has been happening during the month just finished…
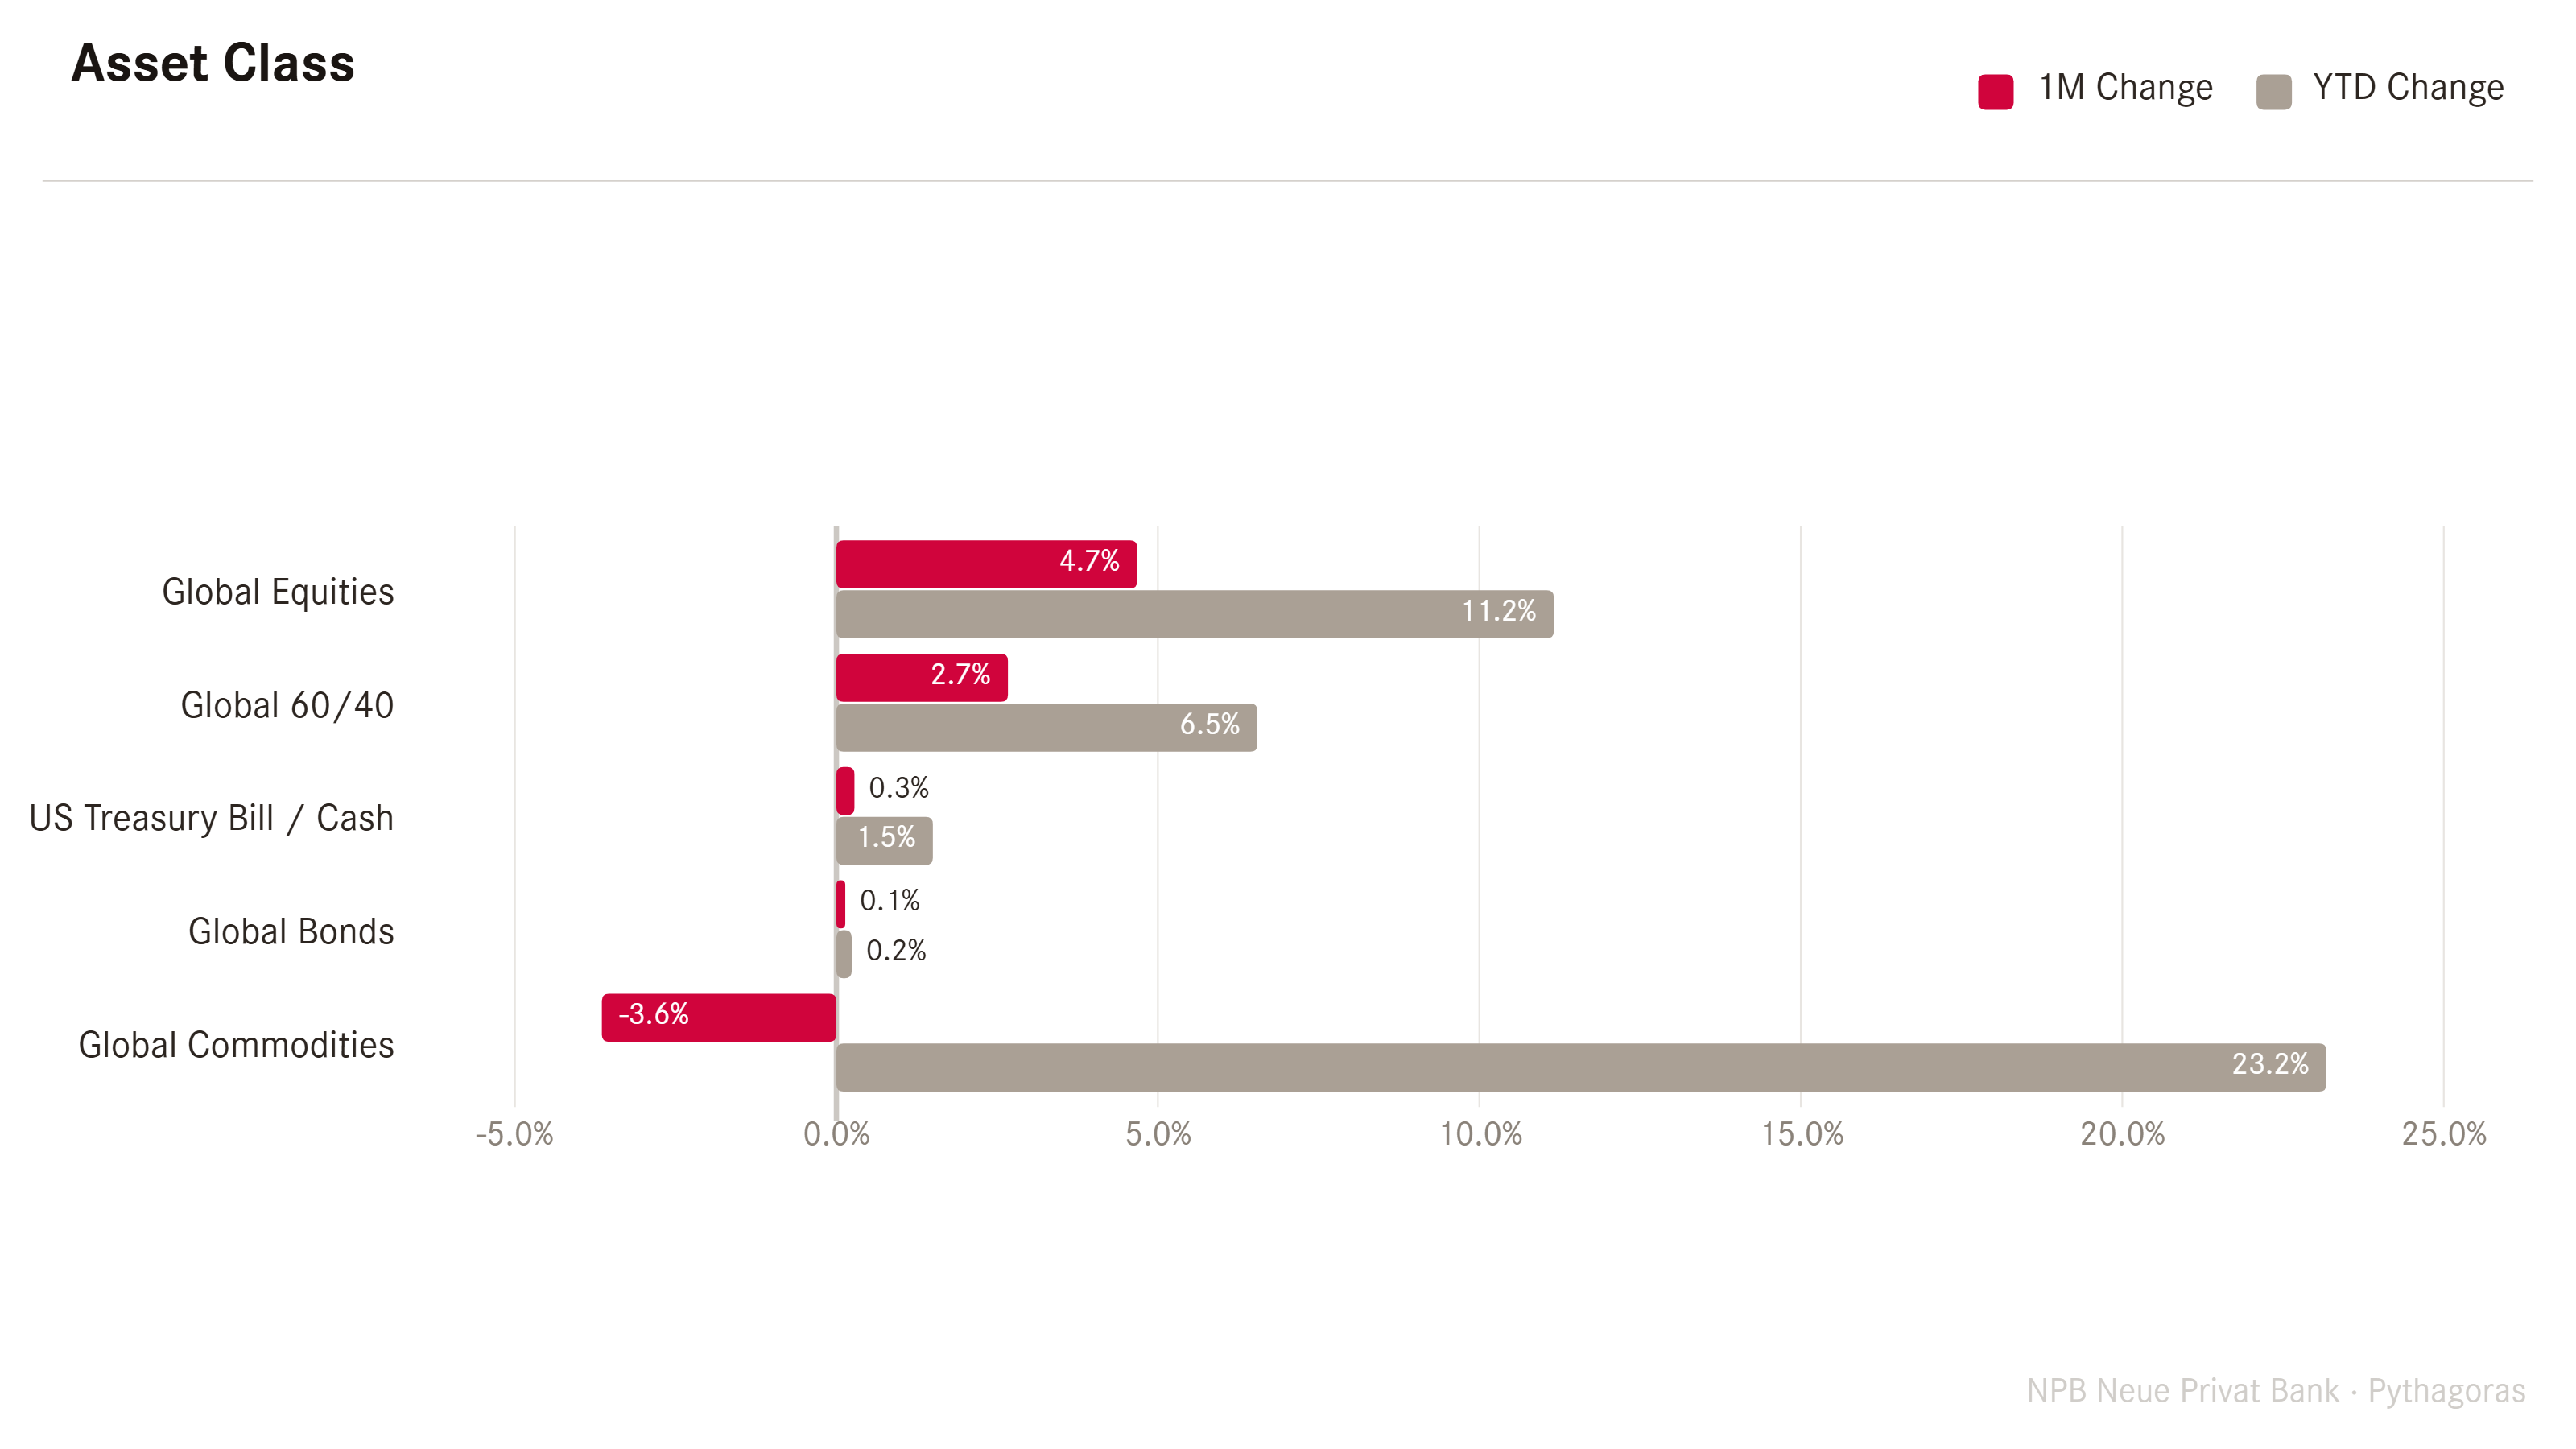
Starting at the top level, global equities were the star performers in May (red), followed by the 60/40 portfolio, whilst commodities made up the back end giving back some of their still massive year-to-date returns (grey):
Shifting into the equity asset class, here are the performances of the most widely followed benchmark indices around the globe:
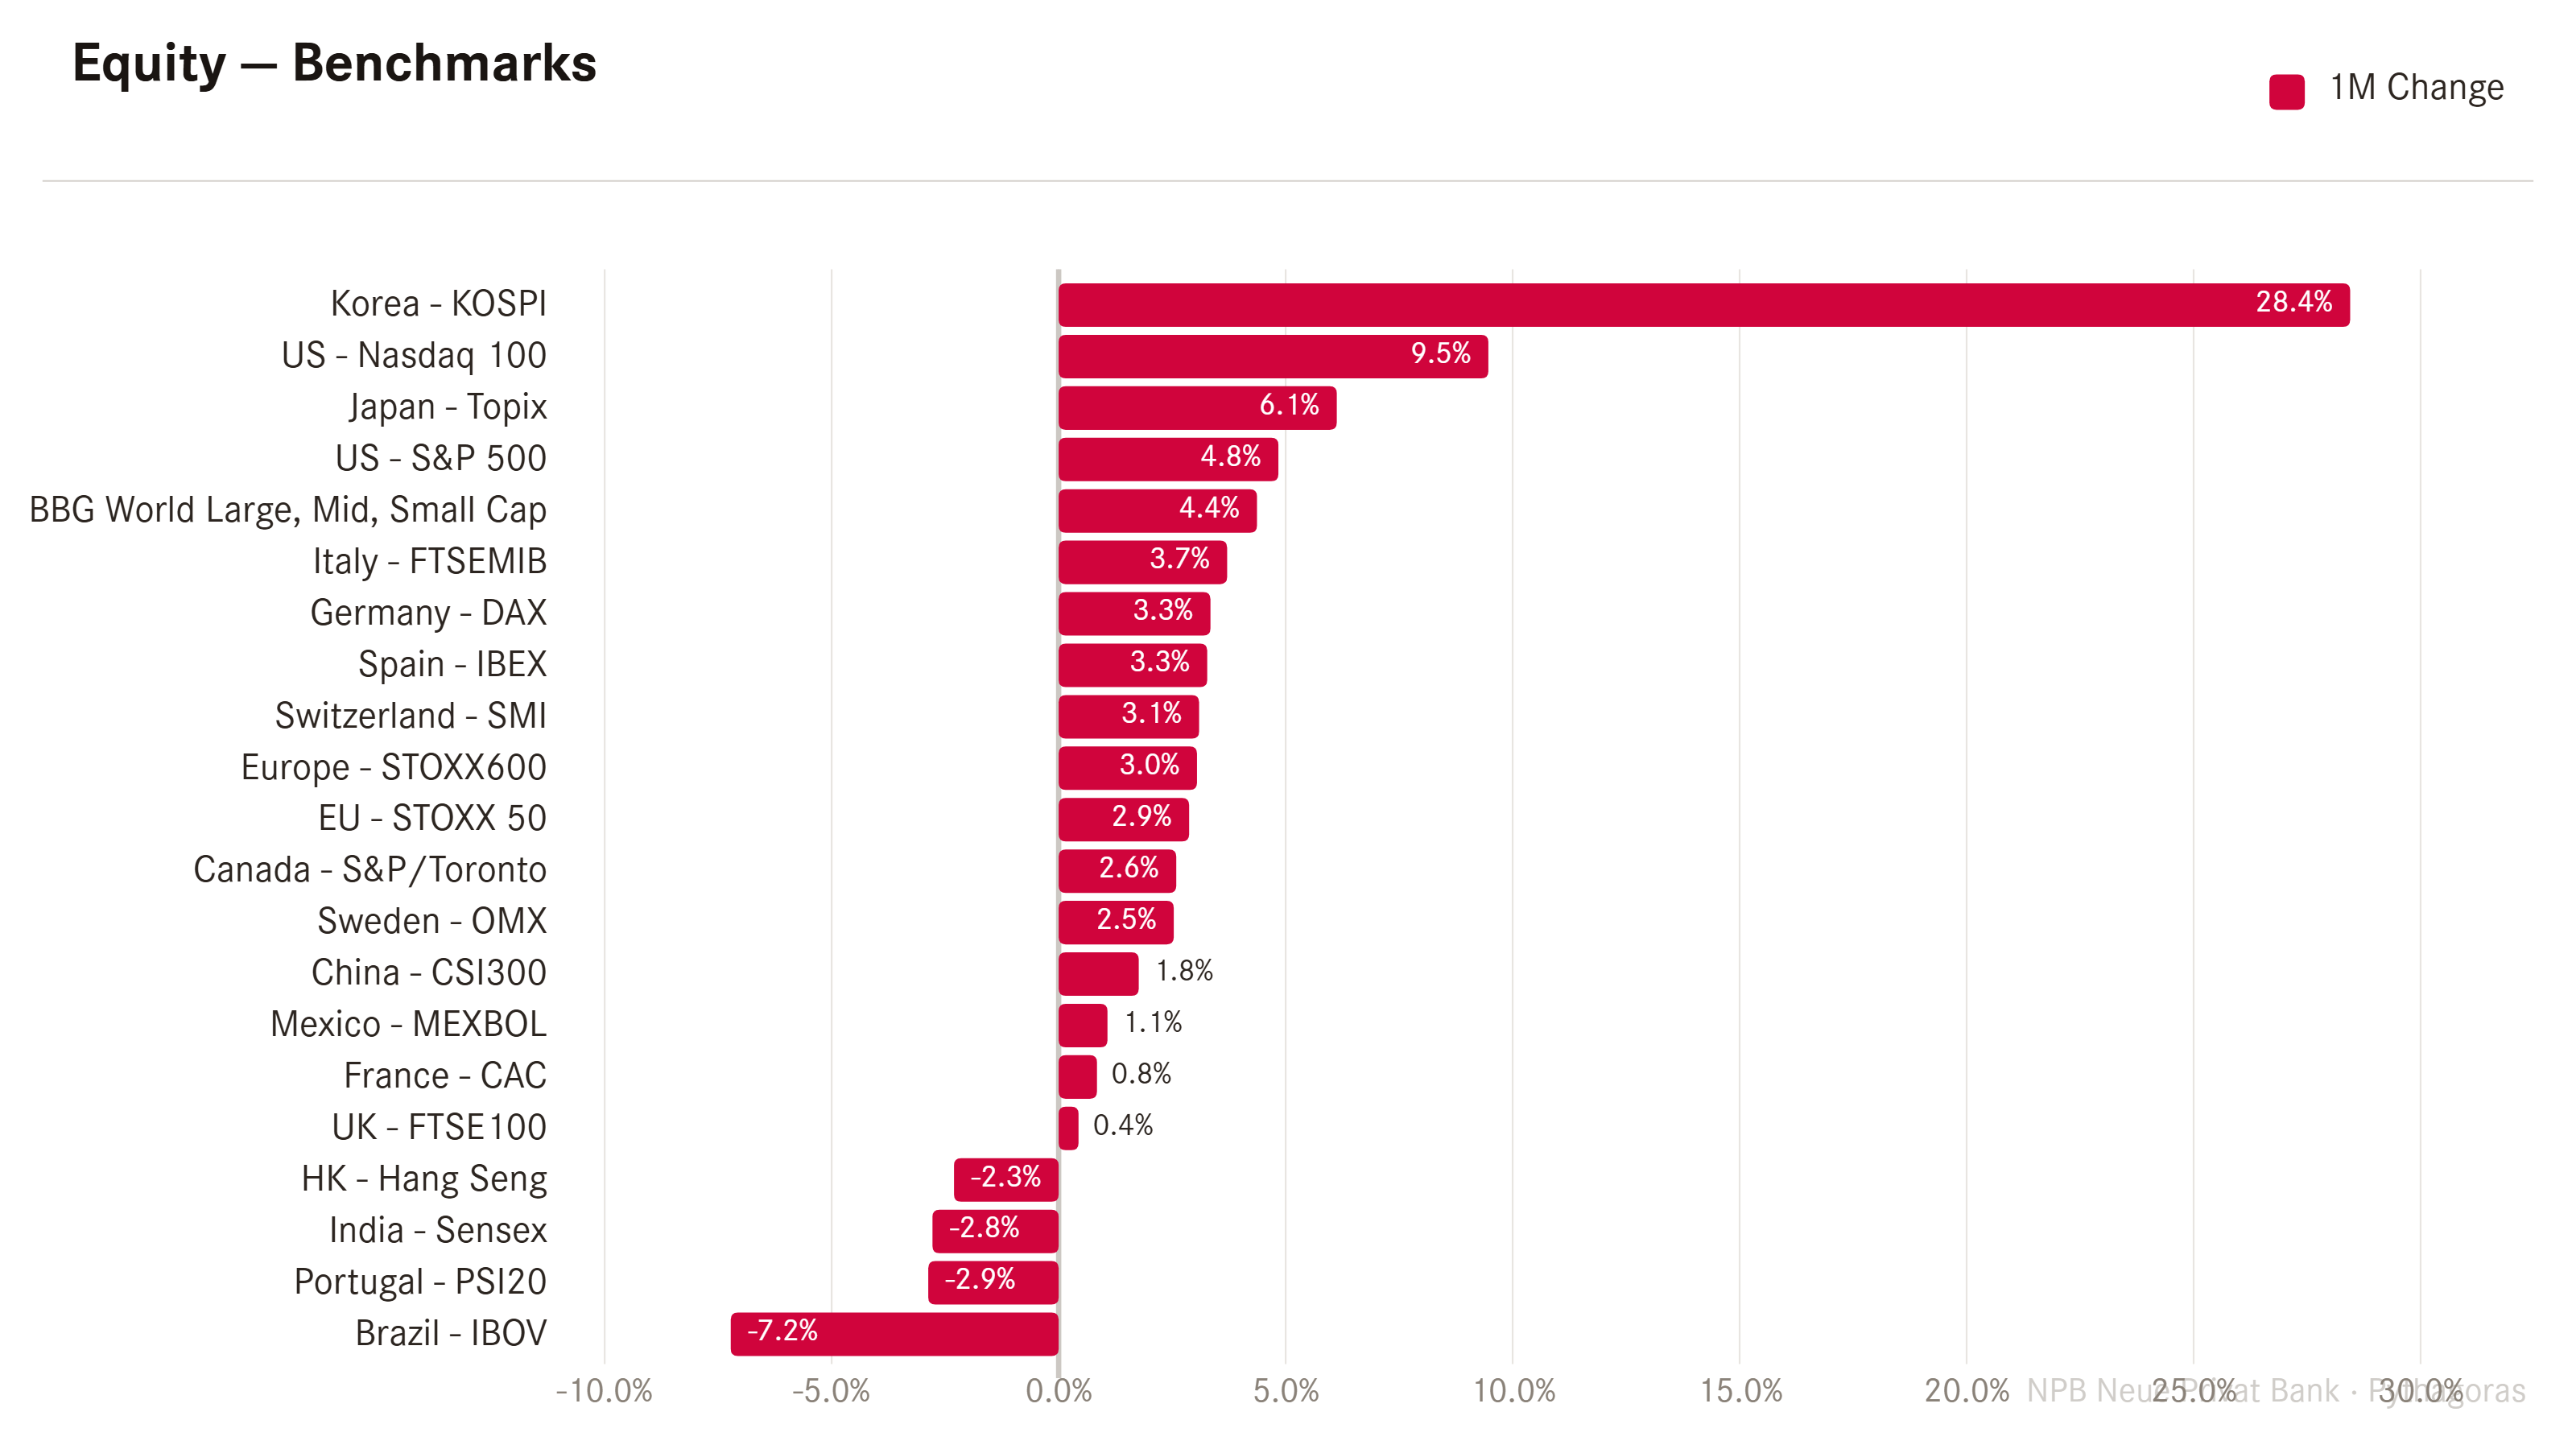
The previously discussed KOSPI and Nasdaq indices stand out as the top performers in May, whilst Brazil, after a strong rally in the preceding months, has started to correct more meaningfully, mostly based on political shift regarding the upcoming presidential elections. India continues to disappoint.
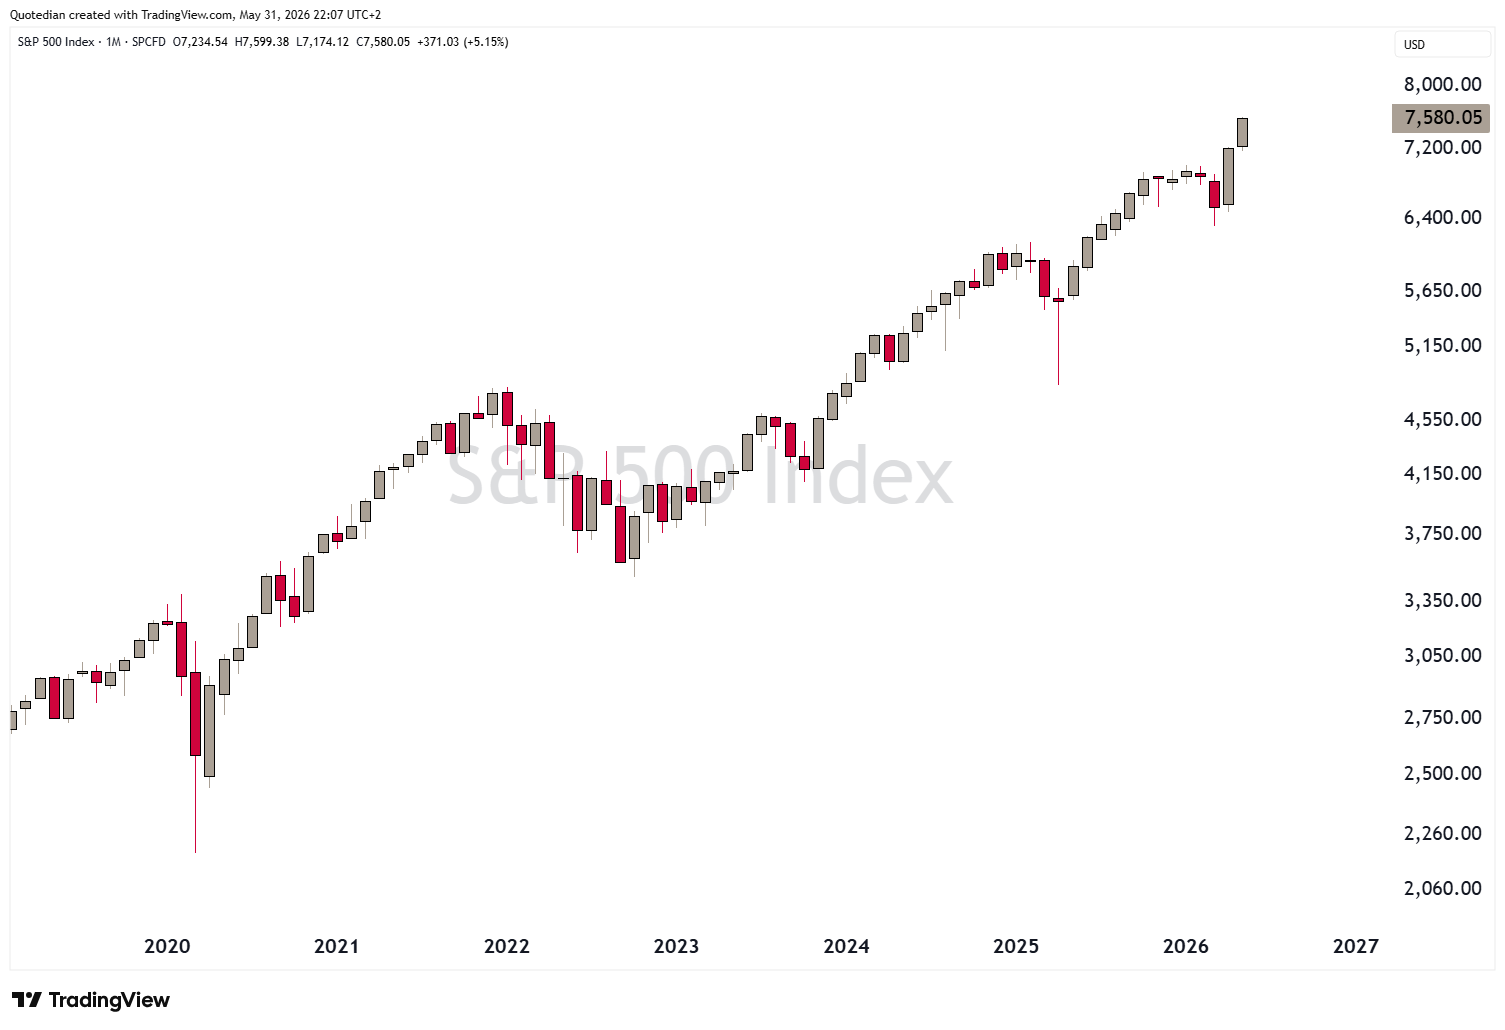
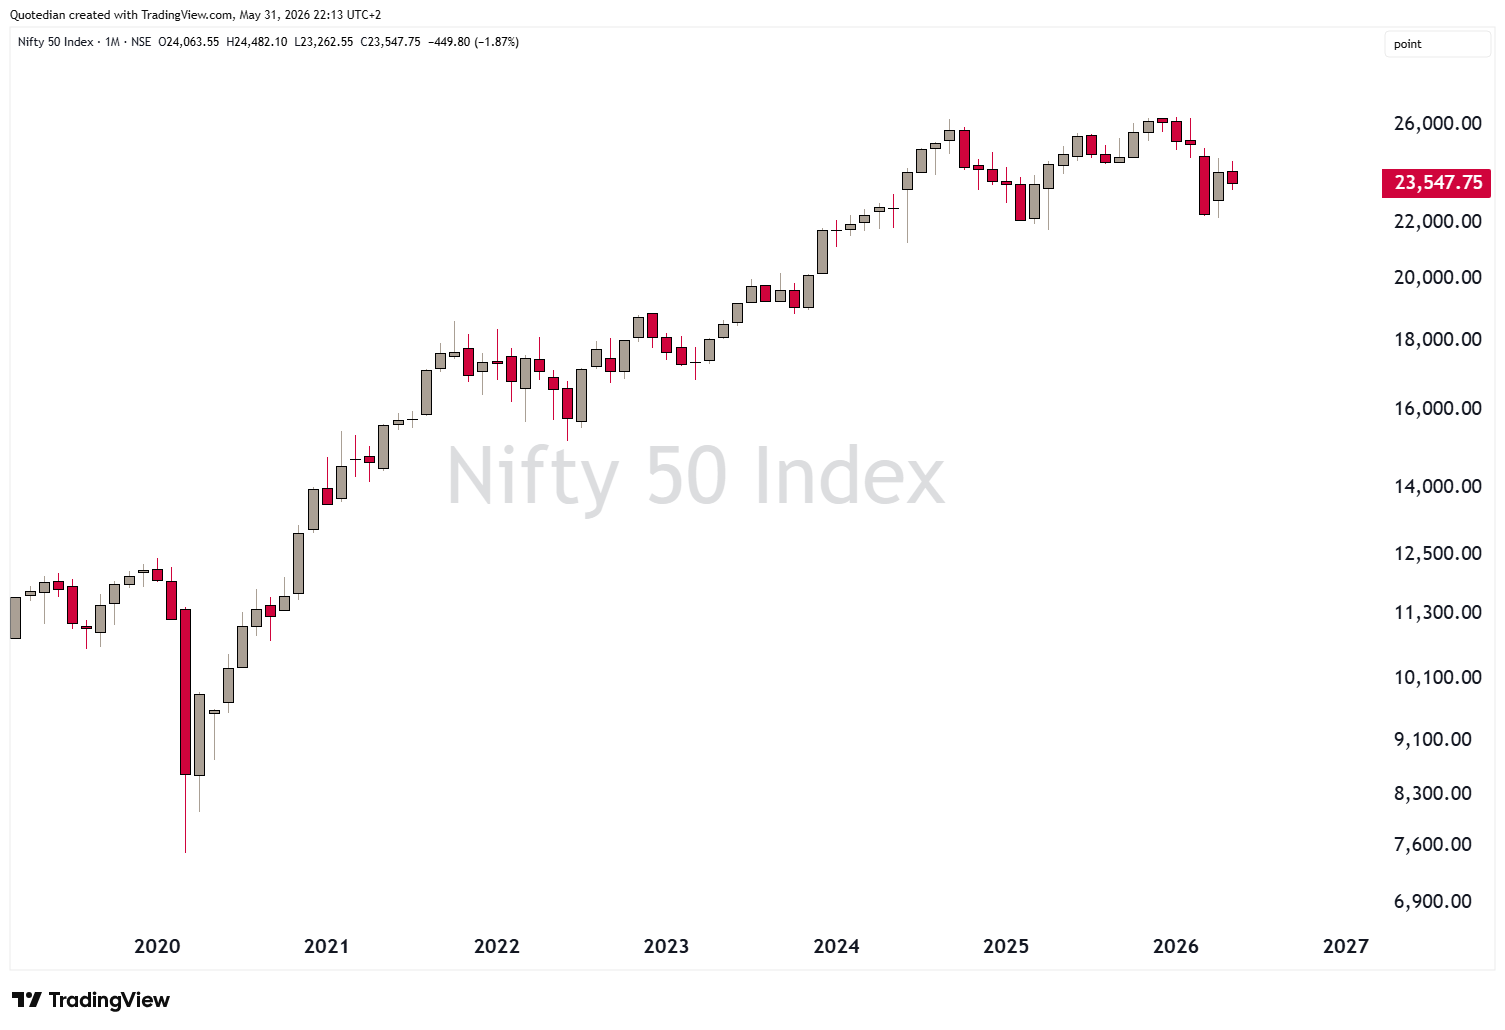
There’s really nothing to argue with concerning that secular uptrend in the S&P 500, nicely depicted in the monthly chart below:
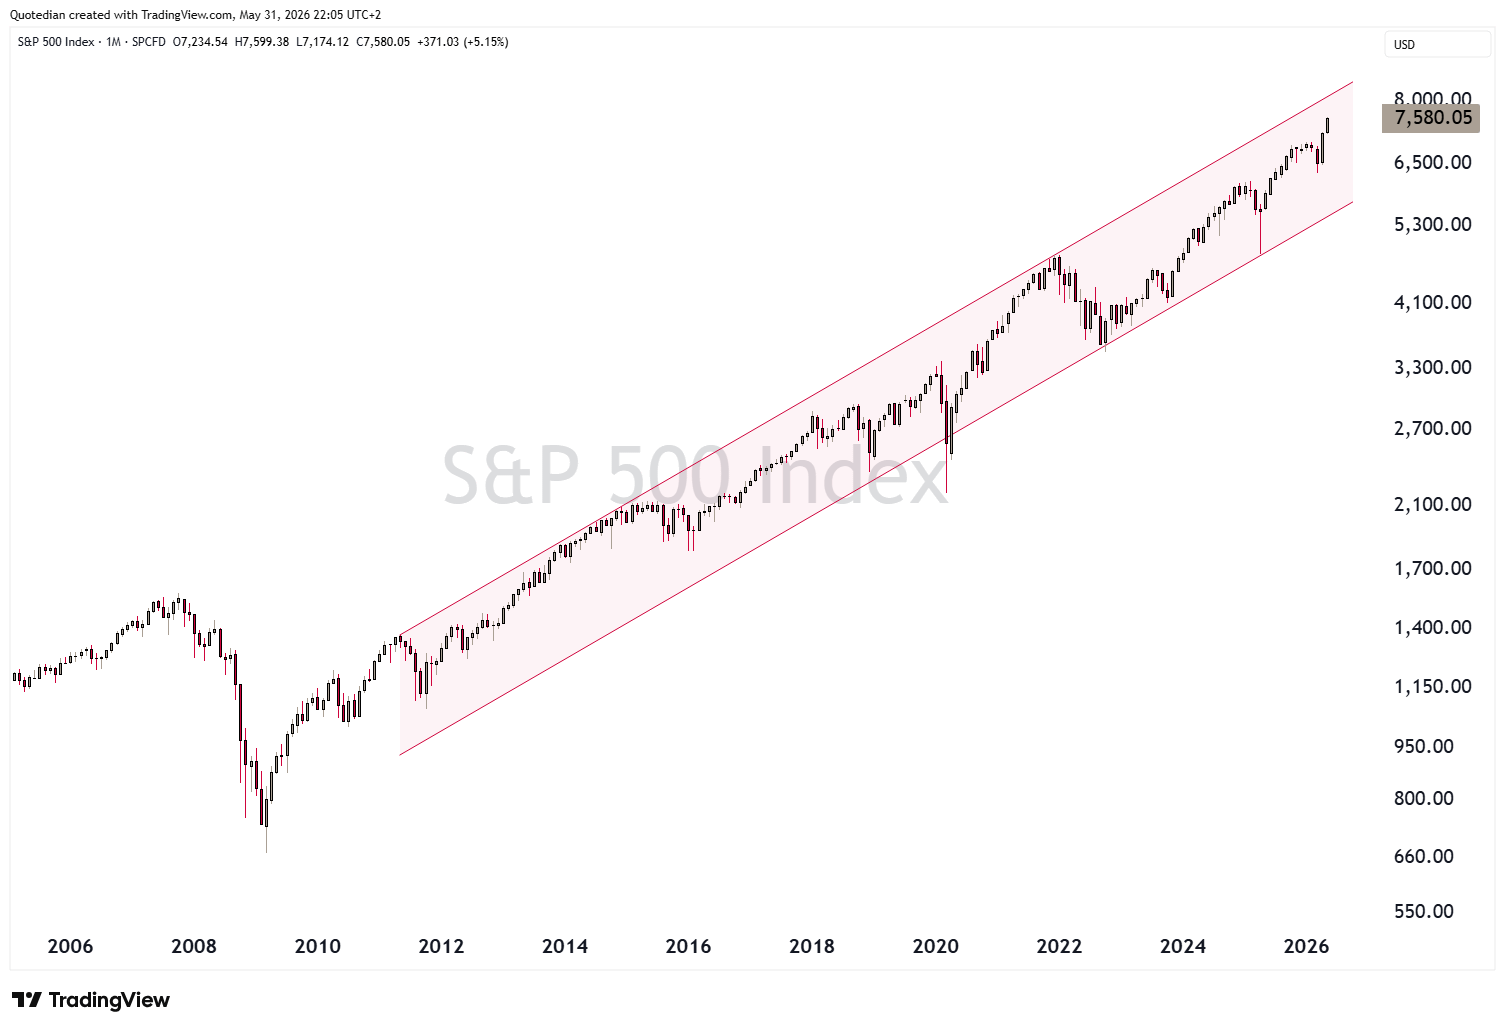
The S&P 500 closed at a new ATH on Friday, and hence, the monthly candle also ended at its very upper end, which is not bearish as investors continue to crave to be invested:
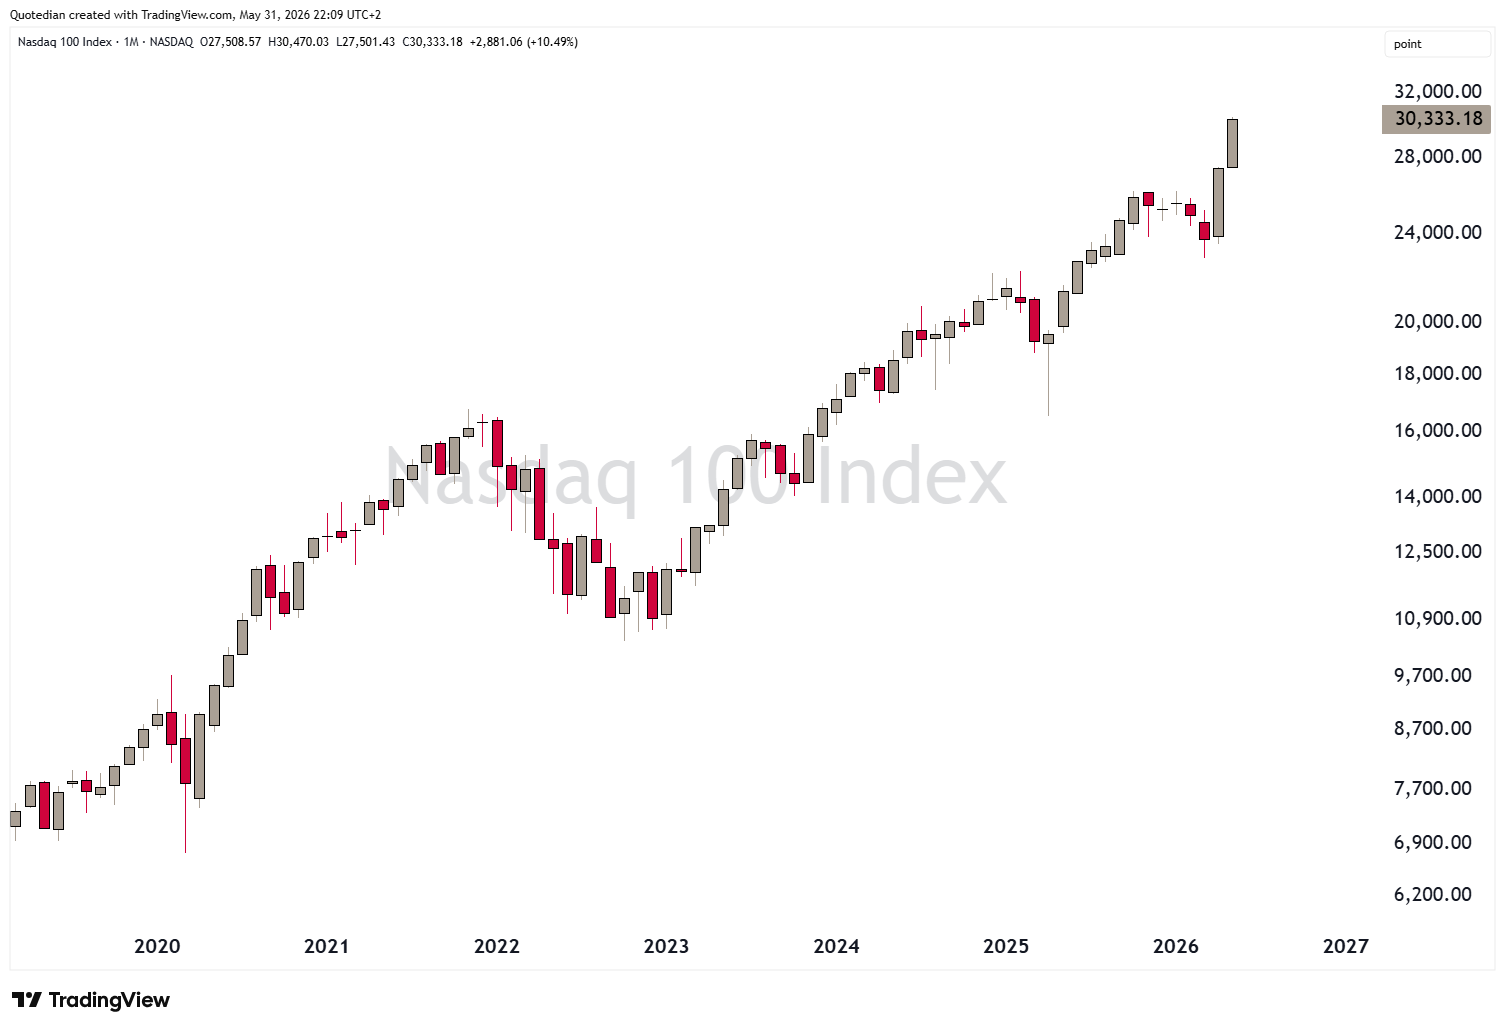
The same (Friday ATH close) was true for the NASDAQ,
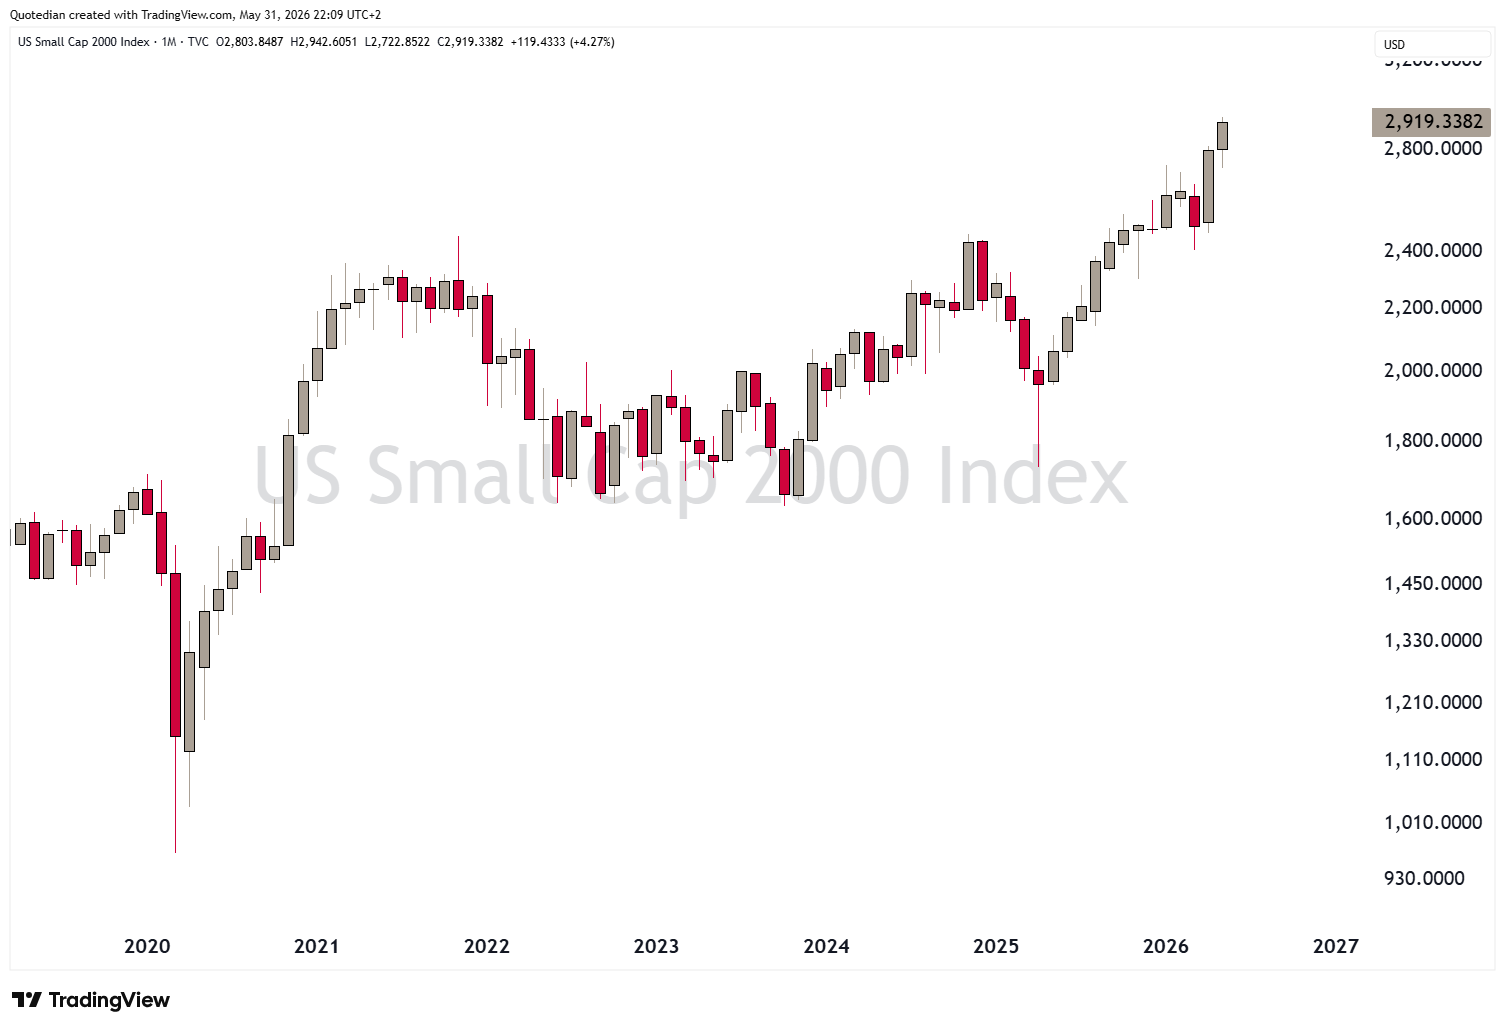
and the Russell 2000 small cap indices:
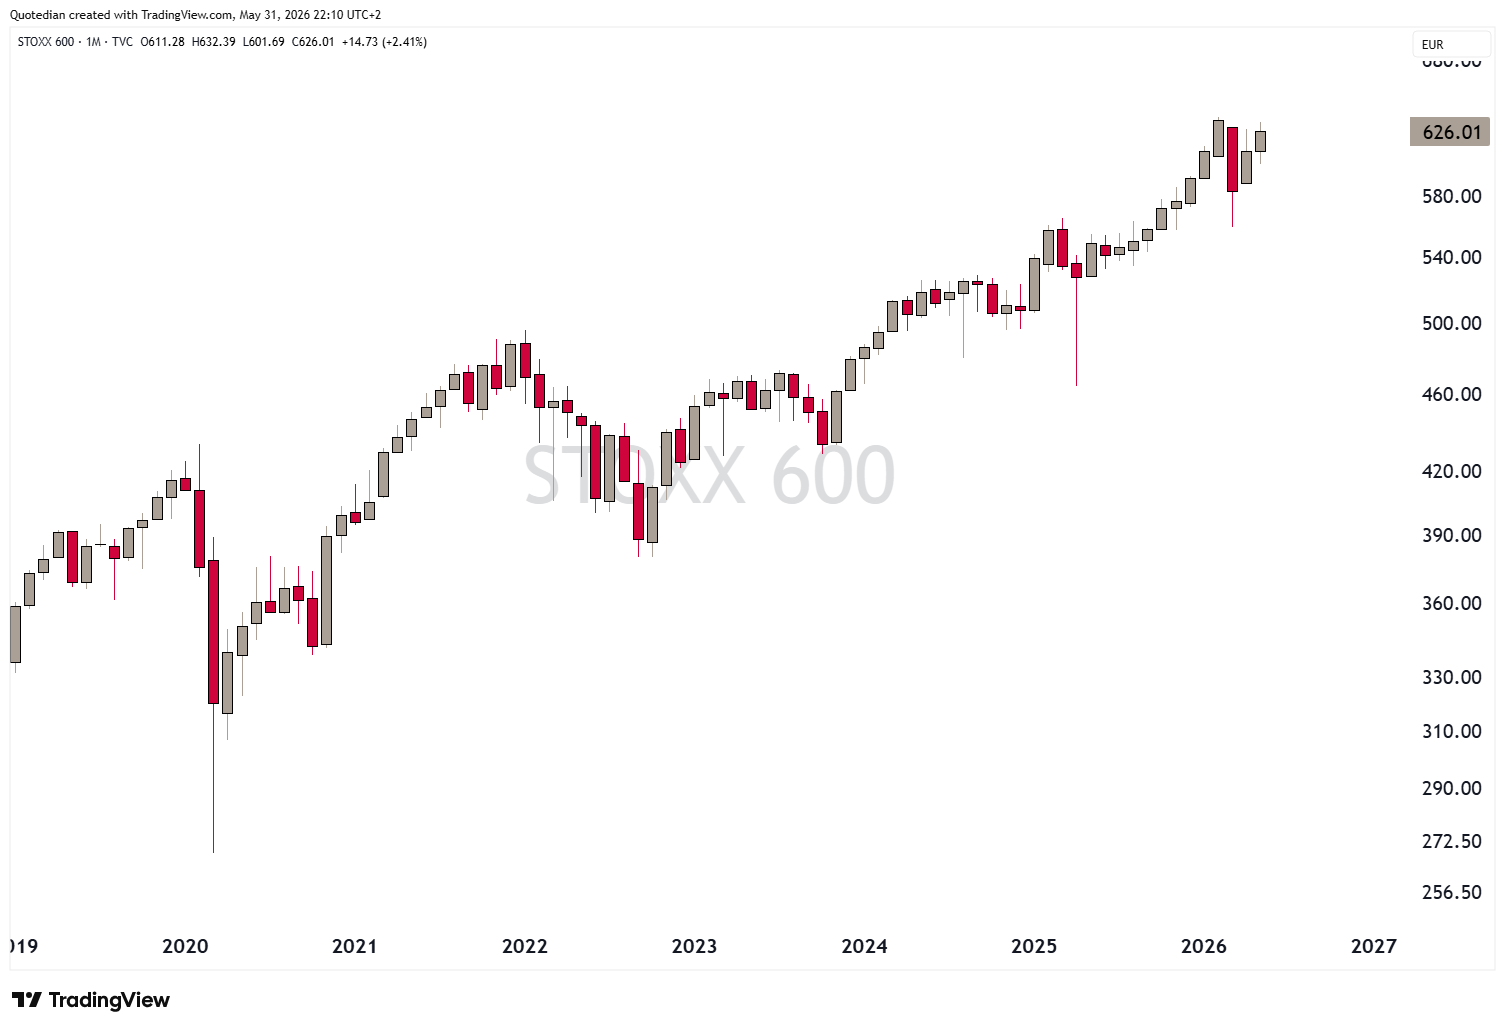
In Europe, a new ATH was not achieved neither on the broad SXXP,
nor on the narrower SXXE:
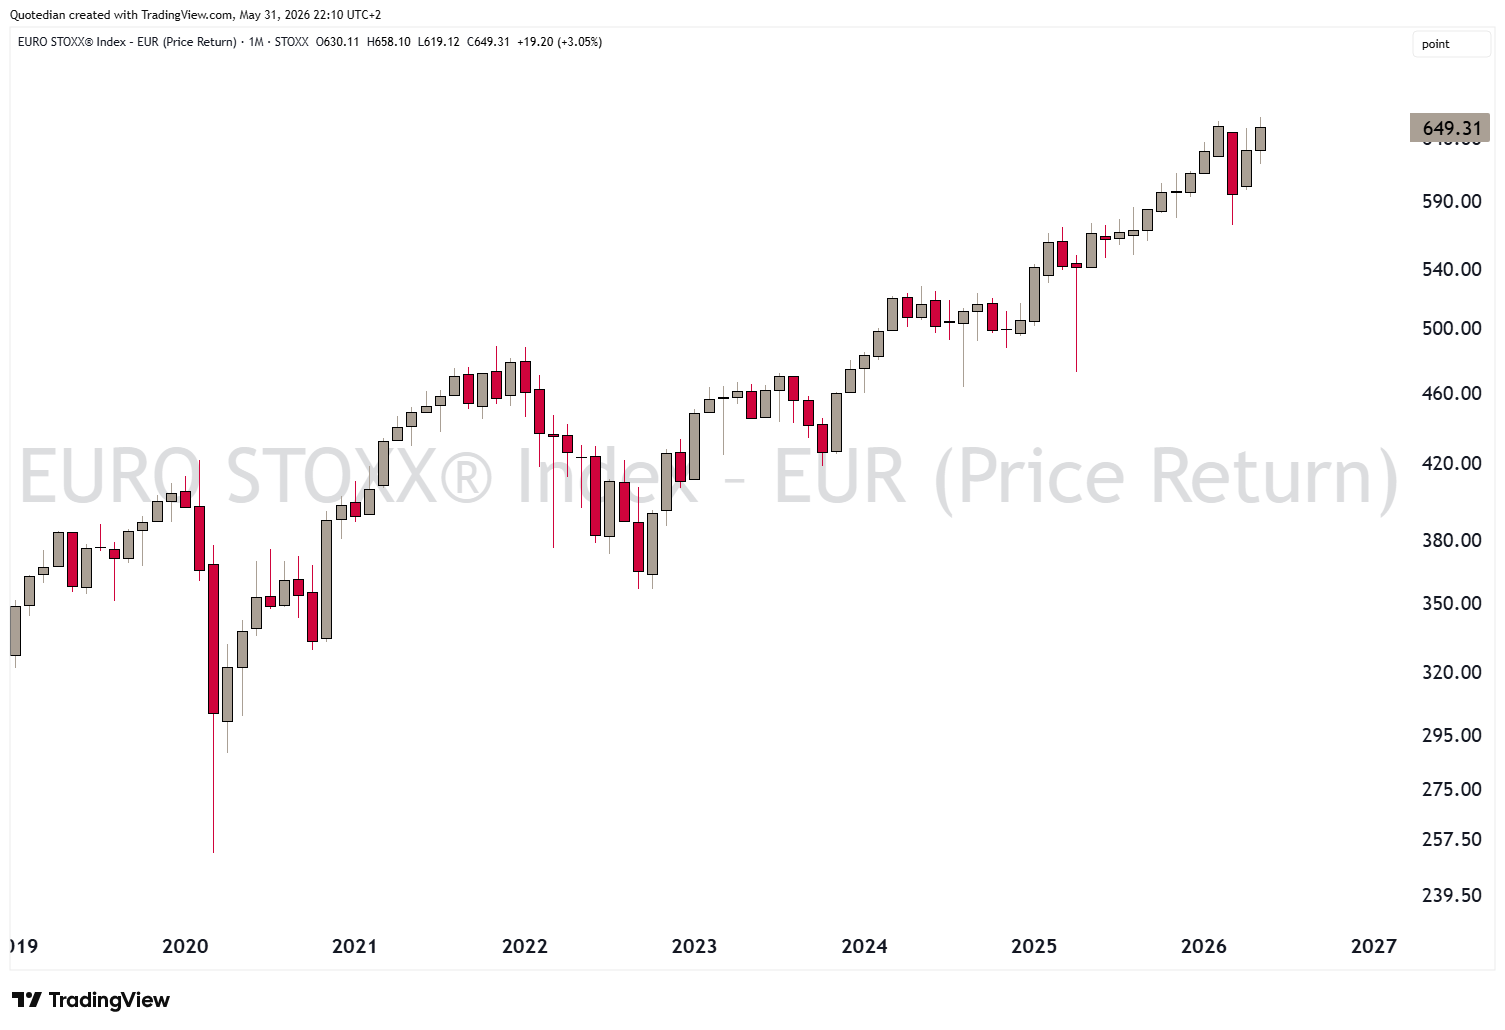
Though both indices are close to reaching those new ATH targets and are looking substantially more constructive now thanks to a late-month rally.
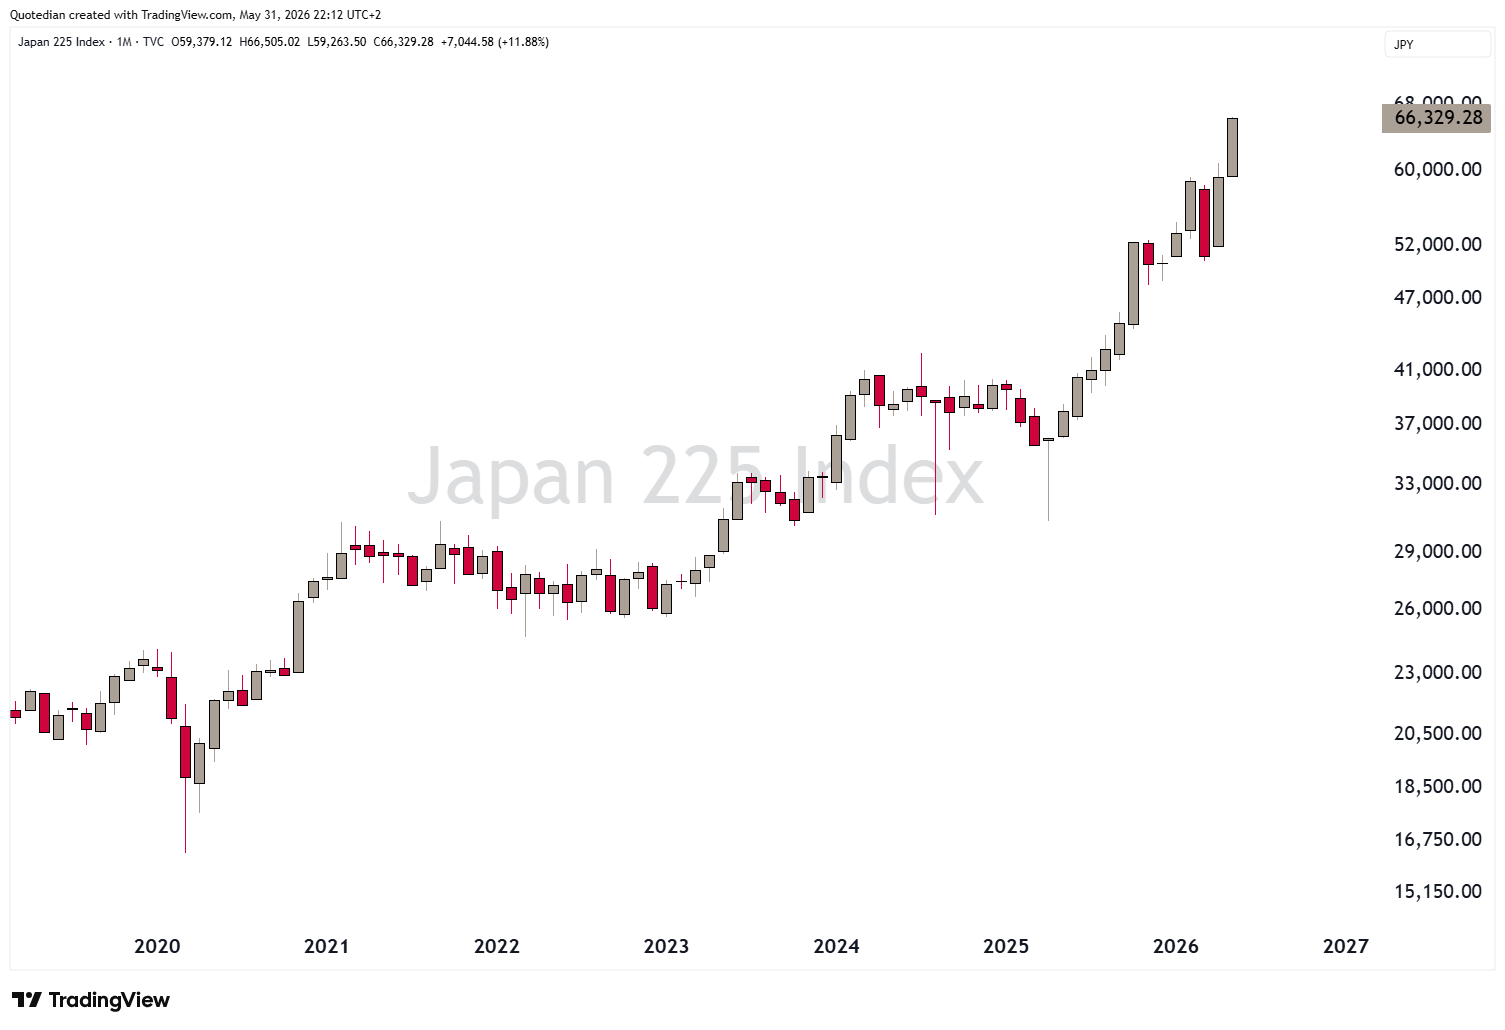
In Asia, Japan’s Nikkei index …. well, check for yourself:
In China, Mainland stocks (CSI300),
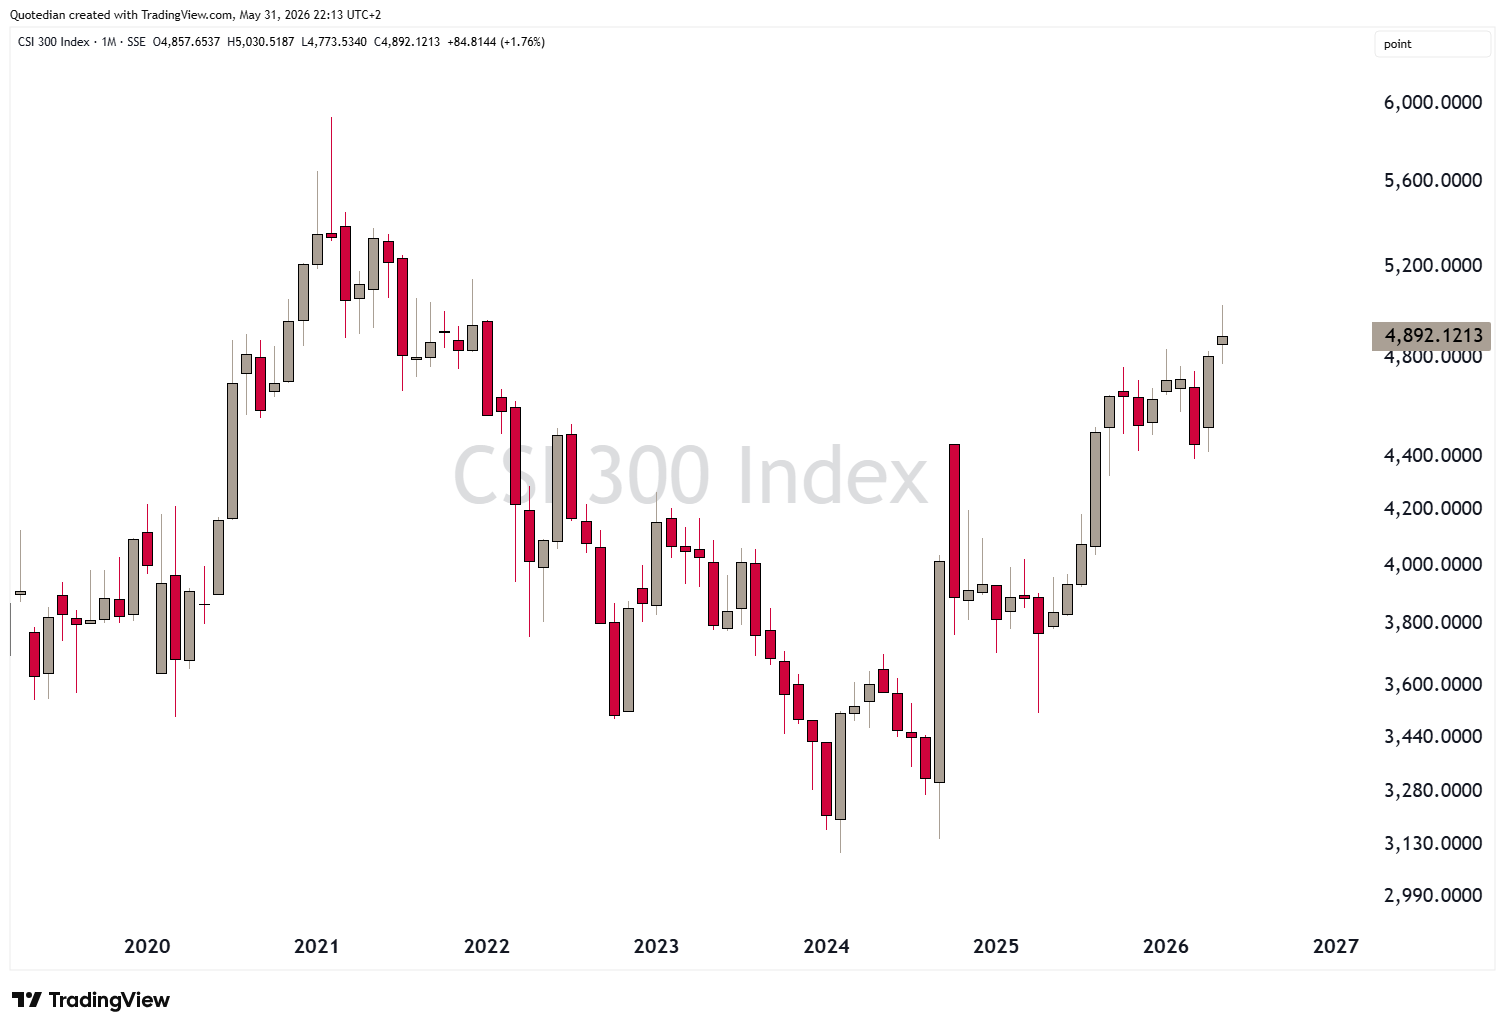
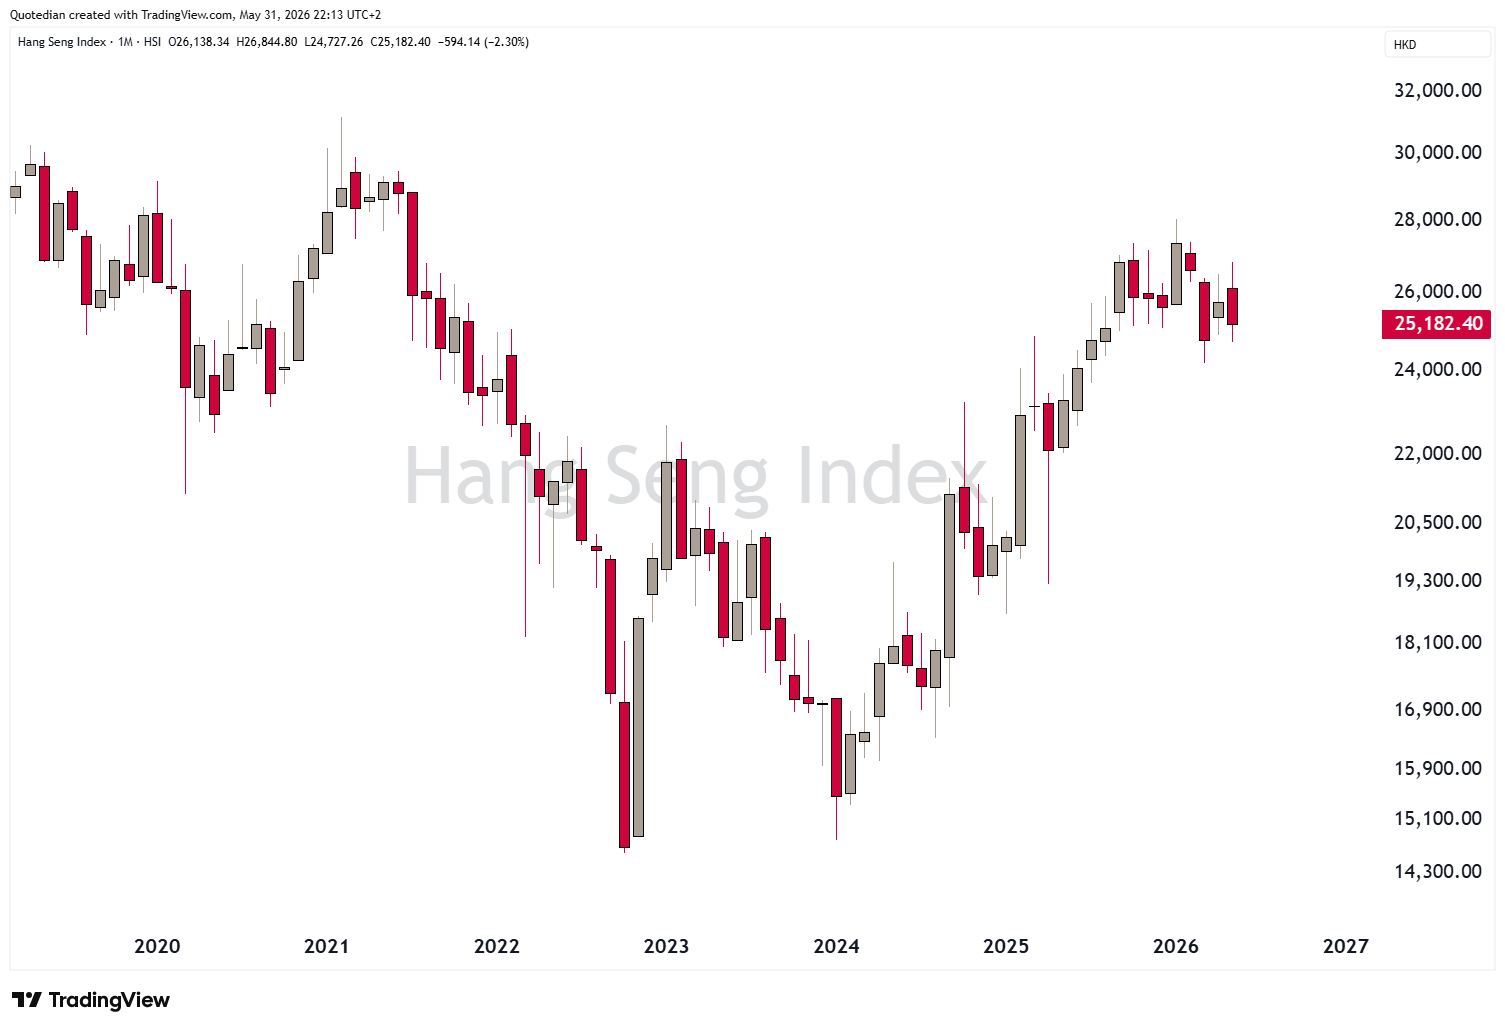
seem to do better than their Hong Kong comrades:
India continues in its sideway consolidation/correction:
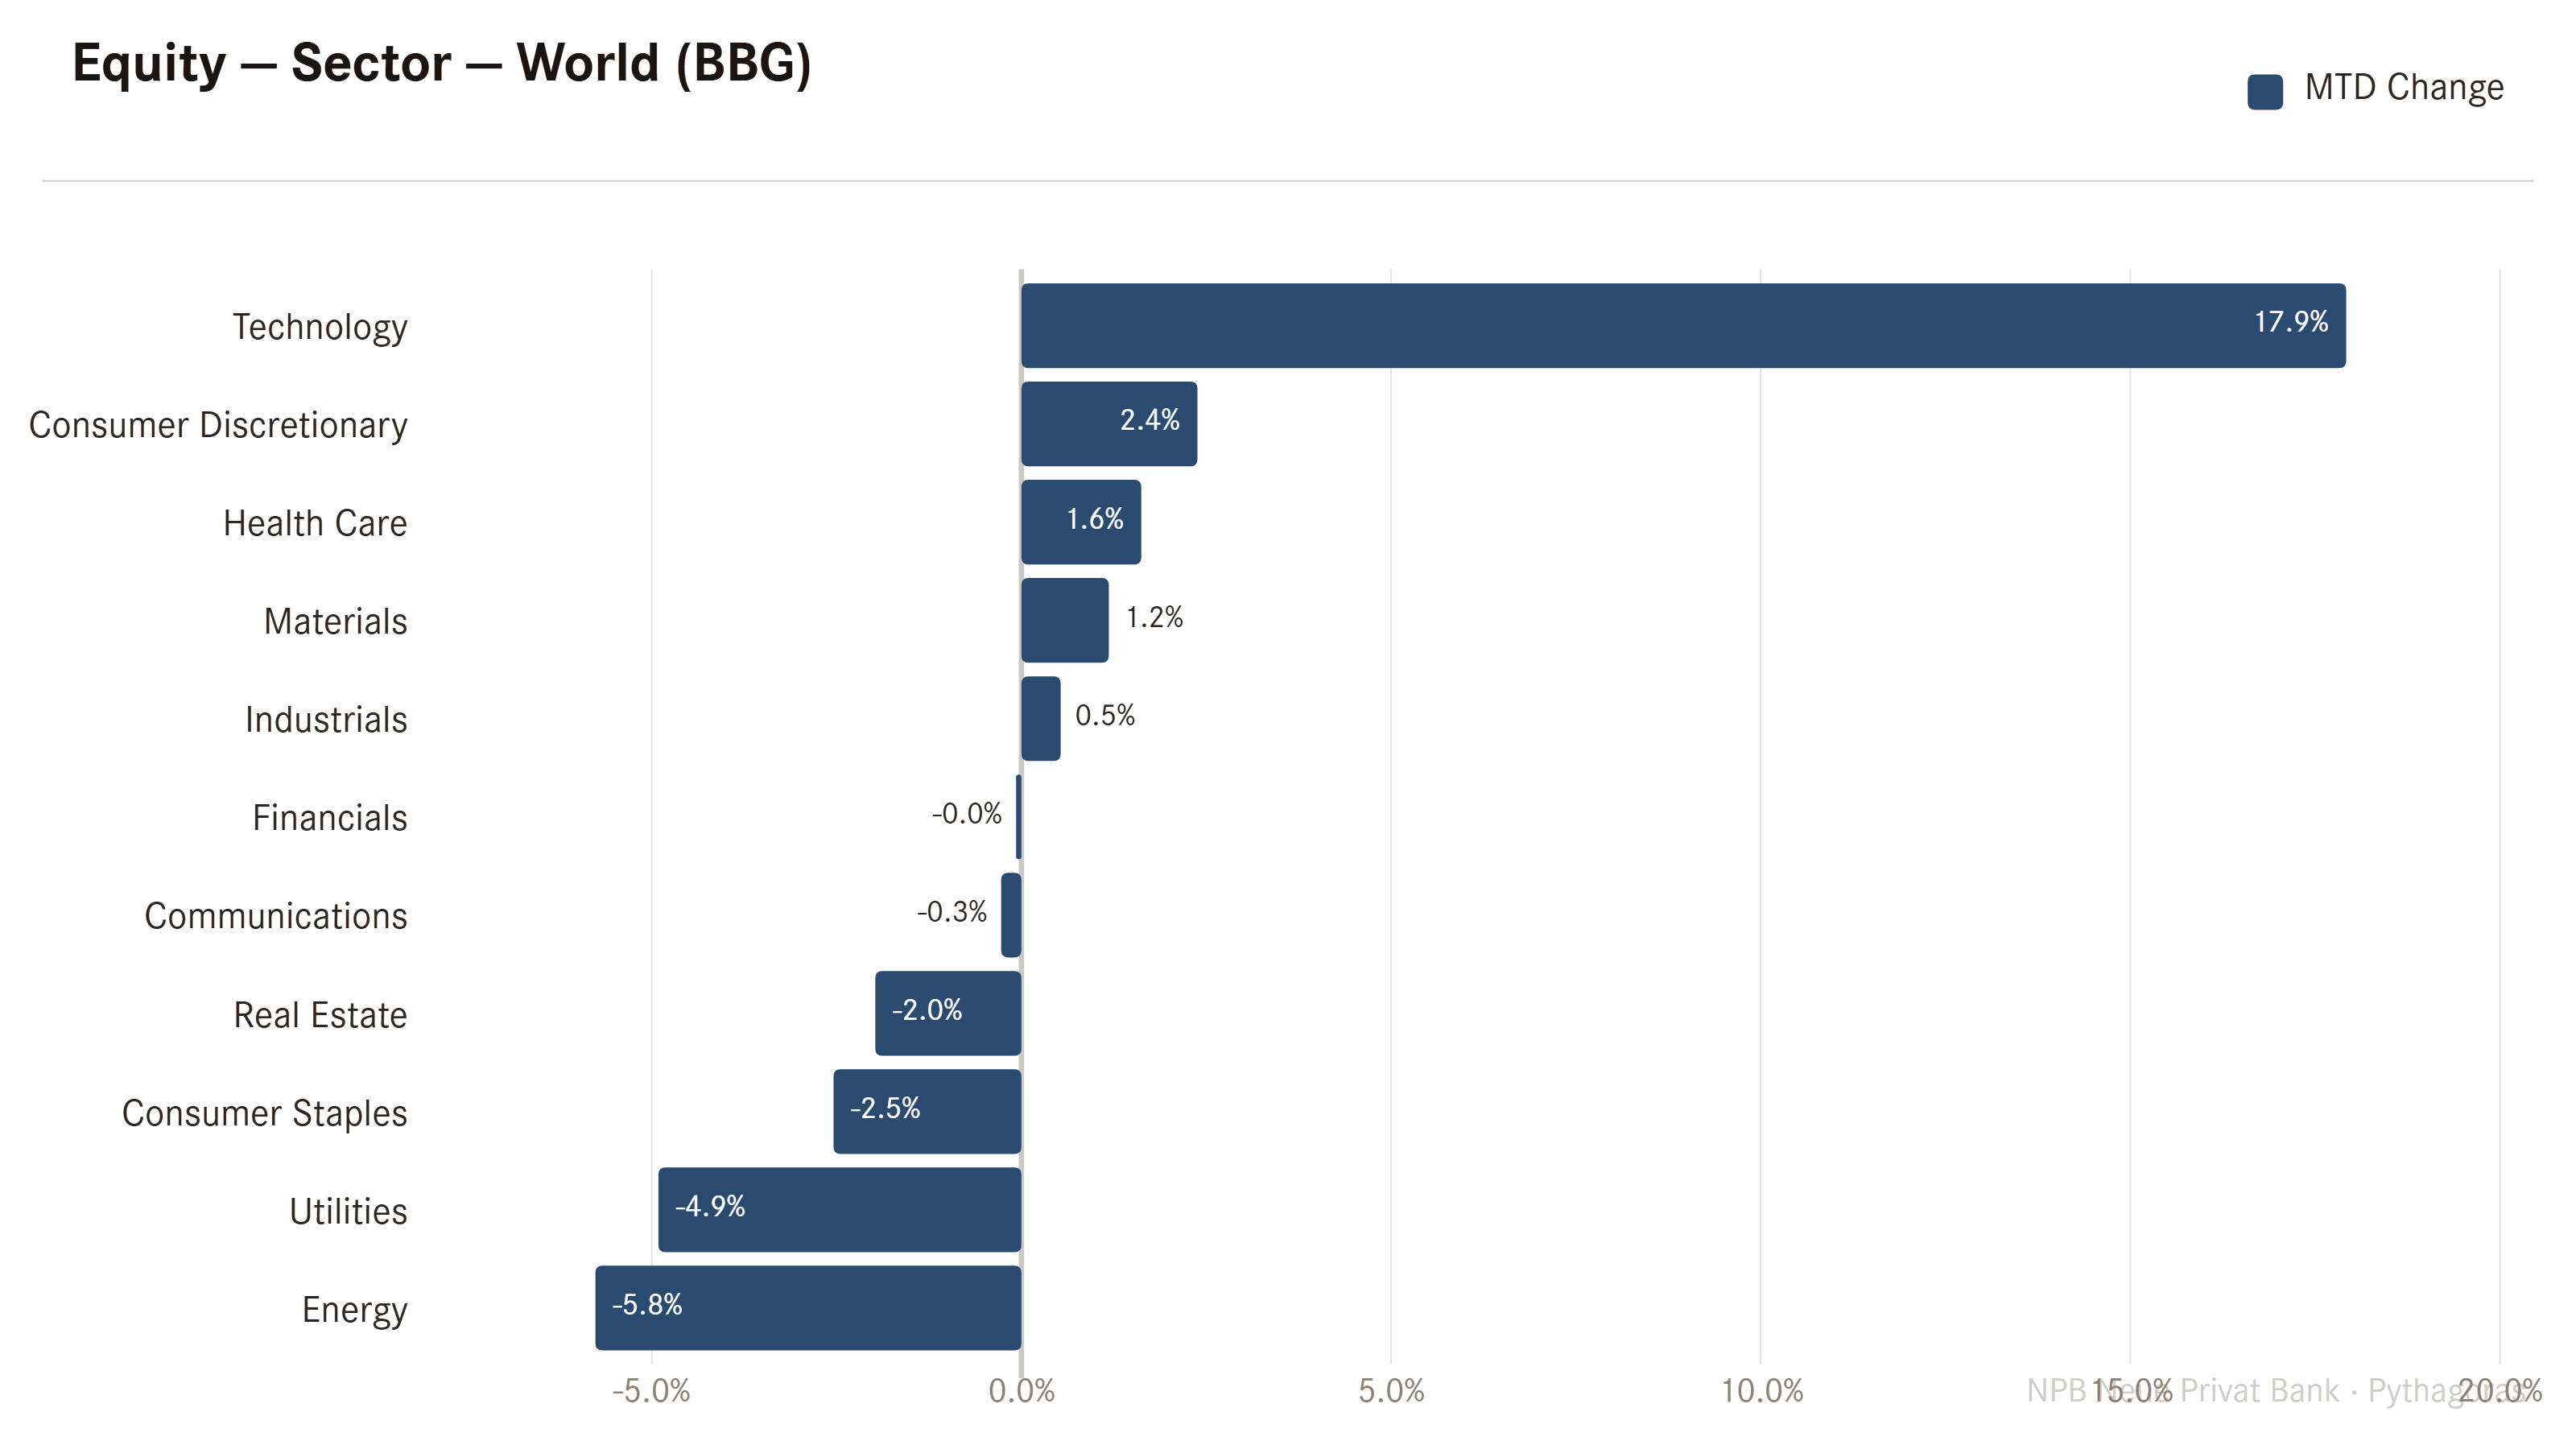
Moving into global sector performance, we note the higher beta indices (tech, consumer discretionary) leading, whilst the more defensive stuff (consumer staples, utilities, energy) is lagging:
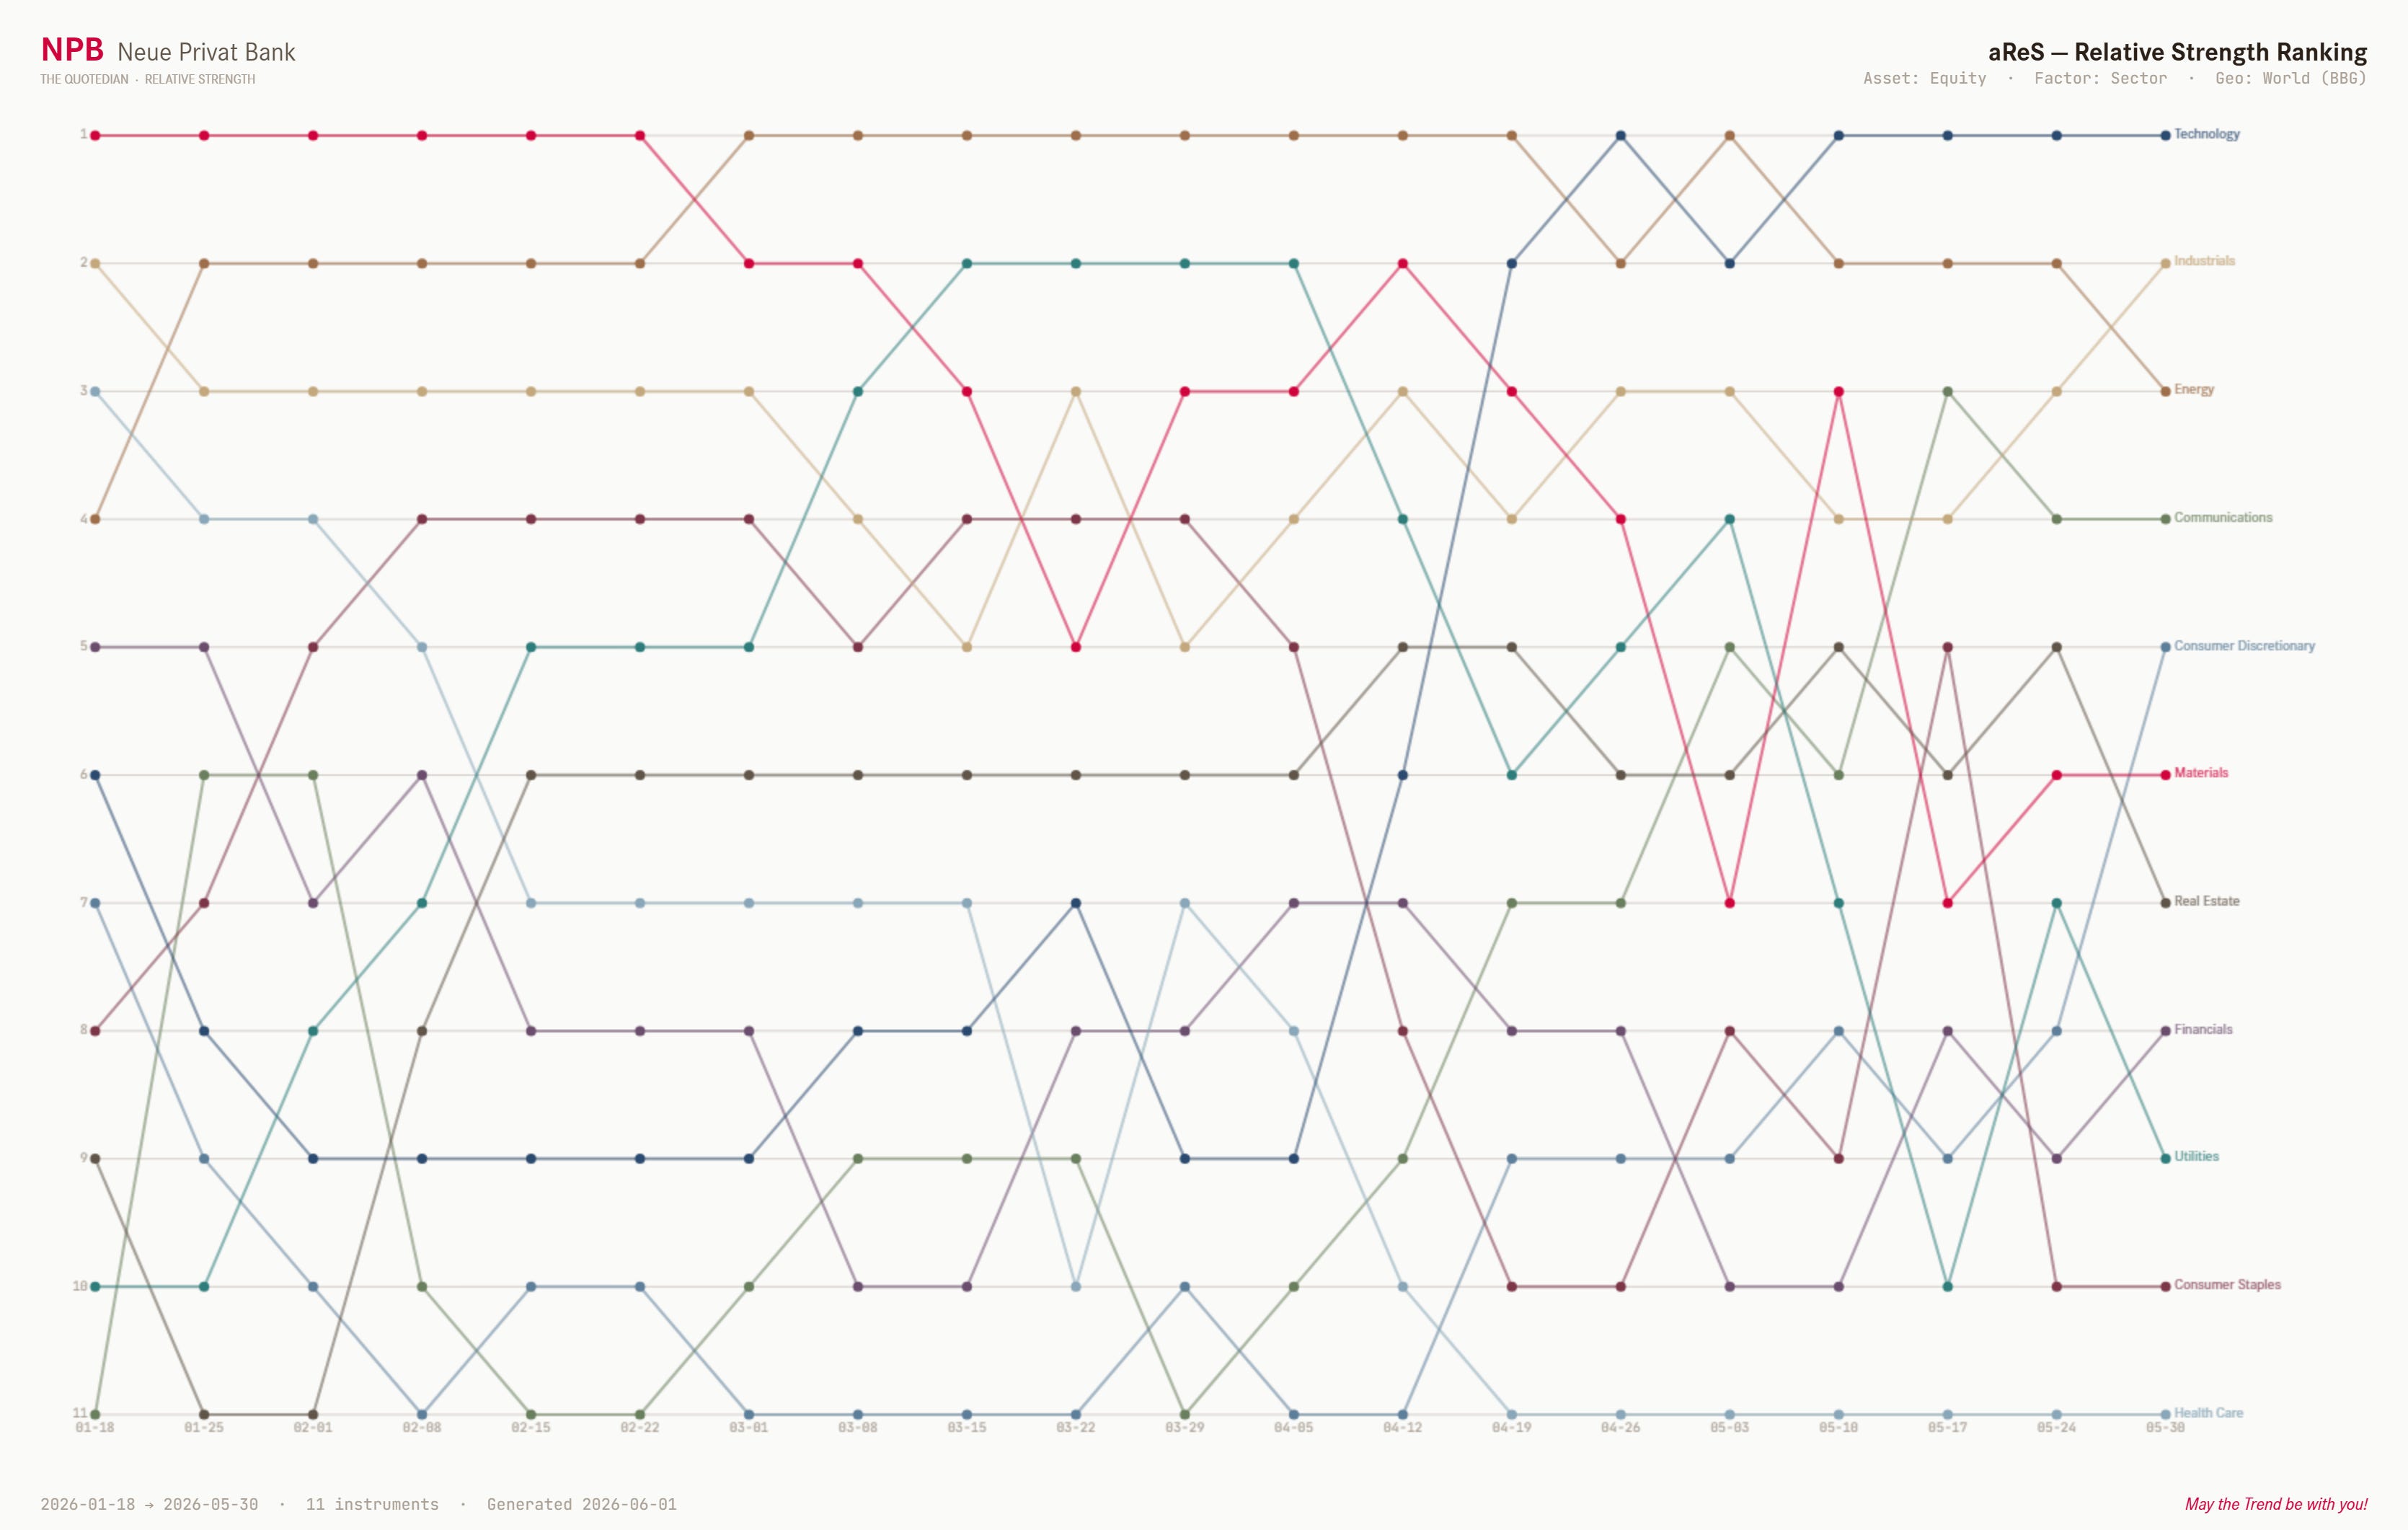
Our proprietary aReS™ asset allocation model continues to overweight technology and industrials,
whereas Bloomberg’s RRG function really only likes technology (and some consumer discretionary):
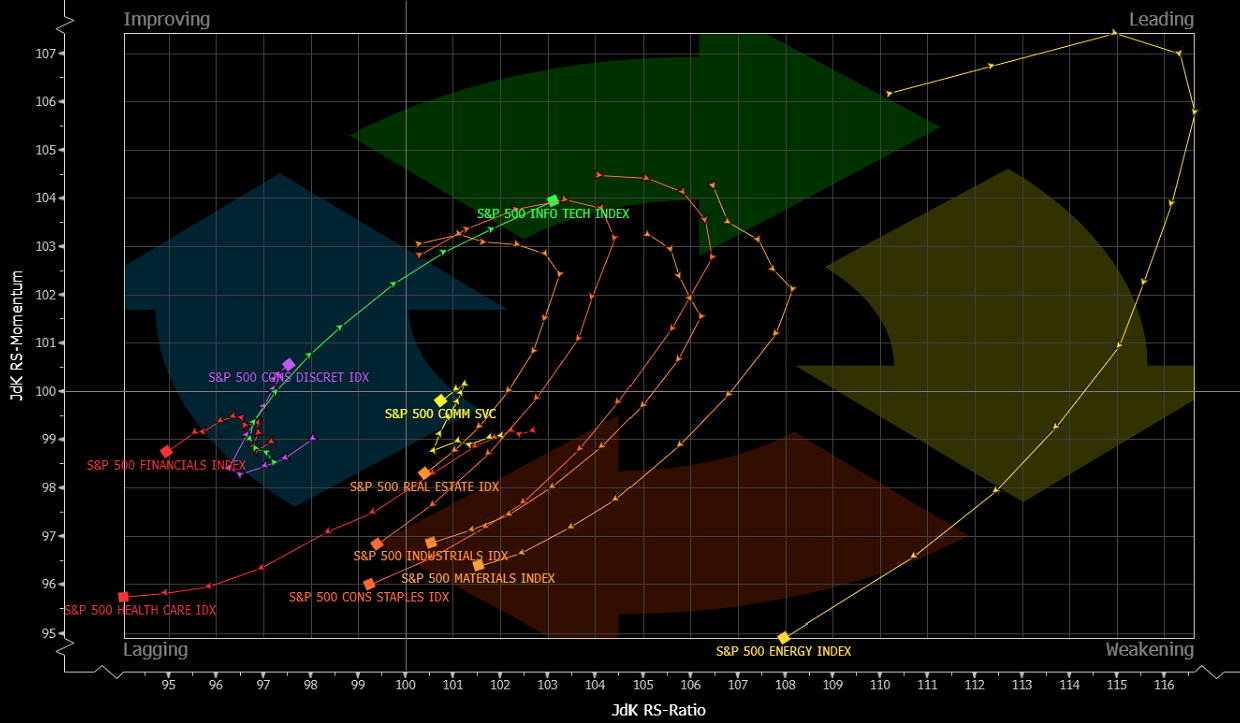
Financials (XLF) look unhealthy in relative terms (vs SPY),
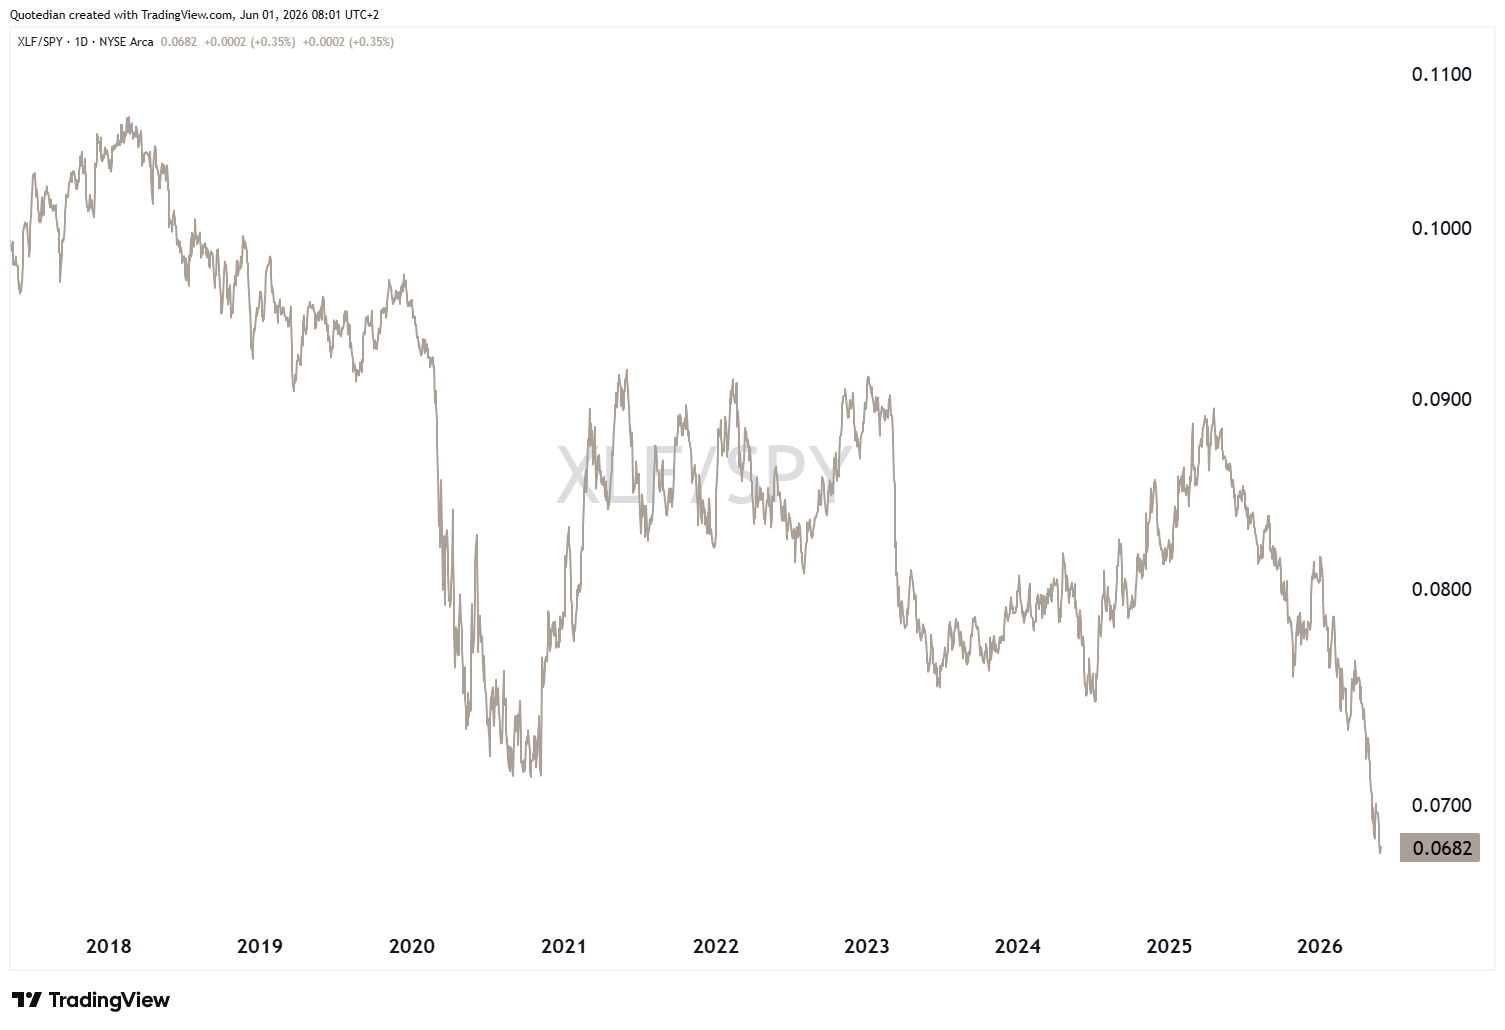
but that’s a story for another day…
The following table looks at the May performances of some of the more popular investment themes over time:
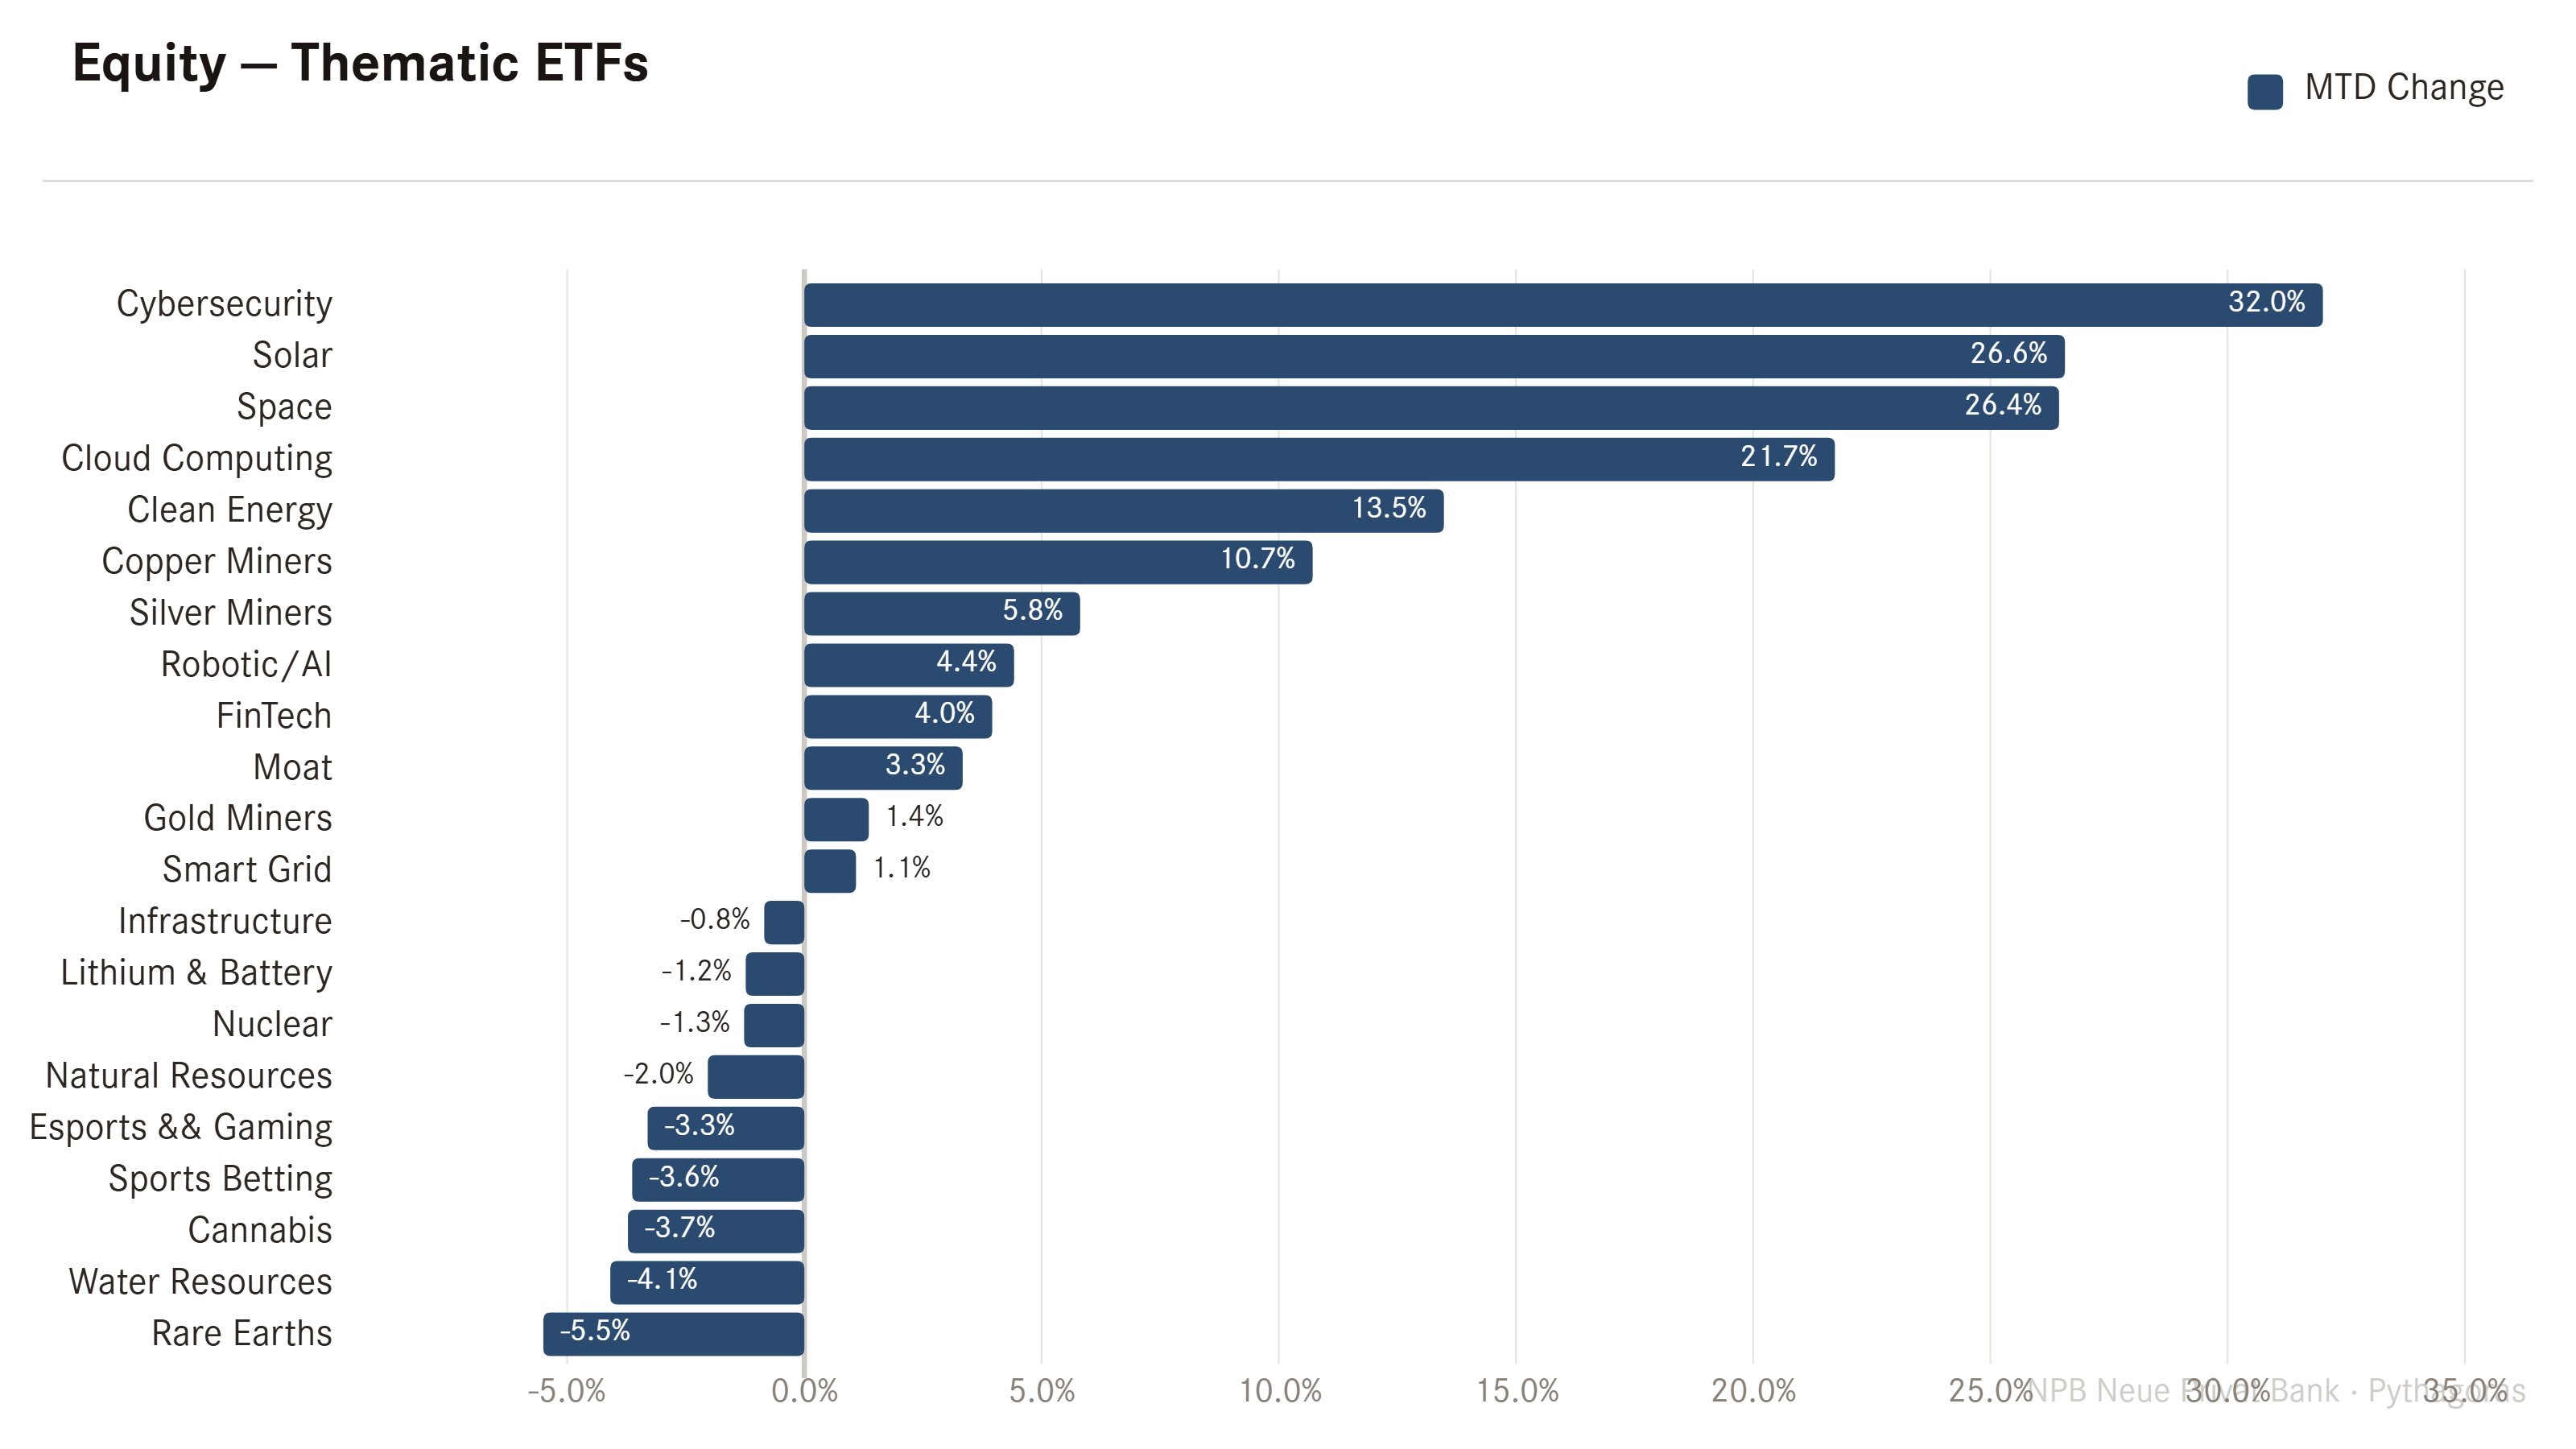
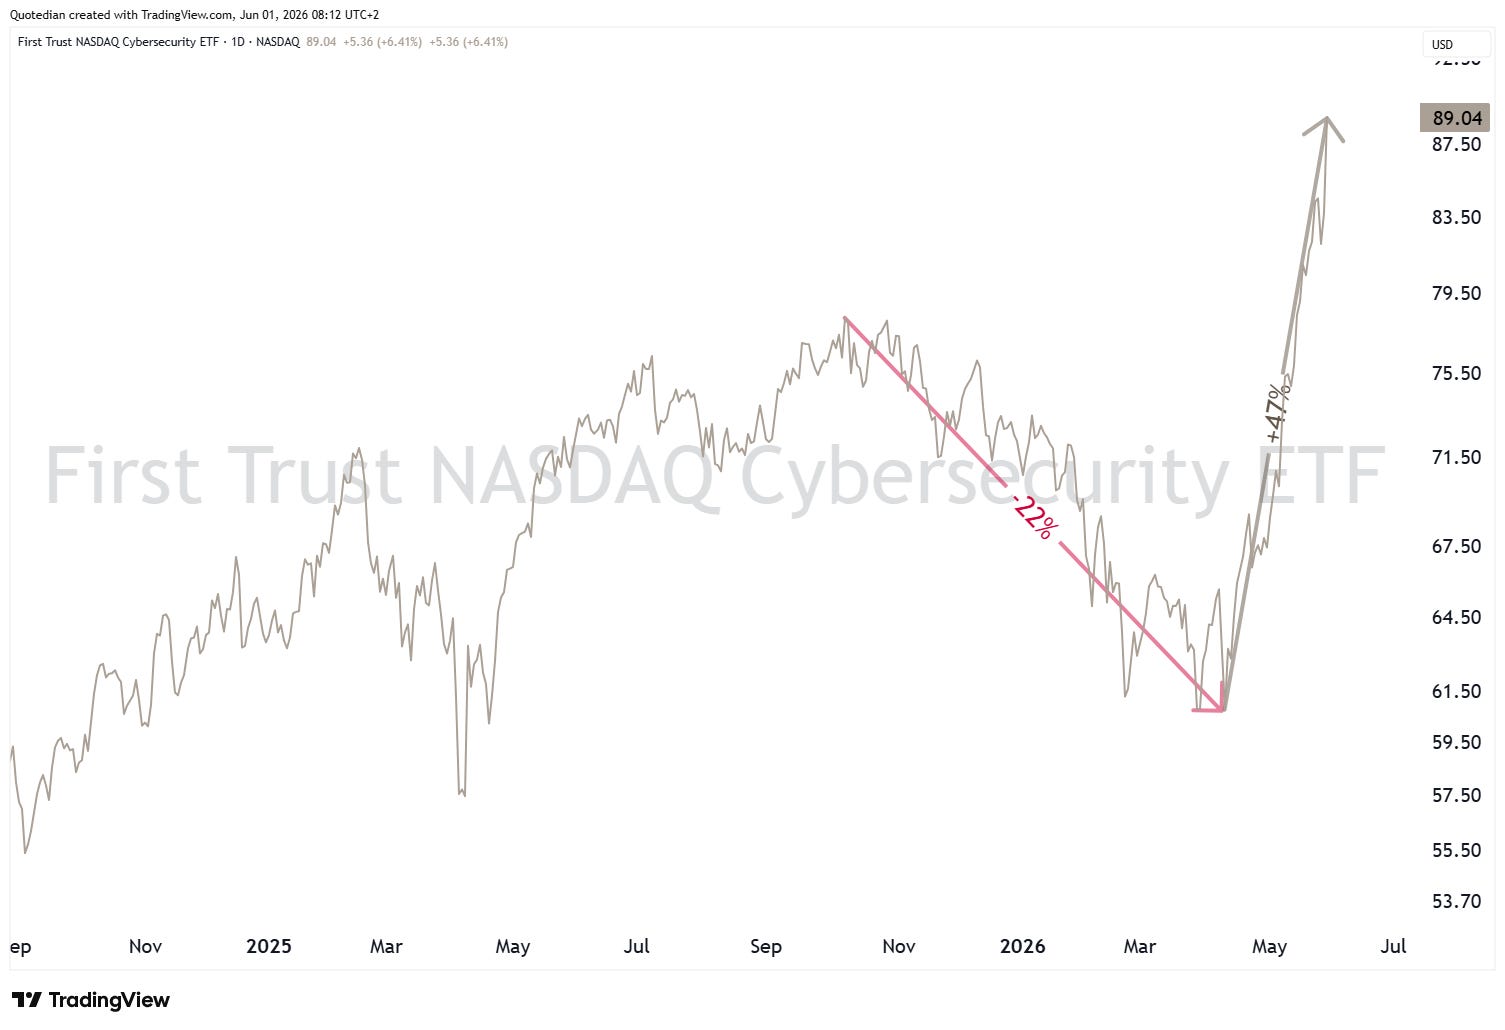
Probably worthwhile noting the massive rebound in Cybersecurity stocks, after the software-related SaaSMagedon sell-off early in the year. Here’s the First Trust Cybersecurity ETF (CIBR) as a proxy for this market segment:
The software sector itself, in the follows proxied via the iShares Expanded Tech-Software ETF (IGV), has also rebounded noticeably, leaving us with two investment ‘wisdoms’:
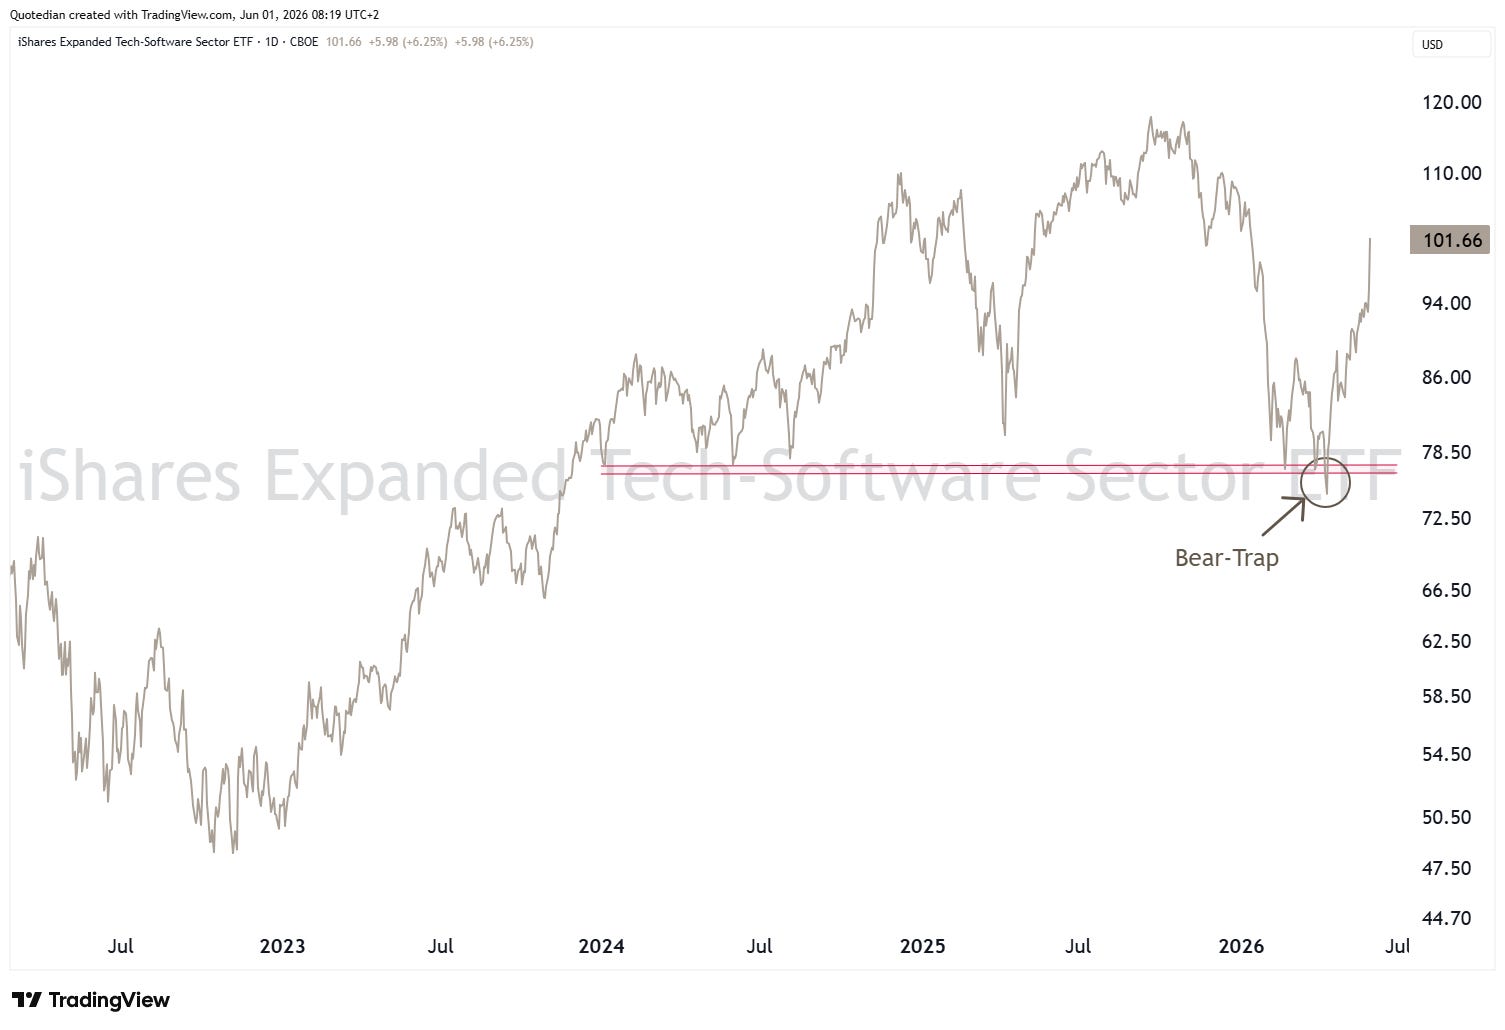
Classical Bear Traps exist
In investment mafs, 37% down is not equal to 37% up (aka Volatility Gremlins)
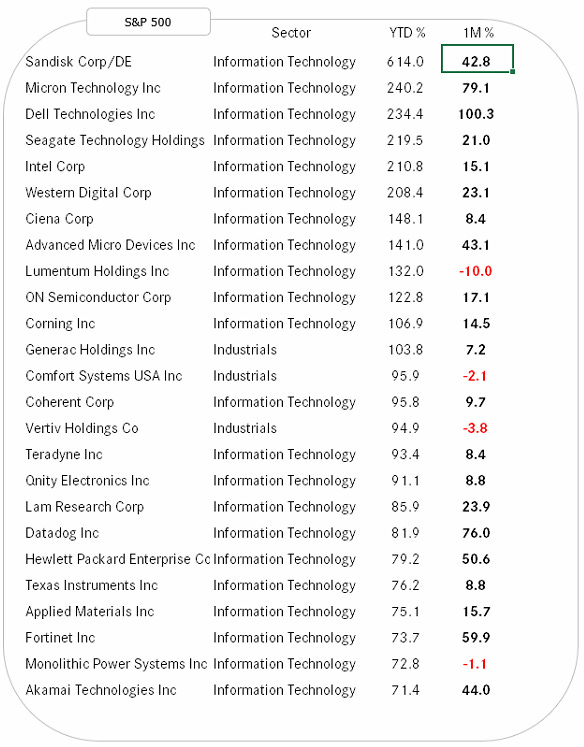
Ok, time for a quick glance on the best performing stocks on a year-to-date basis on both side of the pond and check how they have fared over the past month.
Starting with the US:
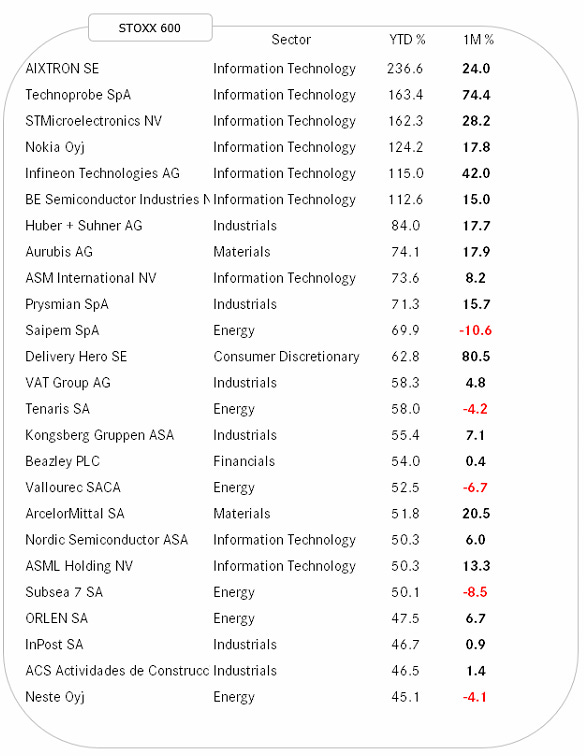
And following up with Europe:
I am not sure I may have mentioned this already once (or twice, or thrice or a million times), but…
Strength Begets Strength!

Alright, let’s correlate over into fixed income markets, where May has treated bonds a tad better than one might suspect:
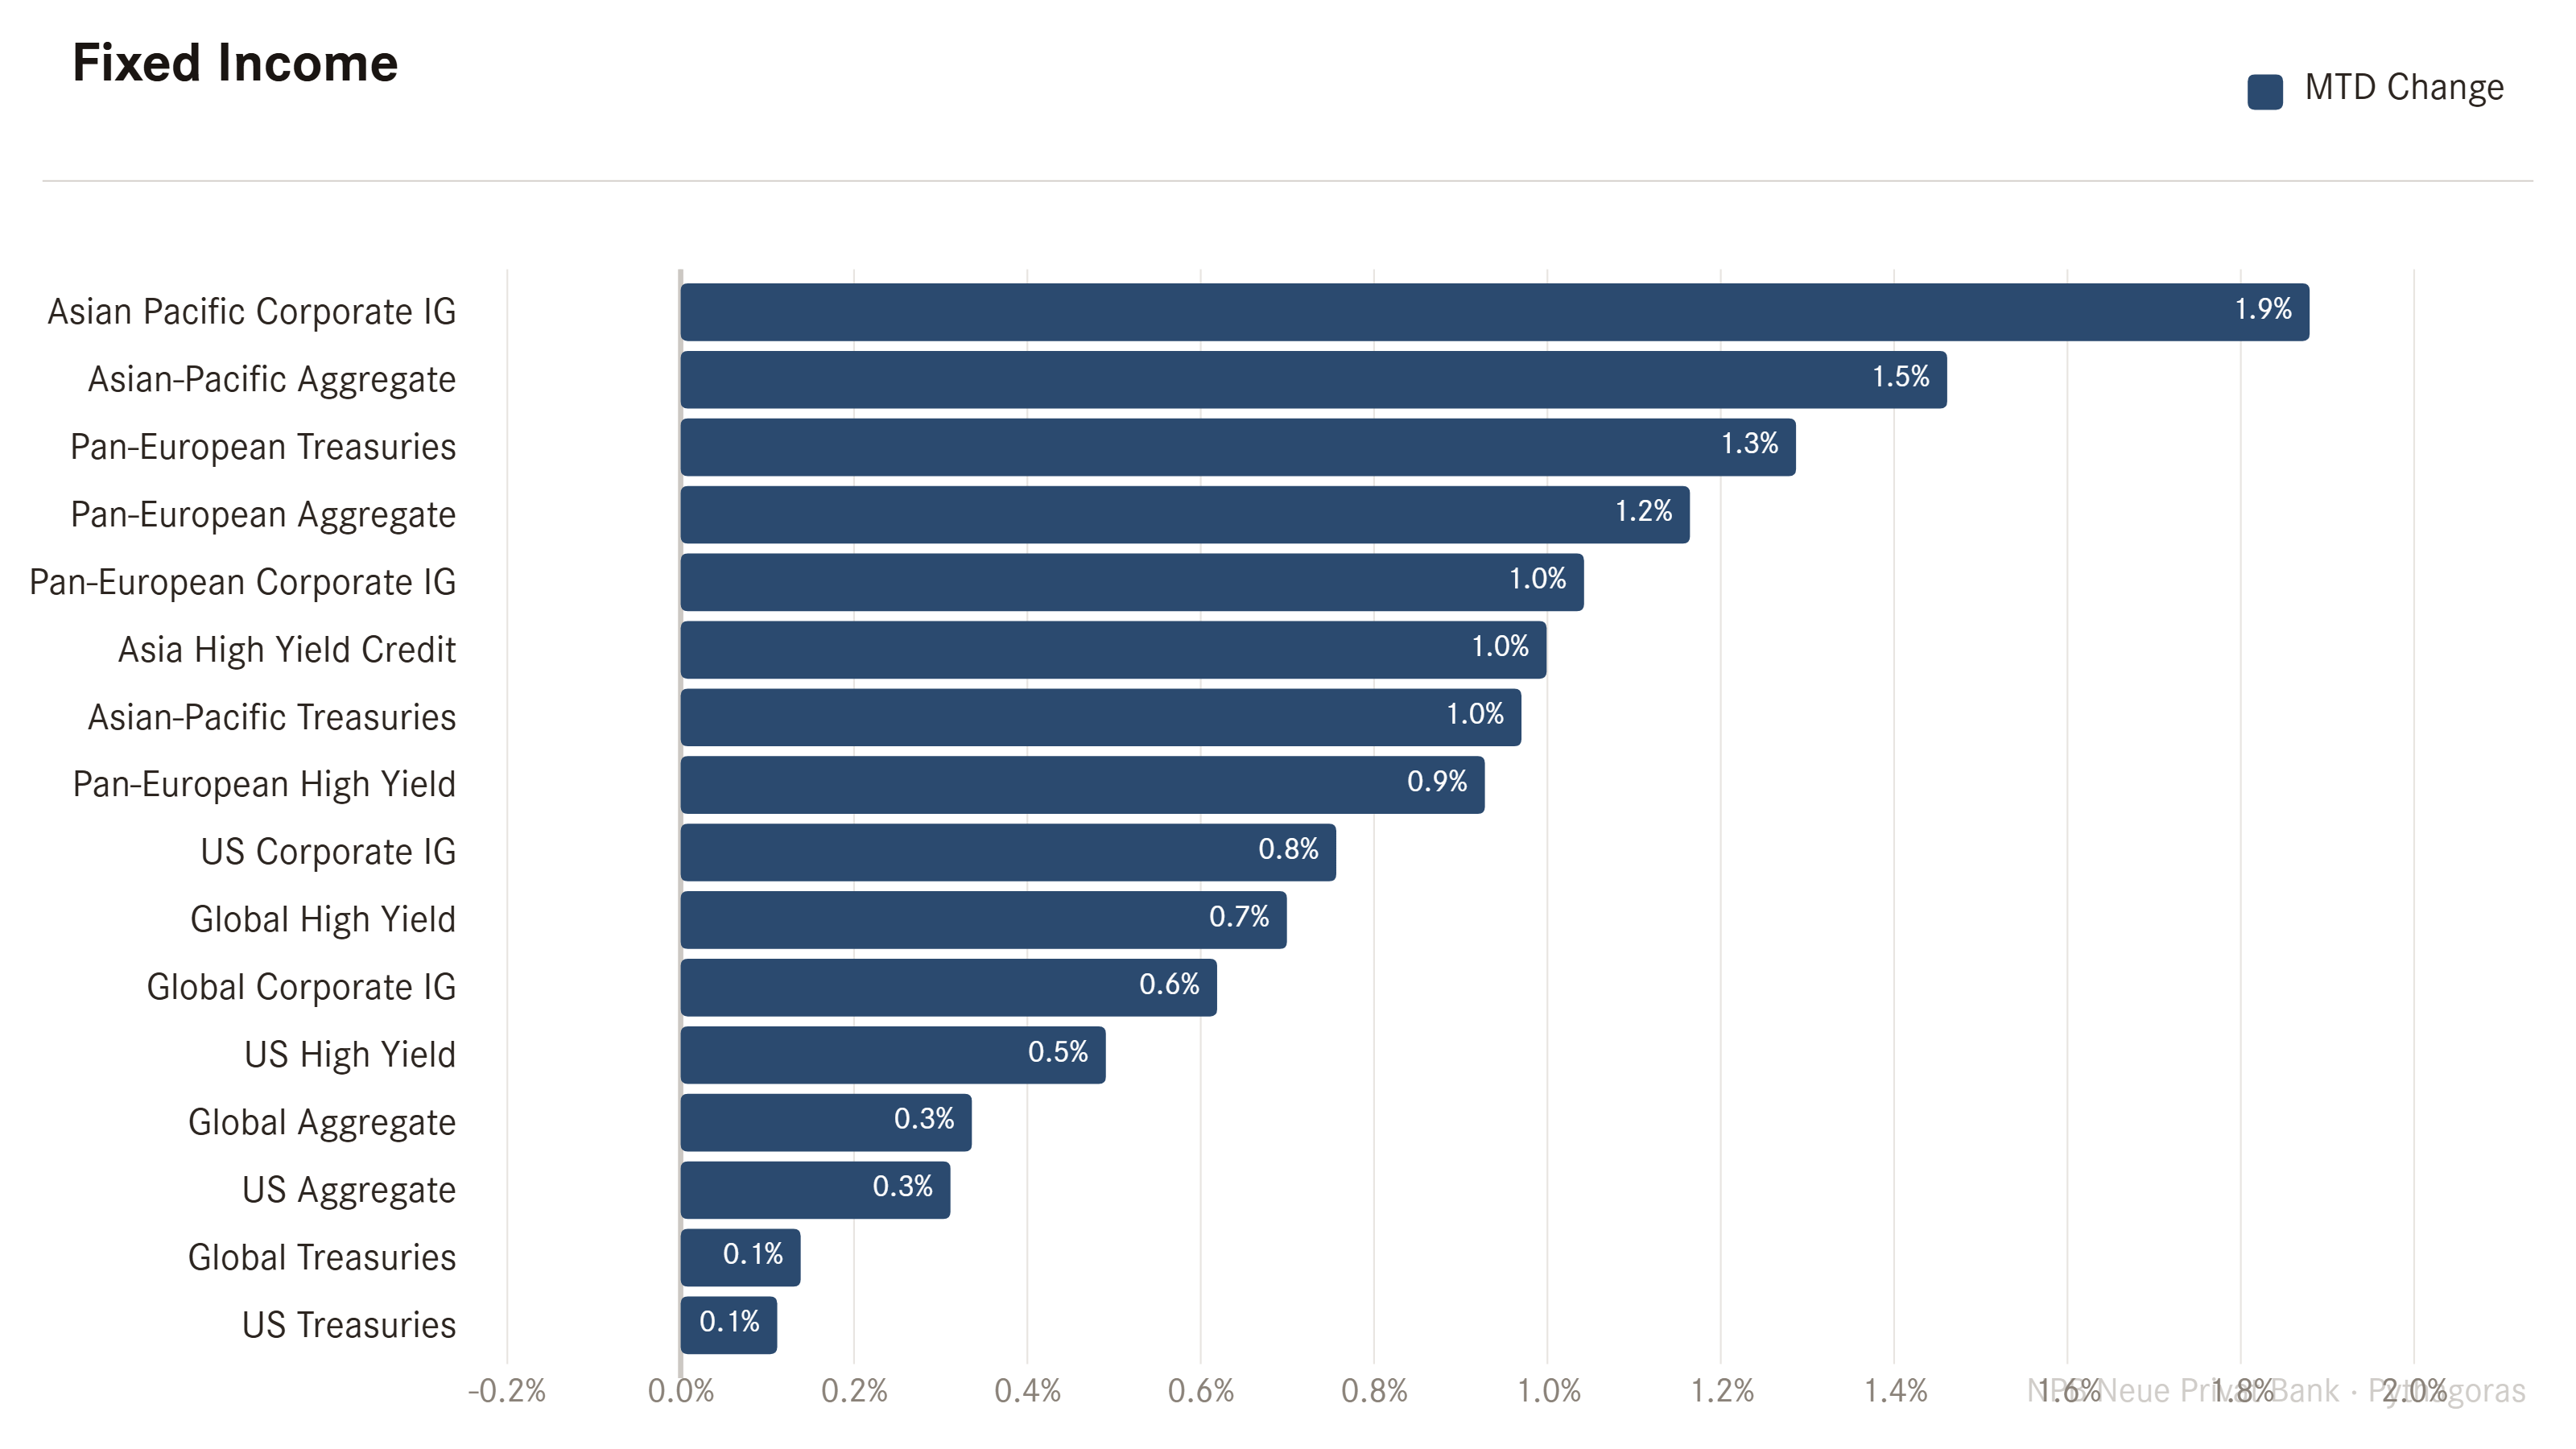
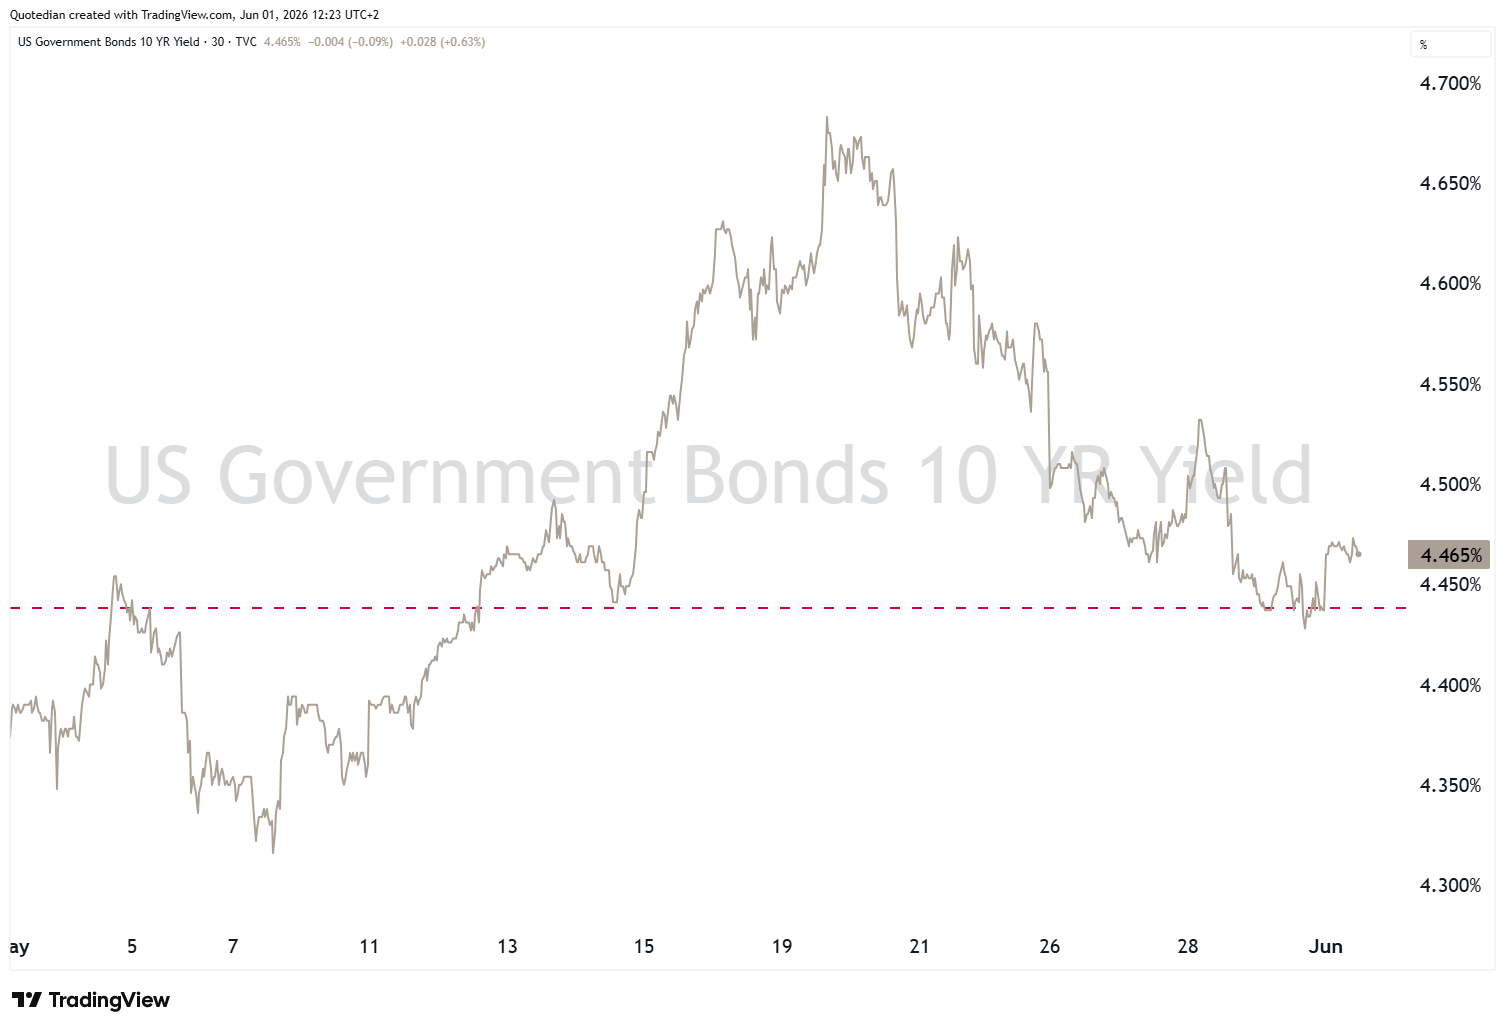
Probably the largest ‘surprise’, at least to me, is the relative resilience of treasury bonds which by nature are most exposed to duration risk. Didn’t inflation tick higher and the long-end of the curve move up in May? Well, yes, at least during three-quarters of the month, however by May 19th the US 10-year treasury topped out and started moving lower, be it on inflation expectations already baked in now, or confidence regarding the end of the war being near, or more likely a bit of both and then some other factors too:
On the long-term (monthly) chart, the same 10-year Treasury yield looks like this:
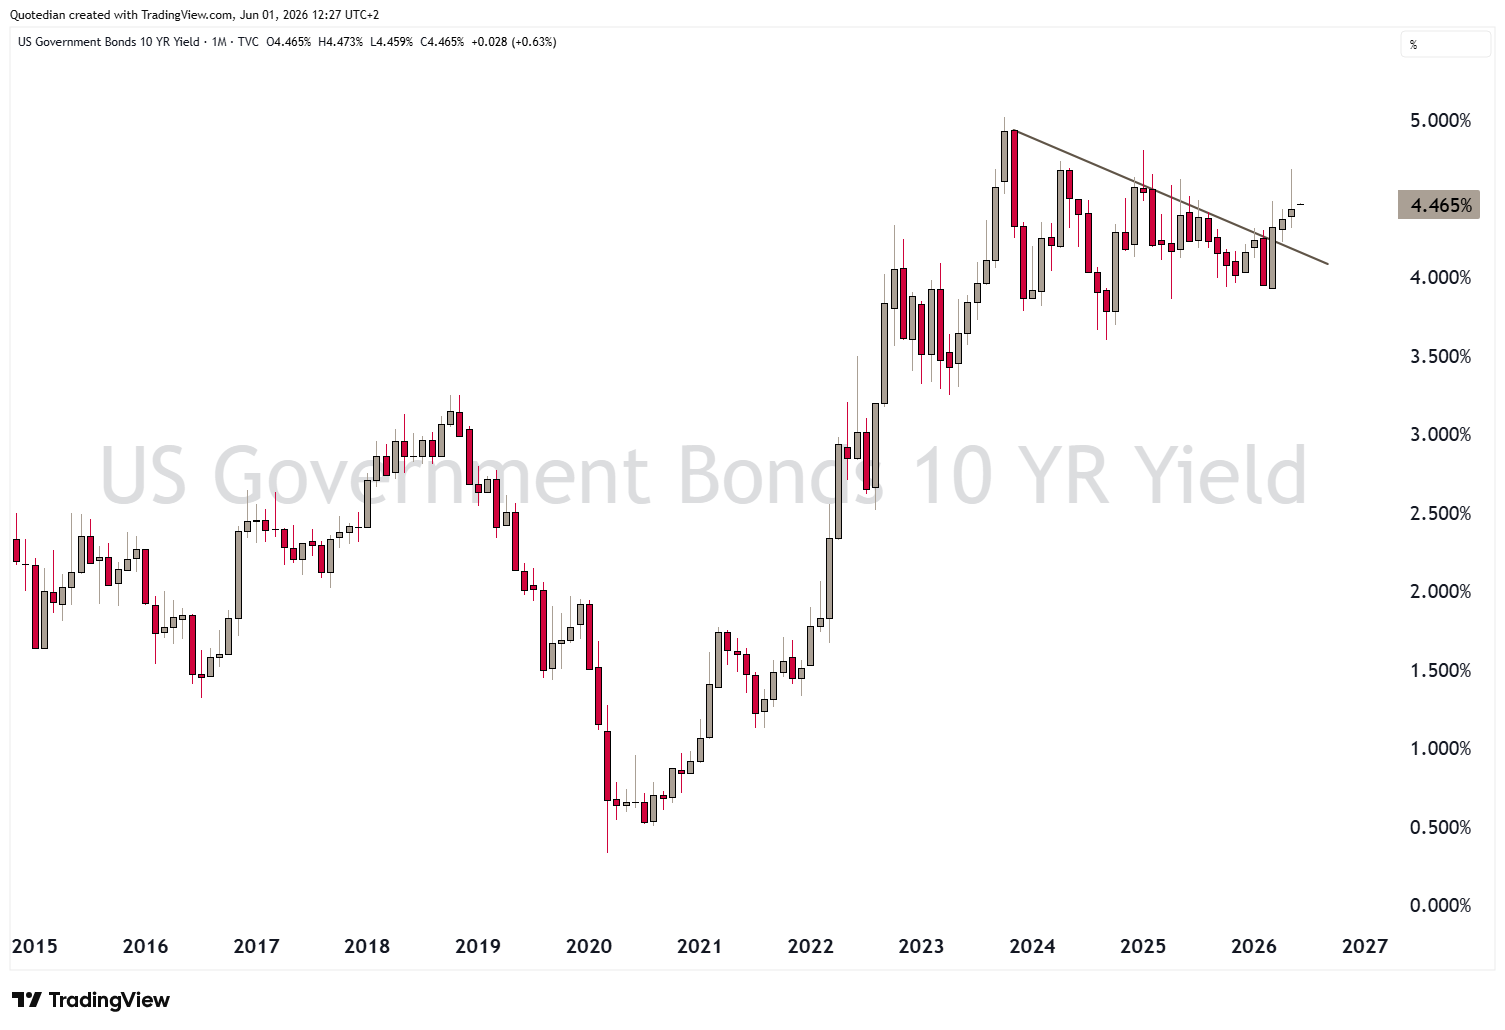
To me, the risks continue to lie towards the upper side, with exceeding 4.56 on a monthly basis being the first confirmation and “run for the trenches” with a close above 4.70. But this will take time and a lot of “intermediary” scenarios could play out in the meantime. Just keep your focus tilted upwards …
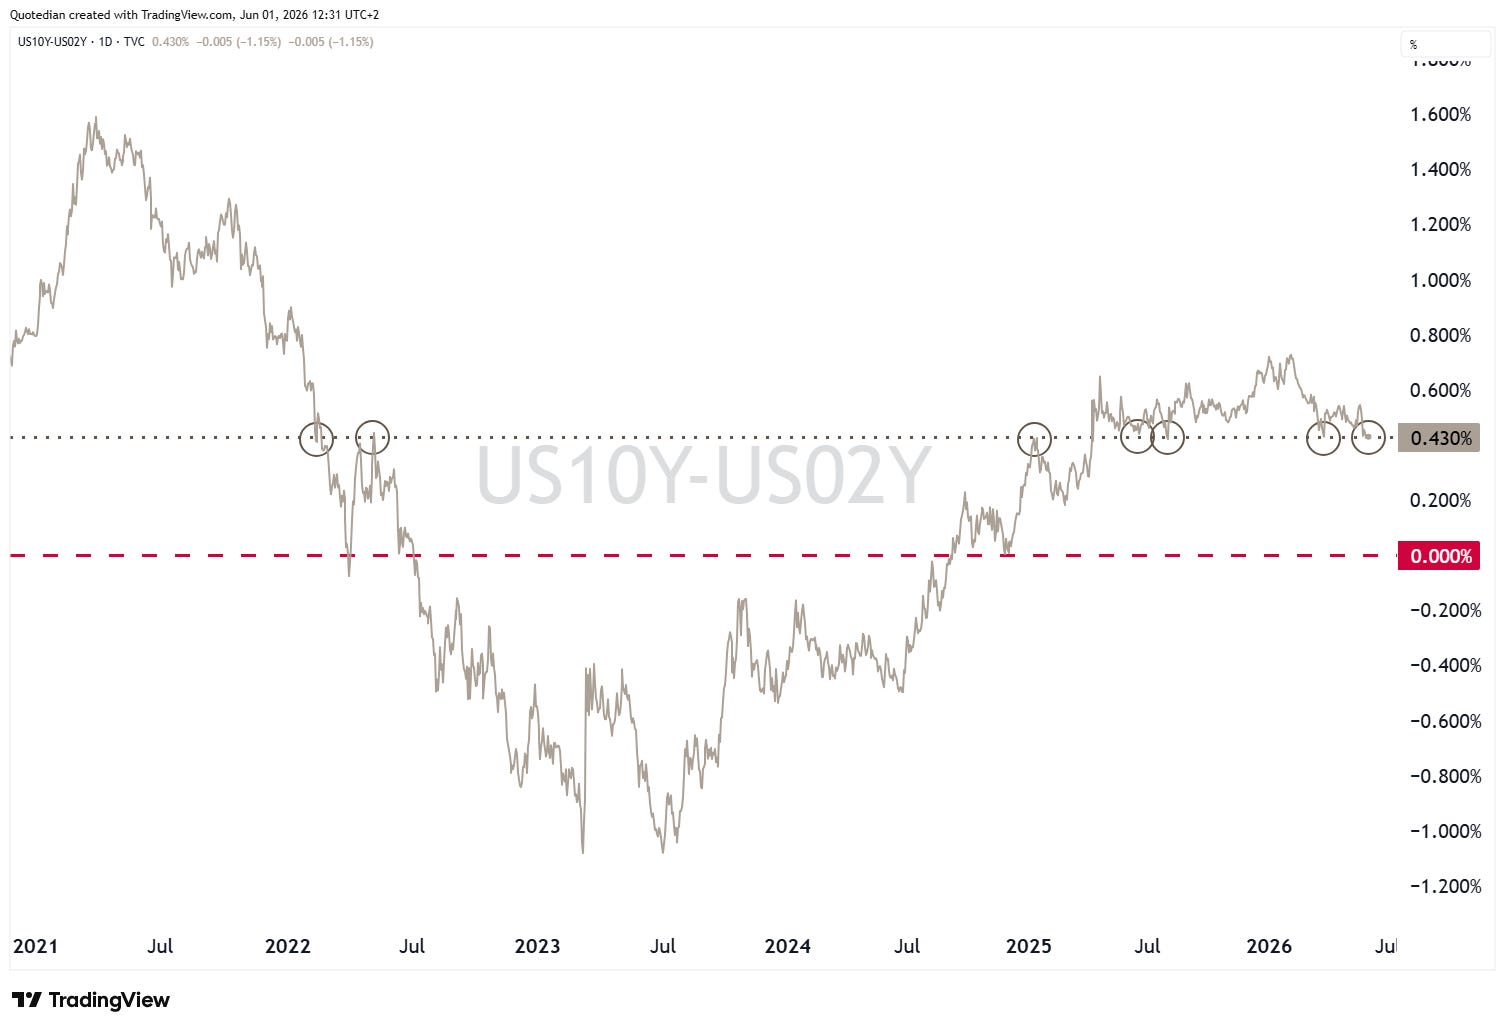
The curve (10y-2y) has been flattening a tad since February and currently lies on top of some apparently important pivot point:
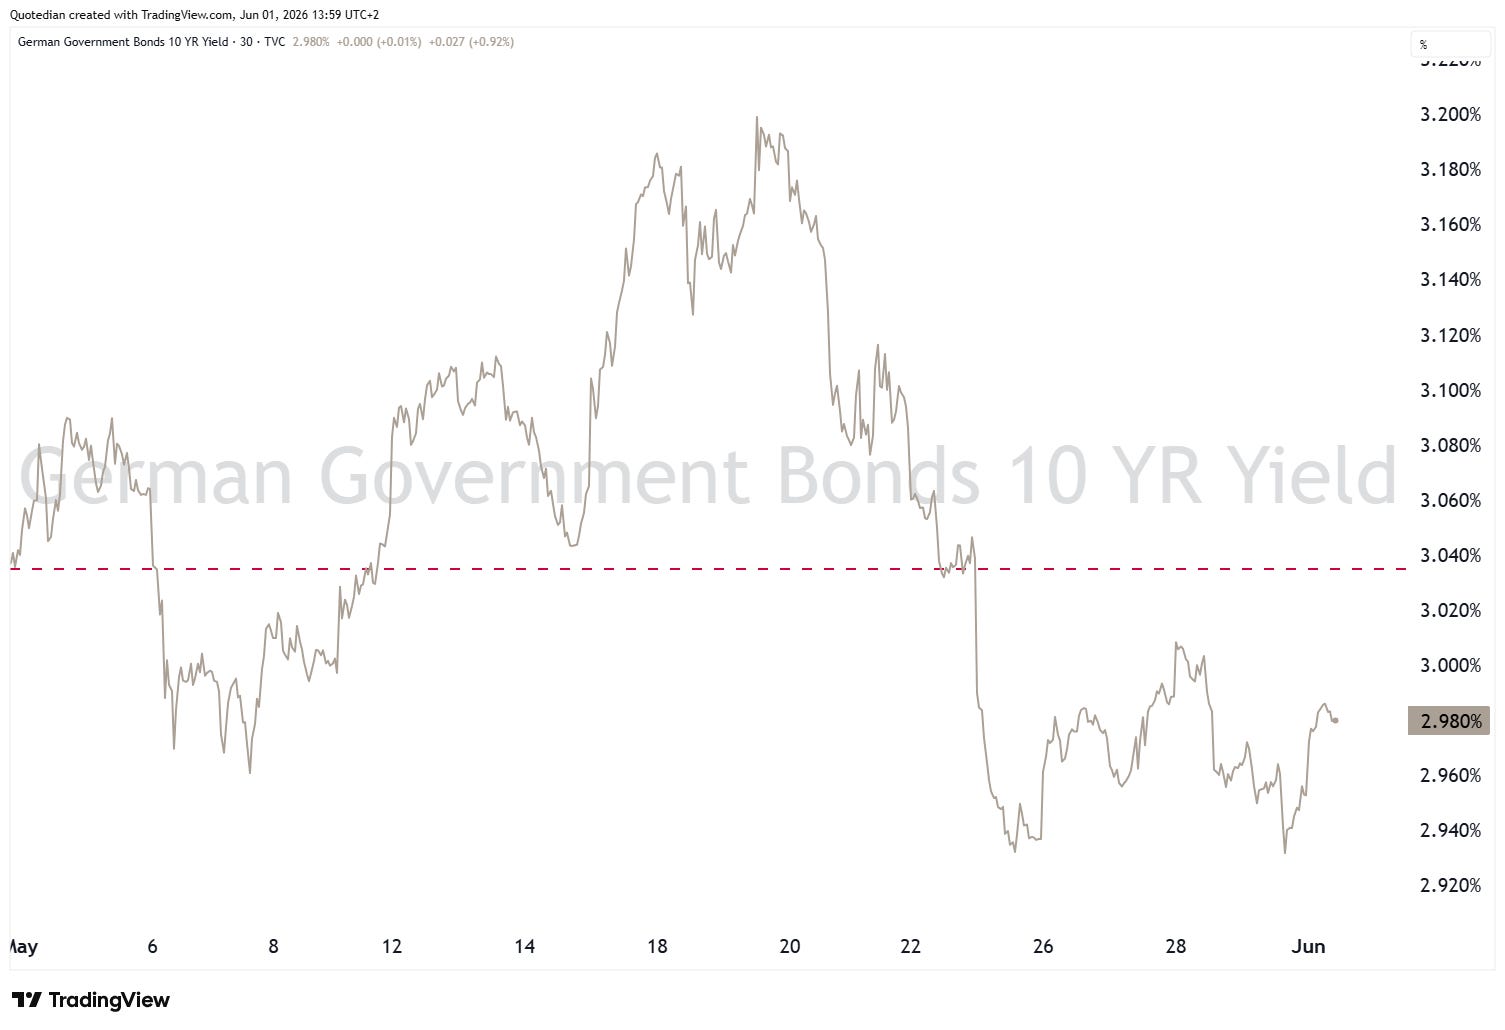
European rates in the meantime witnessed an even larger intra-month reversal, with rates closing lower than they had opened at the beginning of May:
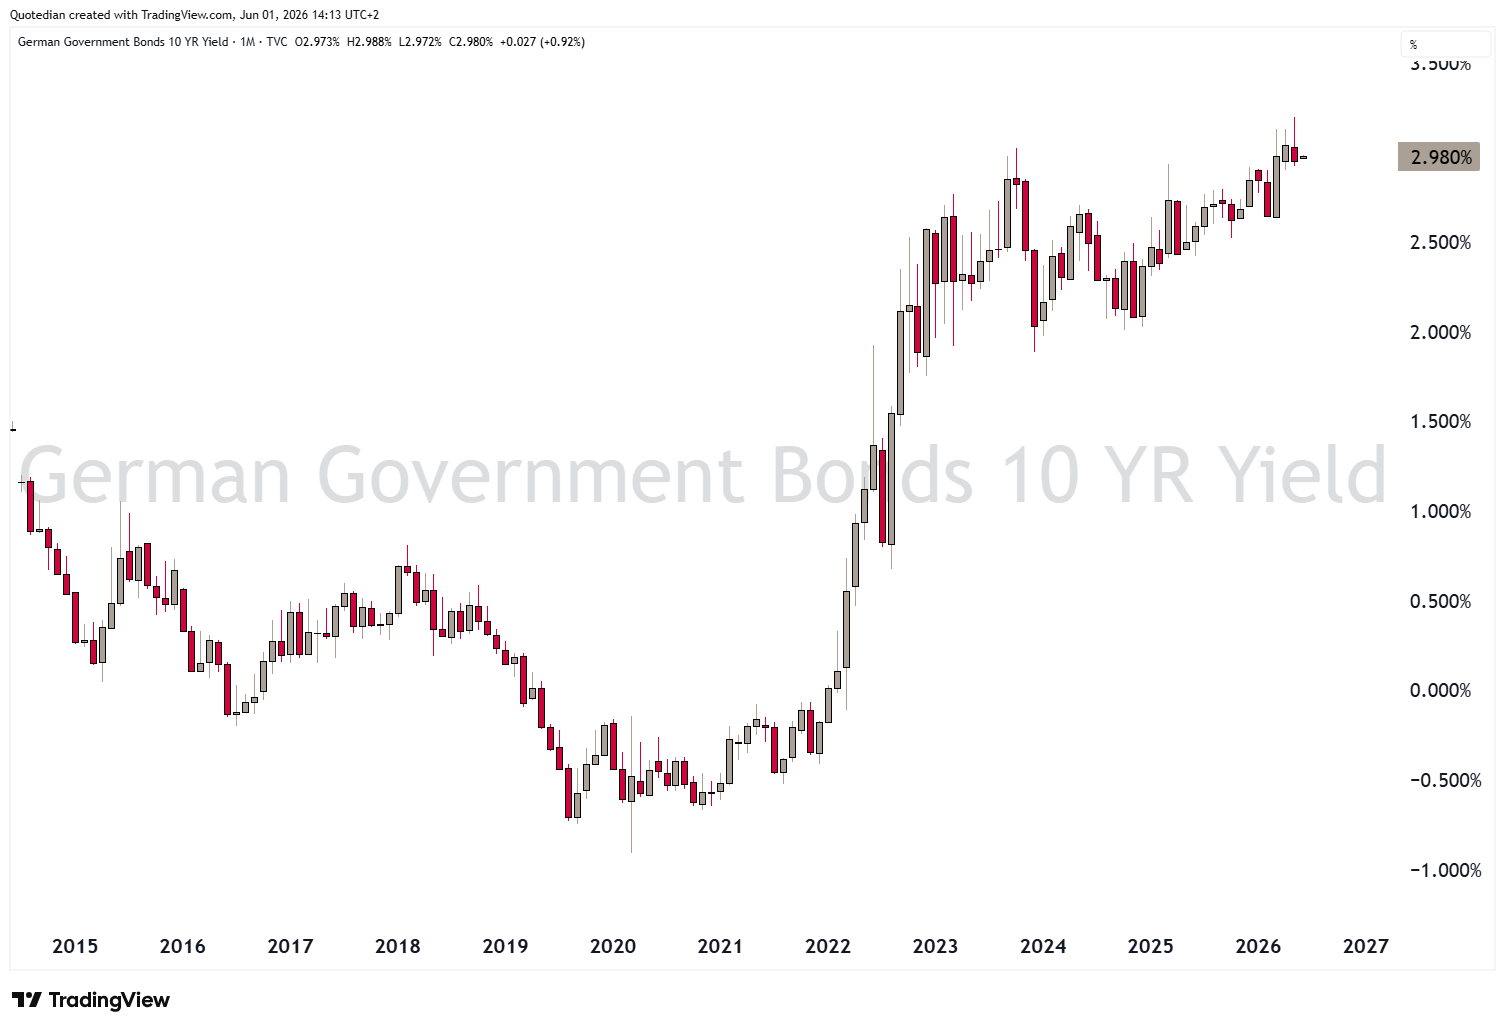
On the longer-term chart of the Bund yield, just as for its US Treasury cousin, the path of least resistance seems to be to the upside … eventually!
Are Japanese Bonds (JGBs) leading the way for global bonds? Checking in on the chart below, JGBs (red) hit their lowest in 2016 already. As US (grey) and German (dark grey) government bonds hit new absolute lows during the COVID period in 2019/2020, JGB’s actually saw a marginally higher low (red arrow):
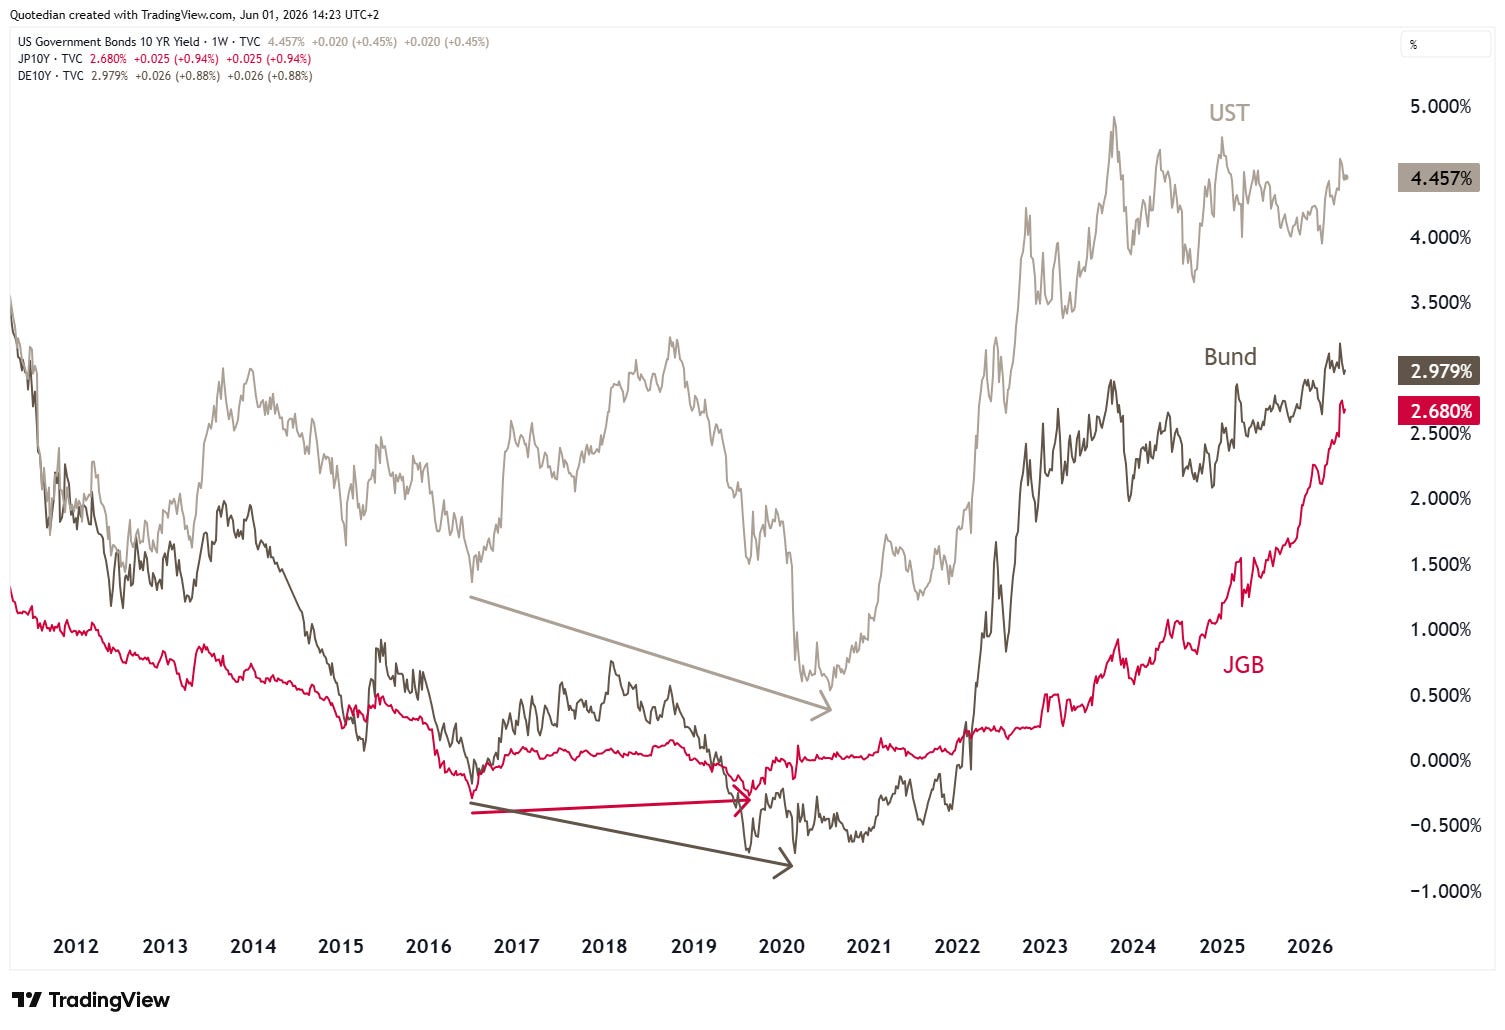
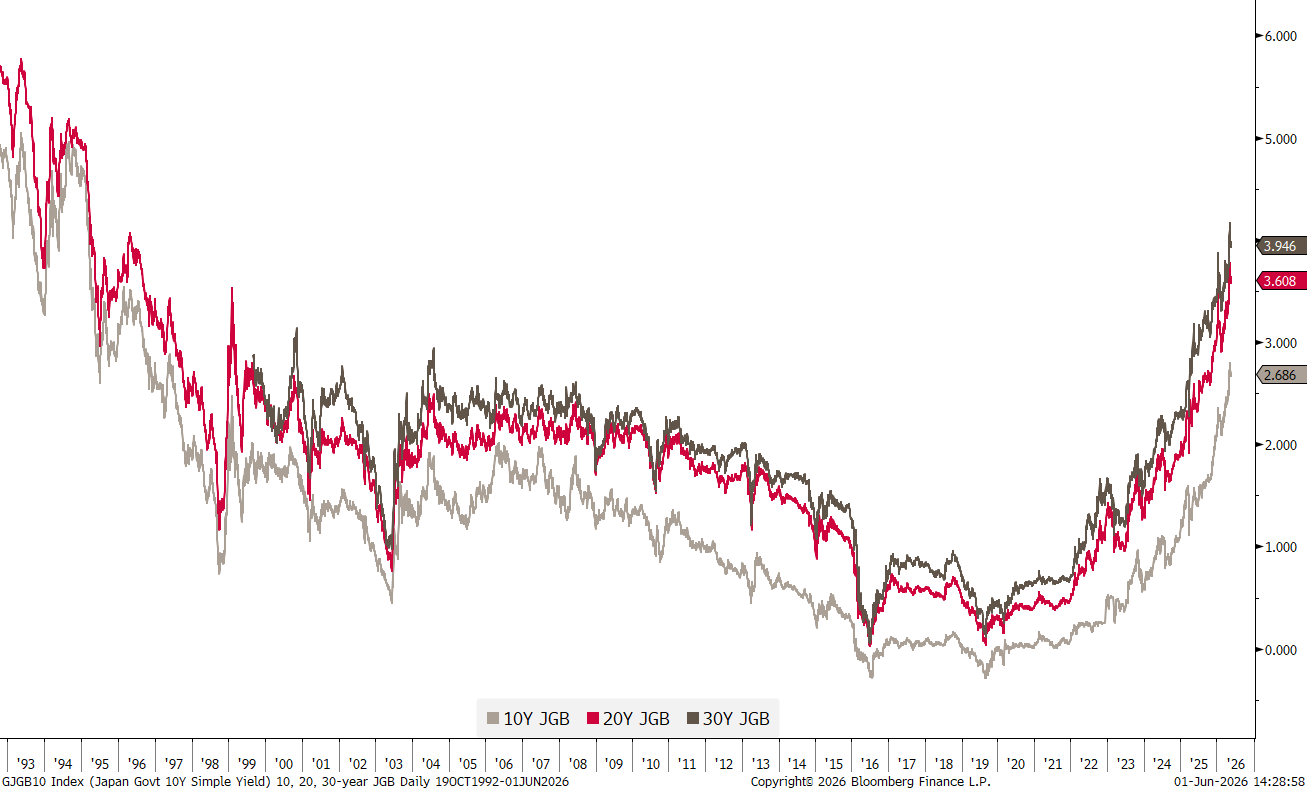
Recently, JGB yields have accelerated to the upside:
Will global (developed) bond yields (e.g. US, Europe) see a similar acceleration in a not too distant future?
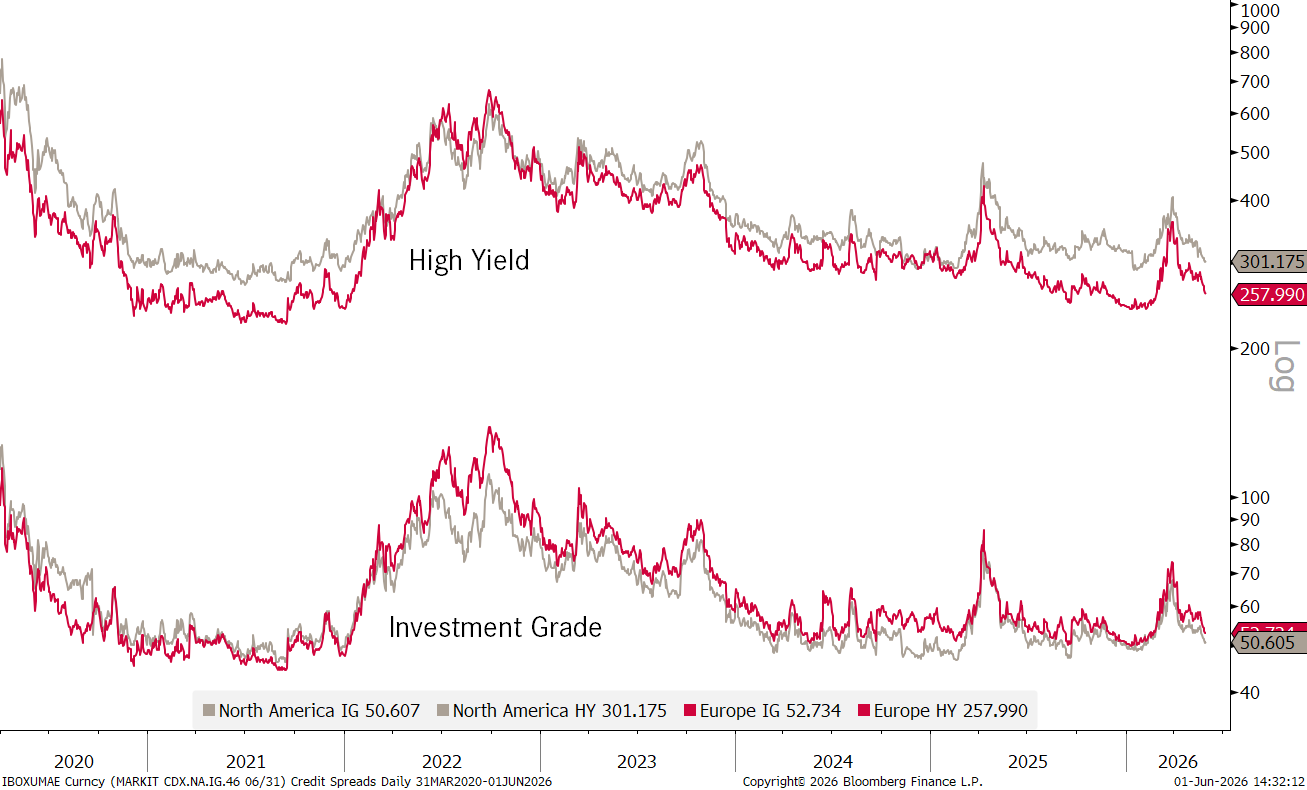
To finish off the rates section, just a quick glance at credit spreads from two different angles.
First, via Credit Default Swap (CDS) rates:
And then via the Moody’s BAA minus AAA indices:
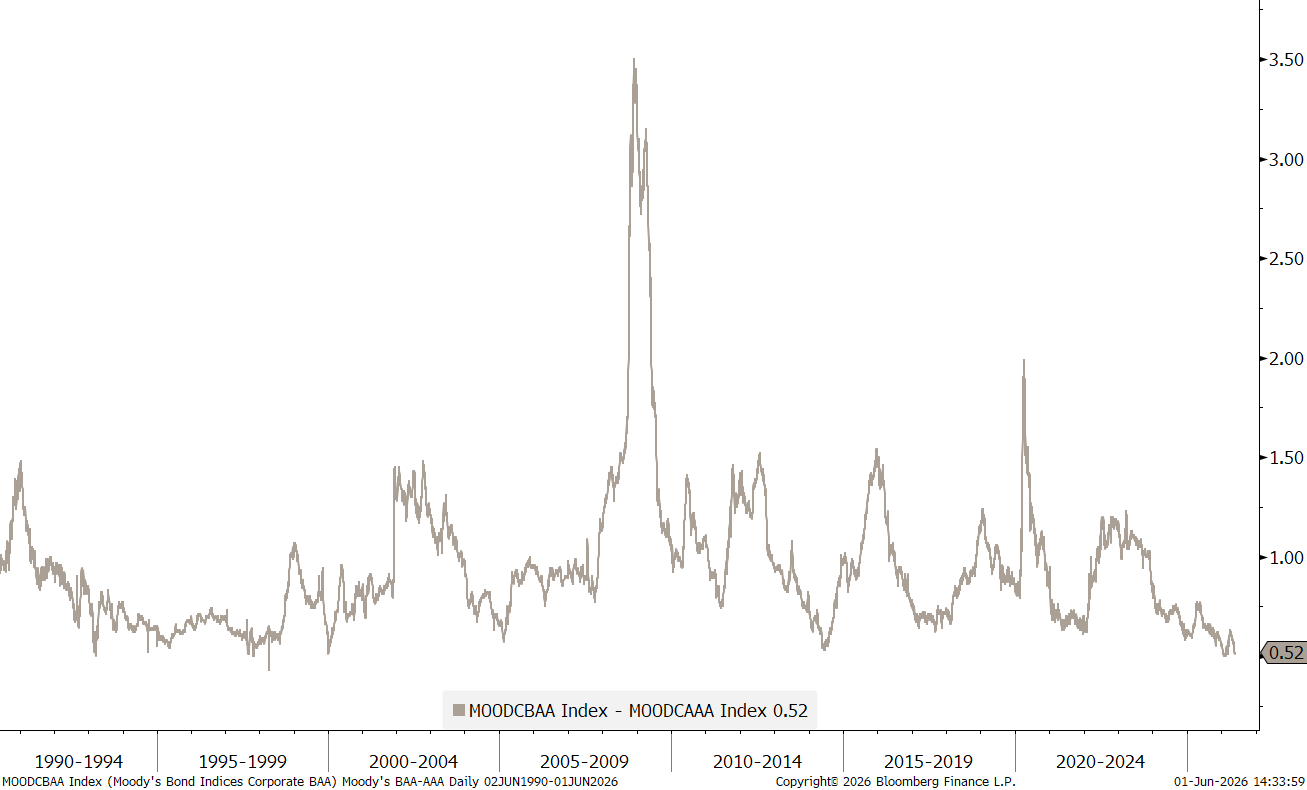
Both are signalling no immediate stress, but also no meaningful carry for taking on more risk.
Surfing over into sea of the international currency market, here’s the performance table of non-US Dollar currencies versus the US Dollar during May:
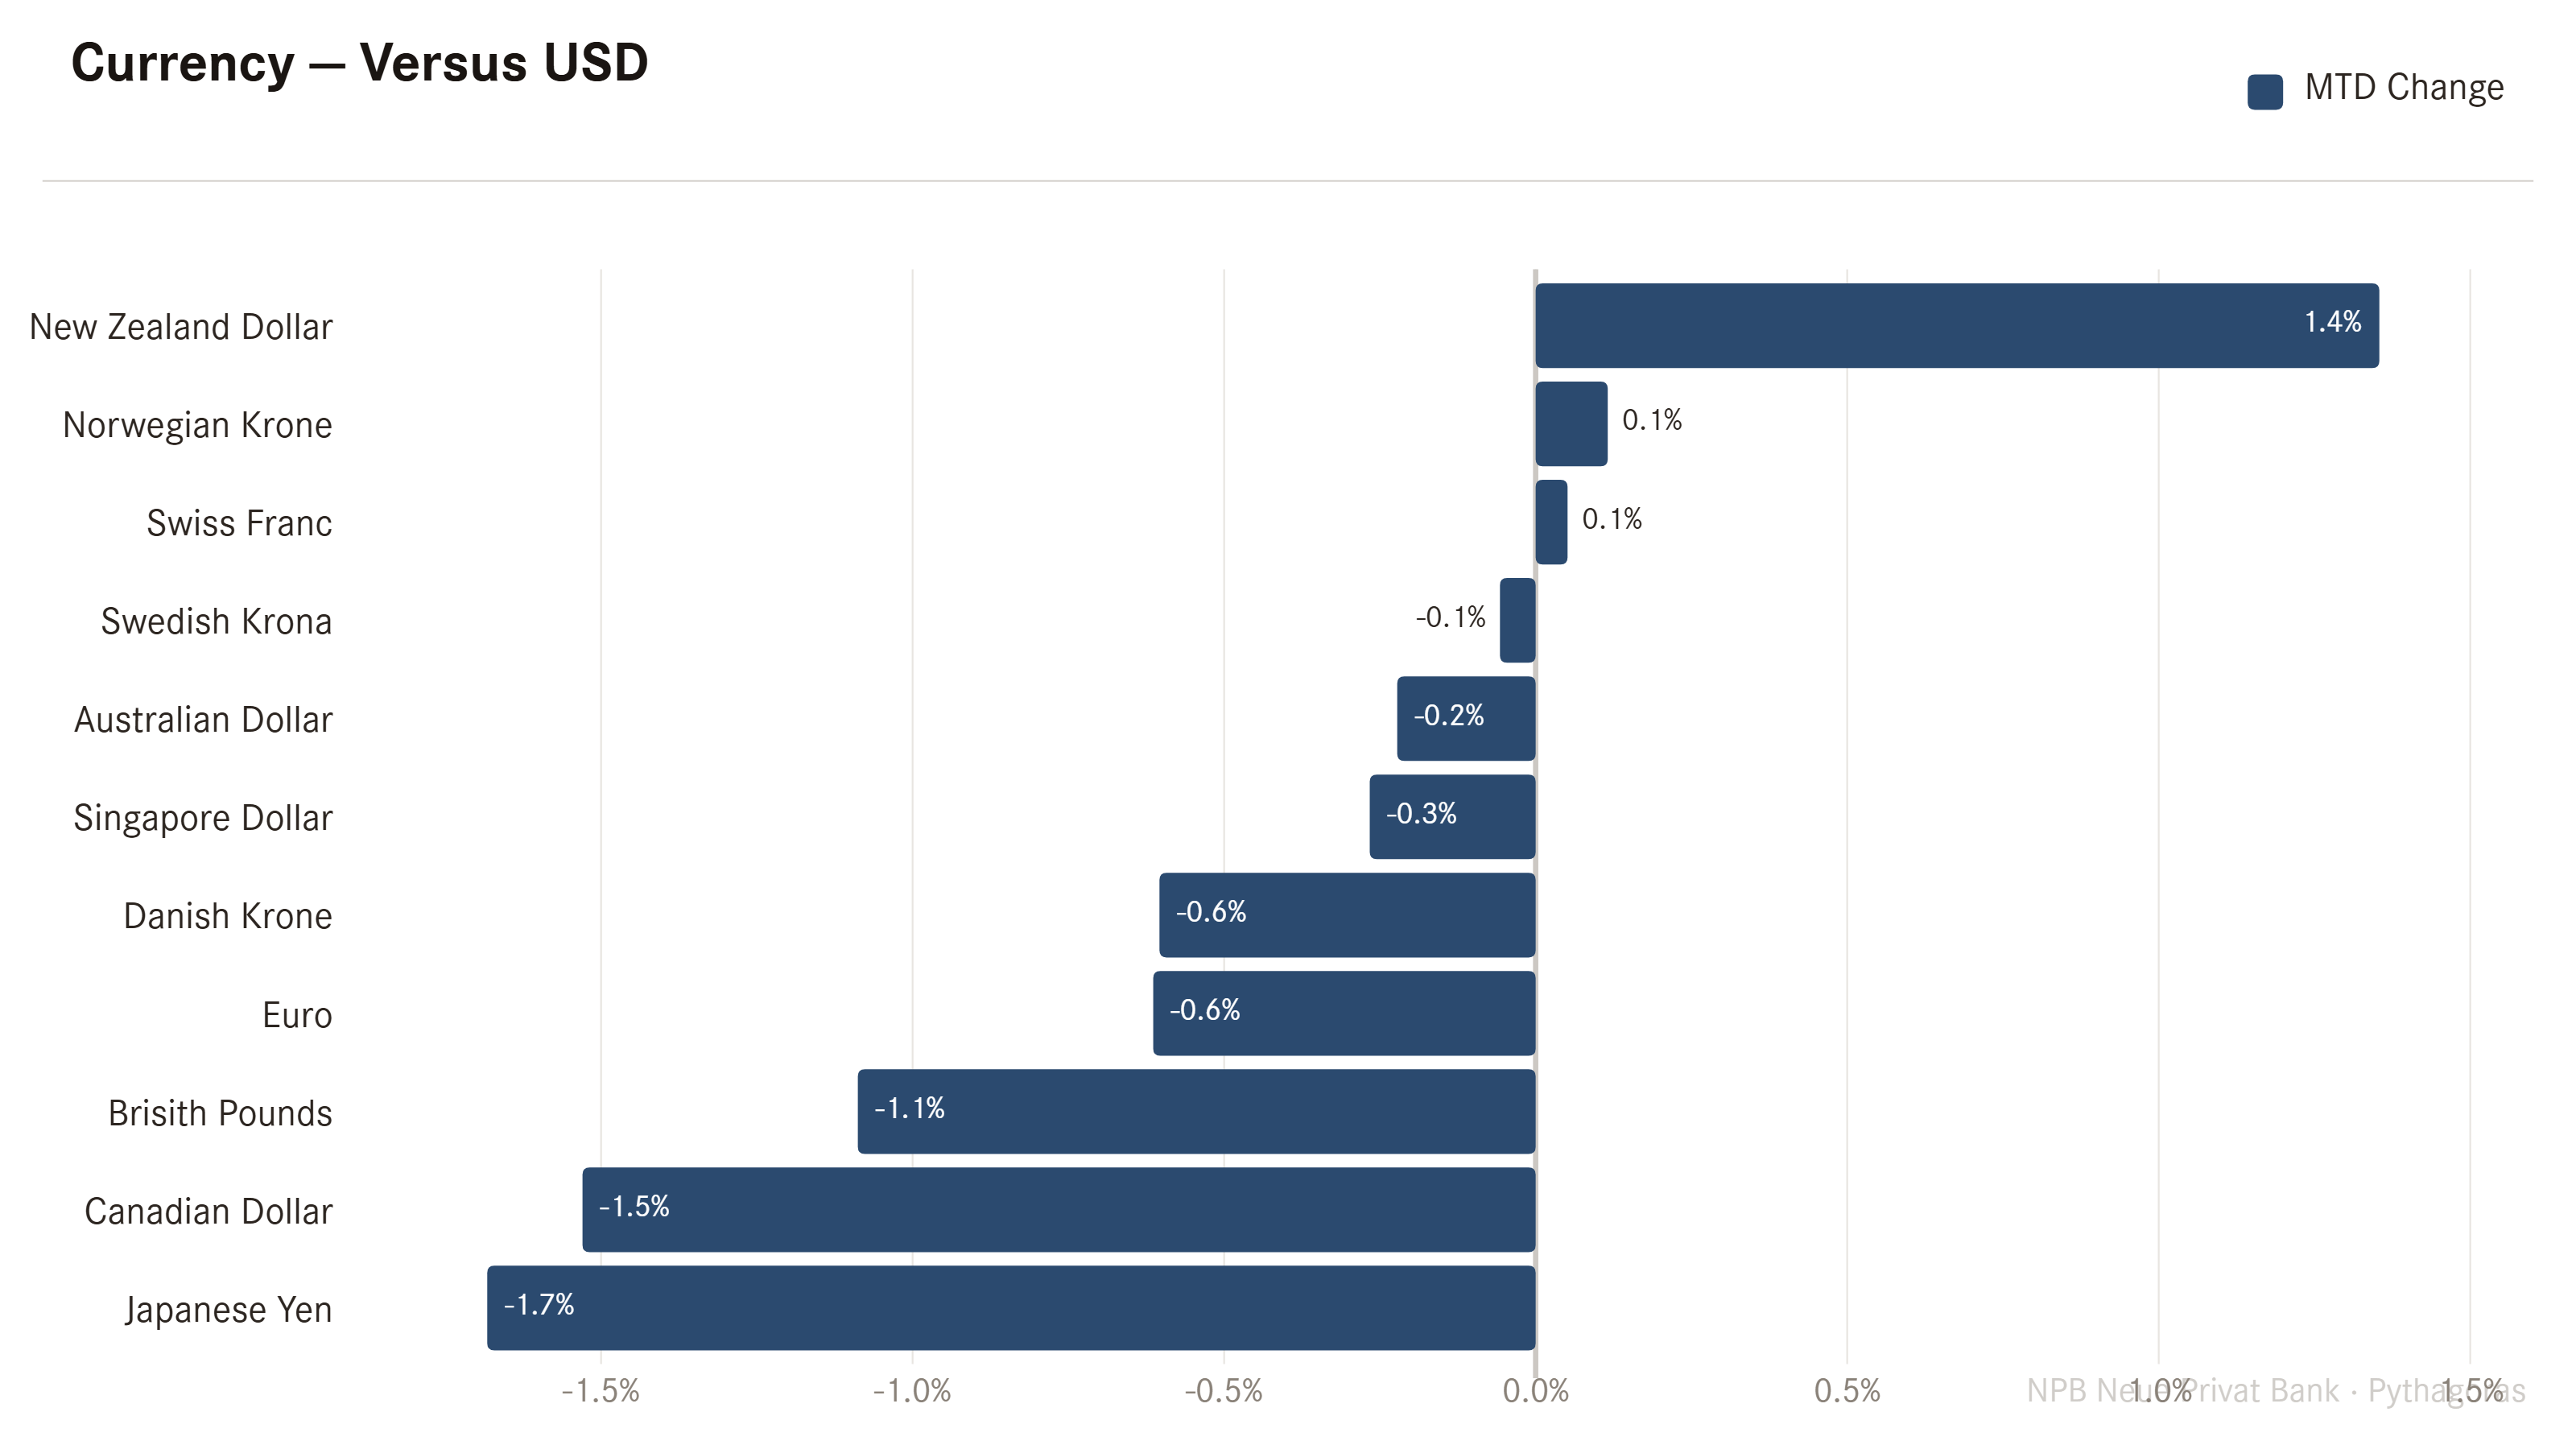
So, in other words, the Yen lost 1.7% versus the Greenback, whilst the New Zealand Dollar was a major winner.
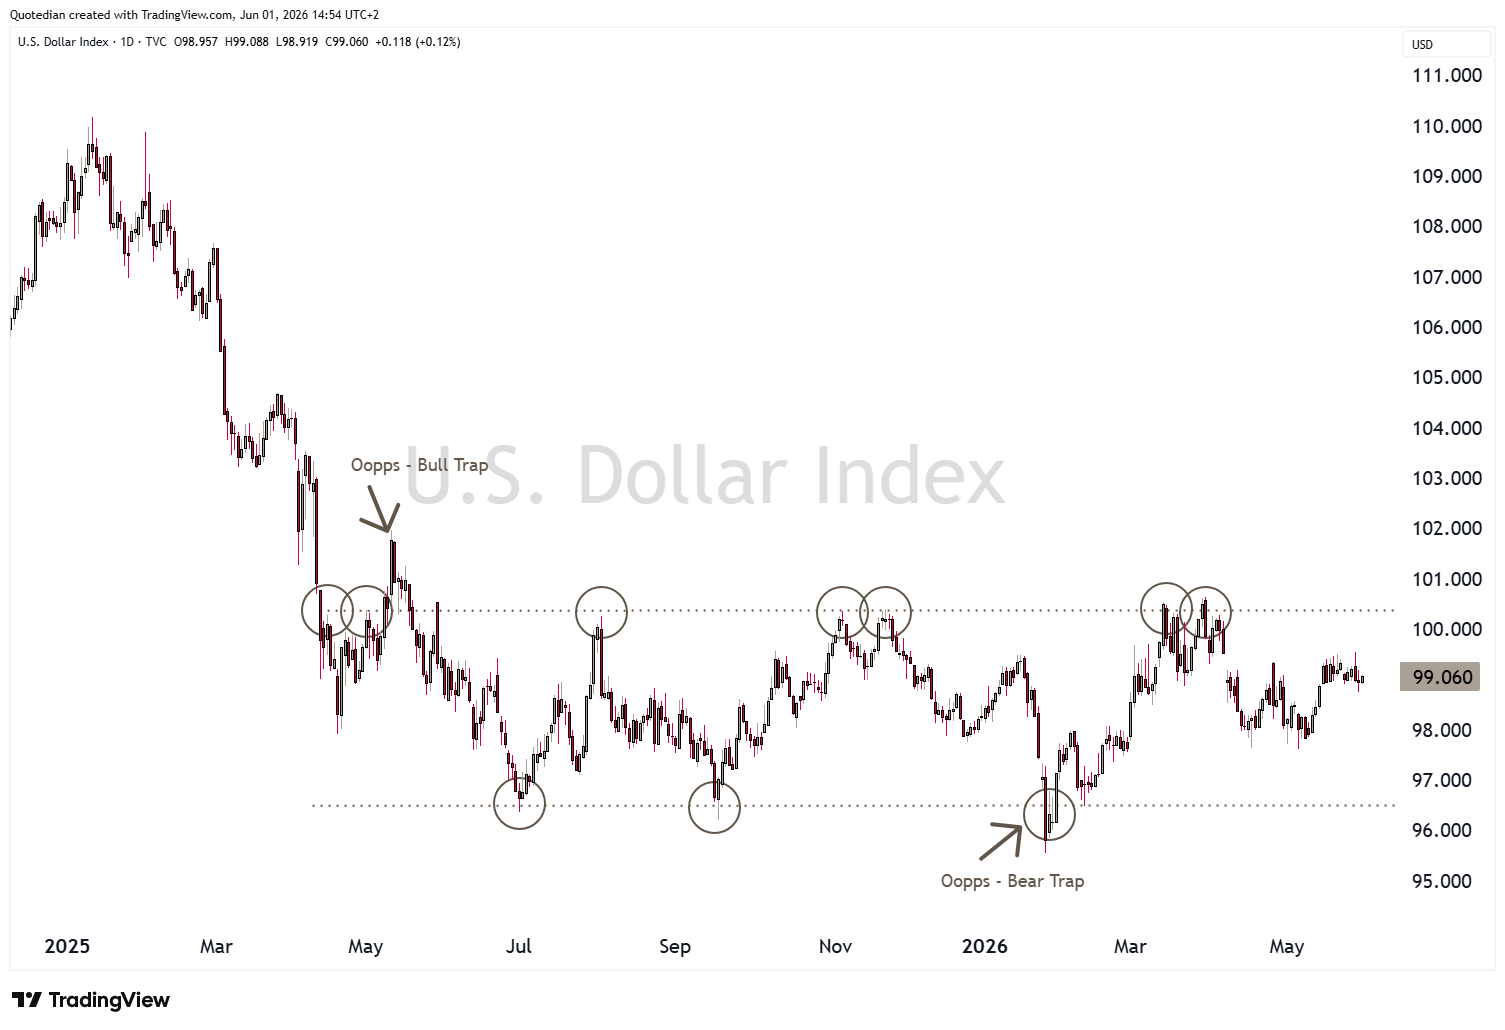
The US Dollar Index itself remains range stuck:
Looking at the same chart on a monthly candle chart,
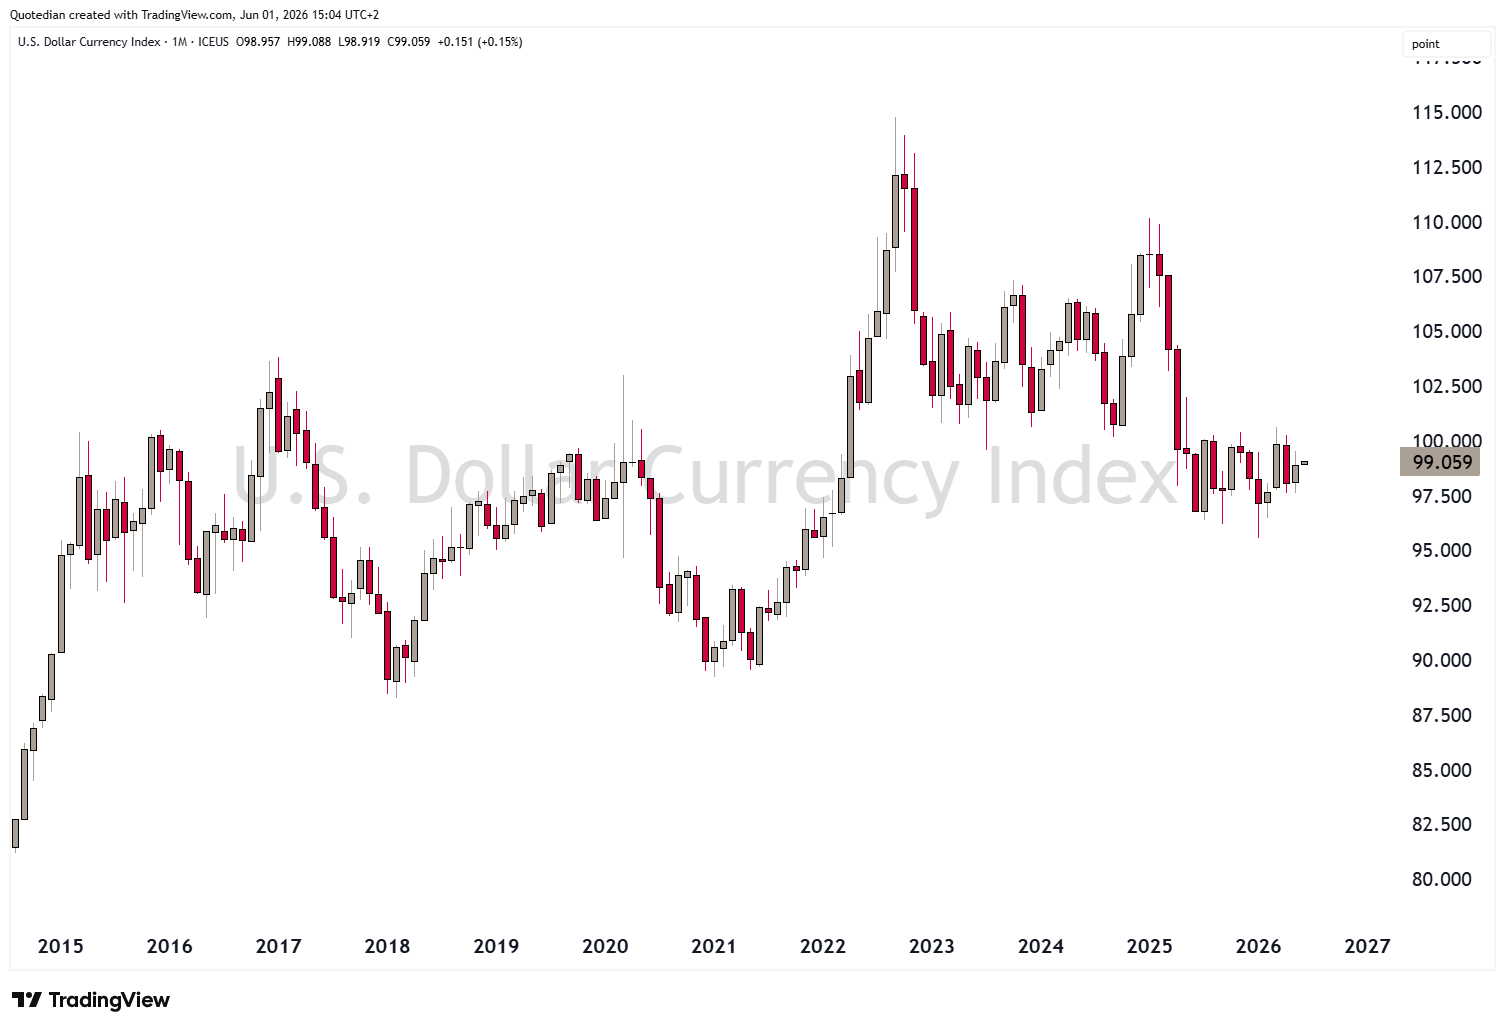
it “feels” like the DXY should head lower eventually, but feelings are not a valid investment strategy:
Similar as with the bond market, the most interesting currency chart comes out of the Land of the Rising Sun (yes, Japan):
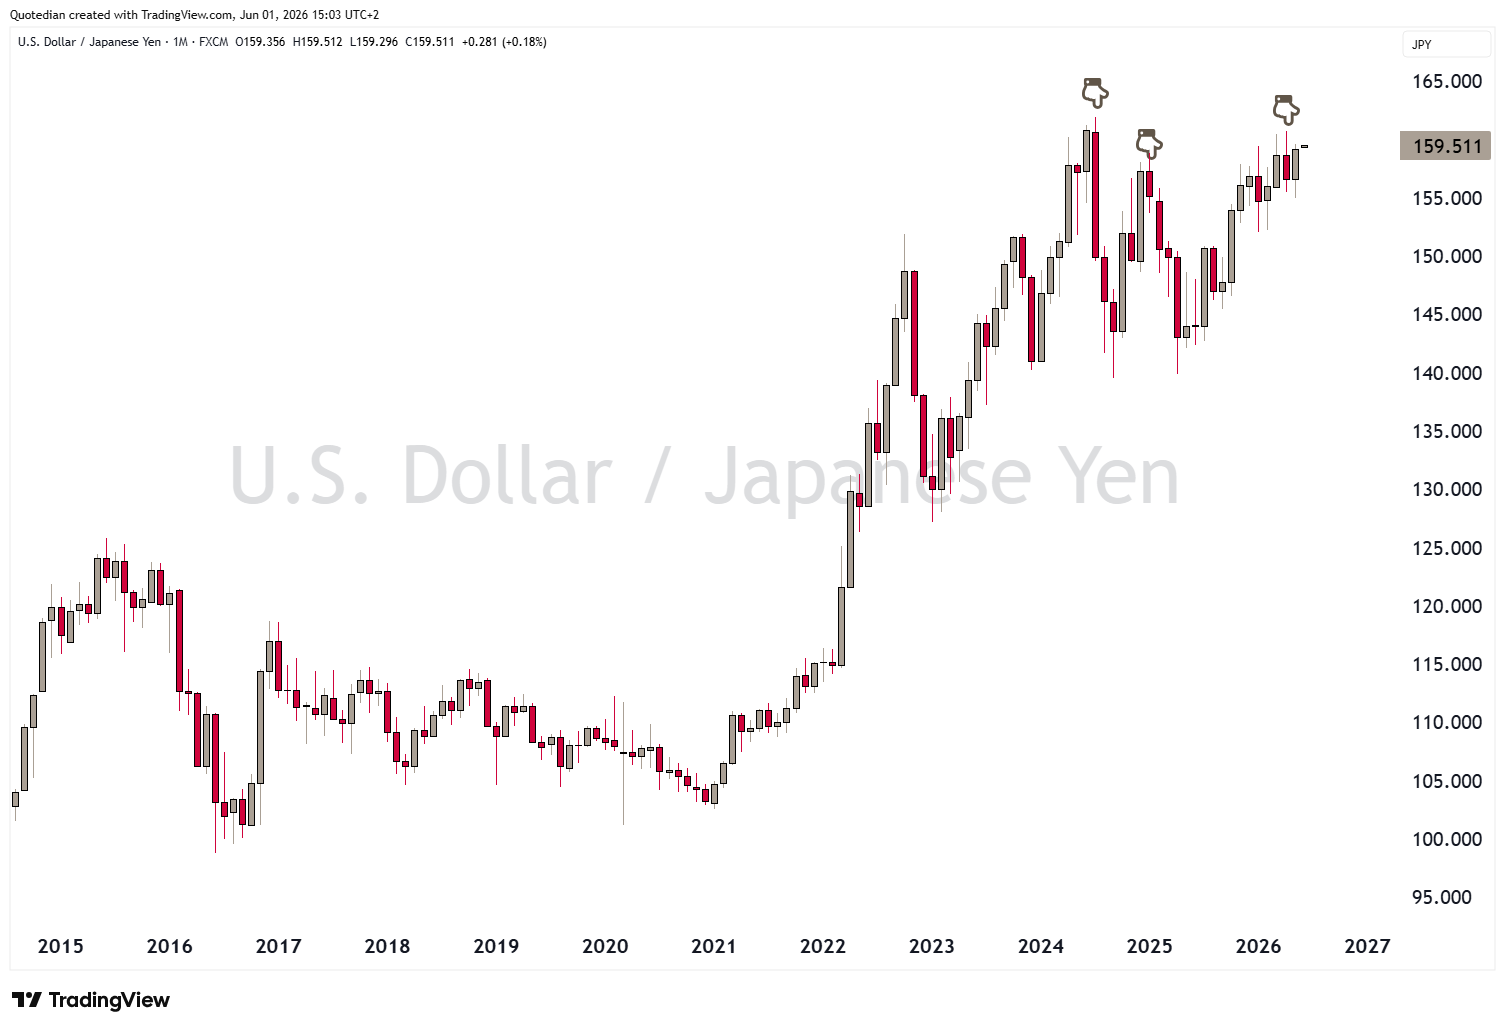
Interesting, because the MoF/BoJ seems to have put a clear lid on the currency pair at 160 and knocks down the exchange rate every time it approaches that level. However, it seems the market is out to test the country’s currency managers resolve, but rapidly rebounding after an initial sell-off.
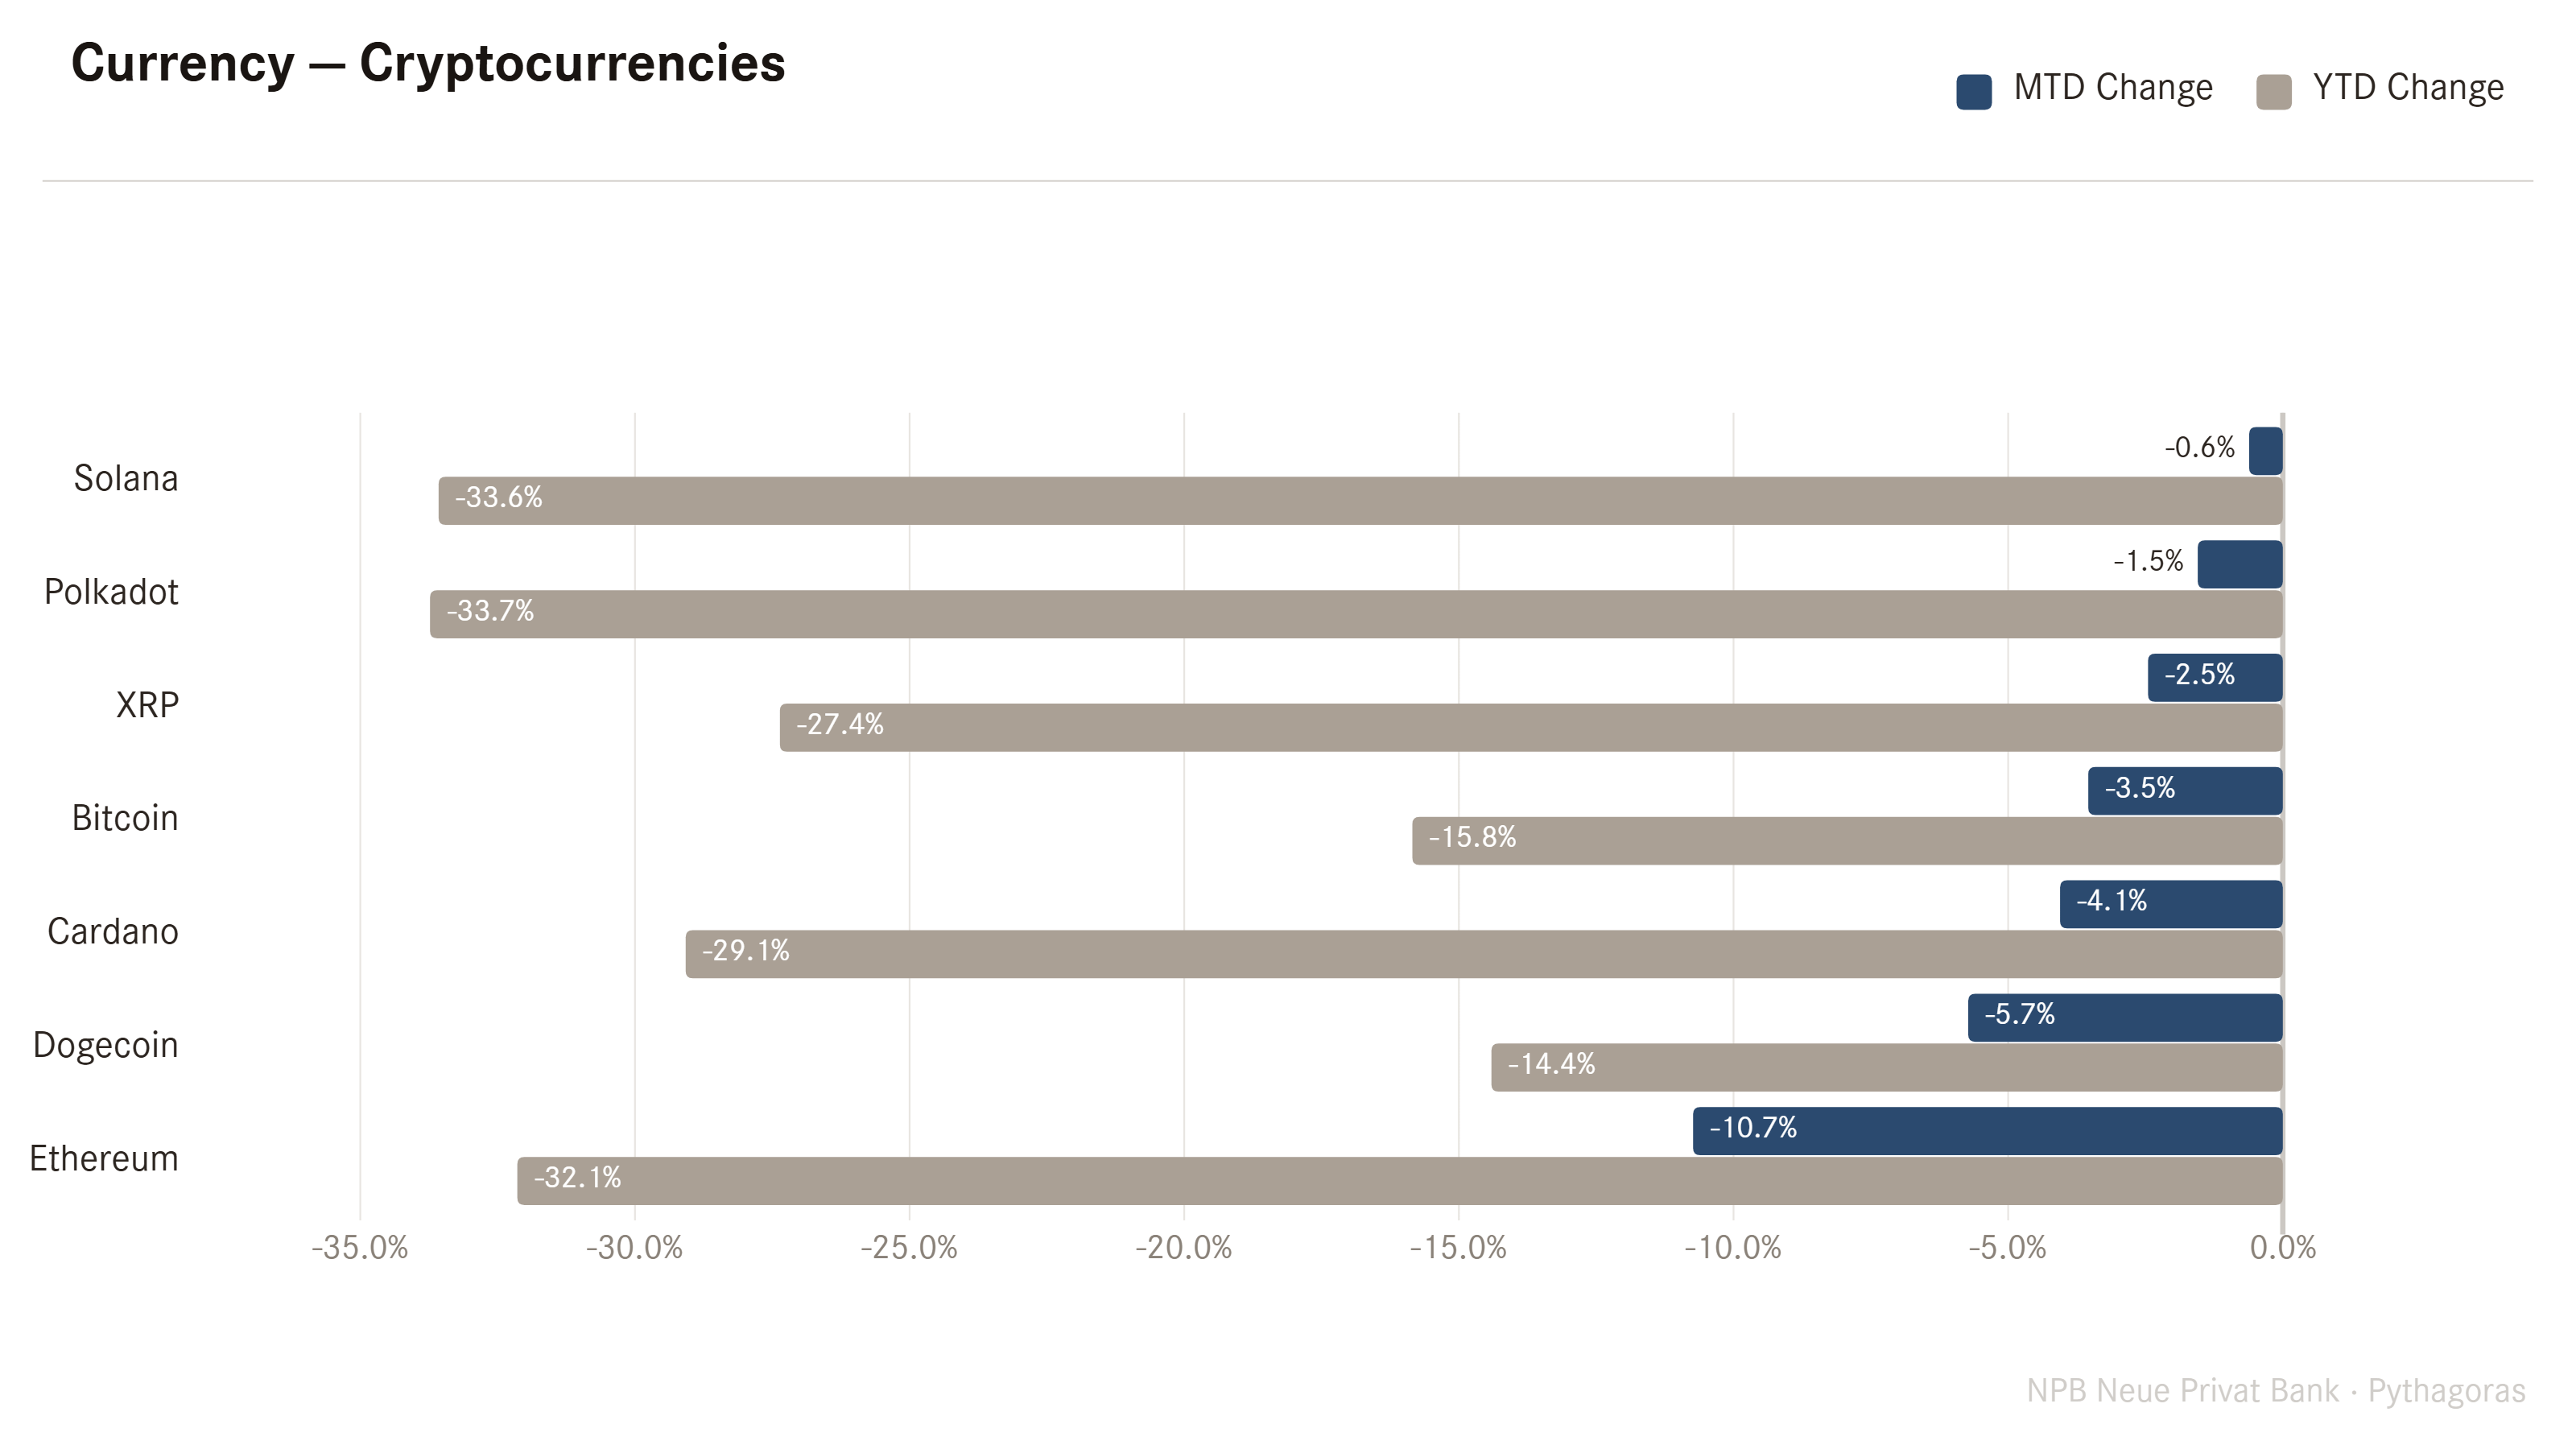
Cryptocurrencies are NOT having a good year, and May didn’t help at all:
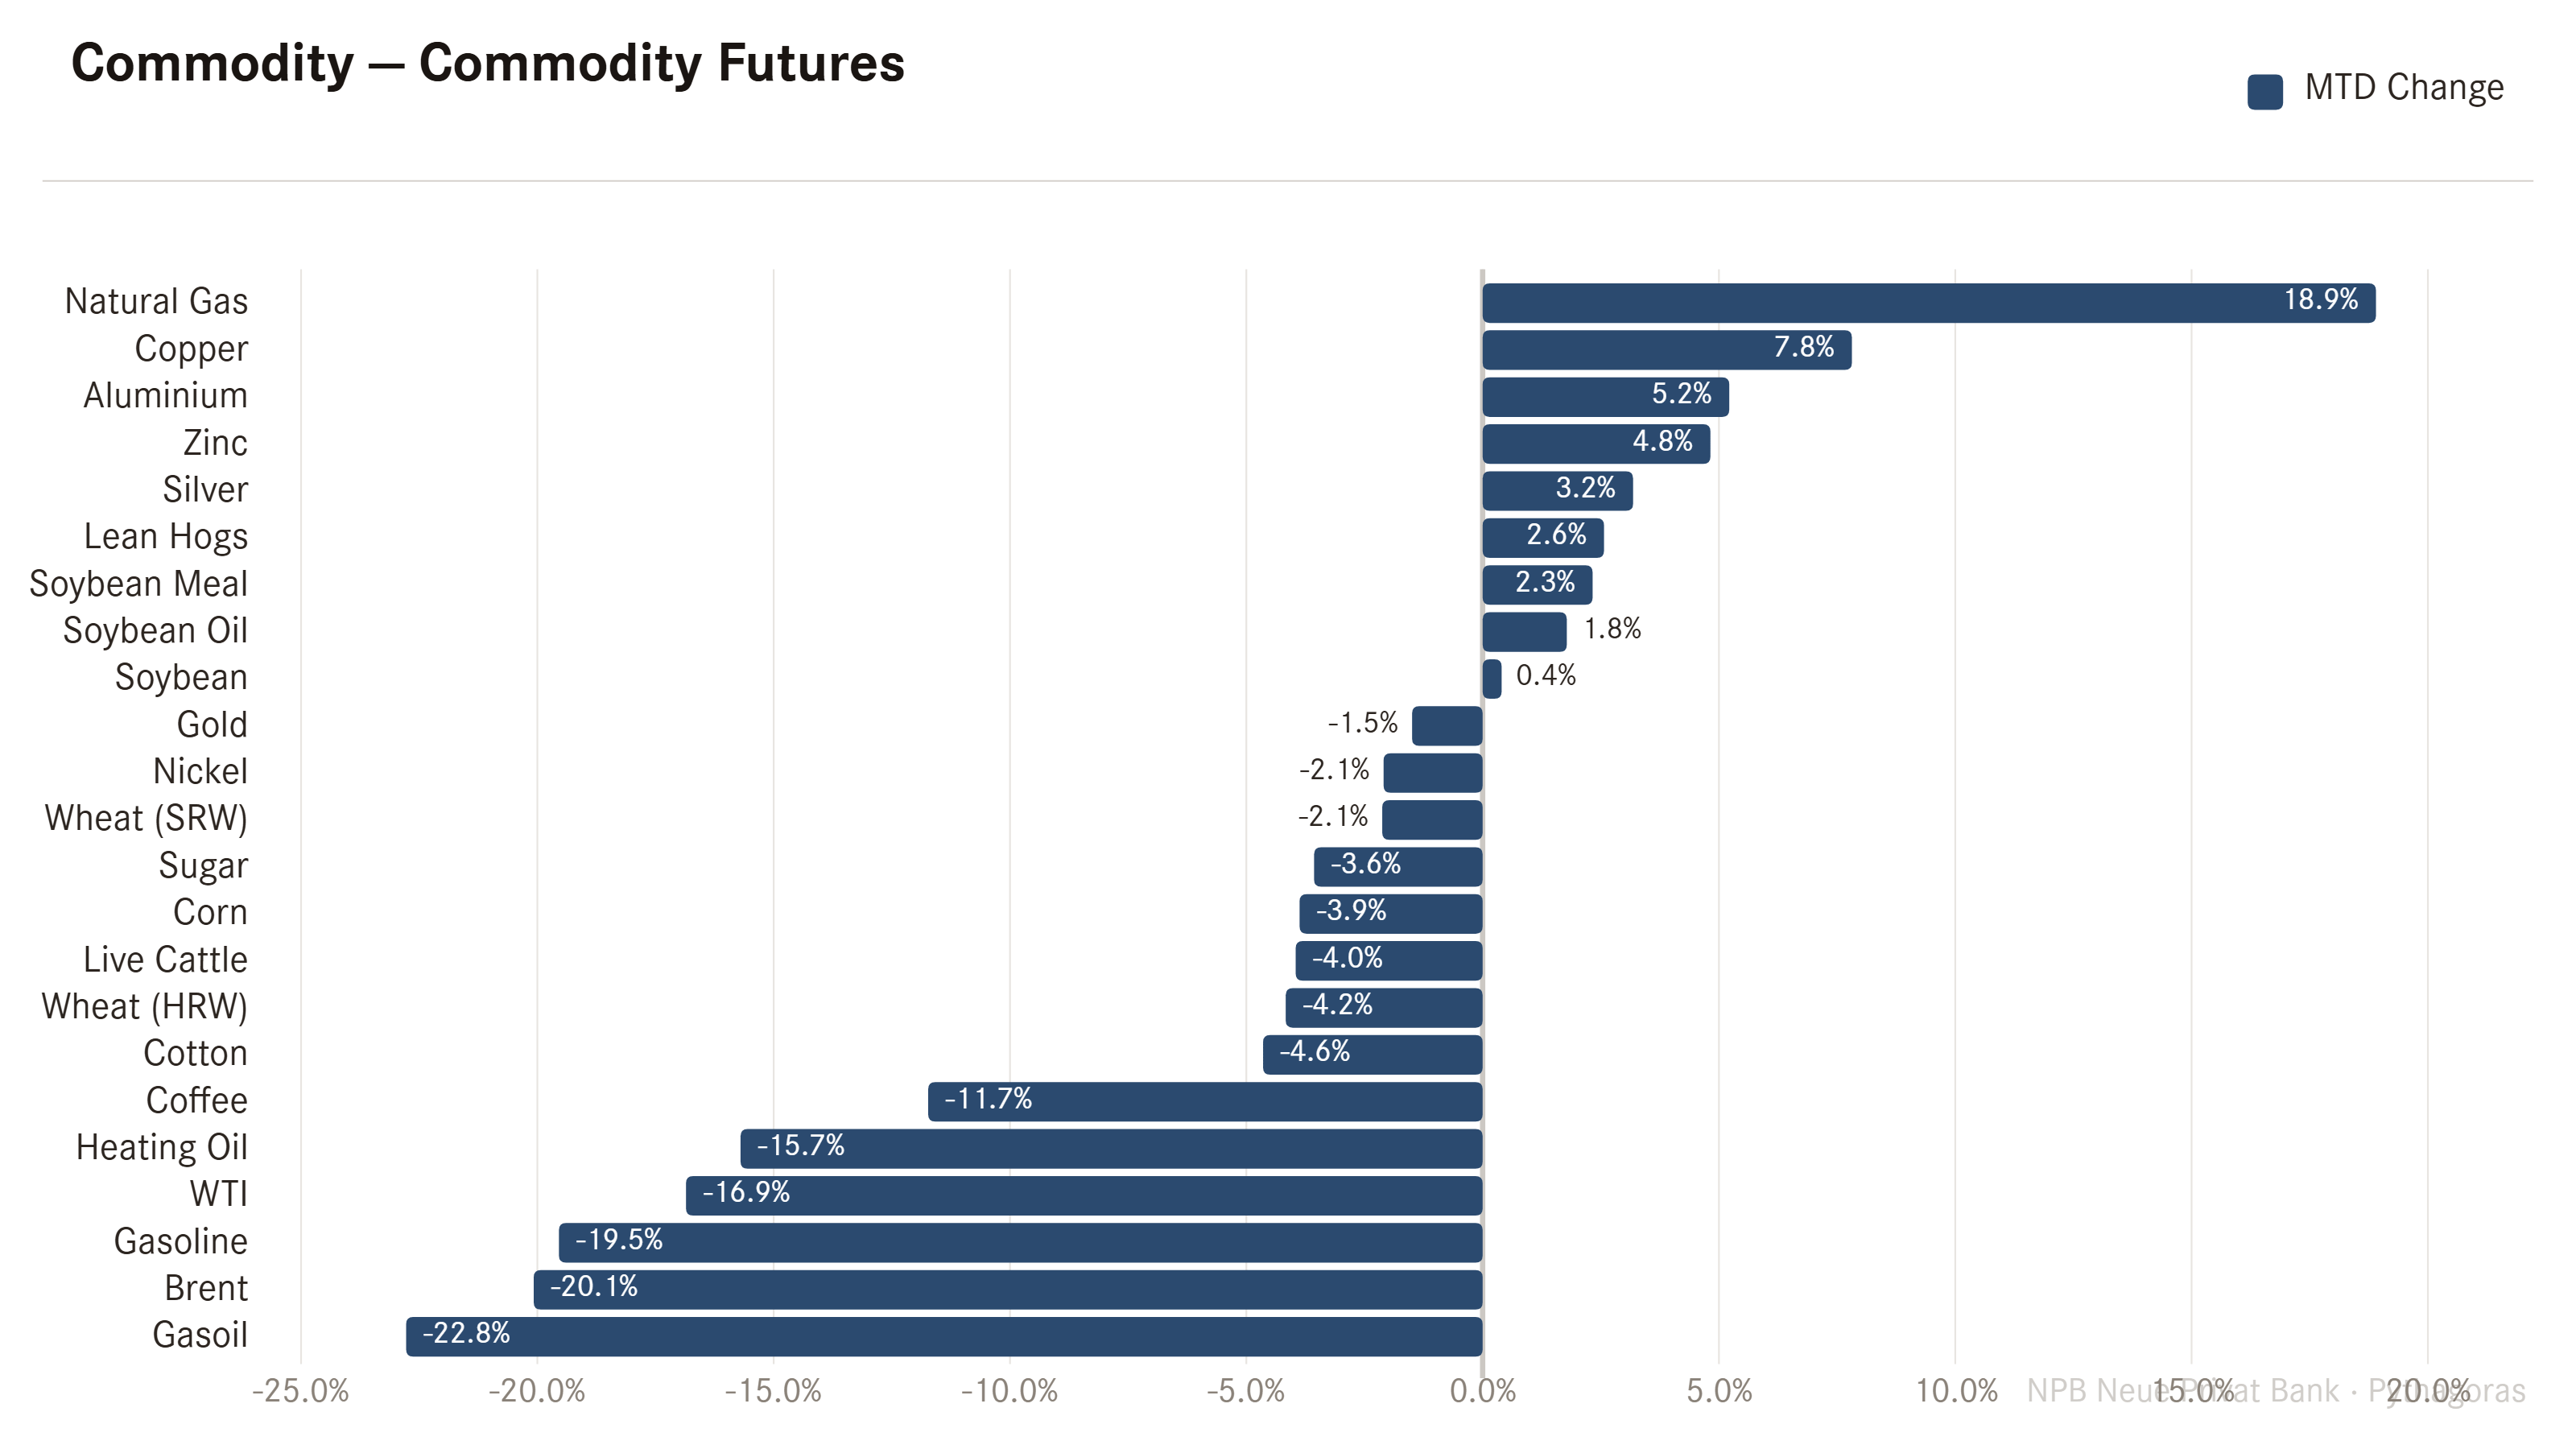
Finally, flourishing over into the eternal garden of commodities (see, there must be a poet in me somewhere deep, deep inside), May has mainly been about mean reversion:
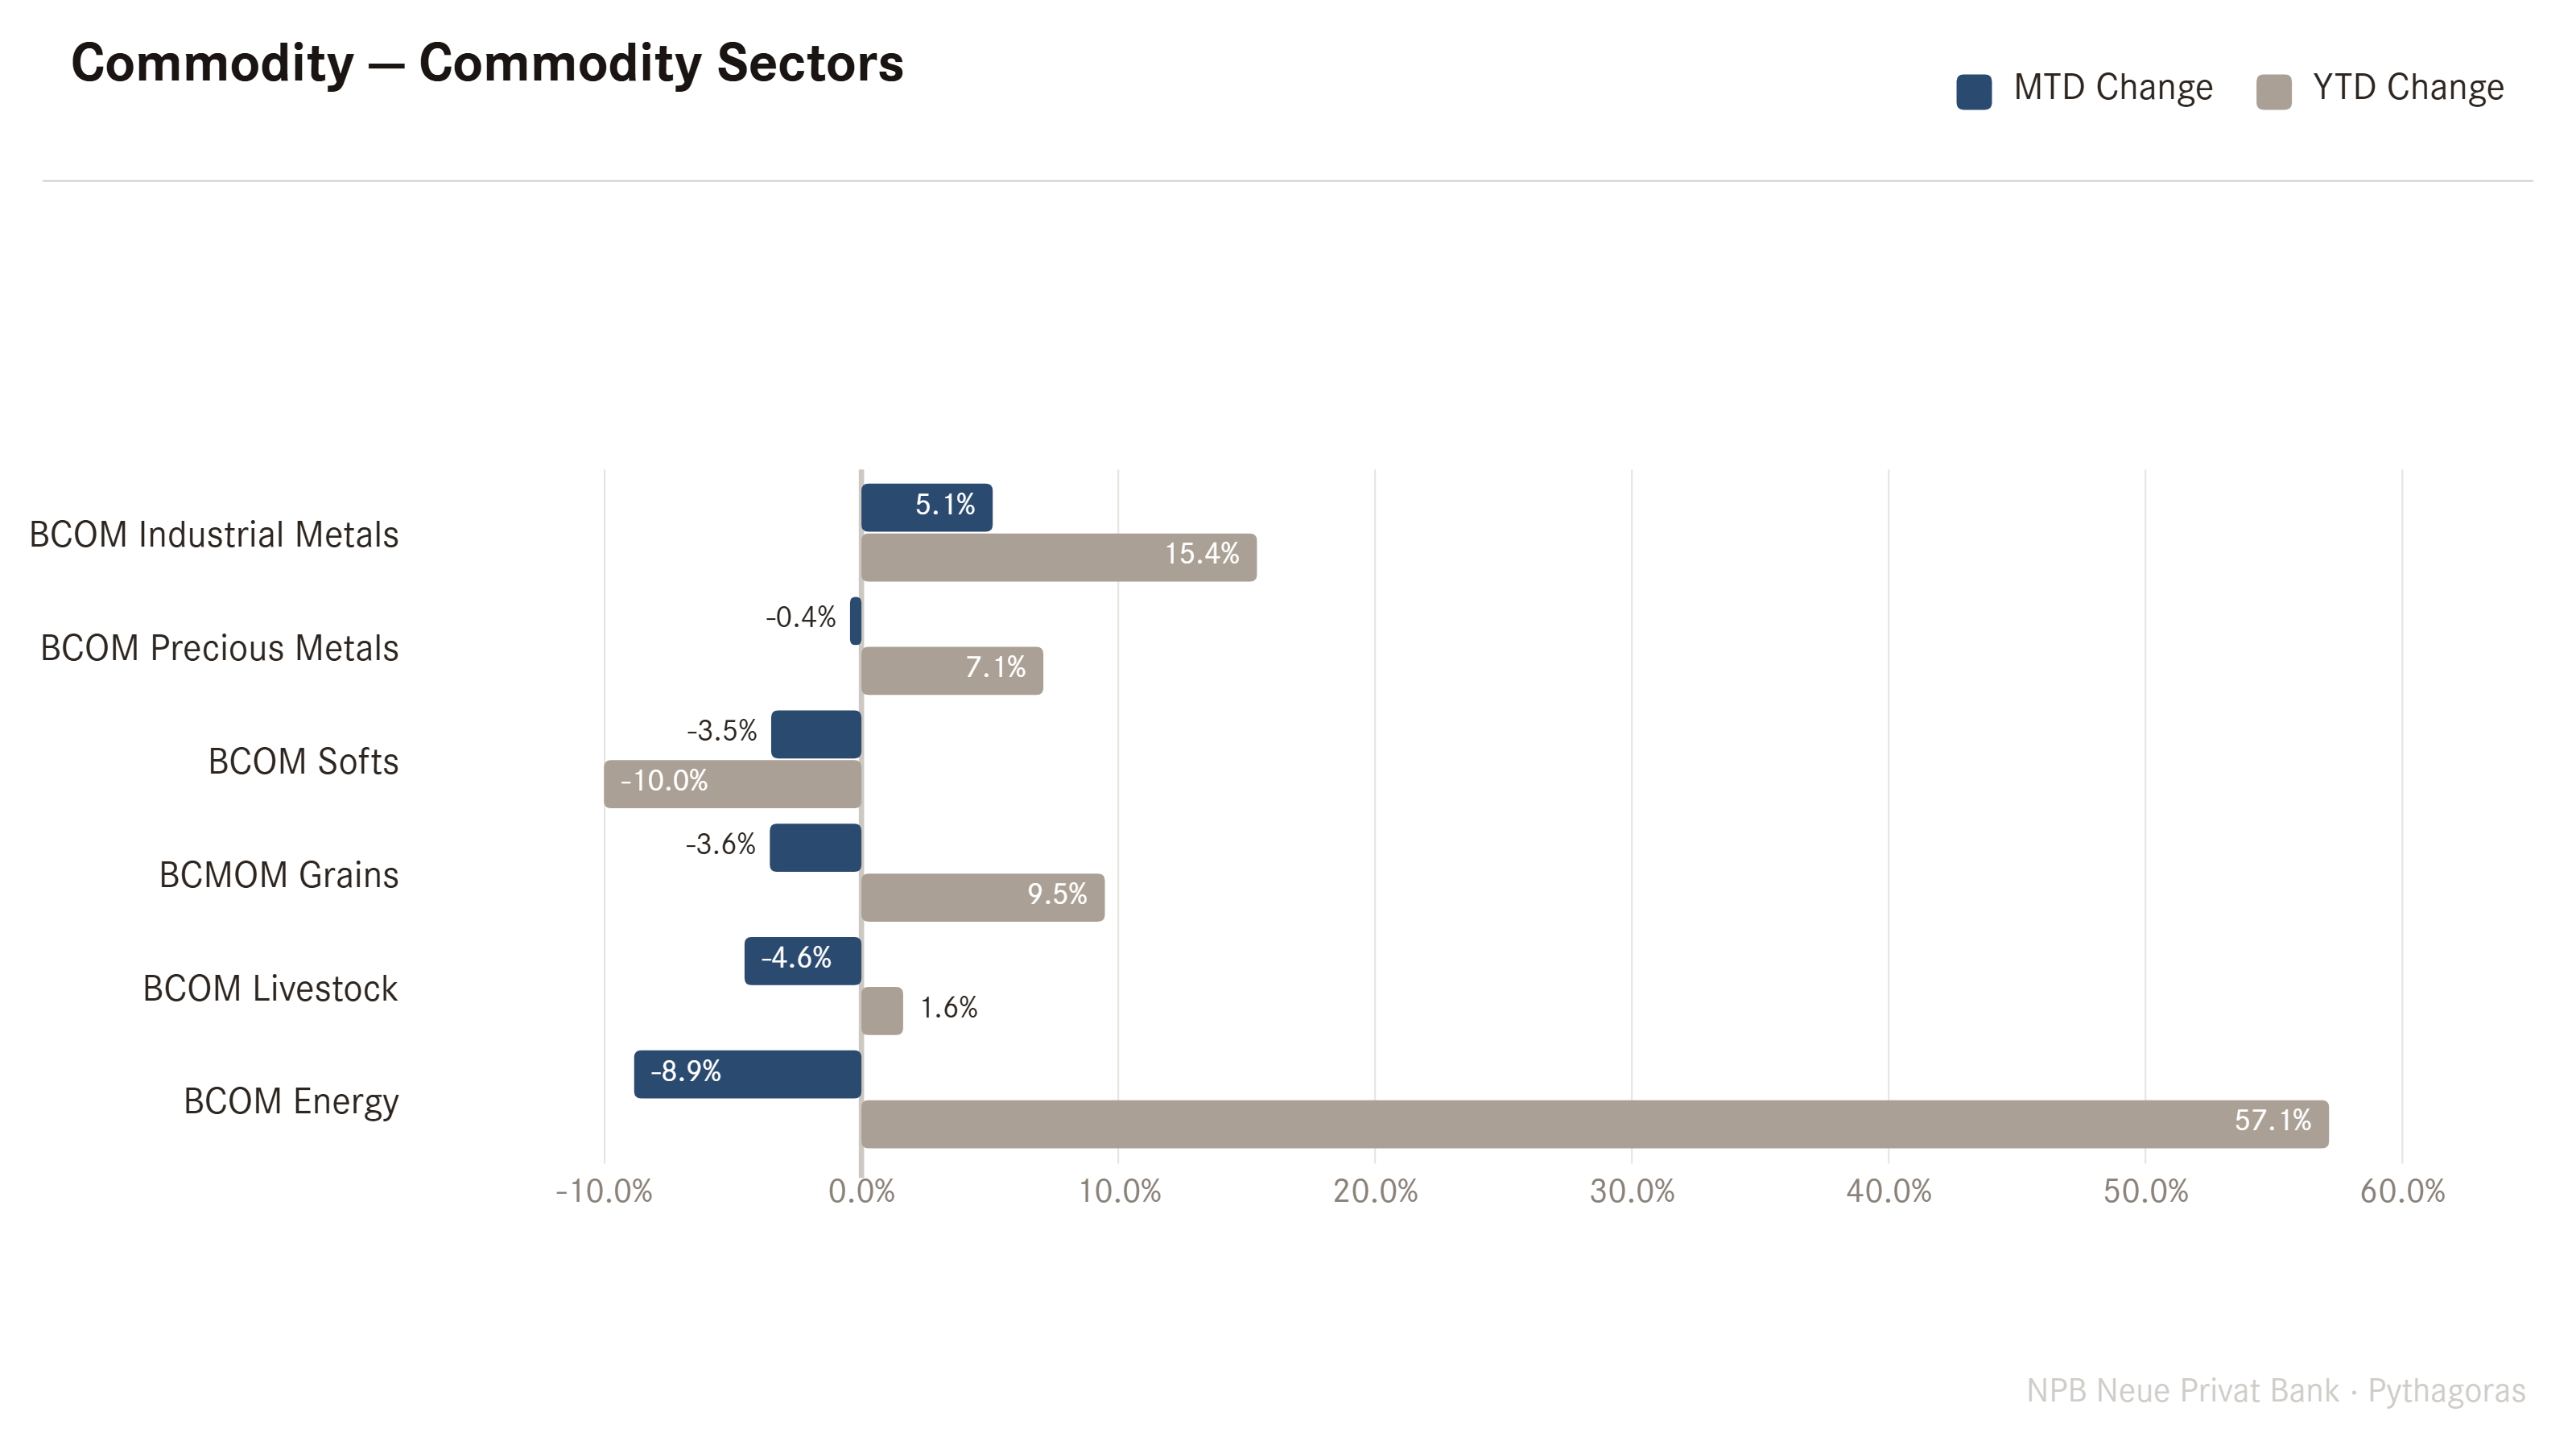
Precious metals, grains, livestock and energy all gave back some of their YTD gains. Only industrial metals continued to build on already existing positive performance, whilst softs continued to … eh….. well… soften!
Regarding Gold, we have been saying that for months now that the bubble has erstwhile burst, and a longer period of price consilidation will be necessary before a new upleg can be considered. This has served well to anyone listening to us:
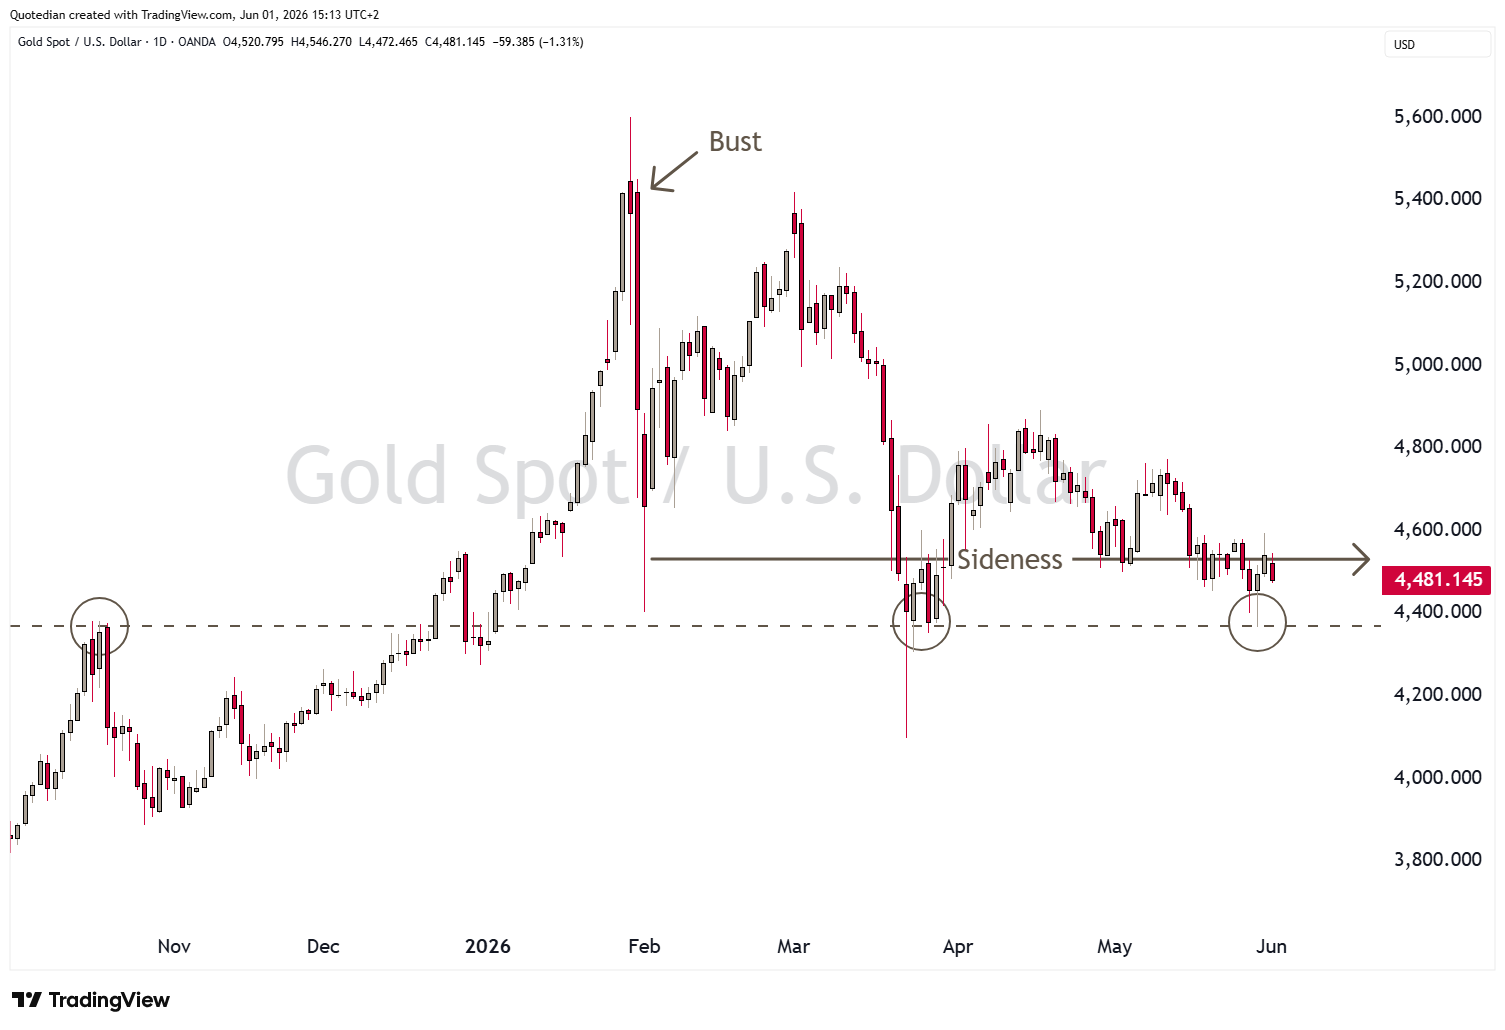
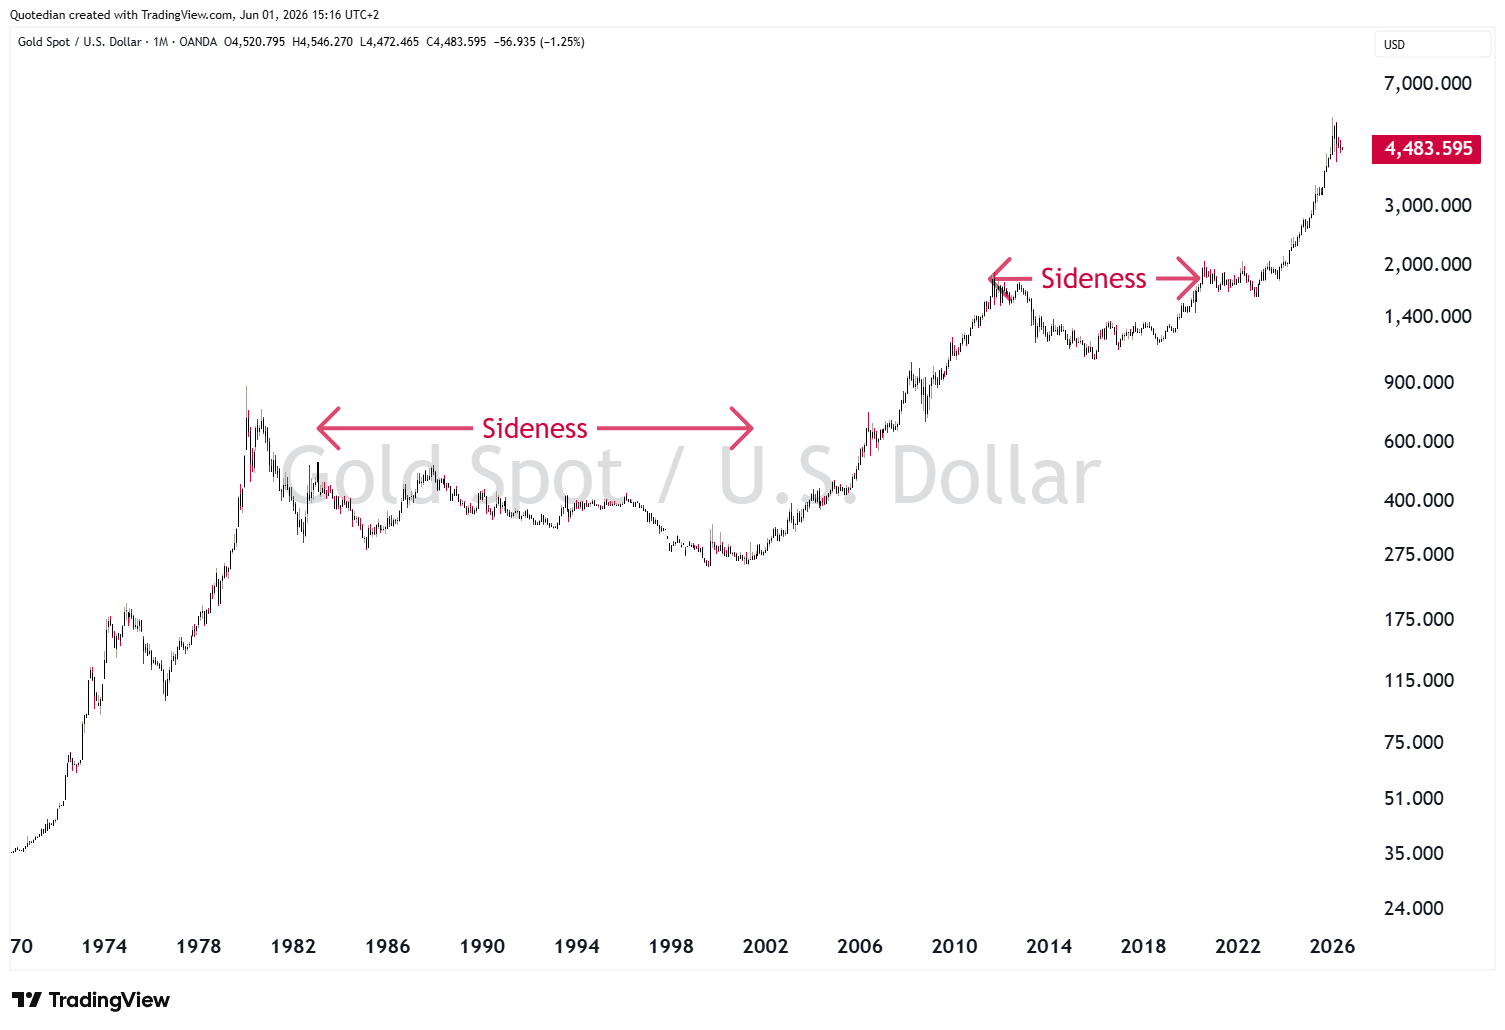
And let me repost this chart from a few weeks back:
One trade that likely has switched from long to at least neutral, probably short though, is crude:
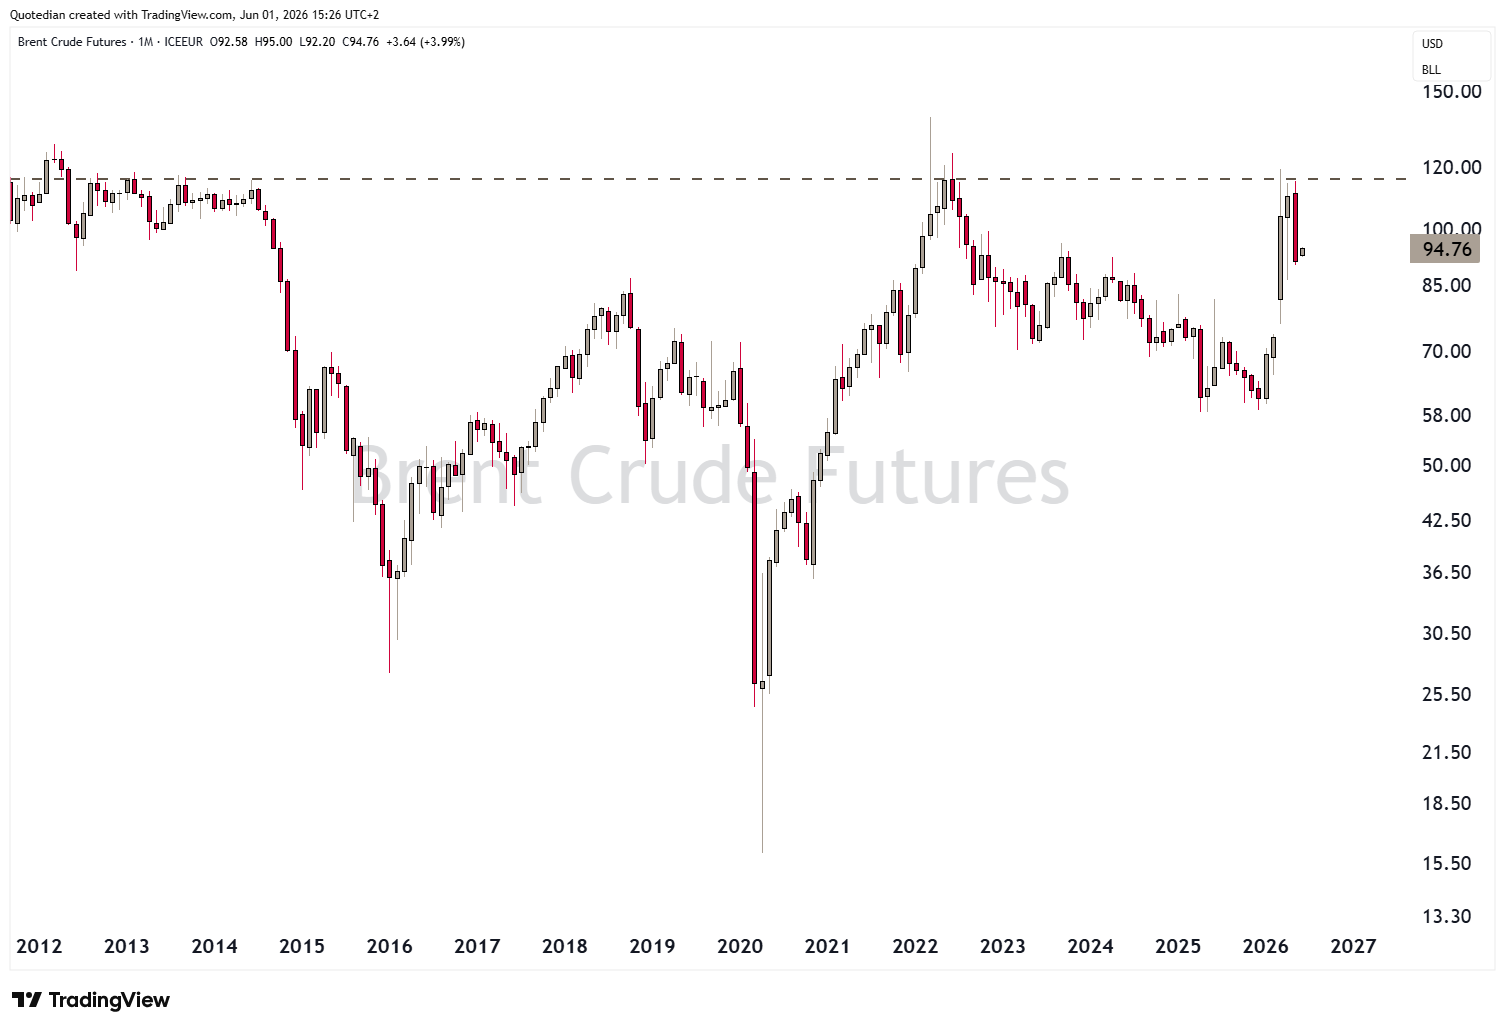
Unless a true, full-blown resurgence of kinetic activity, which for us is now a lower probability scenario, the price of black gold is likely to fall lower over the coming weeks to months. However, do not confuse the upcoming period of relative calm as “that was it!” from a geopolitical point of view. We continue to move within a multi-polar world, where conflicts are smaller but more often, but eventually (and unfortunately) lead into a wider, much more violent conflict.
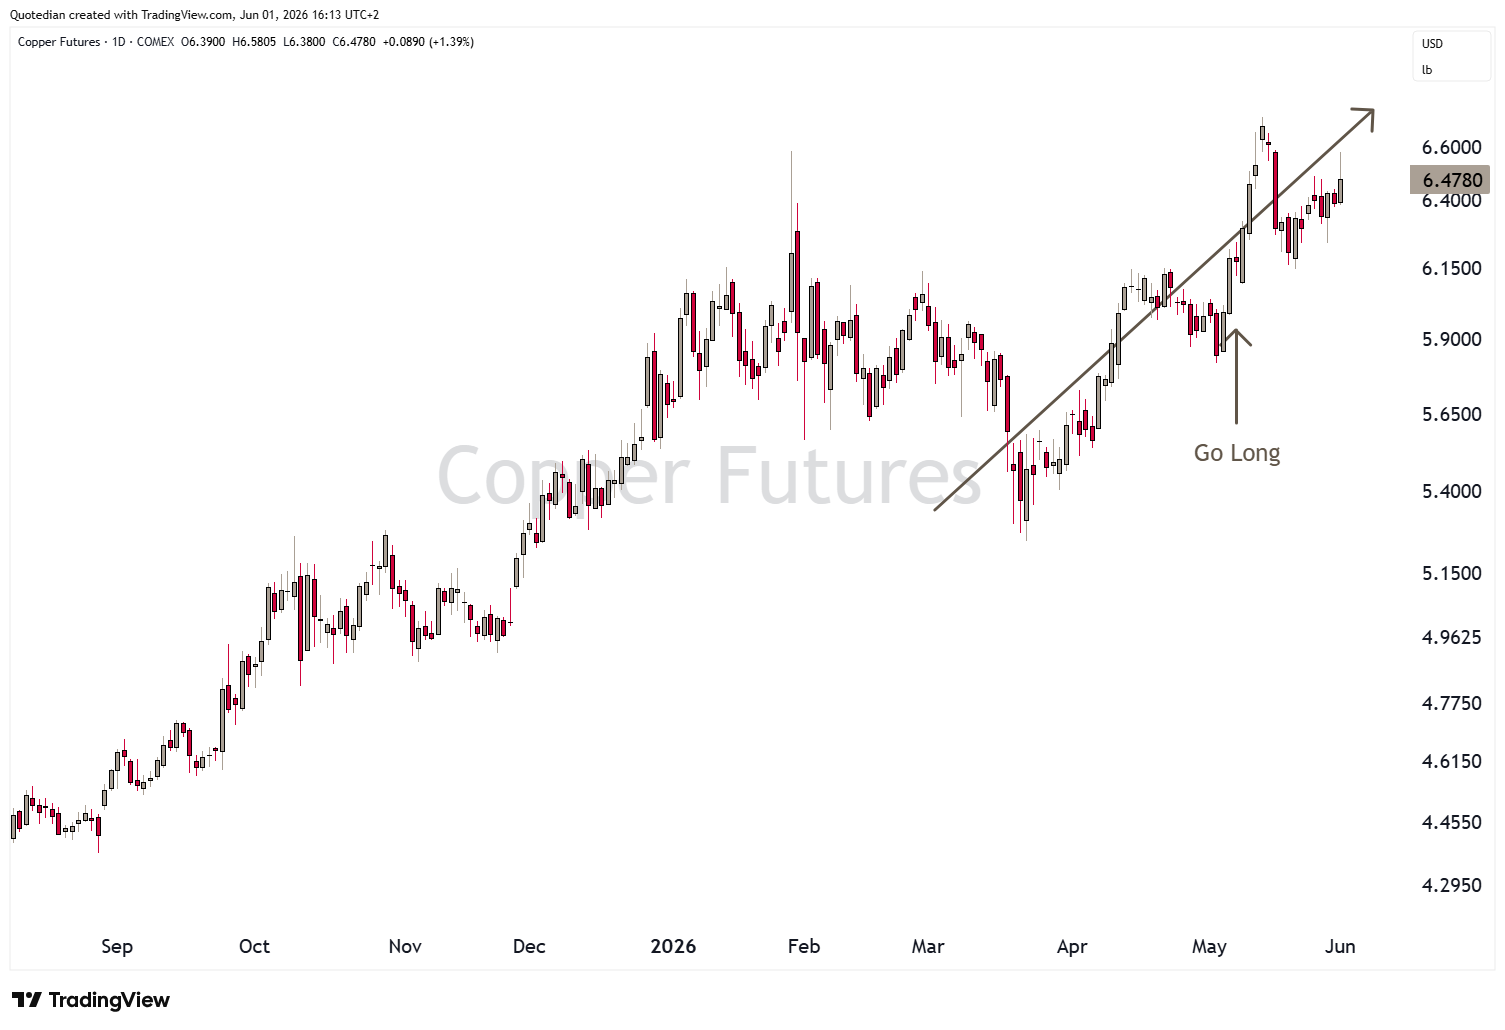
On that happy note, one last quick glance on our long copper idea, with which some volatility, is seemingly starting to get some traction:
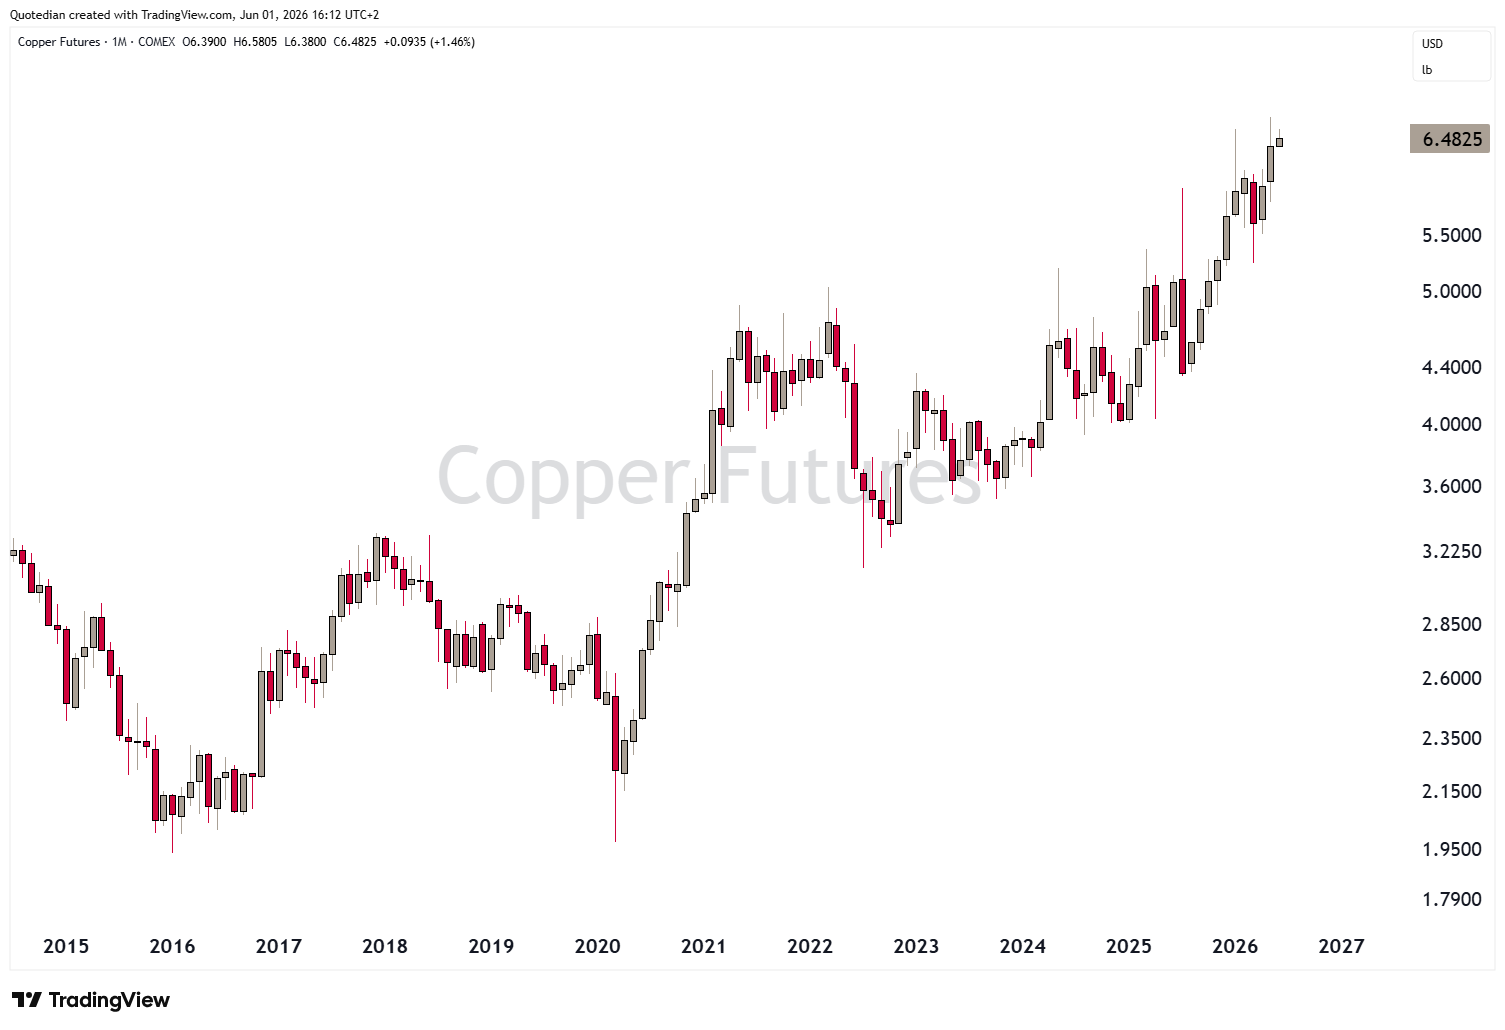
Here’s the longer-term (monthly) view of the same:
And finally, for completeness purpose, here are some other commodity futures movers during May:

Without any further ado, it is time to bid farewell (no worries, for this week only).
Remember that there will be no intra-week, daily updates this week, but we will be back in old freshness (oxymoron-alarm!) and reinforced next week!

André

Everything in this document is for educational purposes only (FEPO)
Nothing in this document should be considered investment advice
Investing real money can be costly; don’t do stupid shit
Leave politics at the door—markets don’t care.
Past performance is hopefully no indication of future performance
The views expressed in this document may differ from the views published by NPB Neue Privat Bank AG