

“Never short a dull market.”
— Wall Street Adage
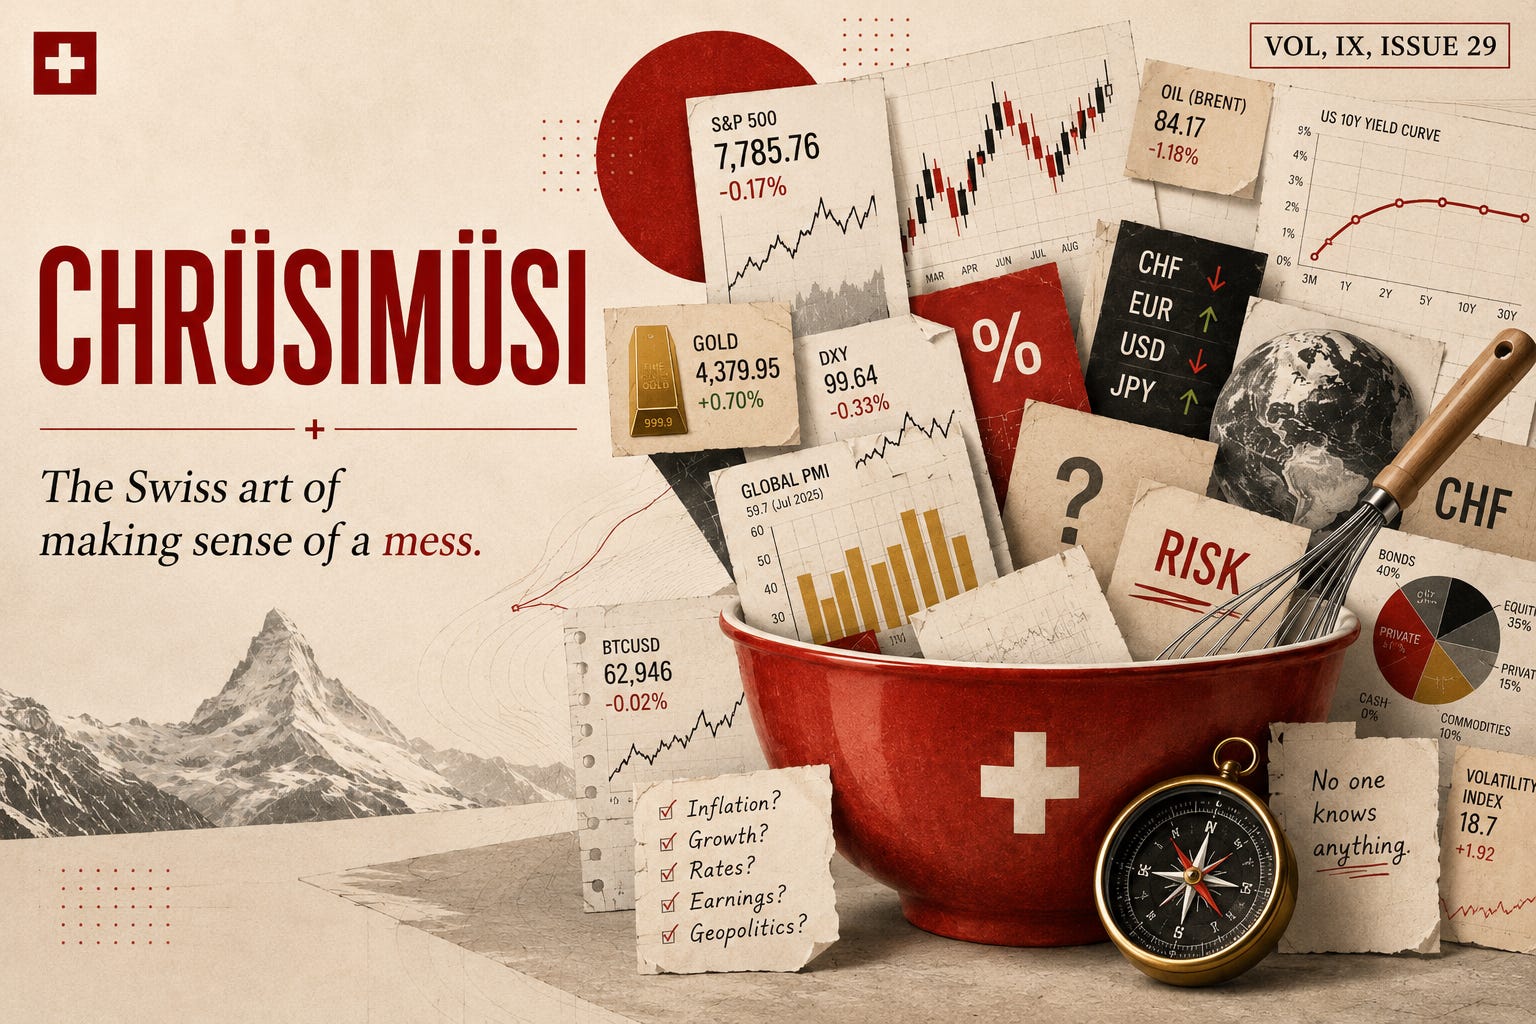
Chrüsimüsi is one of those wonderfully useful Swiss-German words that does not translate particularly elegantly. It describes a mishmash, jumble, muddle — a collection of things thrown together without any obvious order or common thread.
Which, conveniently, is also a pretty accurate description of this week’s Quotedian. No overarching thesis. Just a handful of charts that caught my eye — some important, some curious, some possibly contradictory. In other words: a proper market Chrüsimüsi.
Hence, without further ado, let’s start our CHRÜSIMÜSI — The Swiss art of making sense of a mess.

Given the absence of any exogenous shock (read: Trump social media feed post), equities should be able to drift higher into early September
The rally is broadening, with a rotation from tech stocks to (nearly) everything else is taking place
Bond yields are pushing higher, which eventually could unsettle equity investors
We remain USD bears, but also see a trading opportunity in the EUR/USD
Gold (and silver) have possibly found a bottom

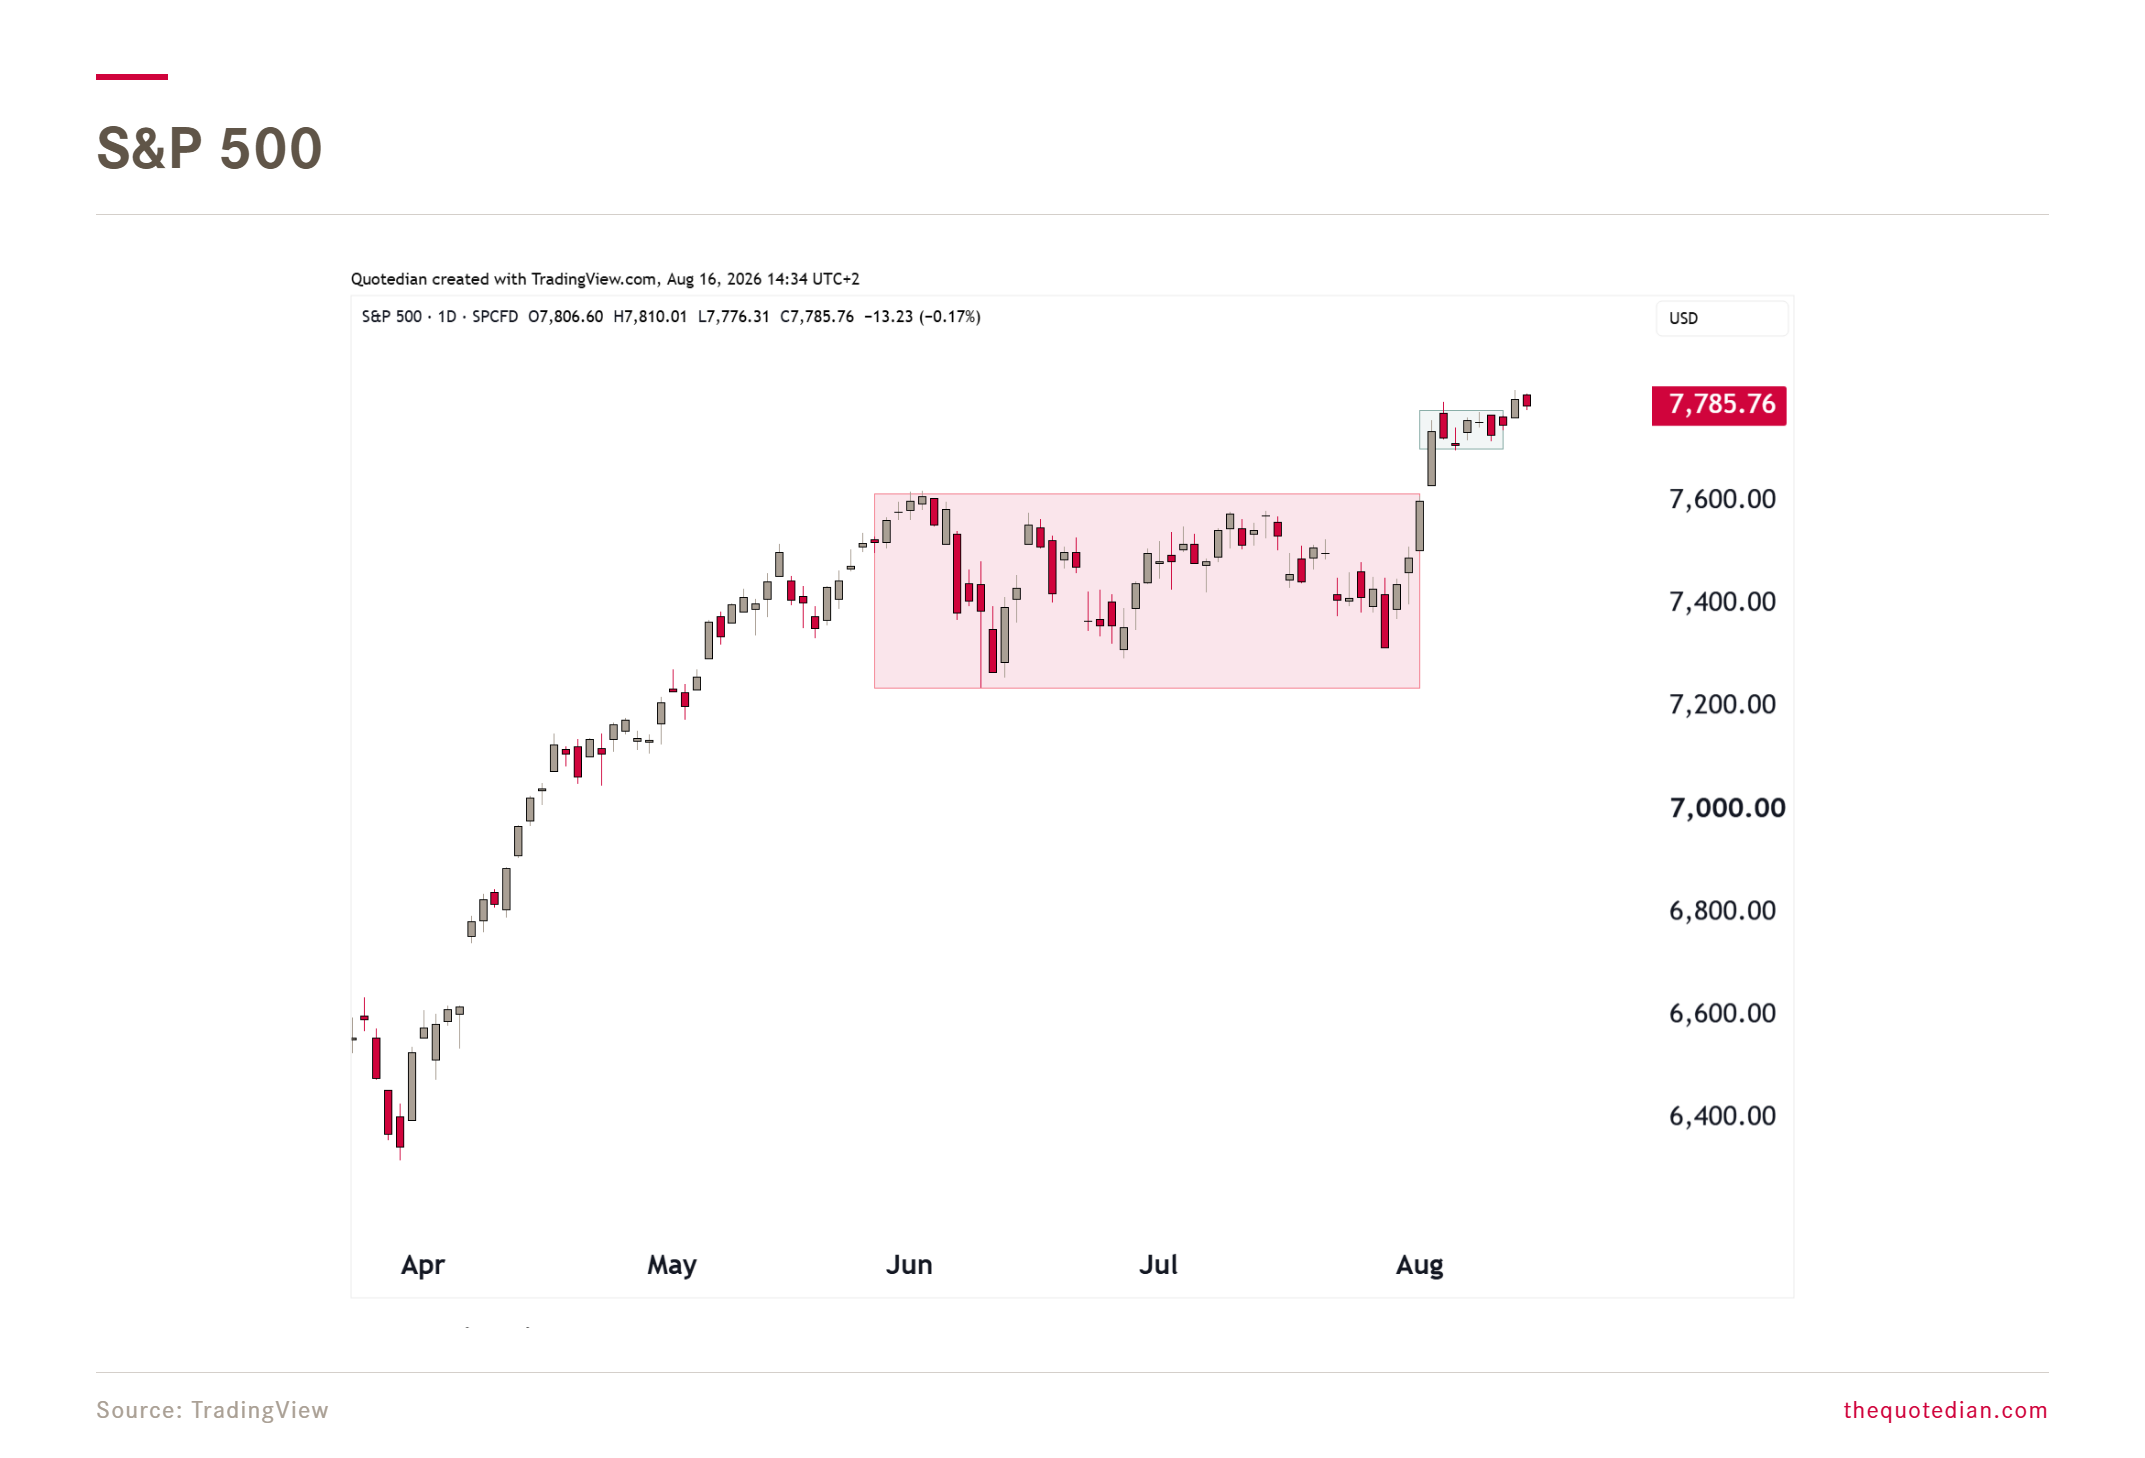
Our Quote-of-the-Week suggests to “never short a dull market” … and the S&P 500 proved that once again to be true on two fractal levels. The first was that dull (well, maybe frustrating is a better word than dull in this case) period (red box) from early June to Augst 4th, when the market finally broker higher:
Now, we had a mini-fractal of this over the past two weeks (blue zone). Let’s zoom in on that via the hourly (60 minutes) chart:
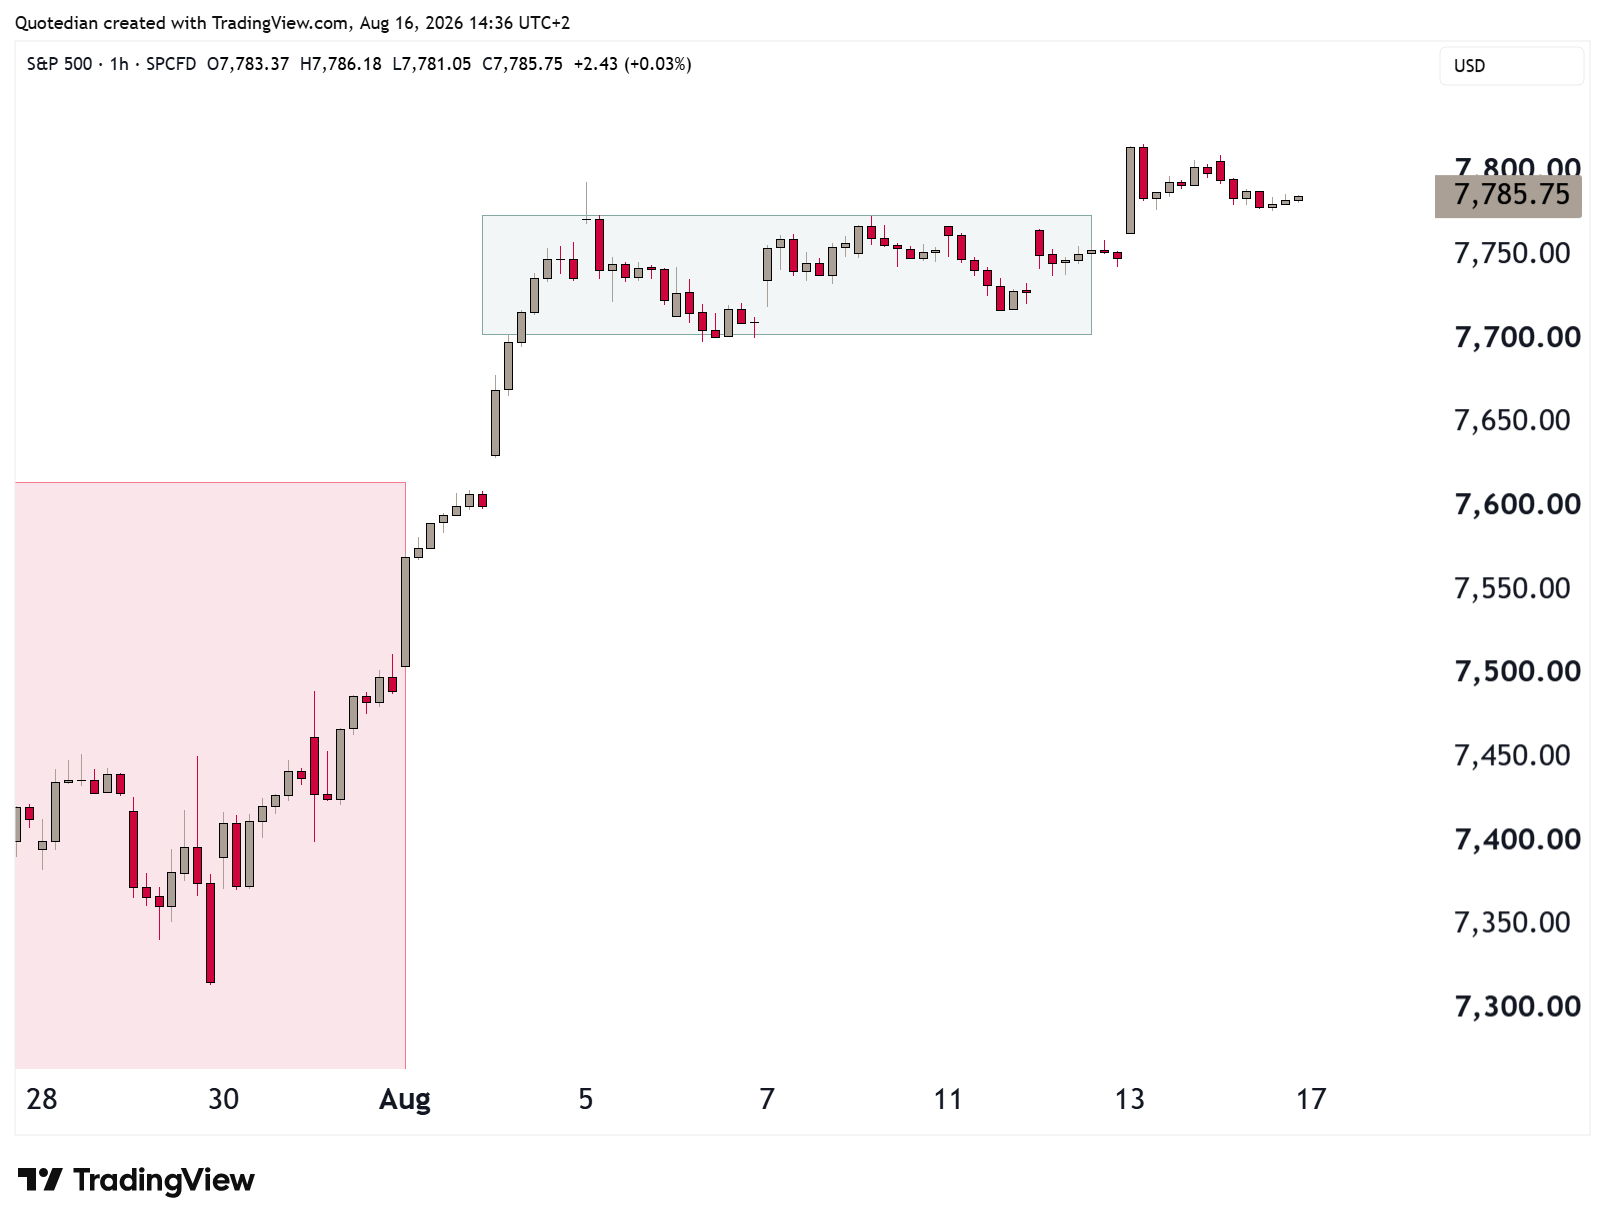
Hence, it seems that the patch of least resistance is to the upside, which is further underlined by market breadth.
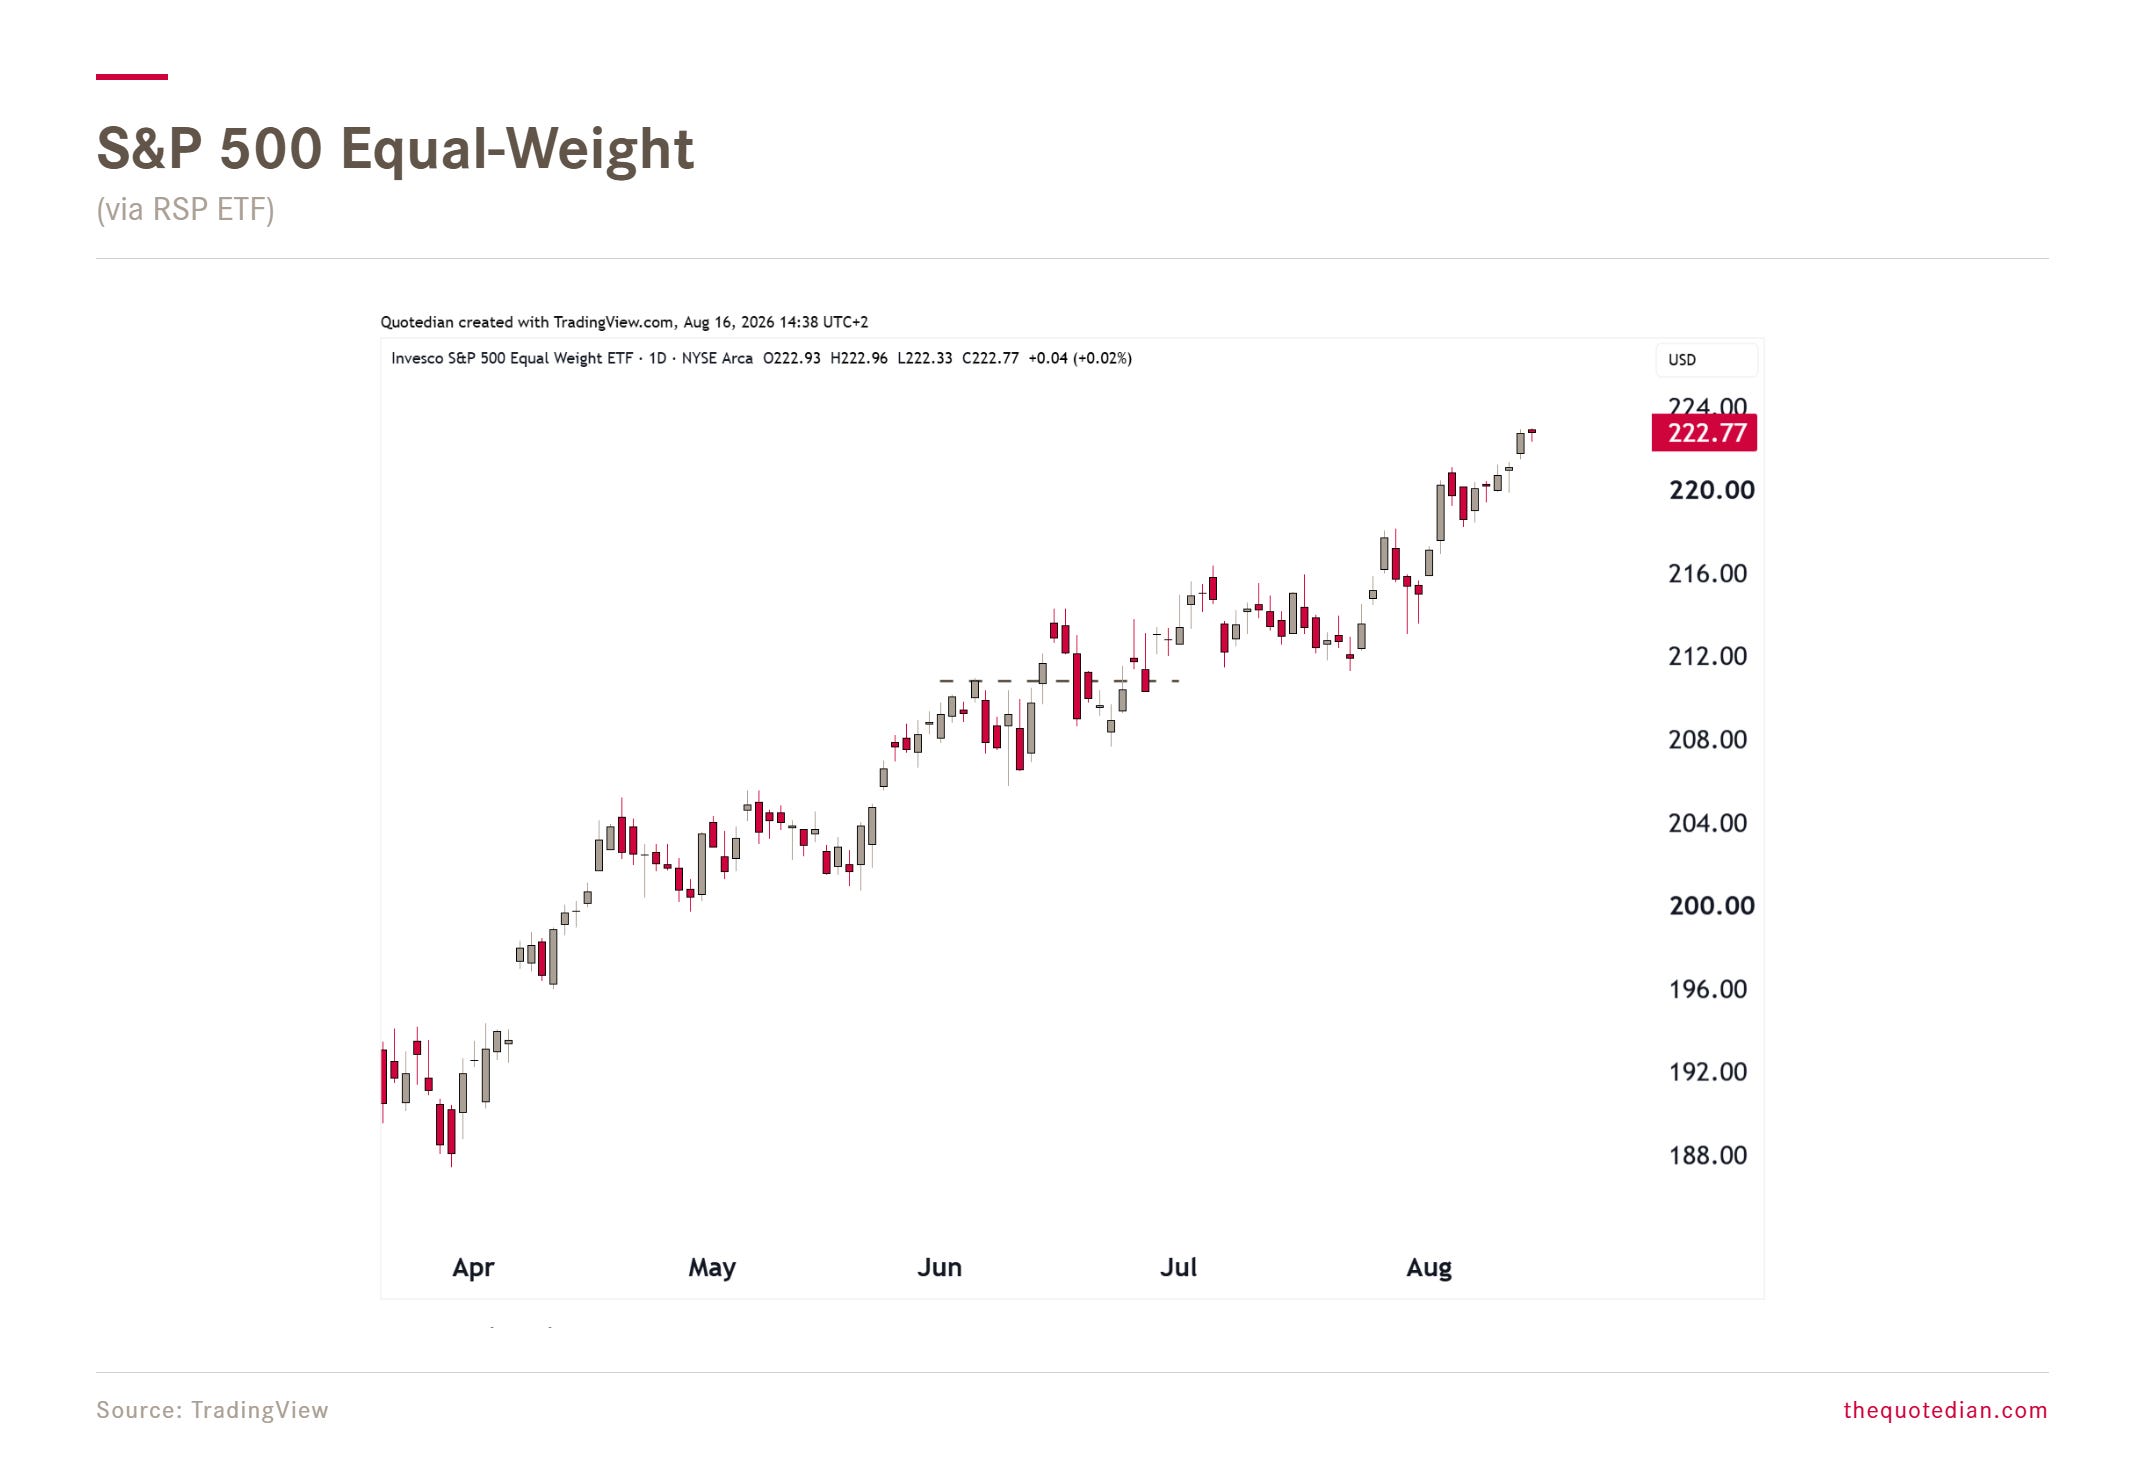
For example has the S&P 500 equal-weight index being clogging in new all-time high (ATH) after new ATH on a nearly daily basis since early August:
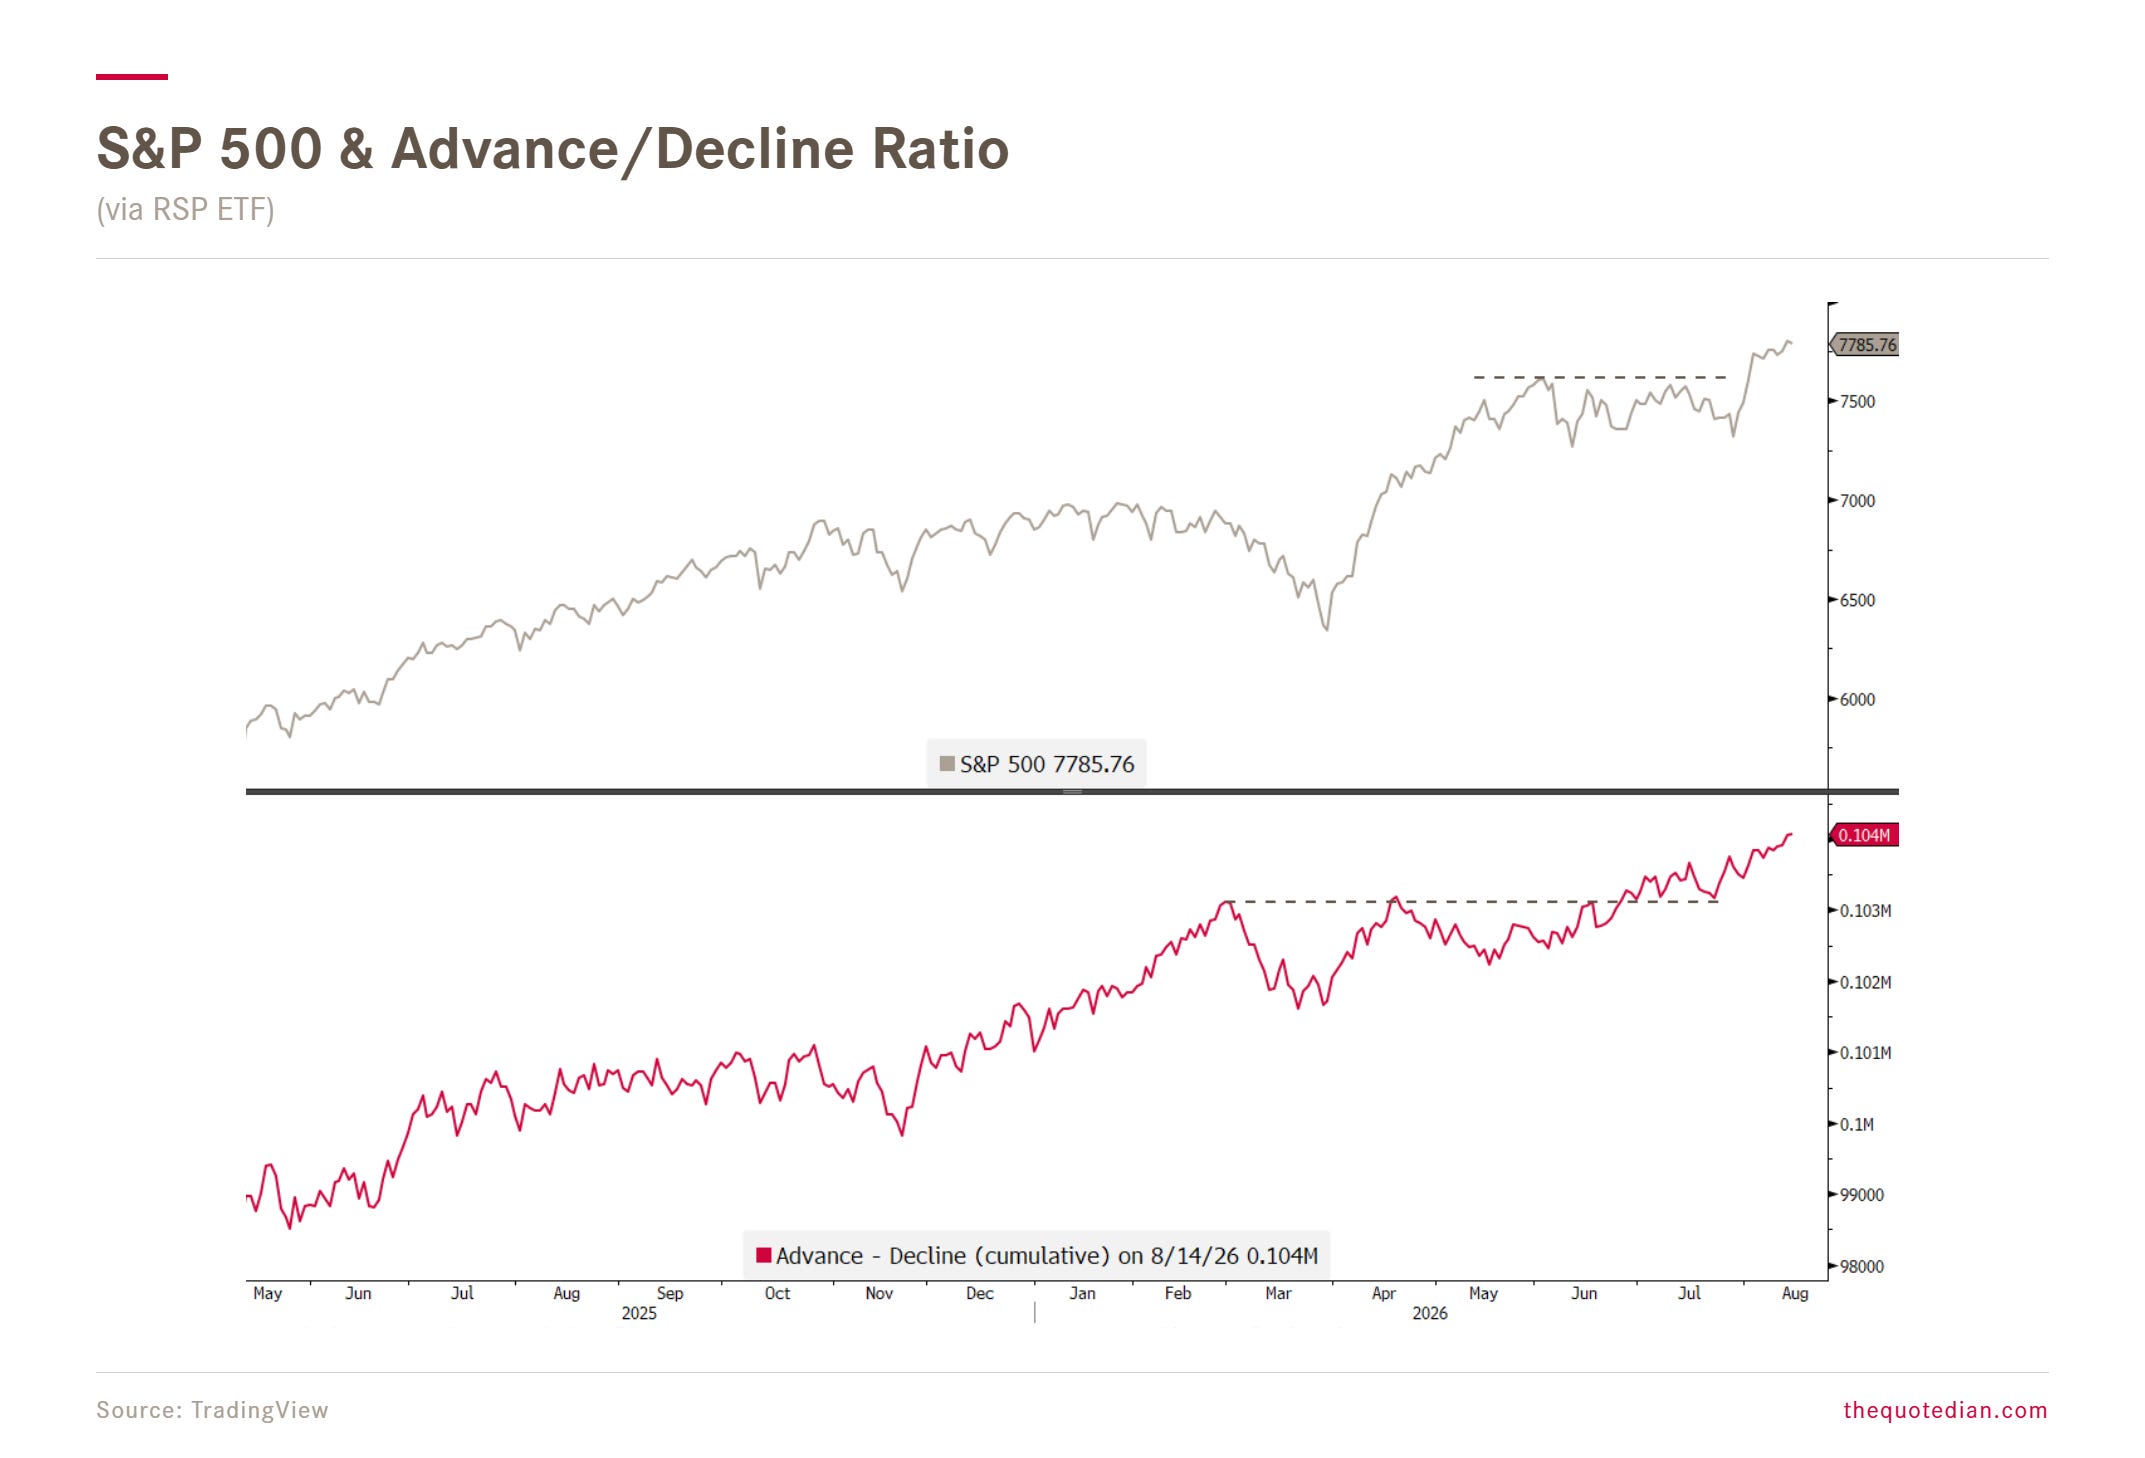
The advance-decline summation ratio has long been confirming the break-out in the S&P 500:
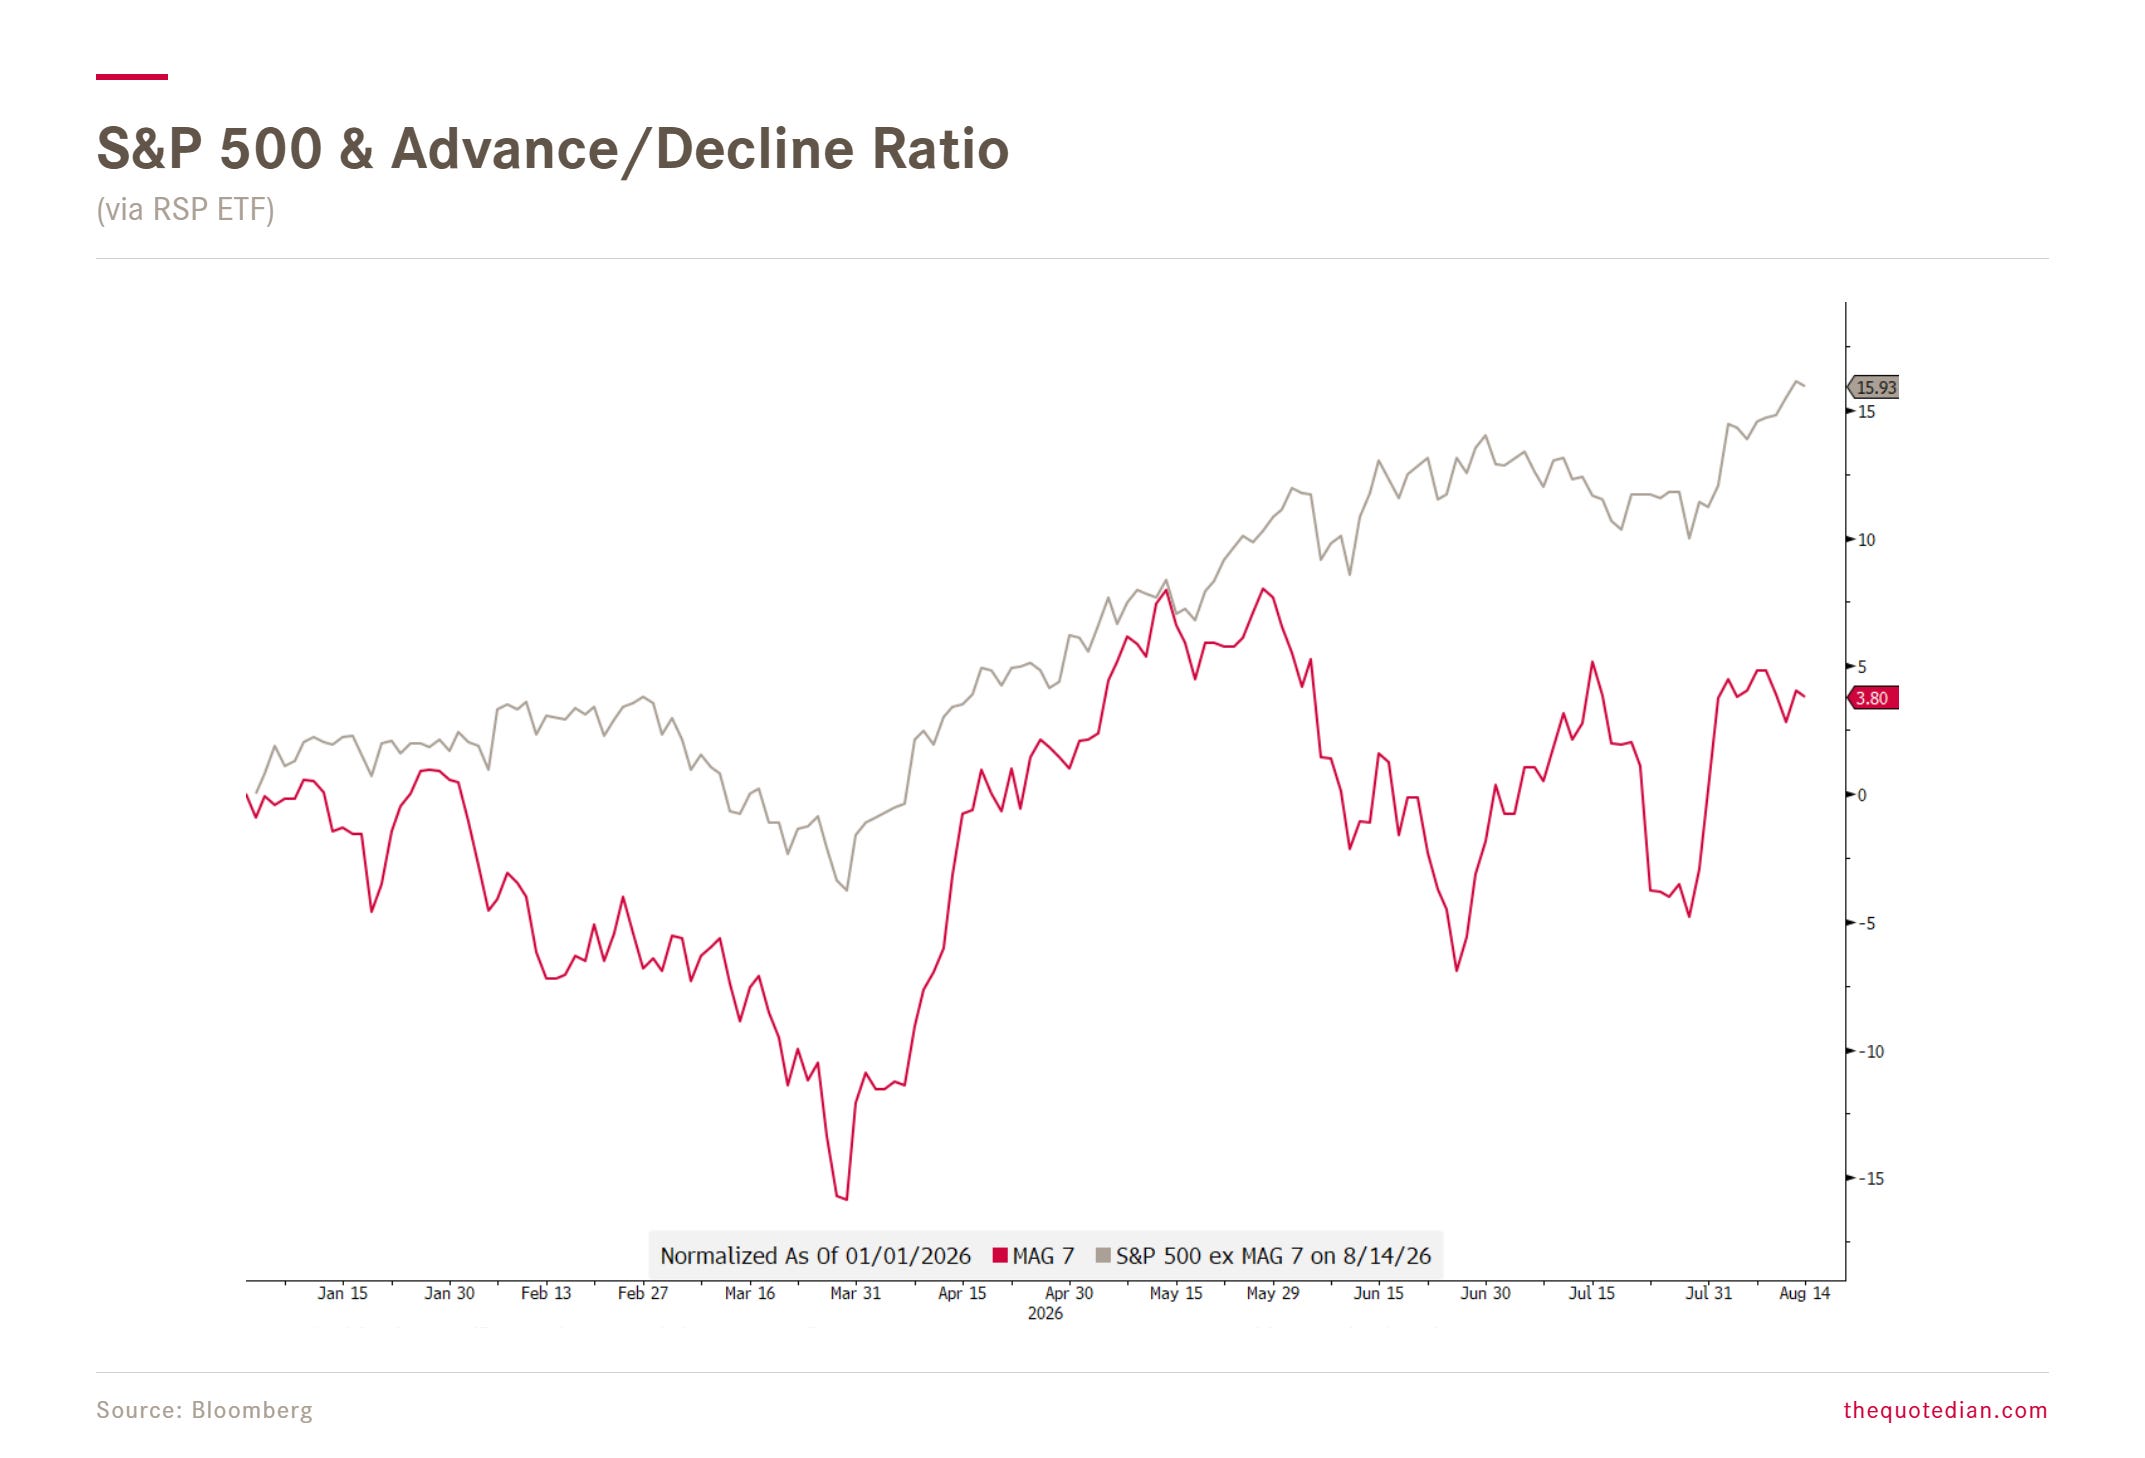
The key chart is probably the following one, showing that “the rest of the market”, i.e. the S&P 500 minus the Mag 7 (grey), has been able to disengage itself from those seven dominant stocks (red) of the past few years:
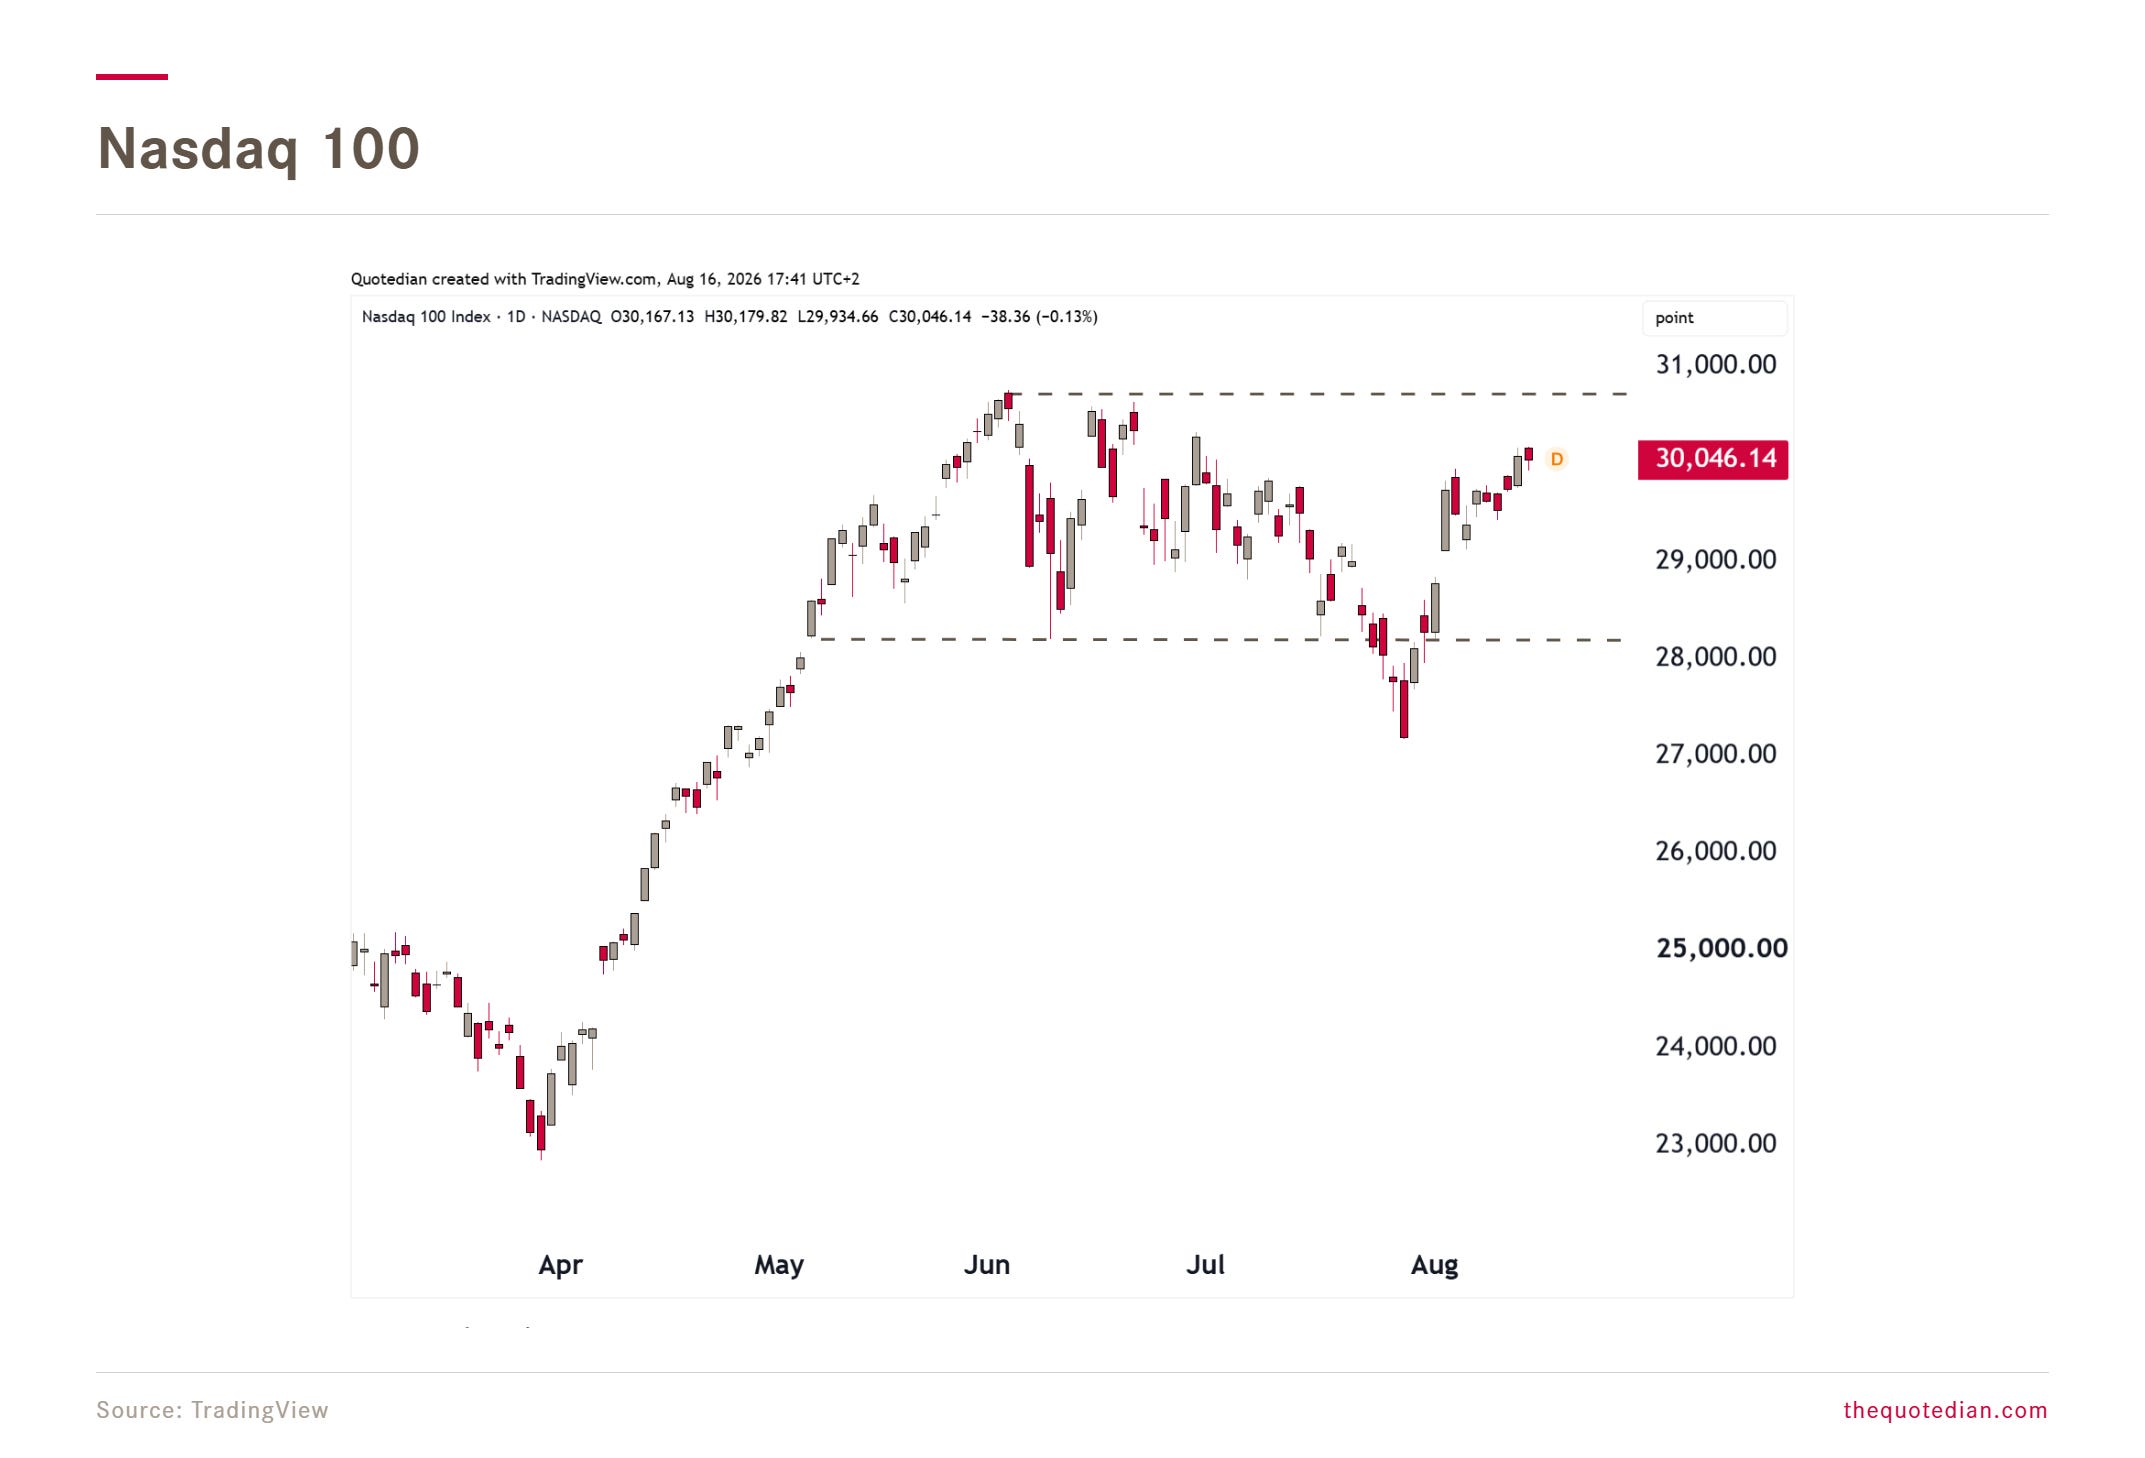
Given the elevated weighting of those seven stocks in the Nasdaq-100, it is then no surprise that the normal, cap-weighted version of that index has not done a new ATH yet:
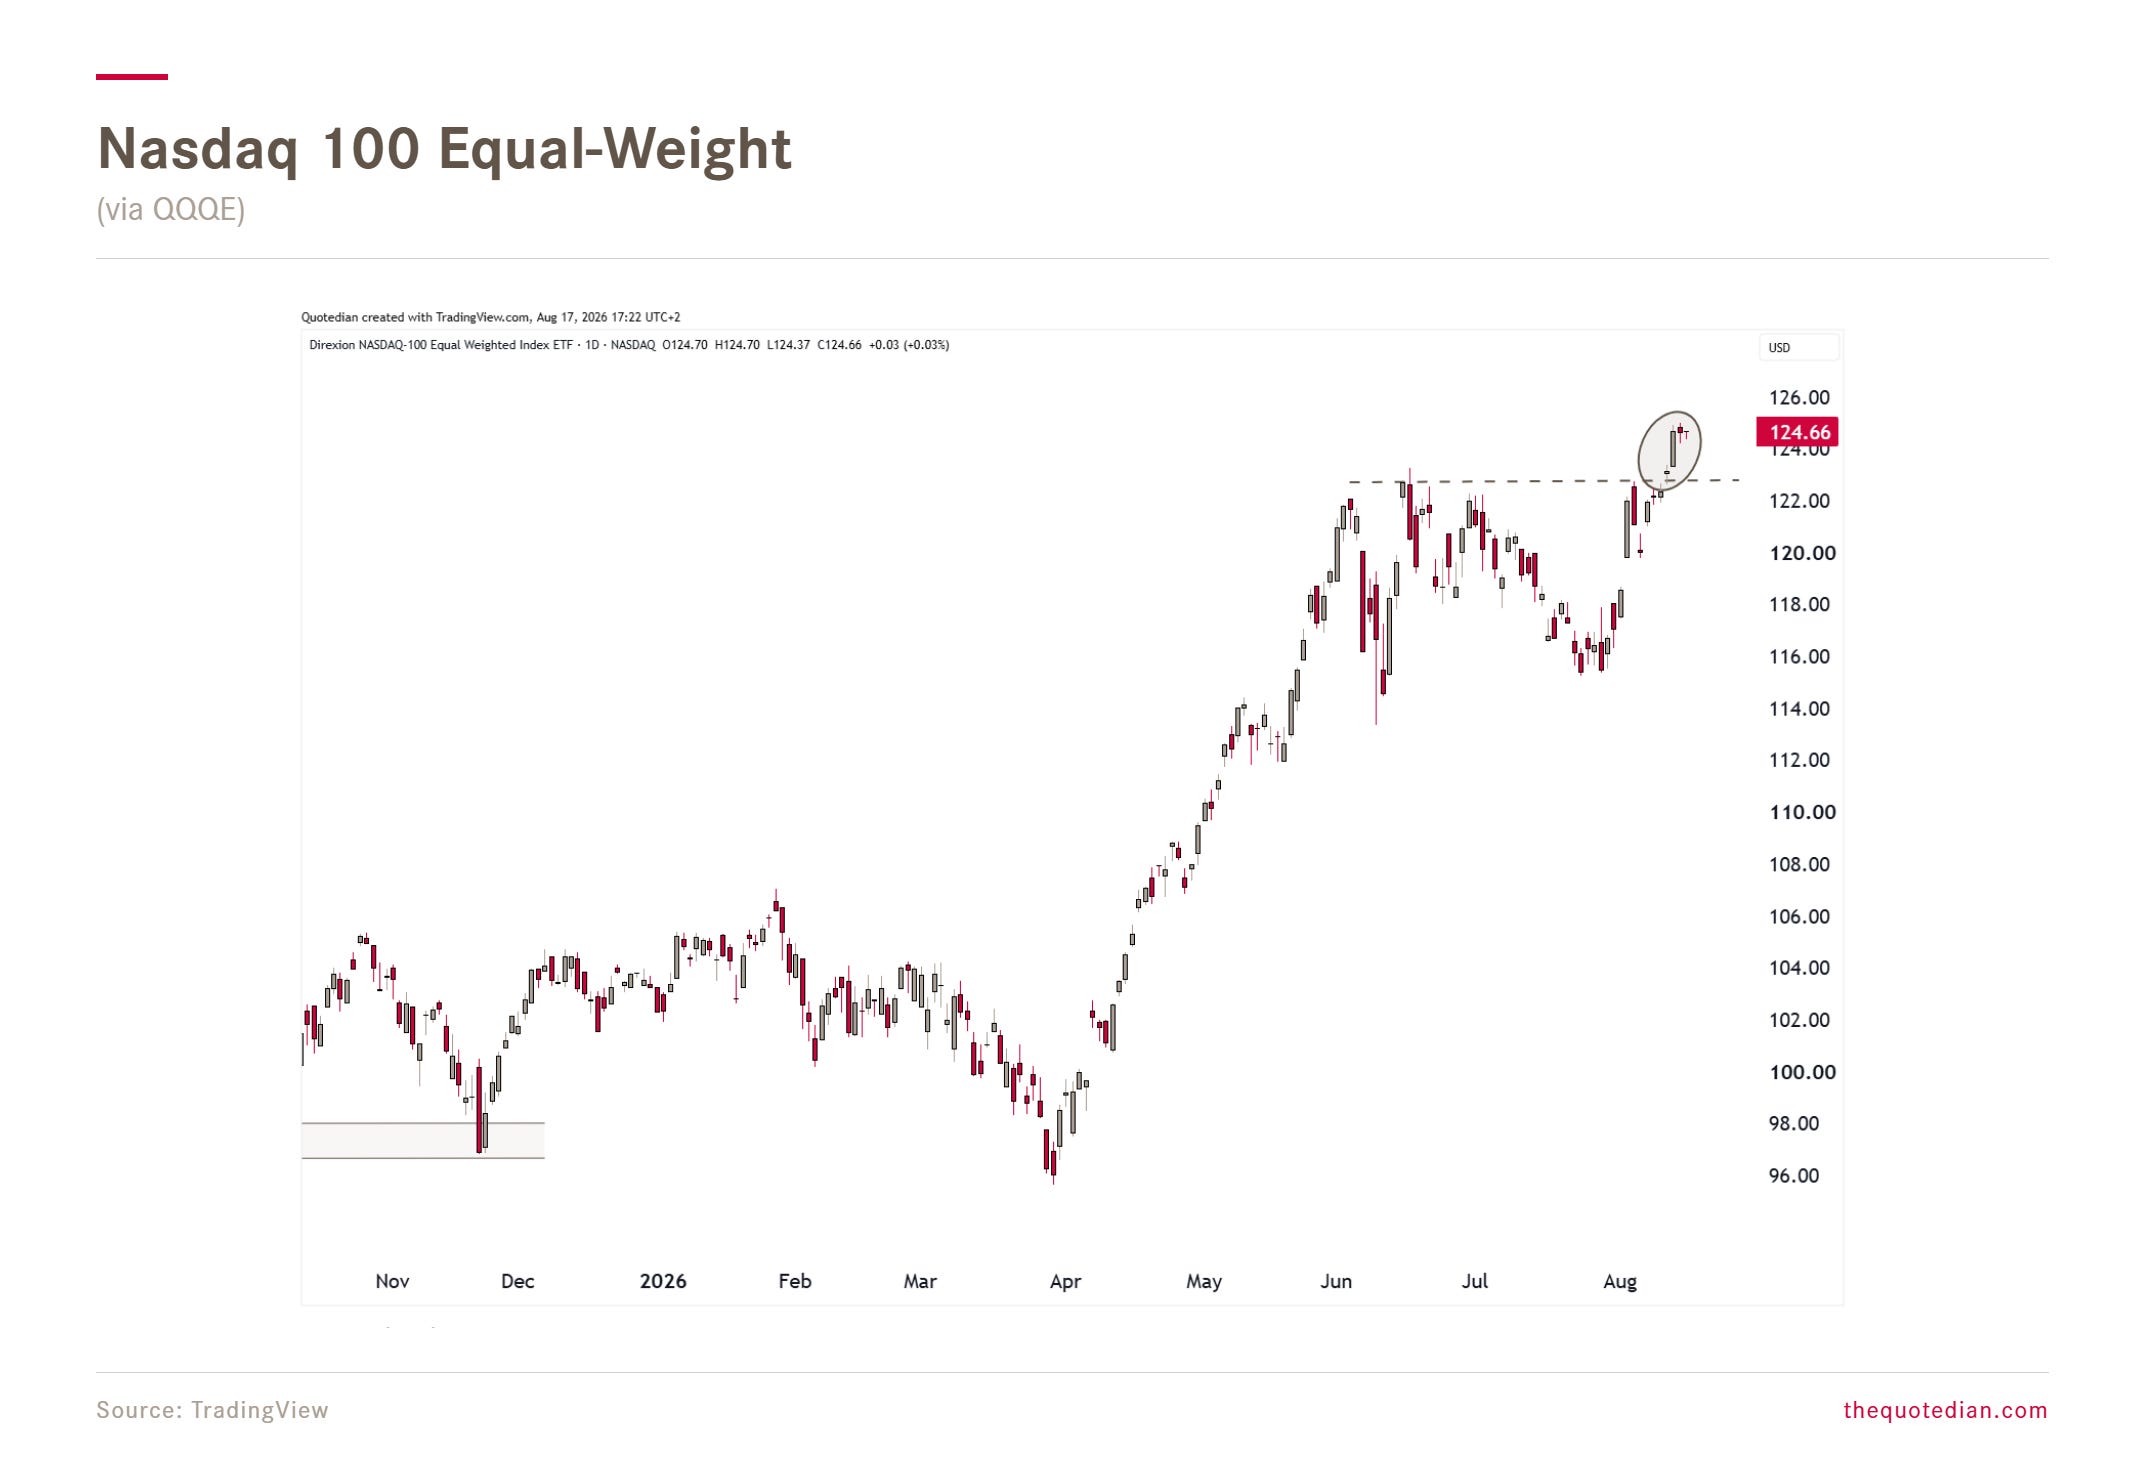
However, I think the equal-weight version (QQQE) of the index is the tell of what’s gonna happen next:
And finally, the new ATHs in US small cap stocks is more prove that the economic/business cycle expansion is real:
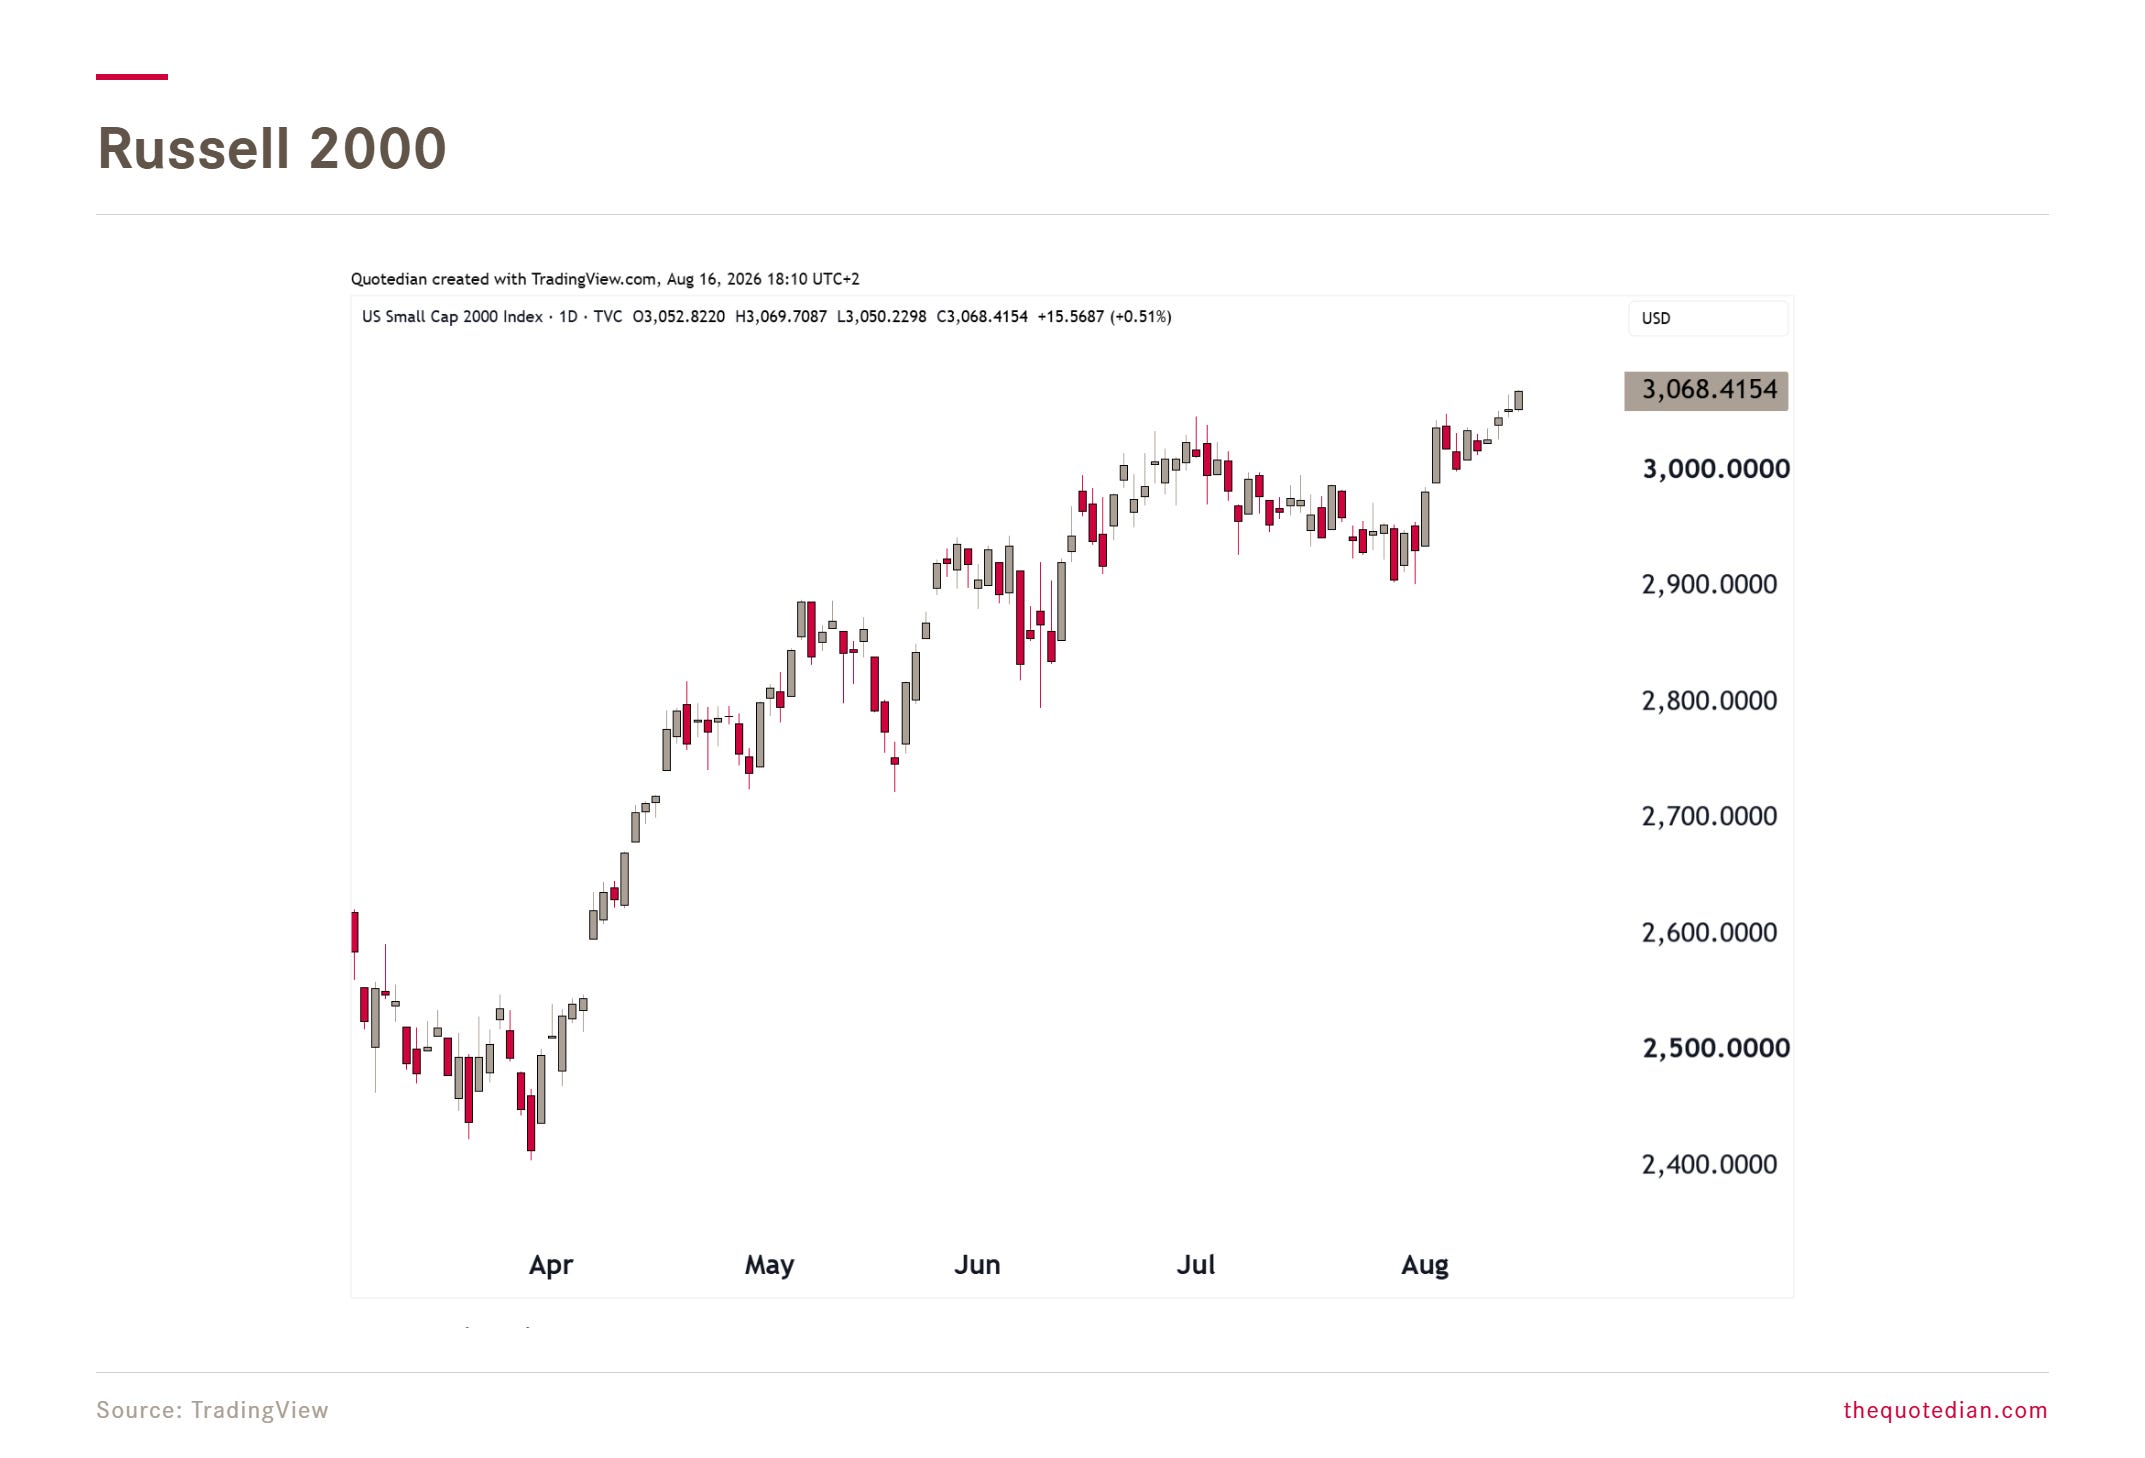
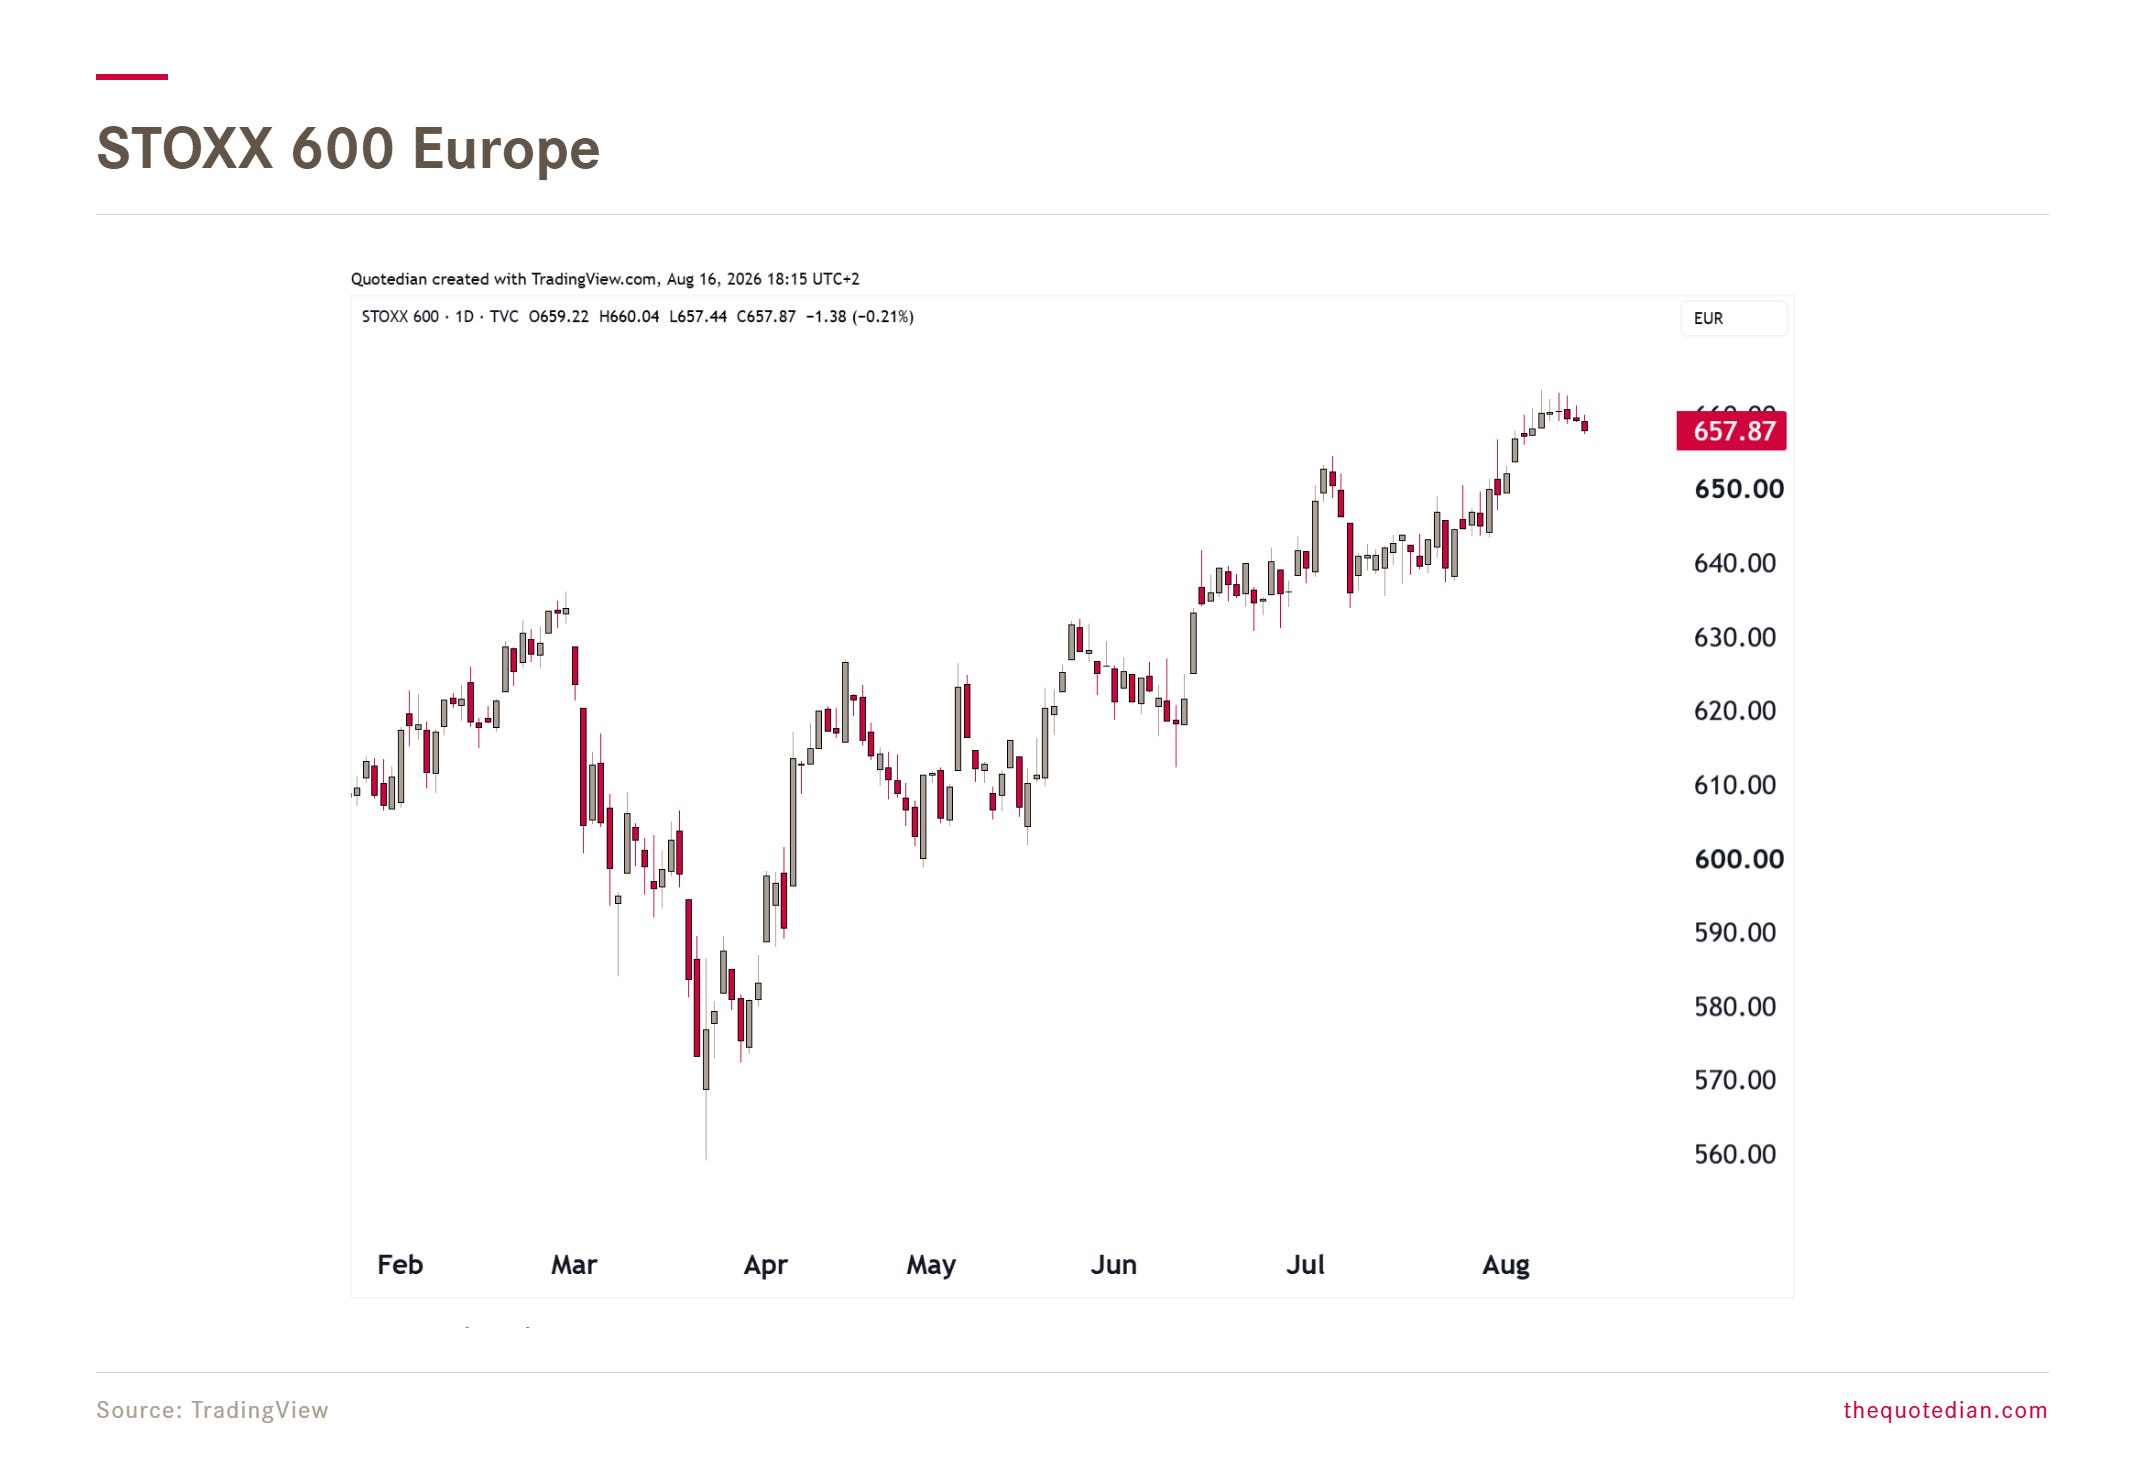
But new highs are not a US market exclusive. Here’s the STOXX 600 Europe index:
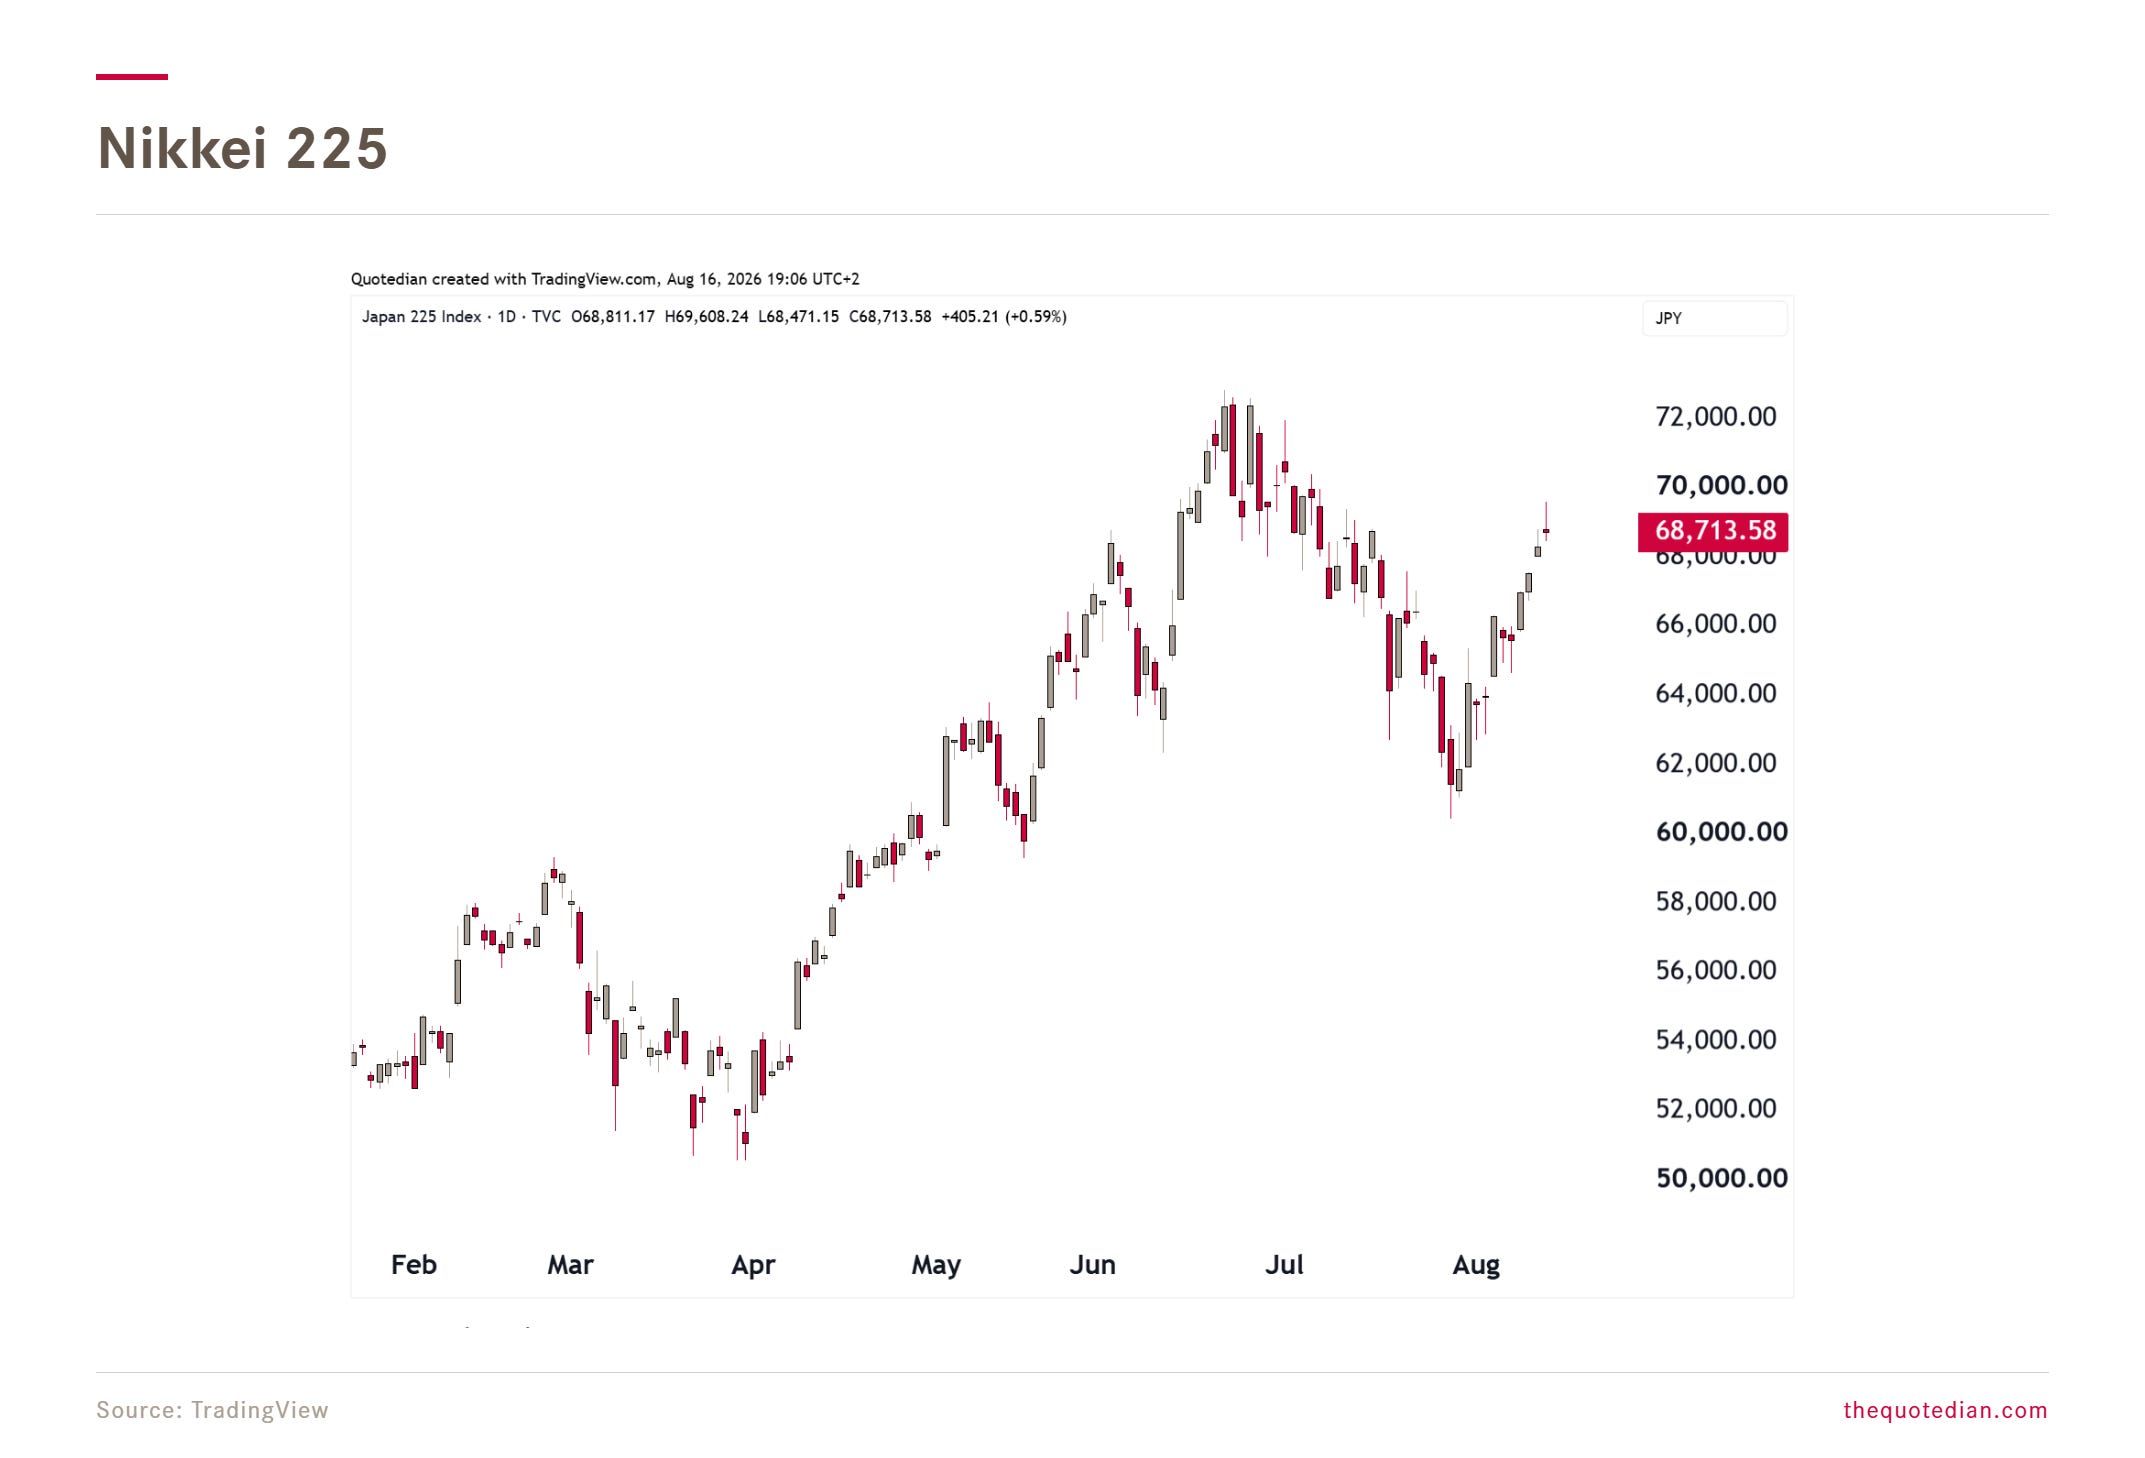
In Asia, Japan’s tech-heavy Nikkei 225 has not reached new ATHs:
However, the broader Topix Index (>1,600 members) has done so after only a mild set-back:
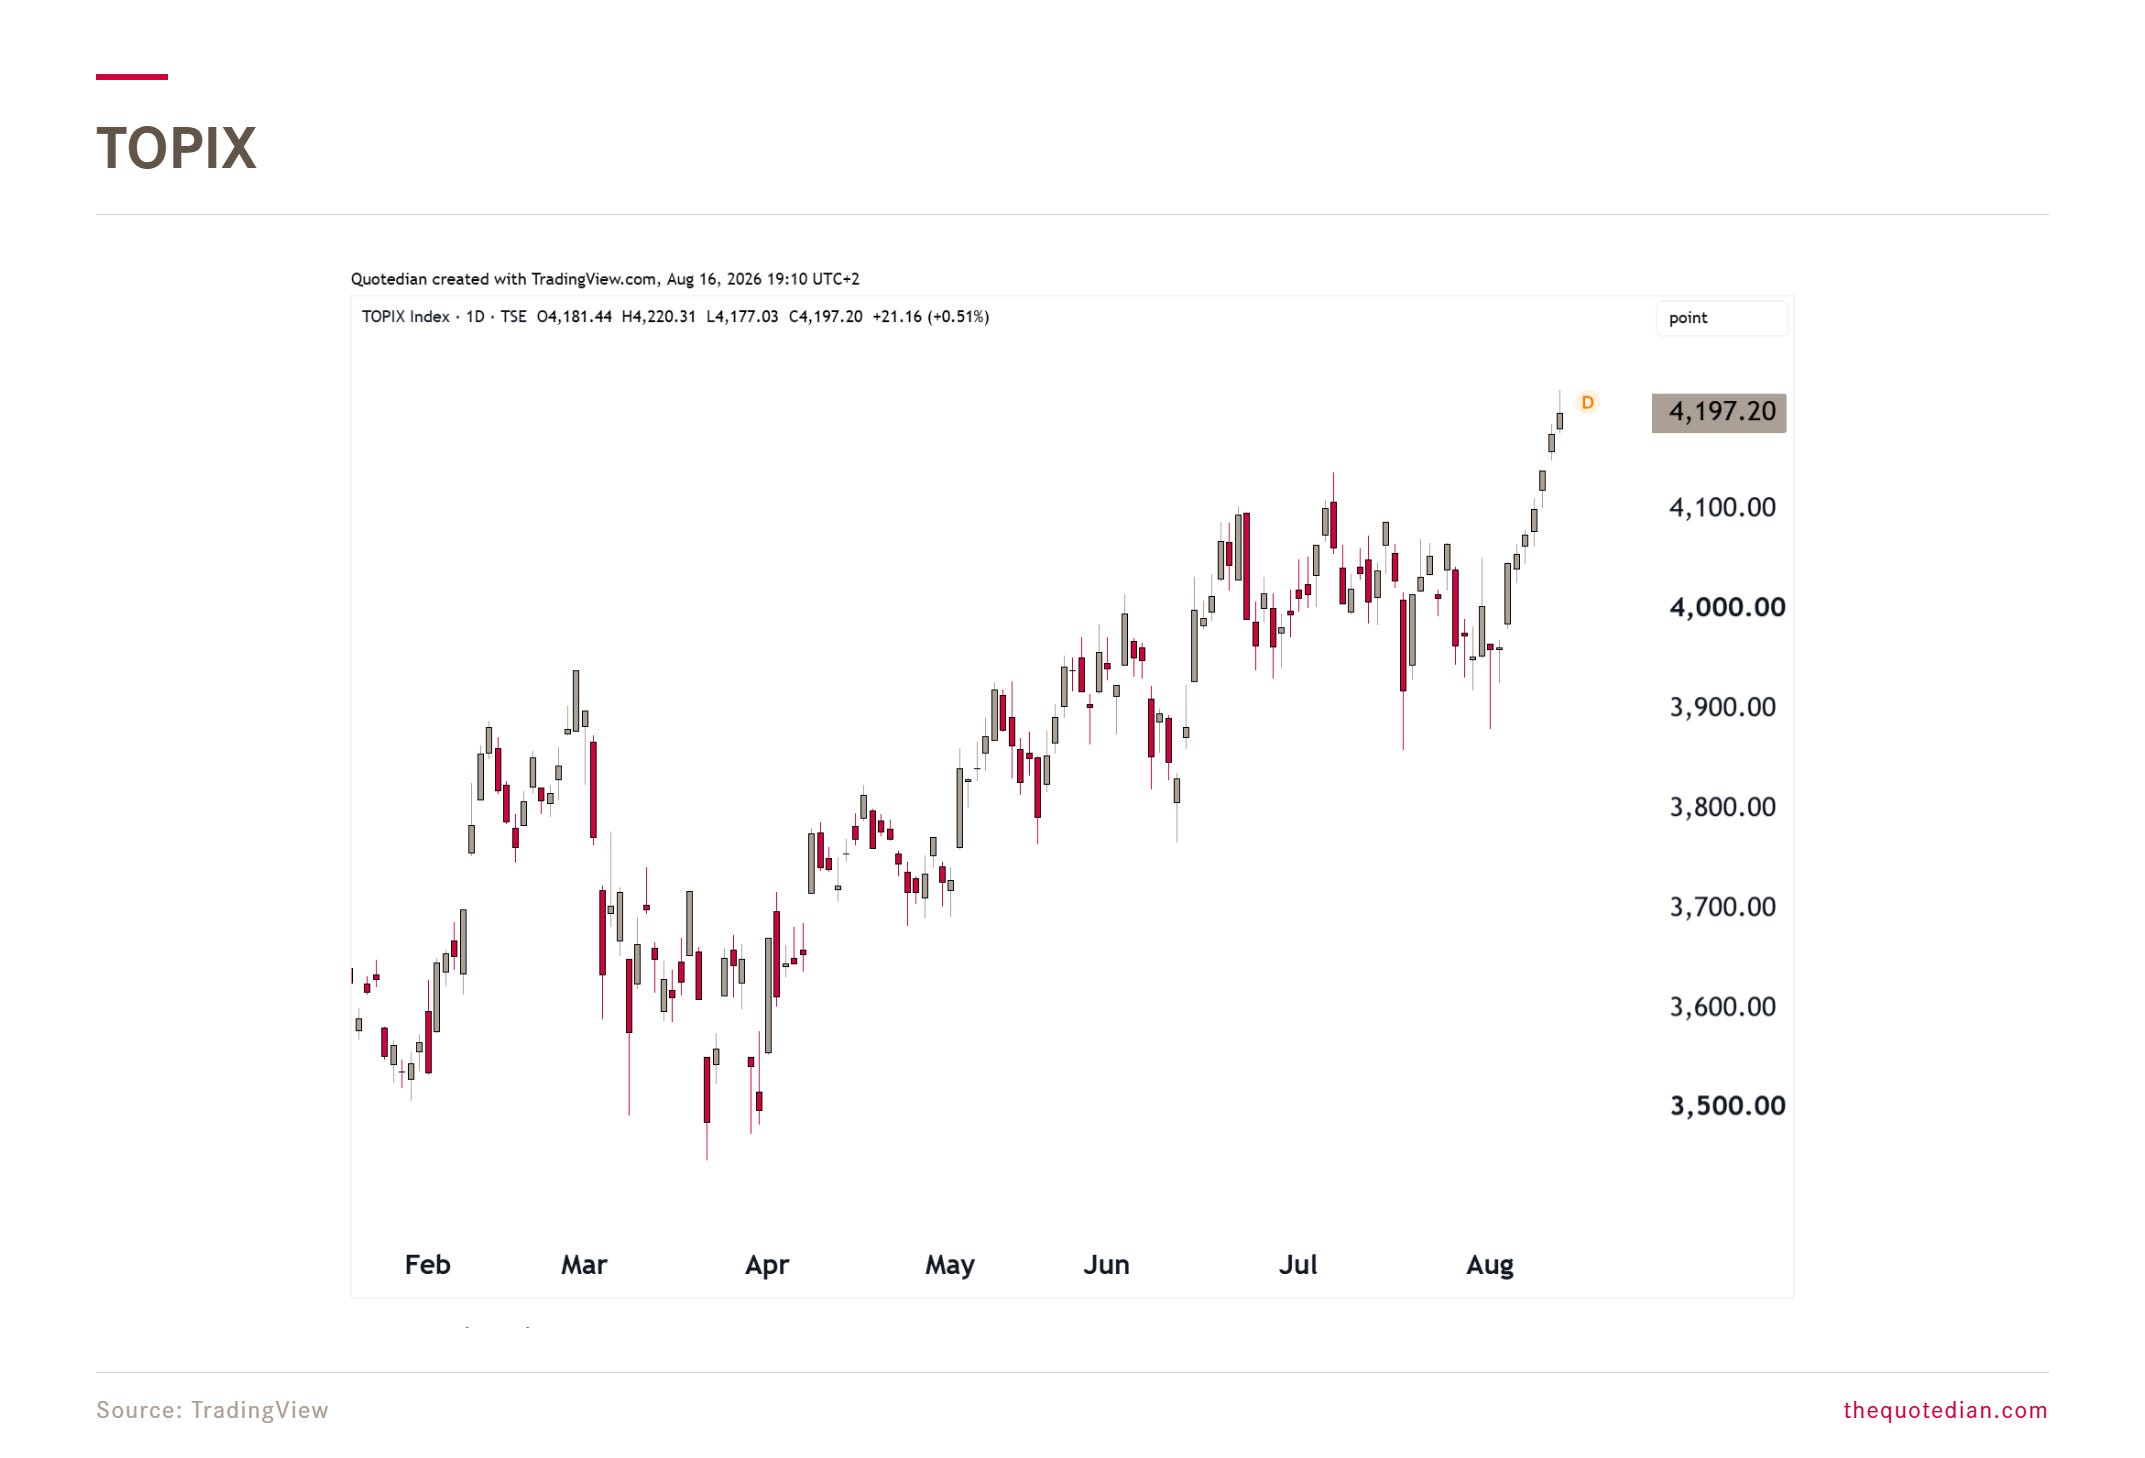
This demonstrates two things: a) that the Summer “correction”, was not only in the US, but in markets around the world, driven by higher-beta, higher-momentum tech stocks, and b) that the rally is broadening.
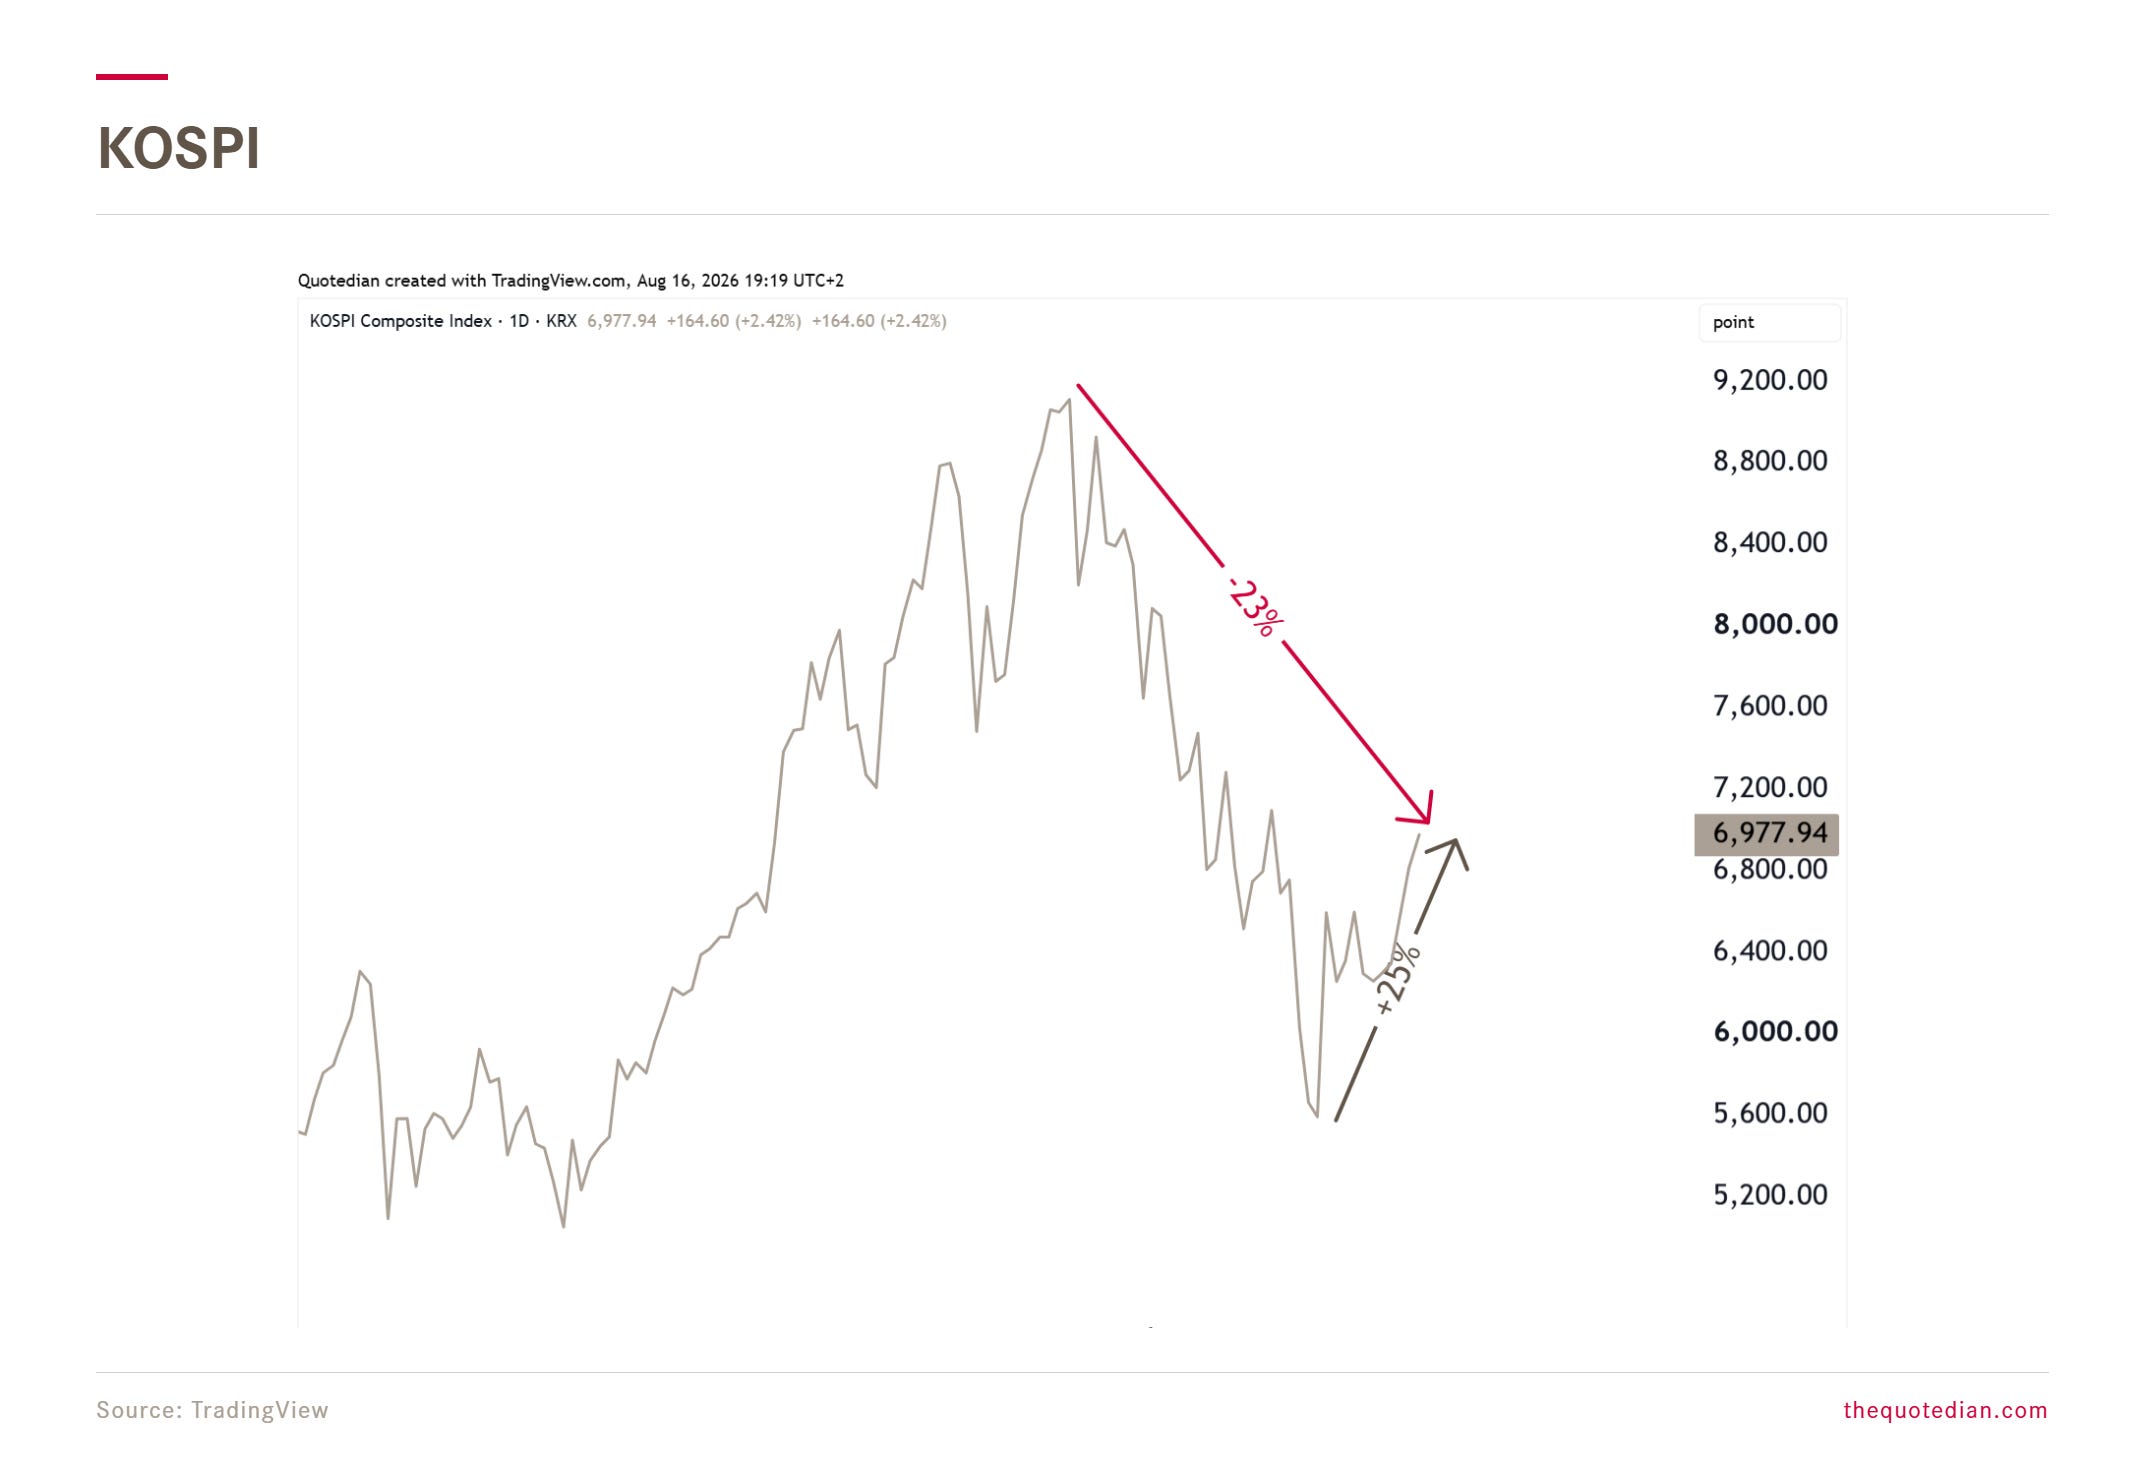
Another chart highlighting the momentum-crash witnessed in July is the one of Korea’s KOSPI - despite being up 25% from its July 30th lows, it is still down by about the same percentage since the top in late June:
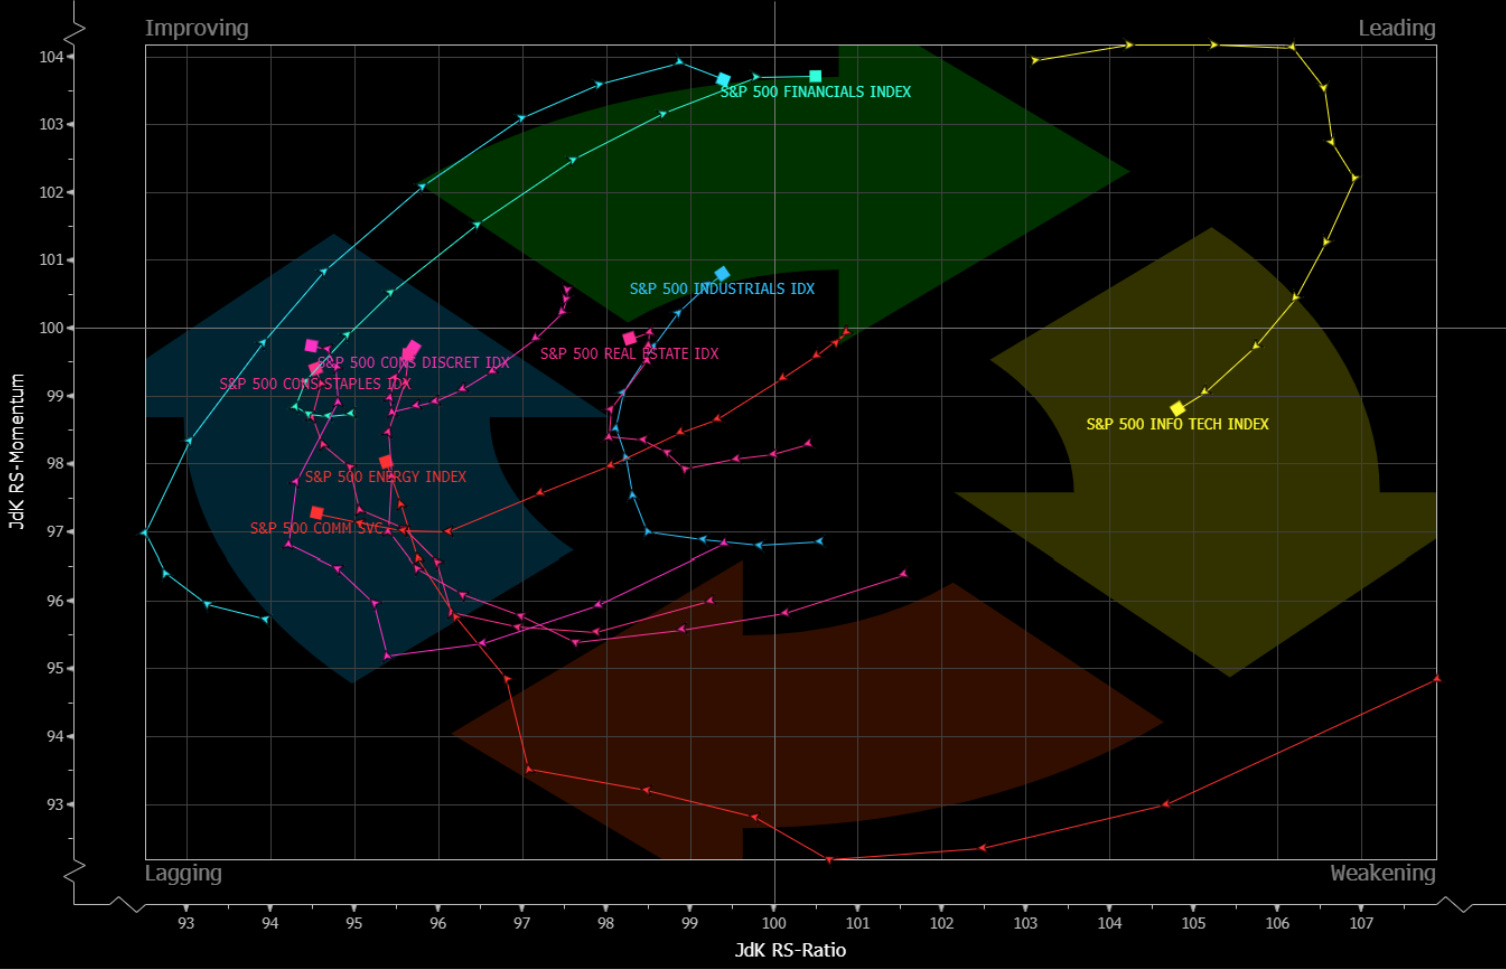
Moving to sector observations, Bloomberg’s RRG (Relative Rotation Graph) is another beautiful way of demonstrating the shift away from tech only to nearly everything else:
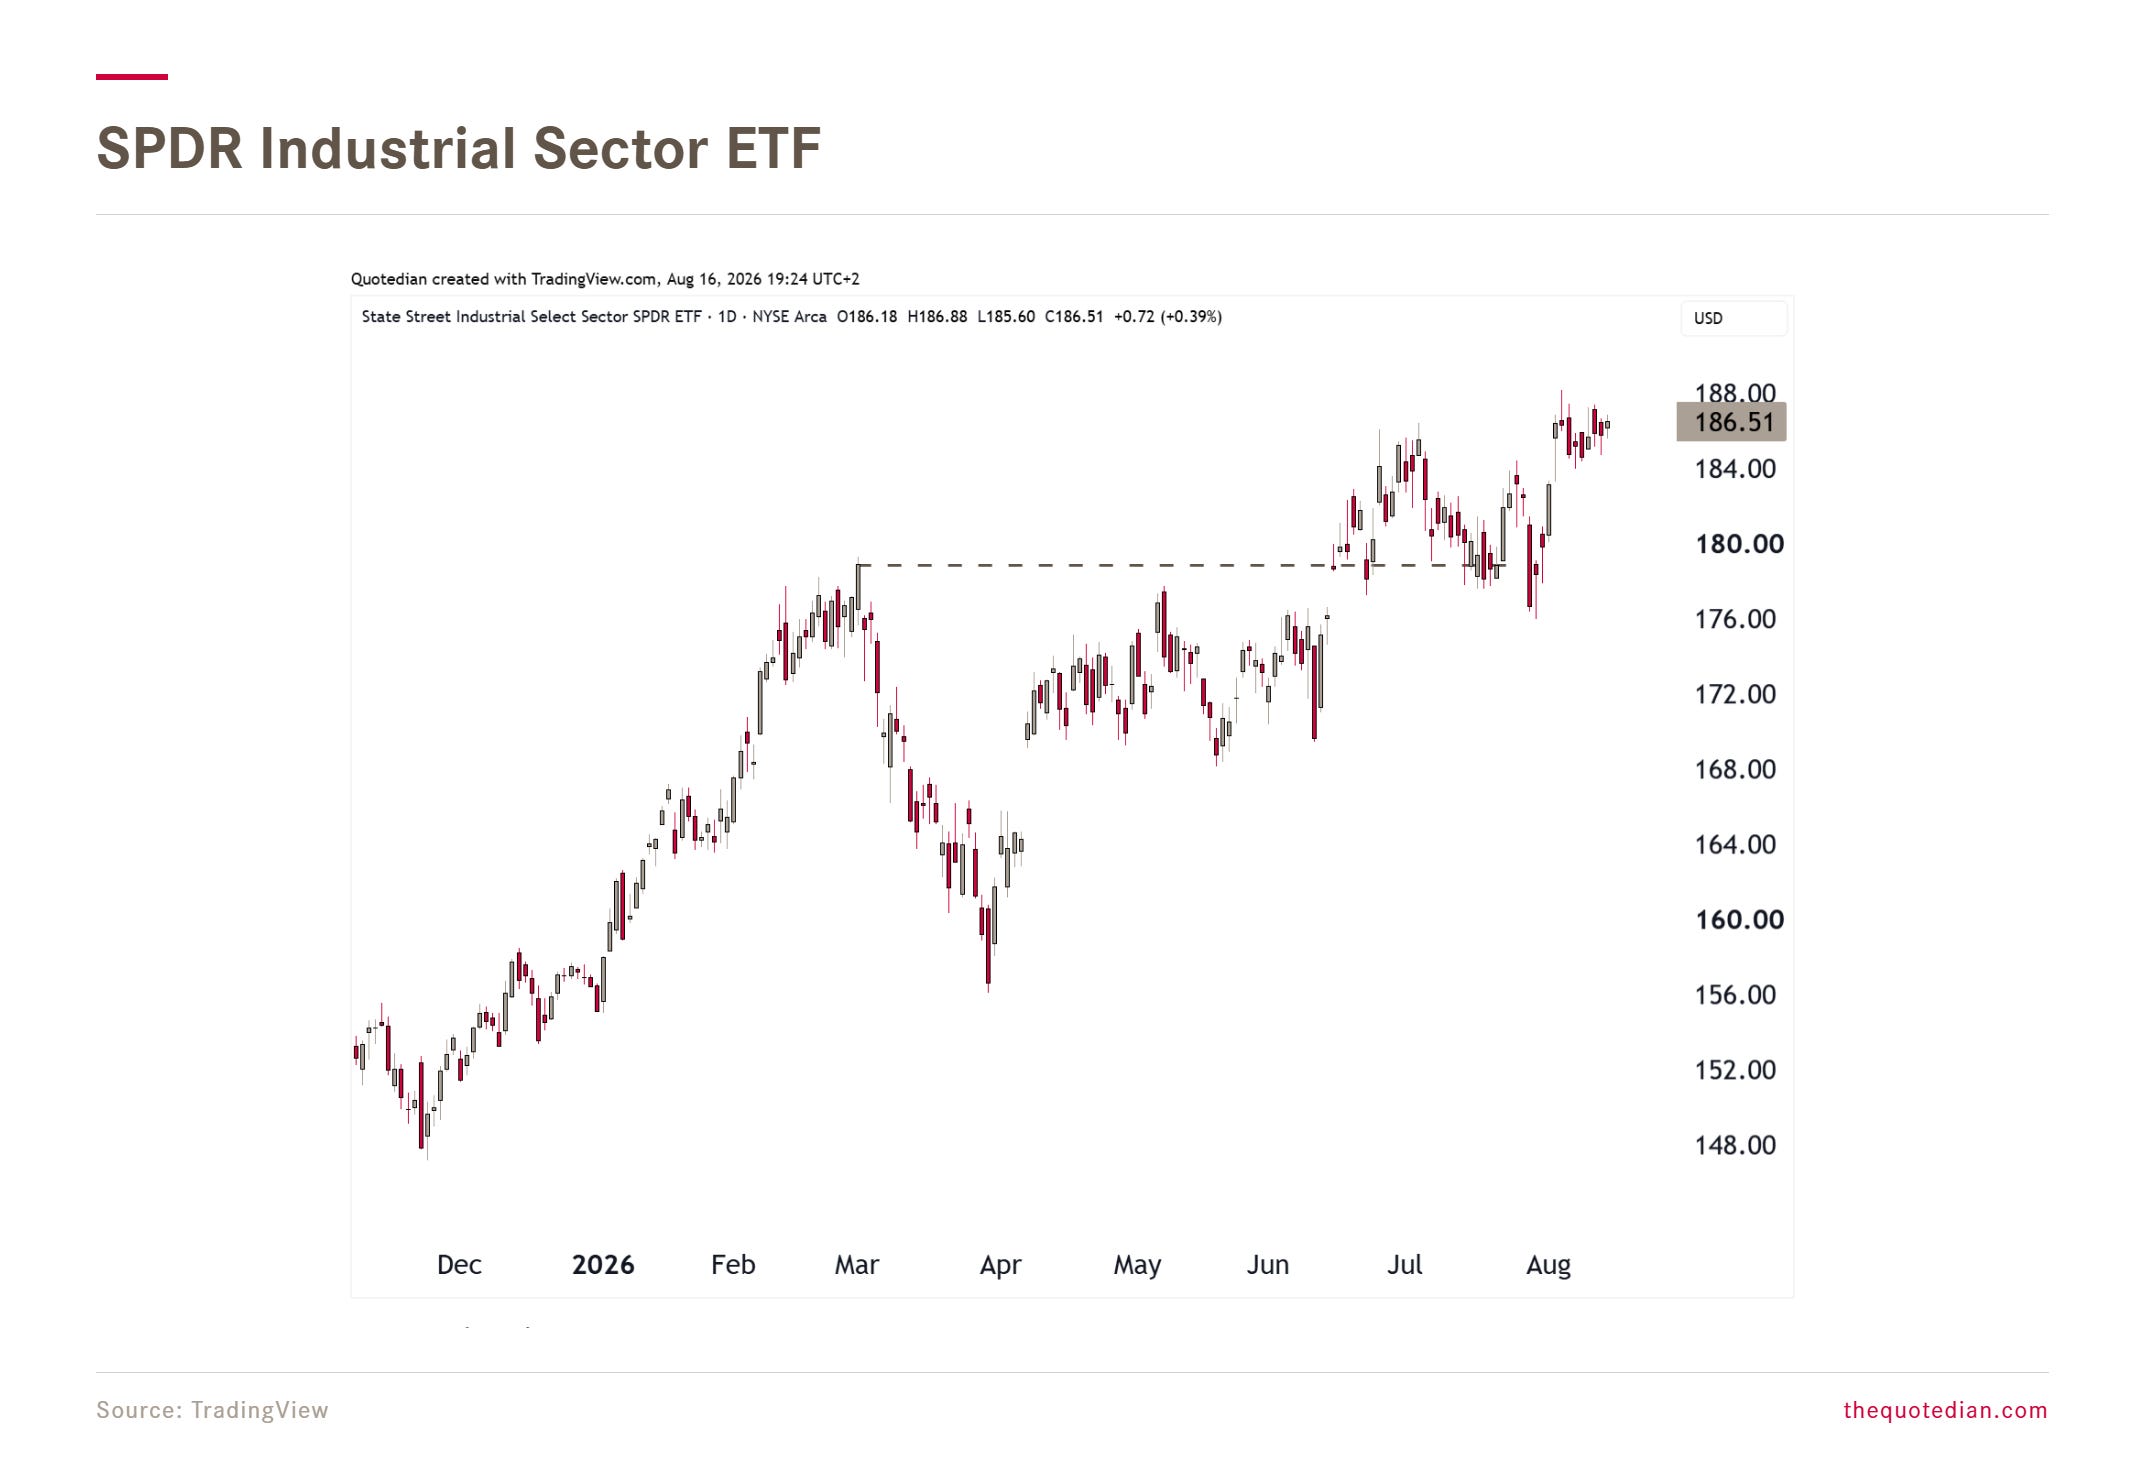
Especially industrial
and financial stocks
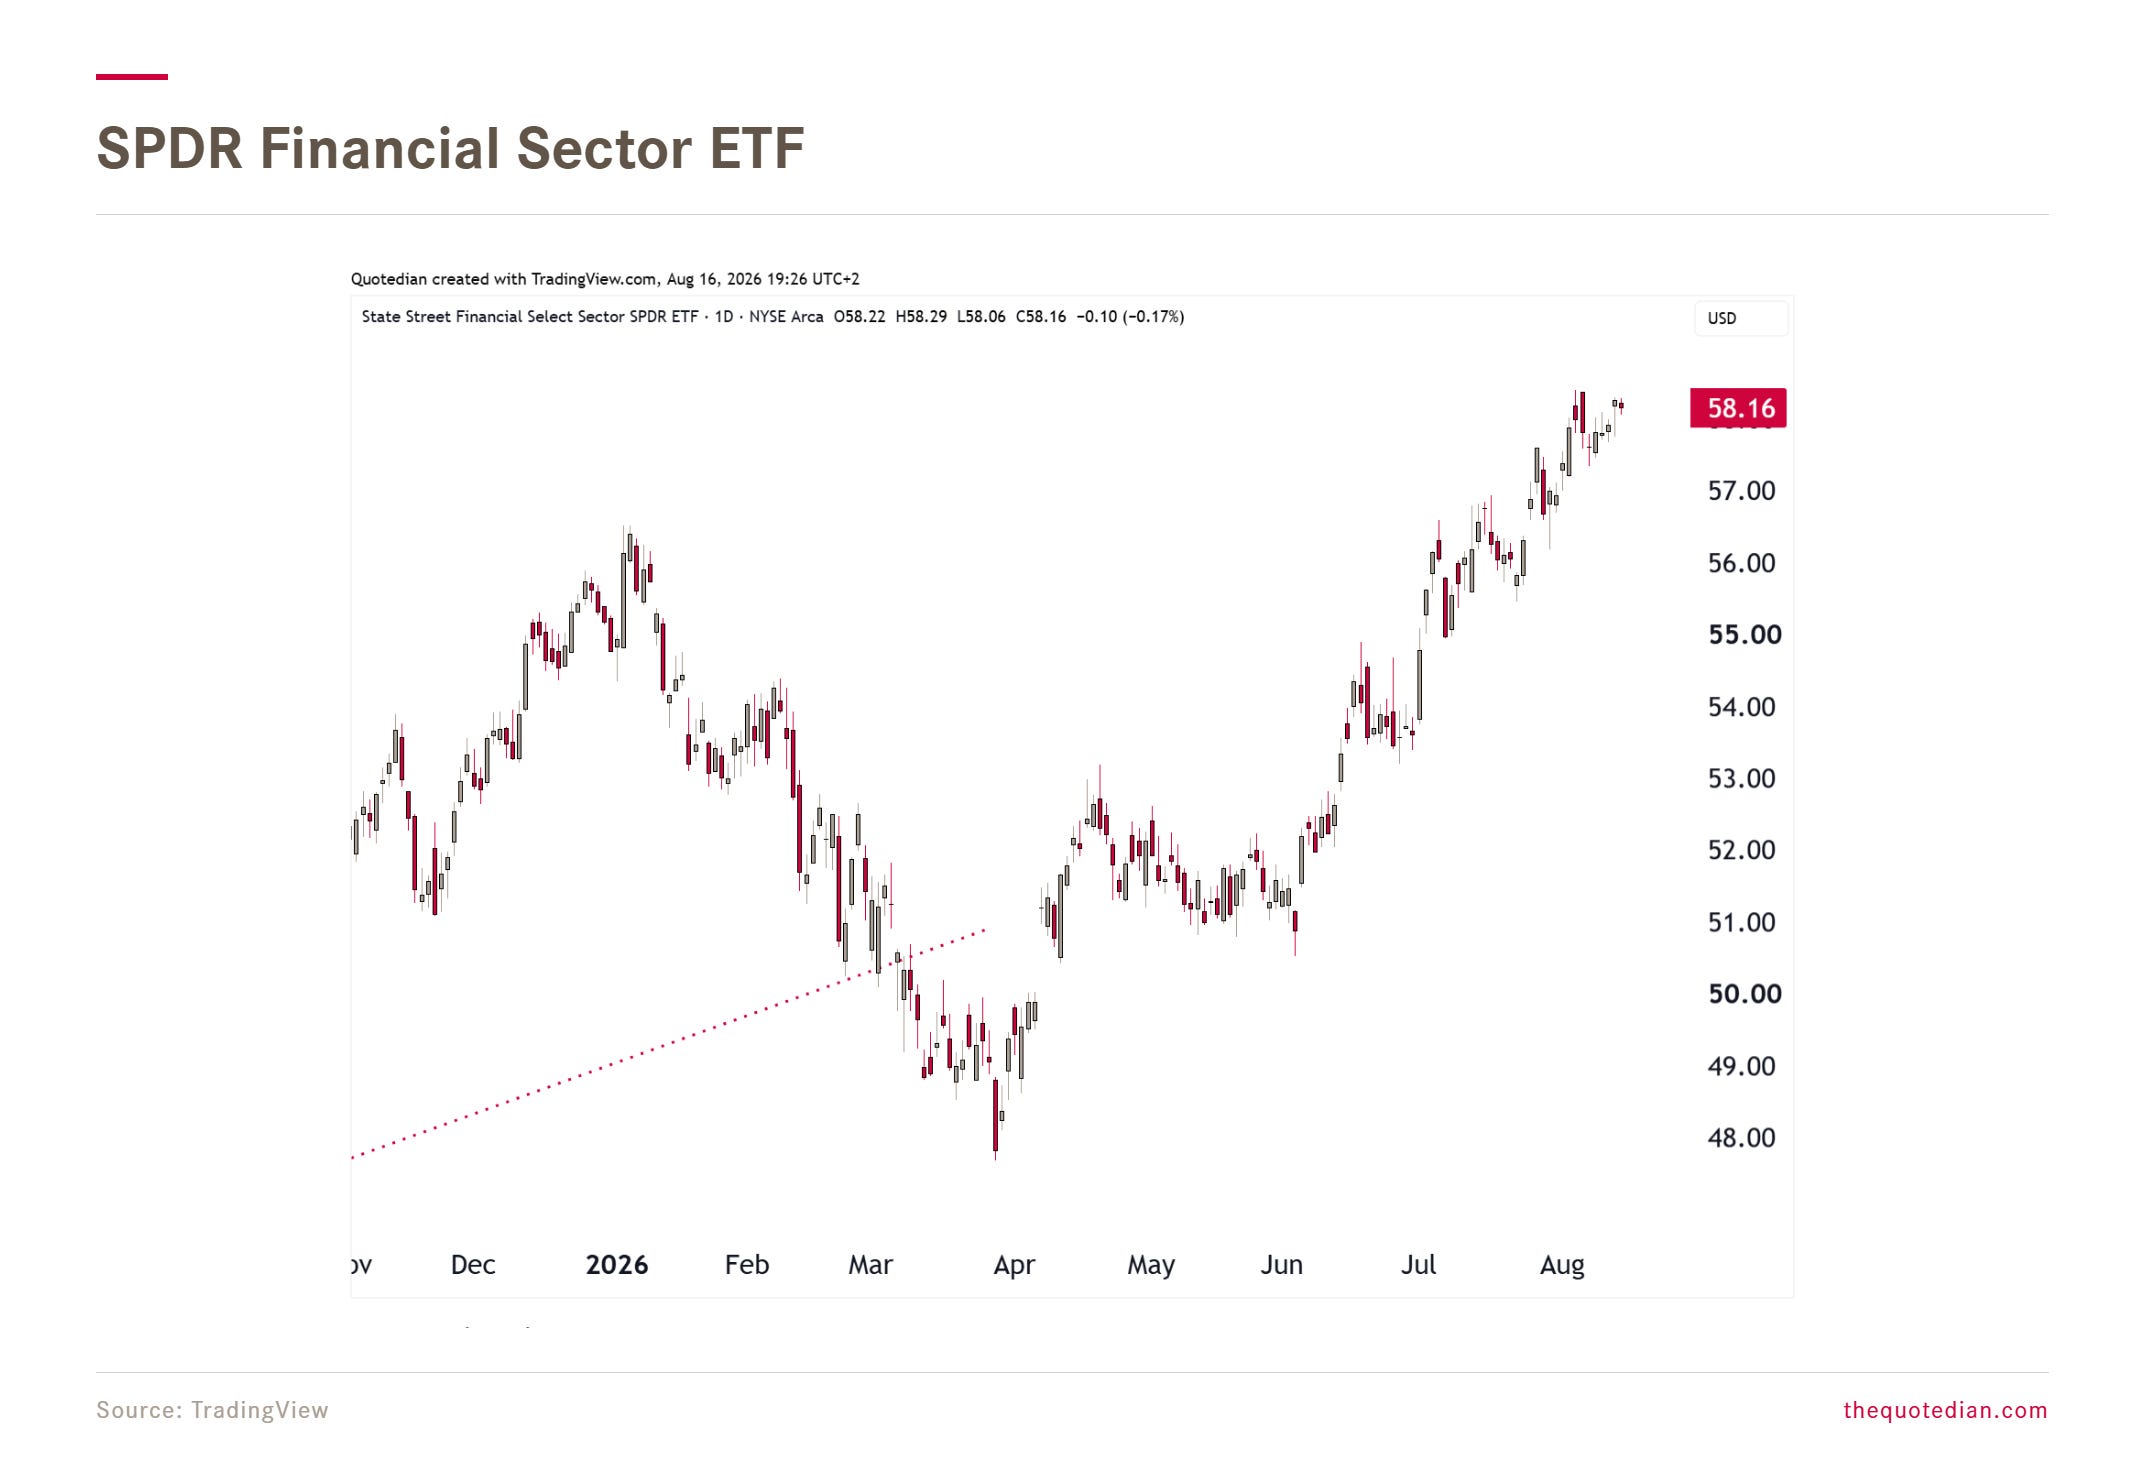
look very interesting here.
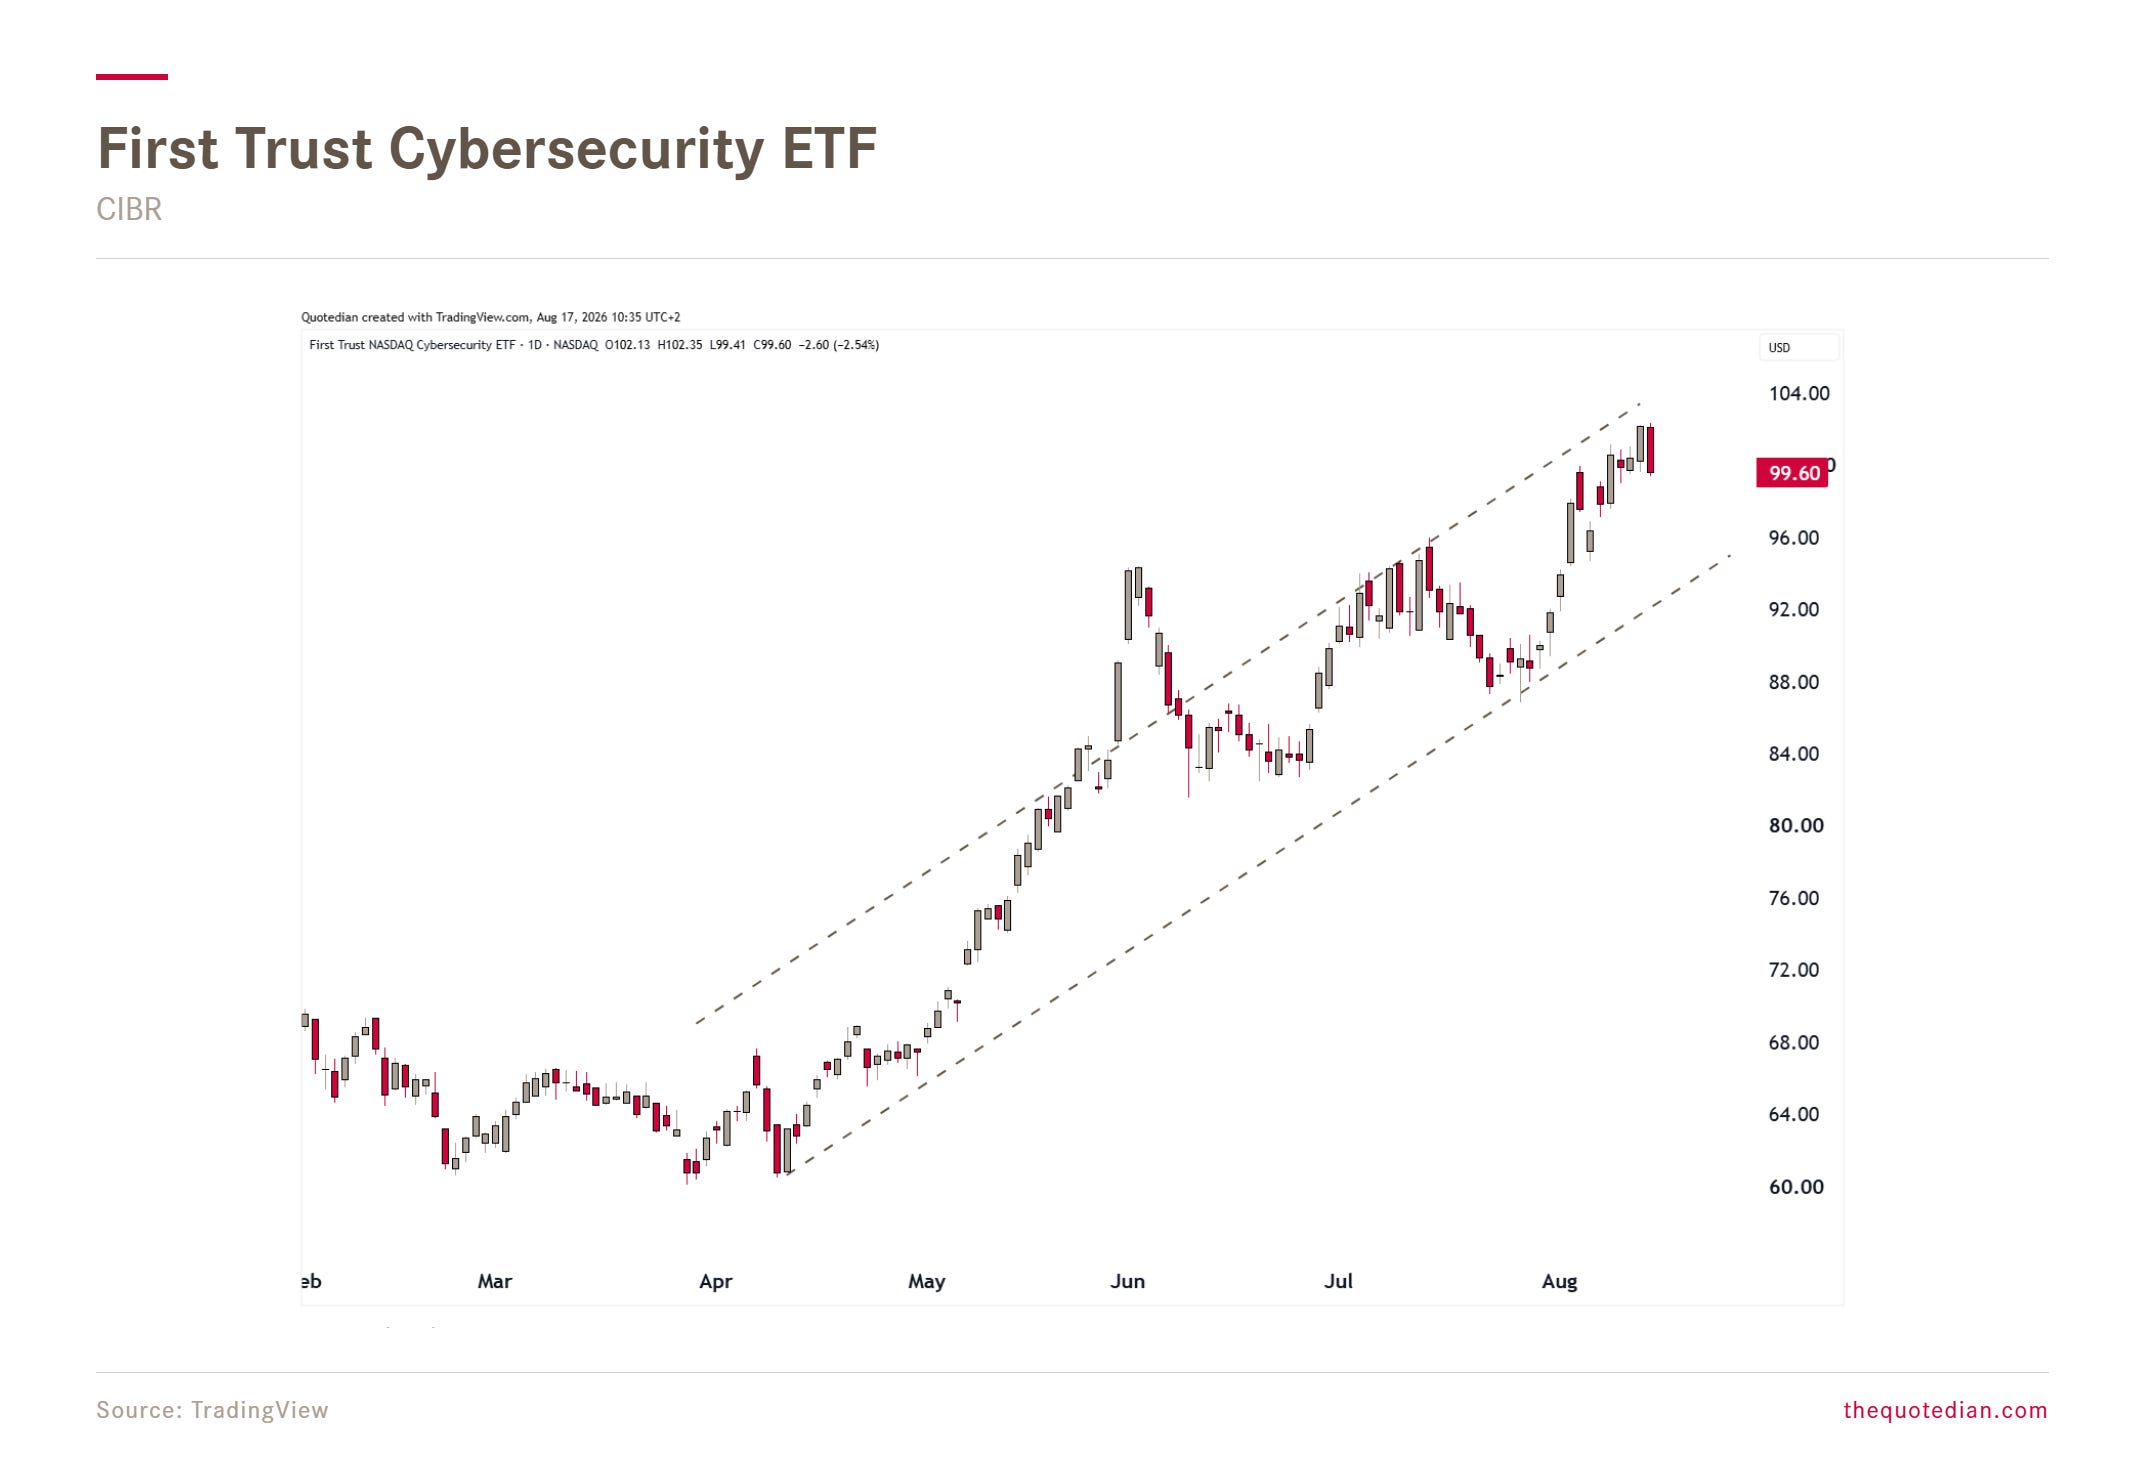
But not everything is to be hated about the tech sector now. I especially like the Cybersecurity sector and we have started building a position in the First Trust Cybersecurity ETF to selected portfolios over the past few sessions:
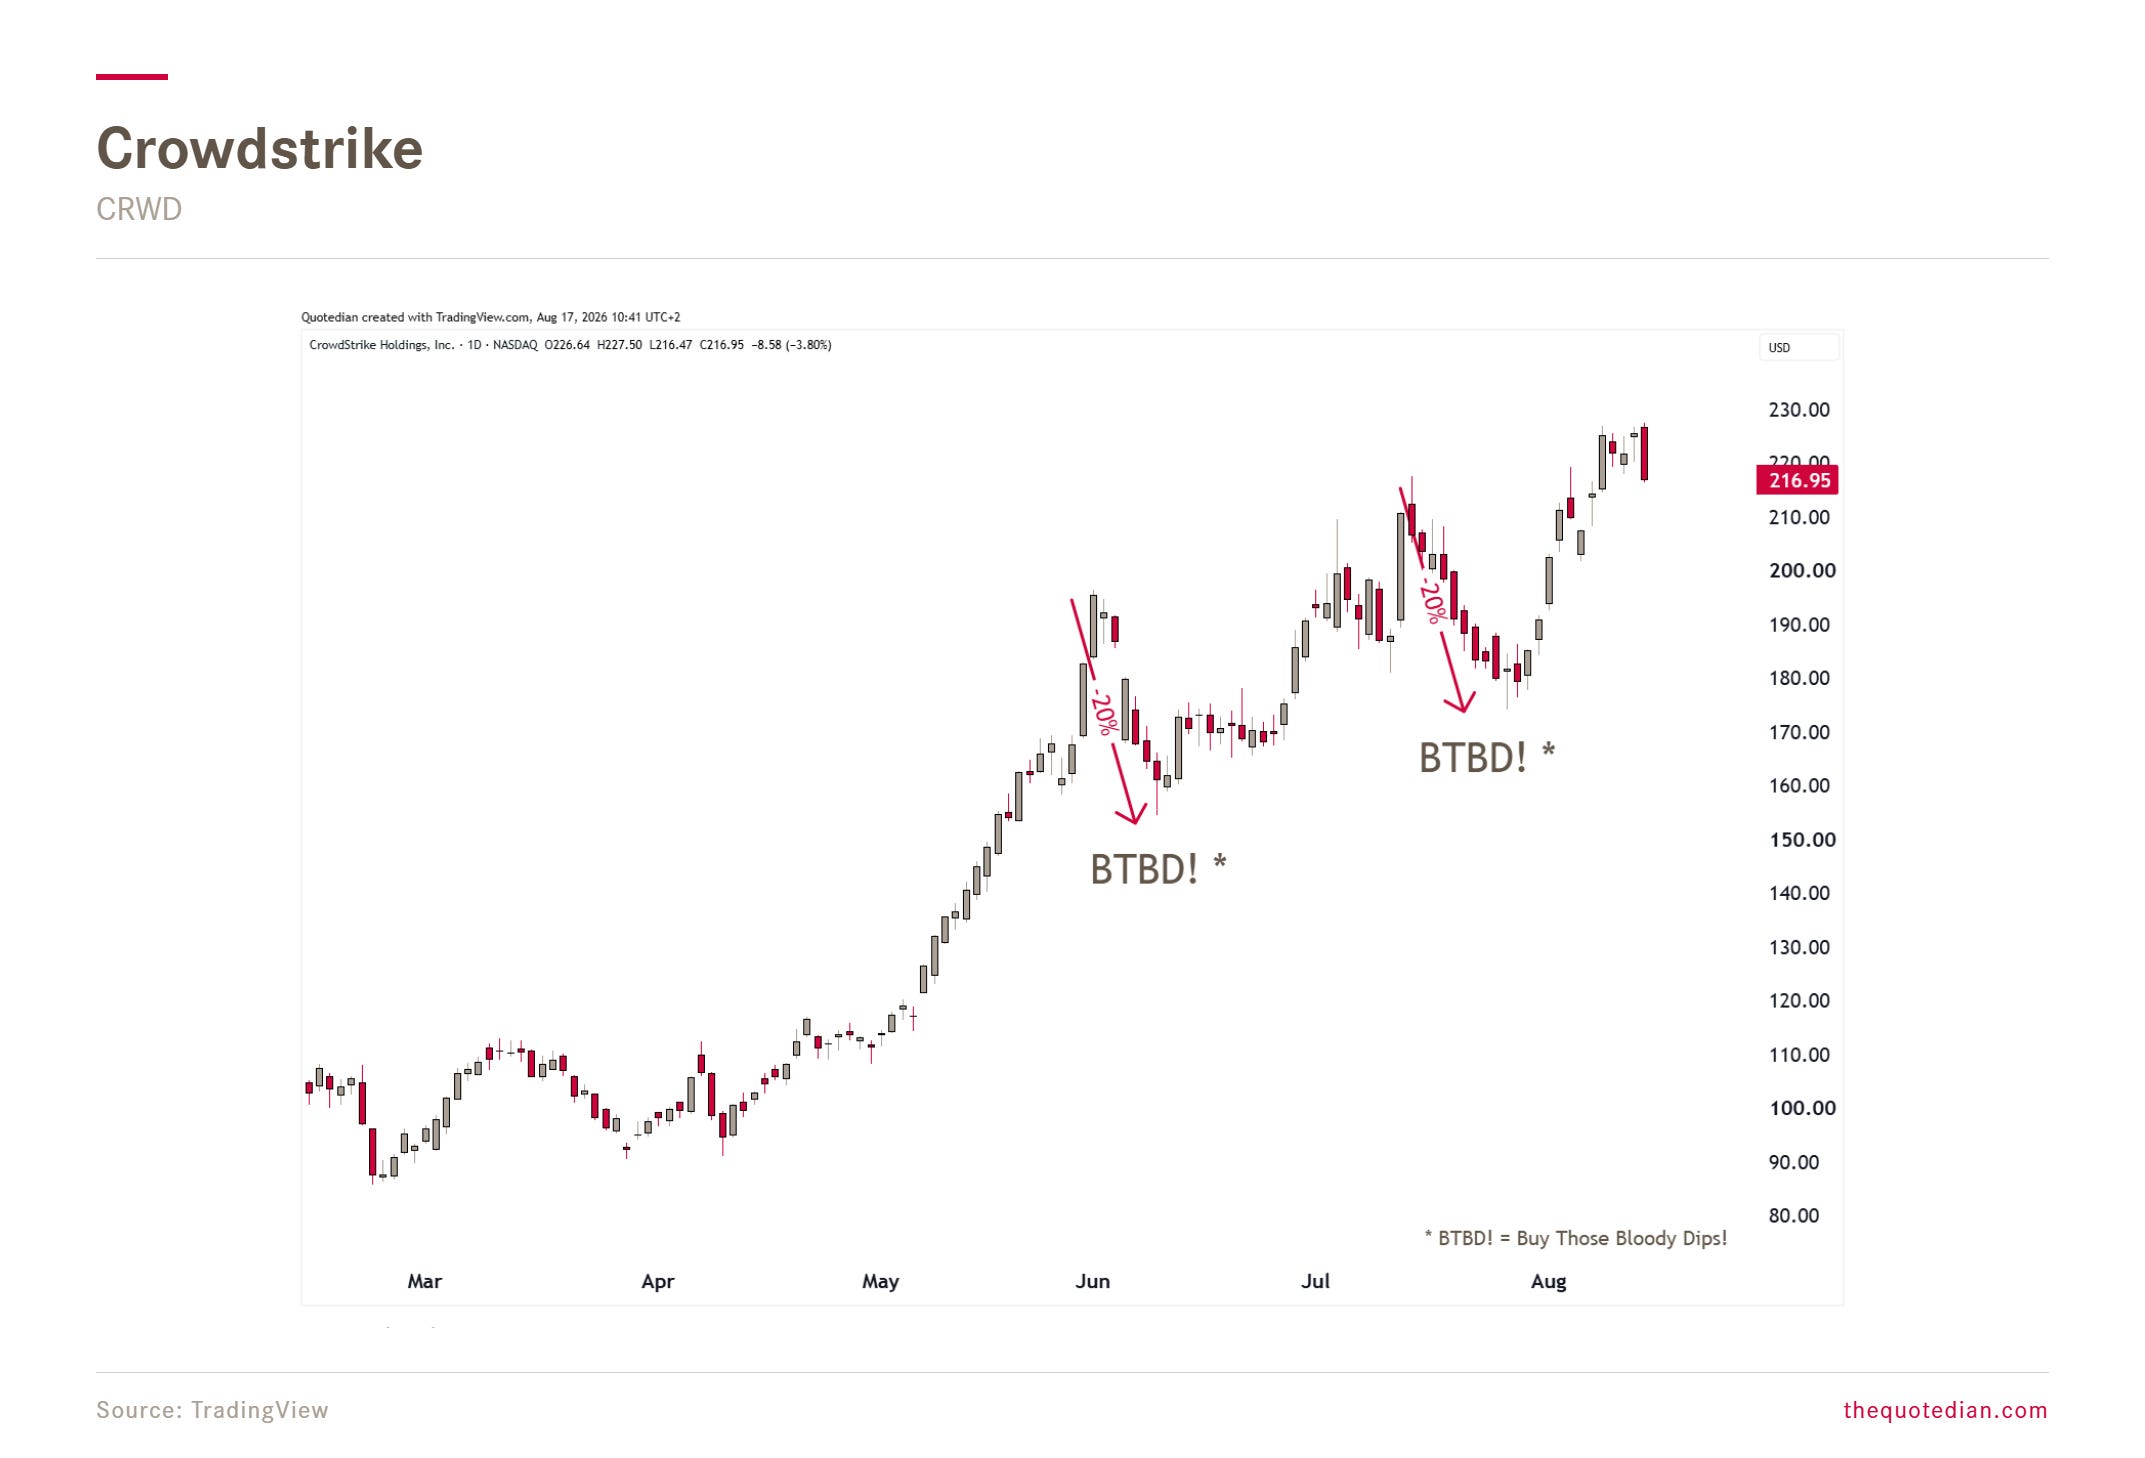
For investors looking for more direct, single name exposure we are looking at our all-time favourite Crowdstrike (CRWD),
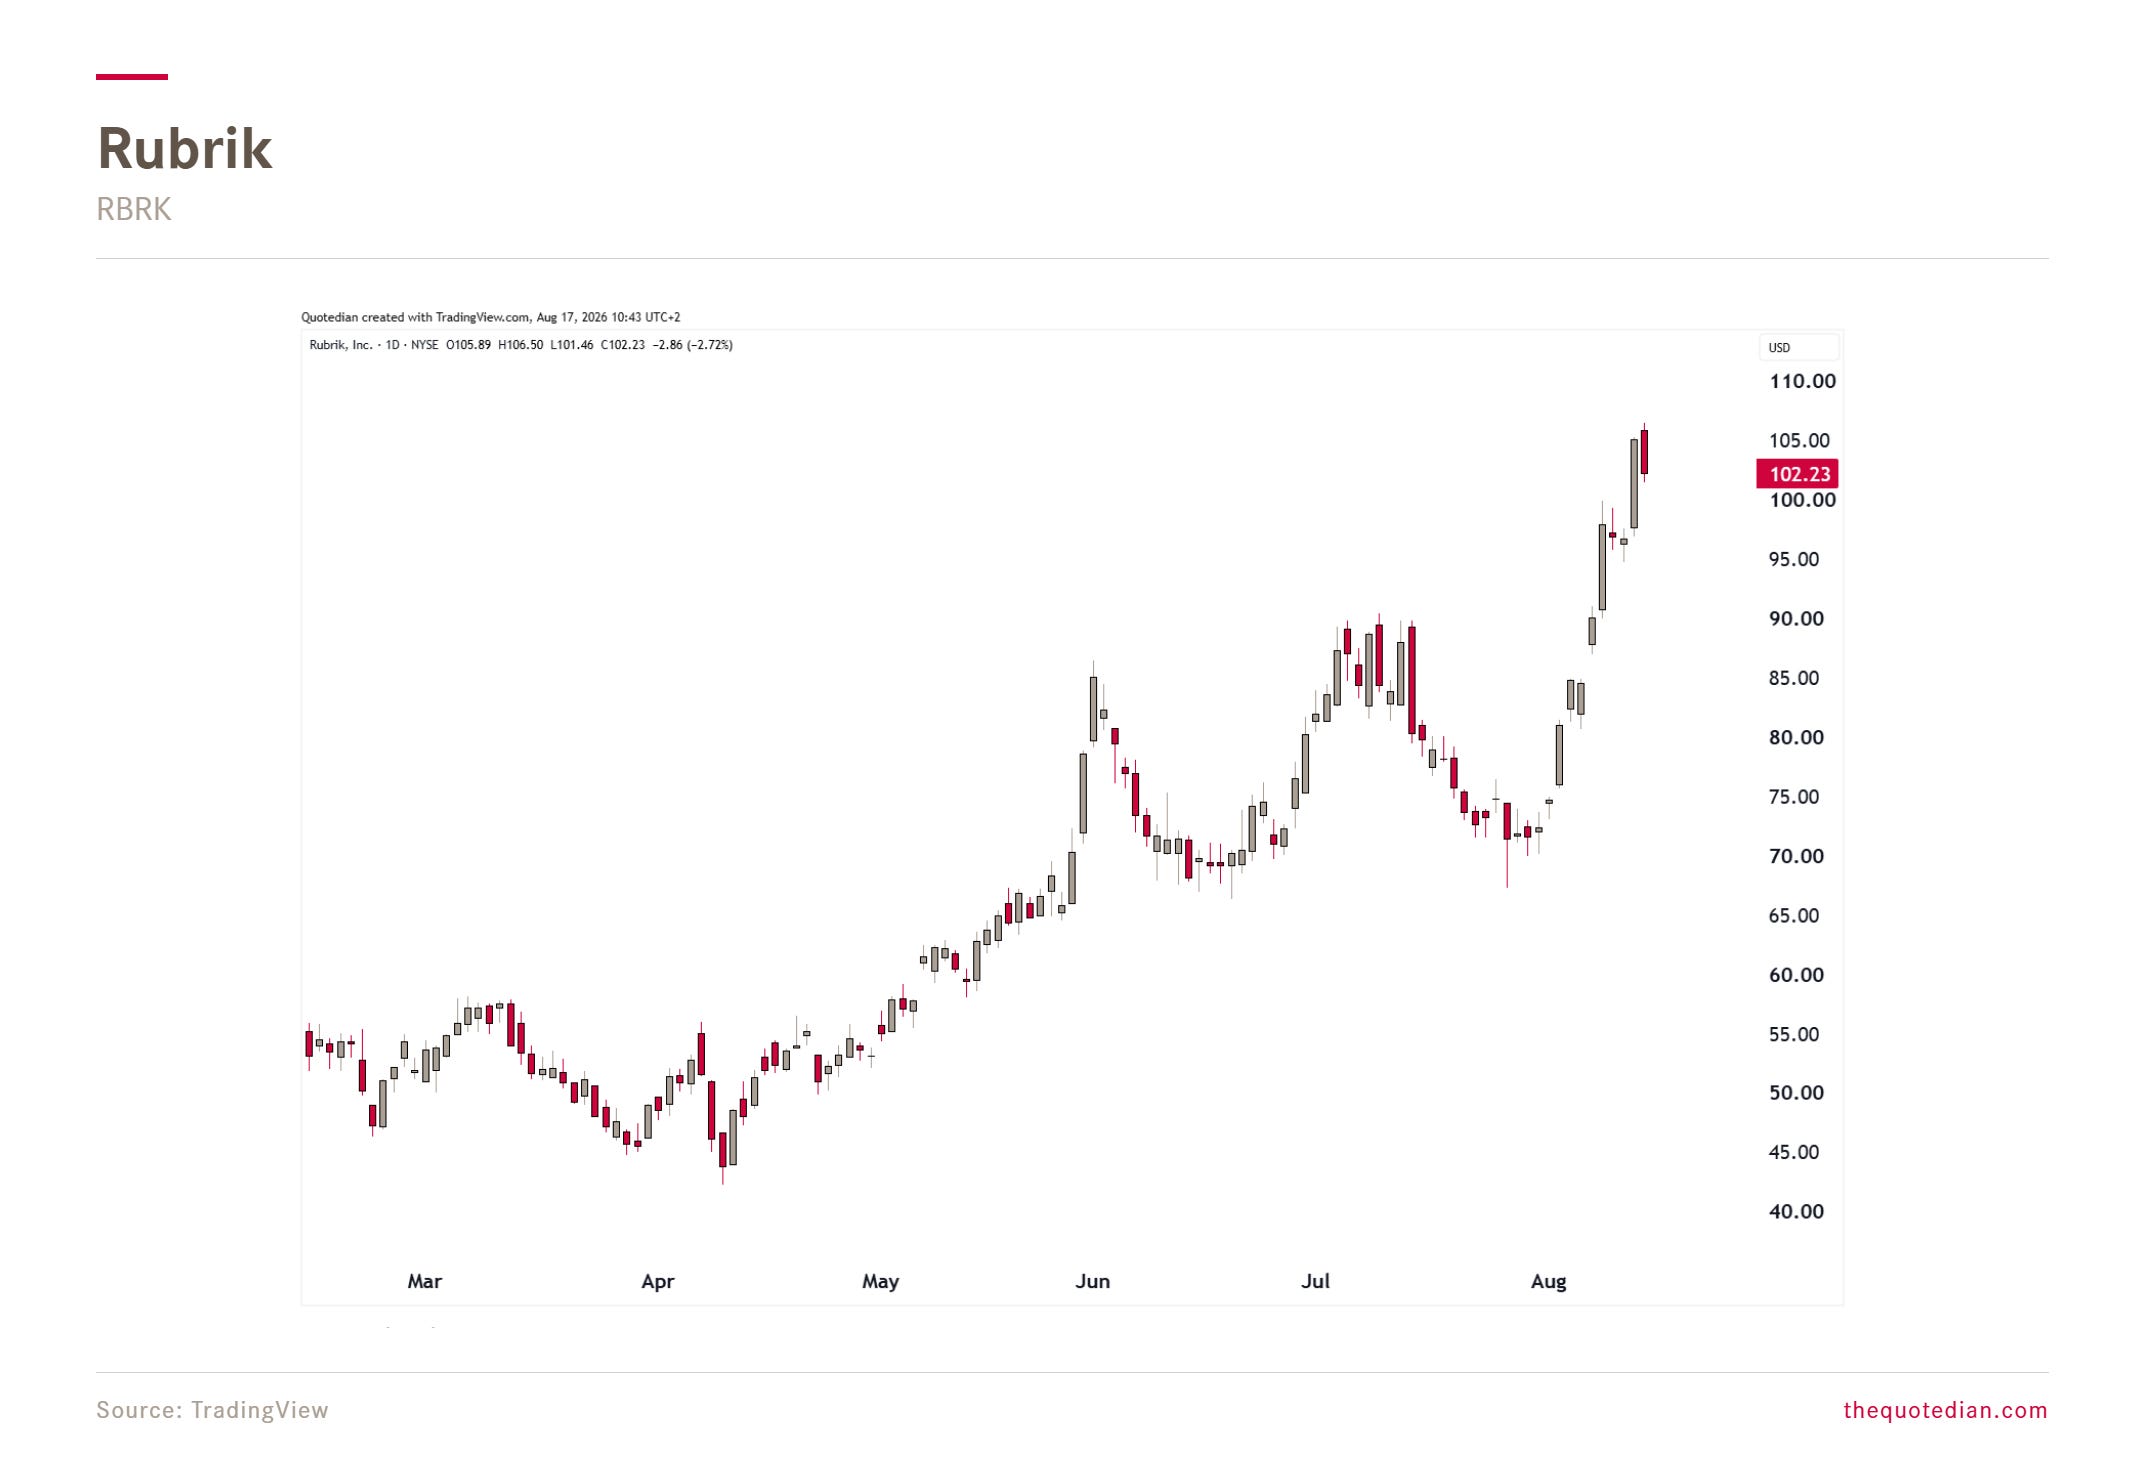
but also higher octane names such as Rubrik,
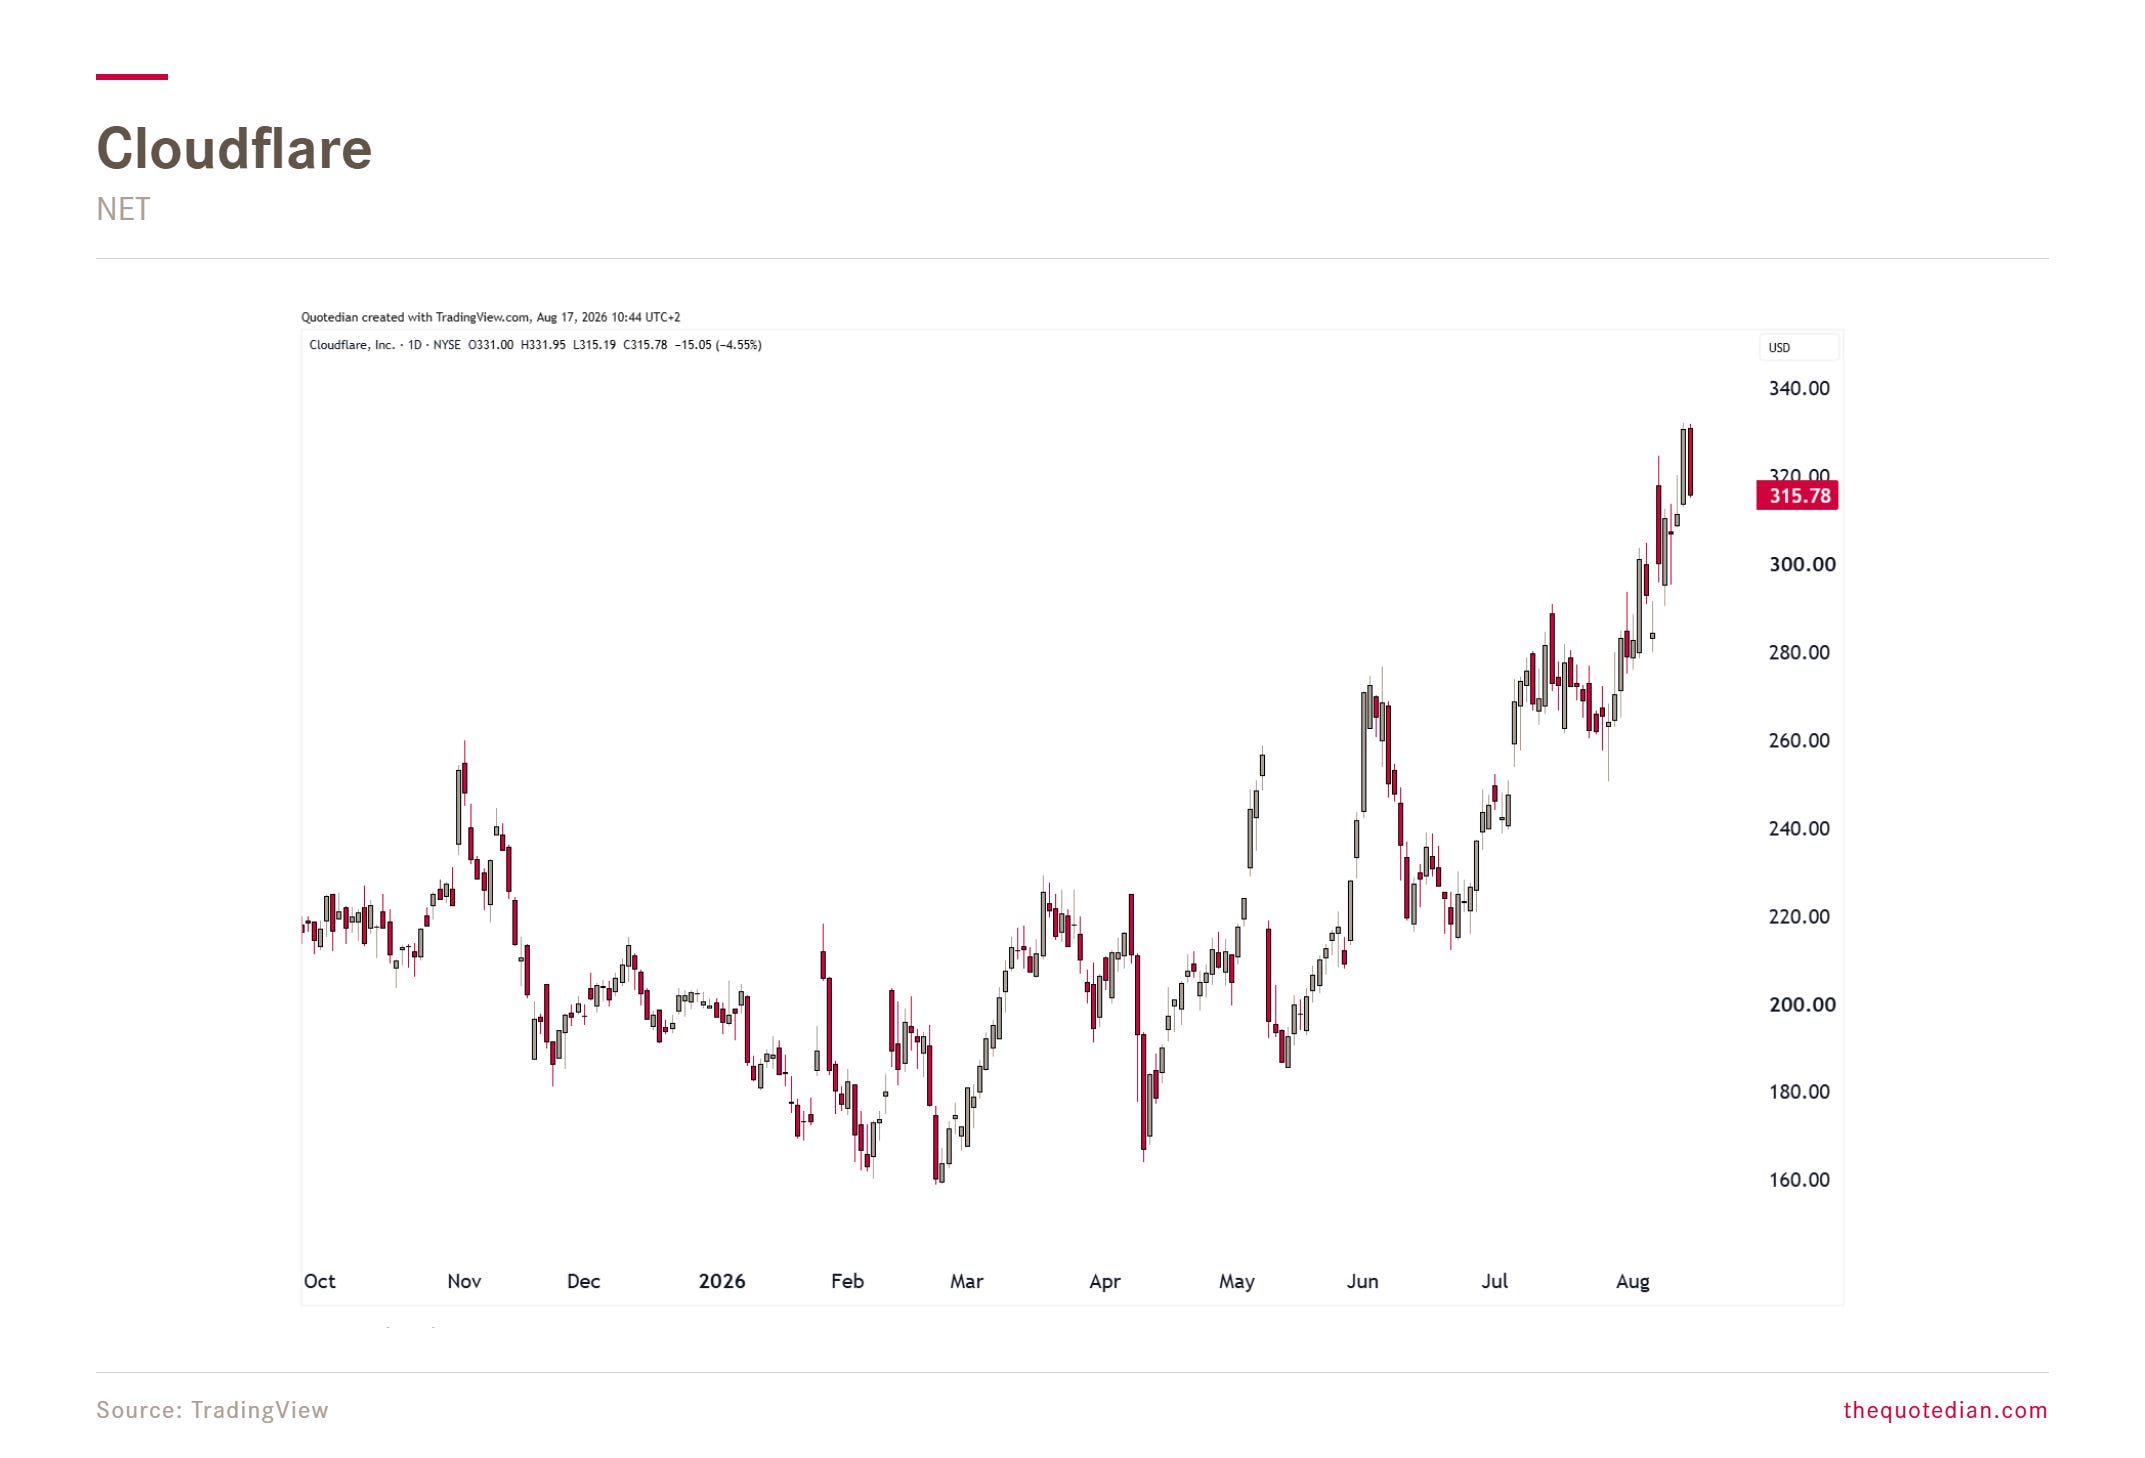
or Cloudflare:
Amongst industrial stocks, we are looking at the Aerospace & Defence sector again, with several names (BA/, NEU, SAAB, KTOS, UMAC, others) currently under review.
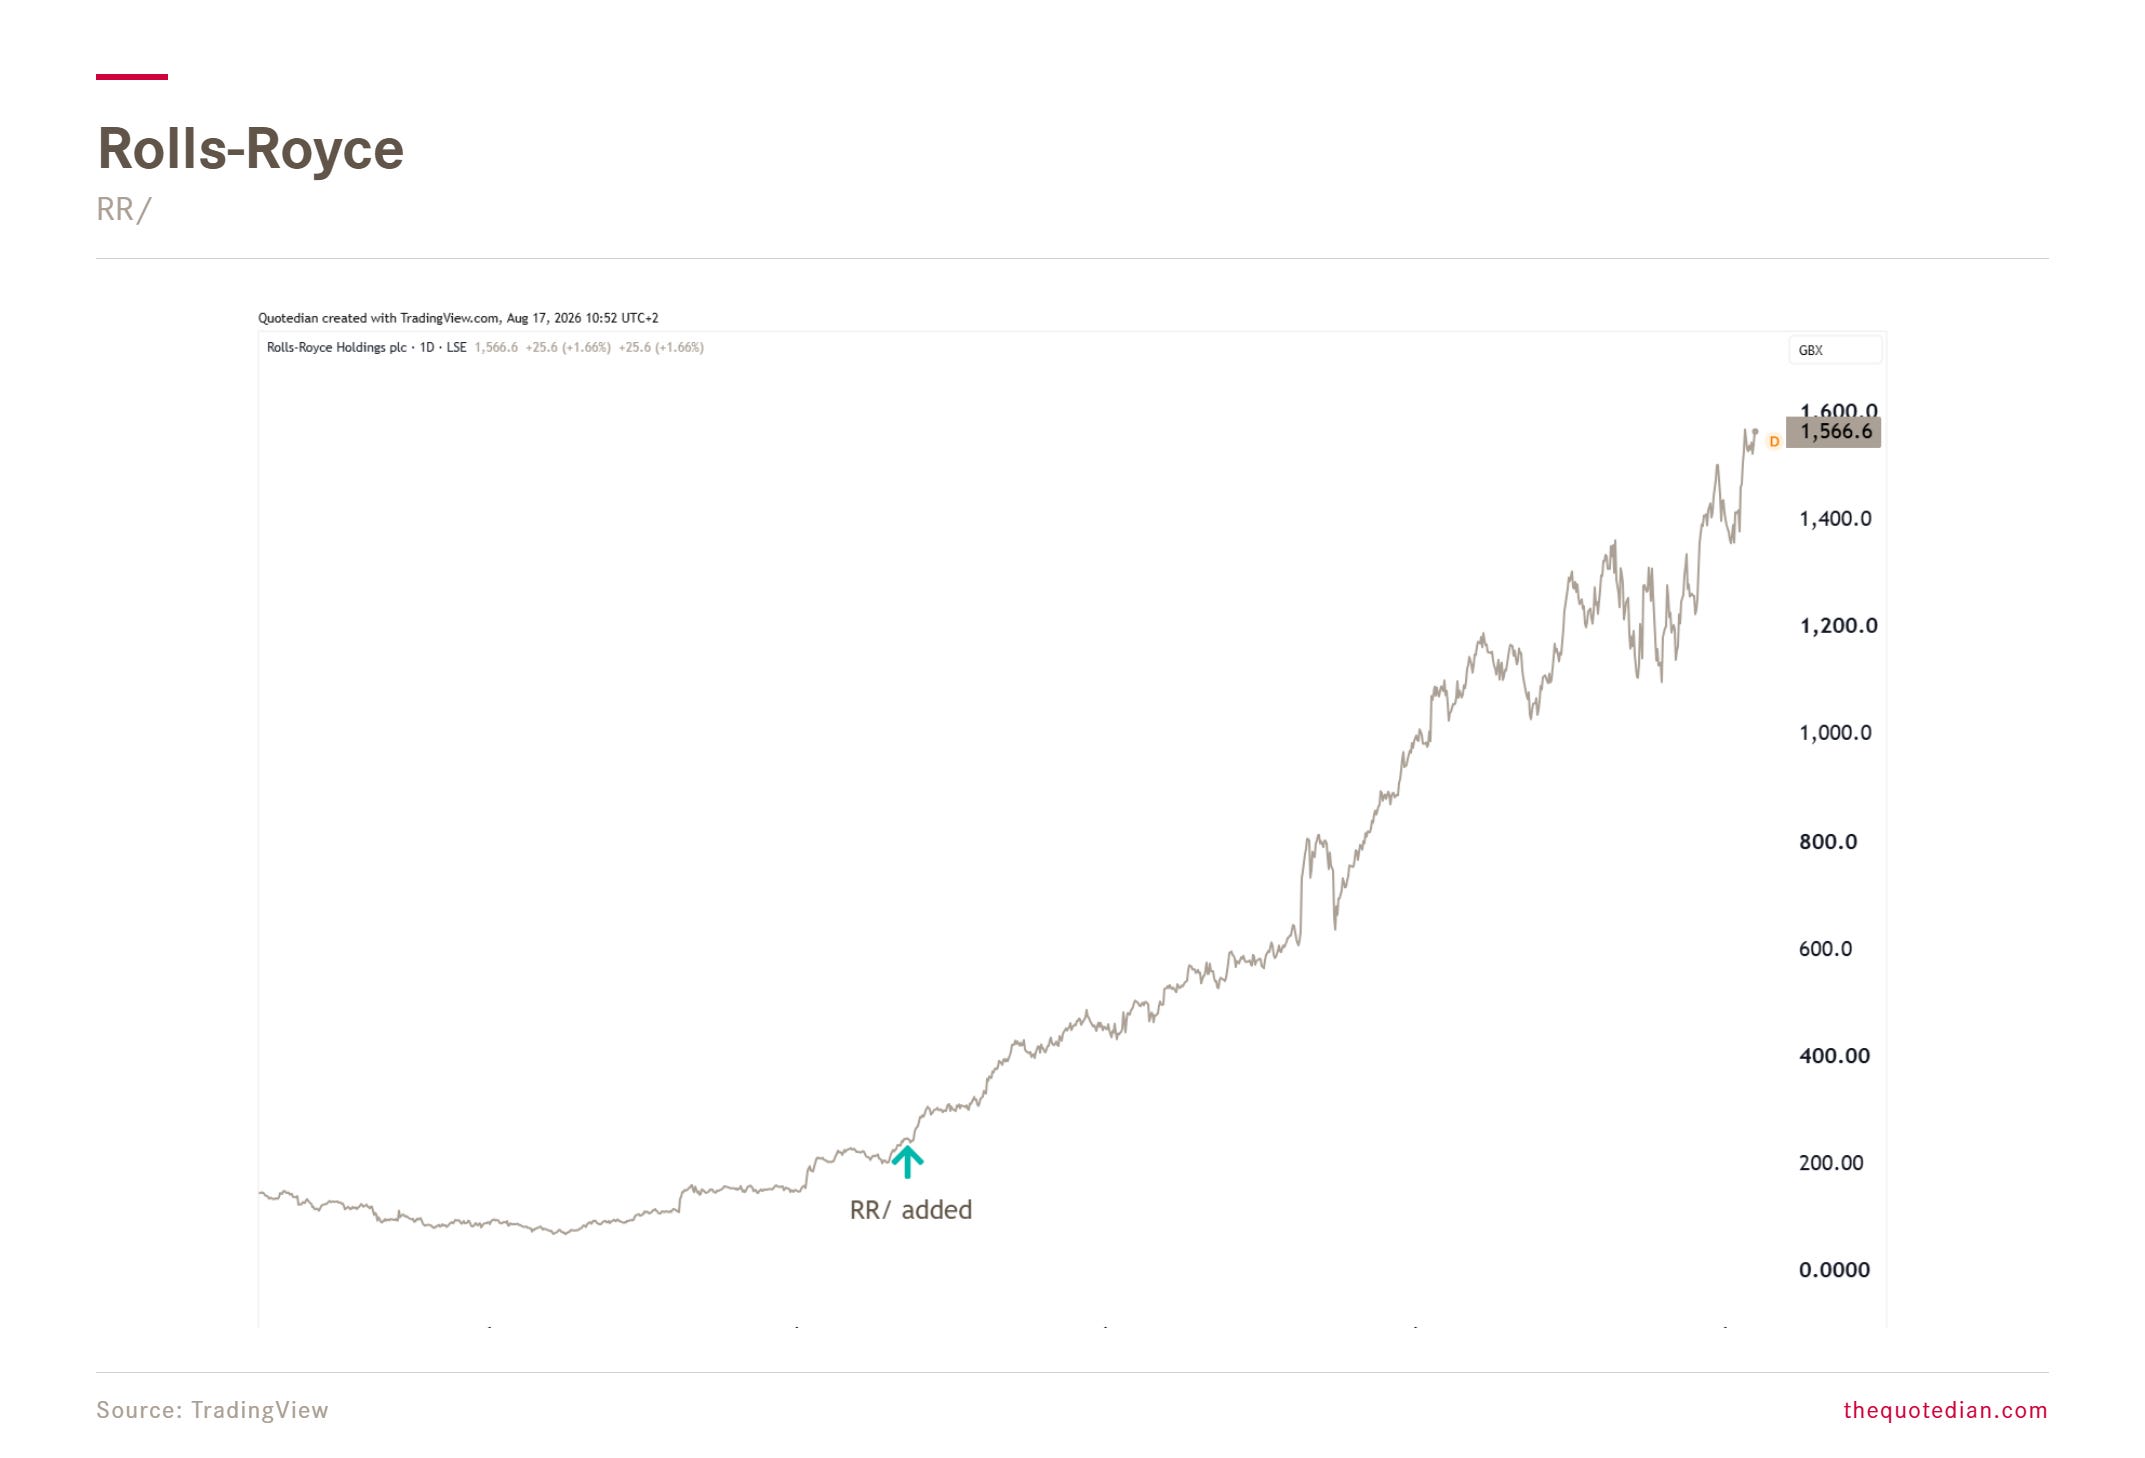
Rolls Royce continues to be on our NPB Focus List of stocks (where it is has been since initiation of the list back in June 2023):
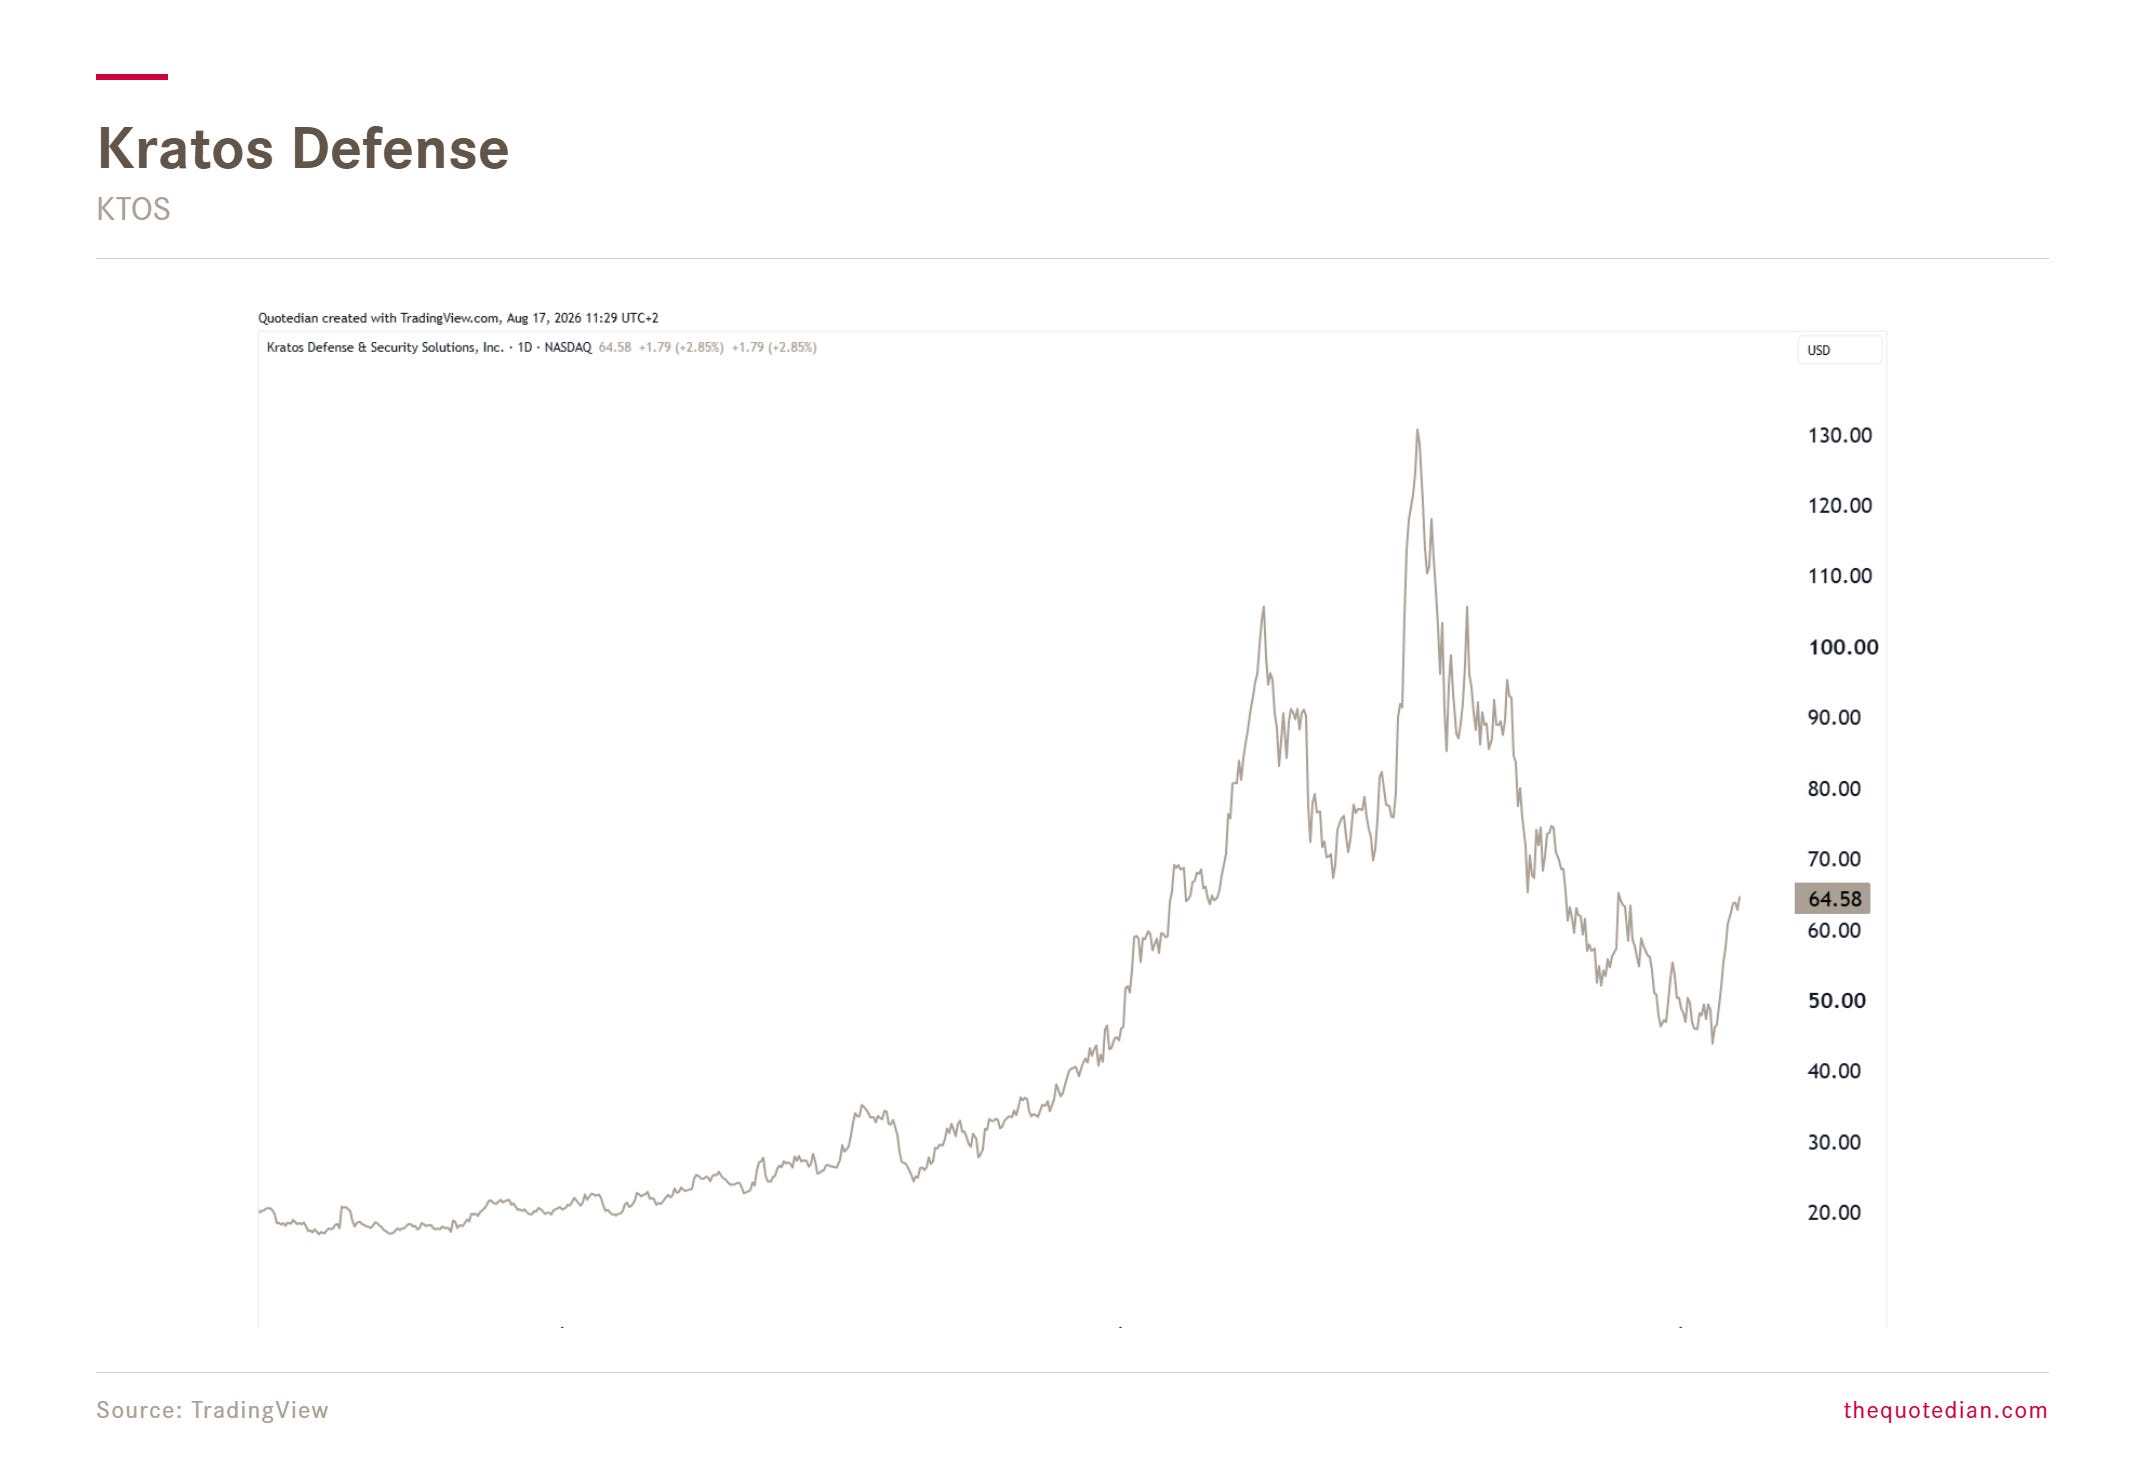
And we just added Kratos again after the 66% correction:
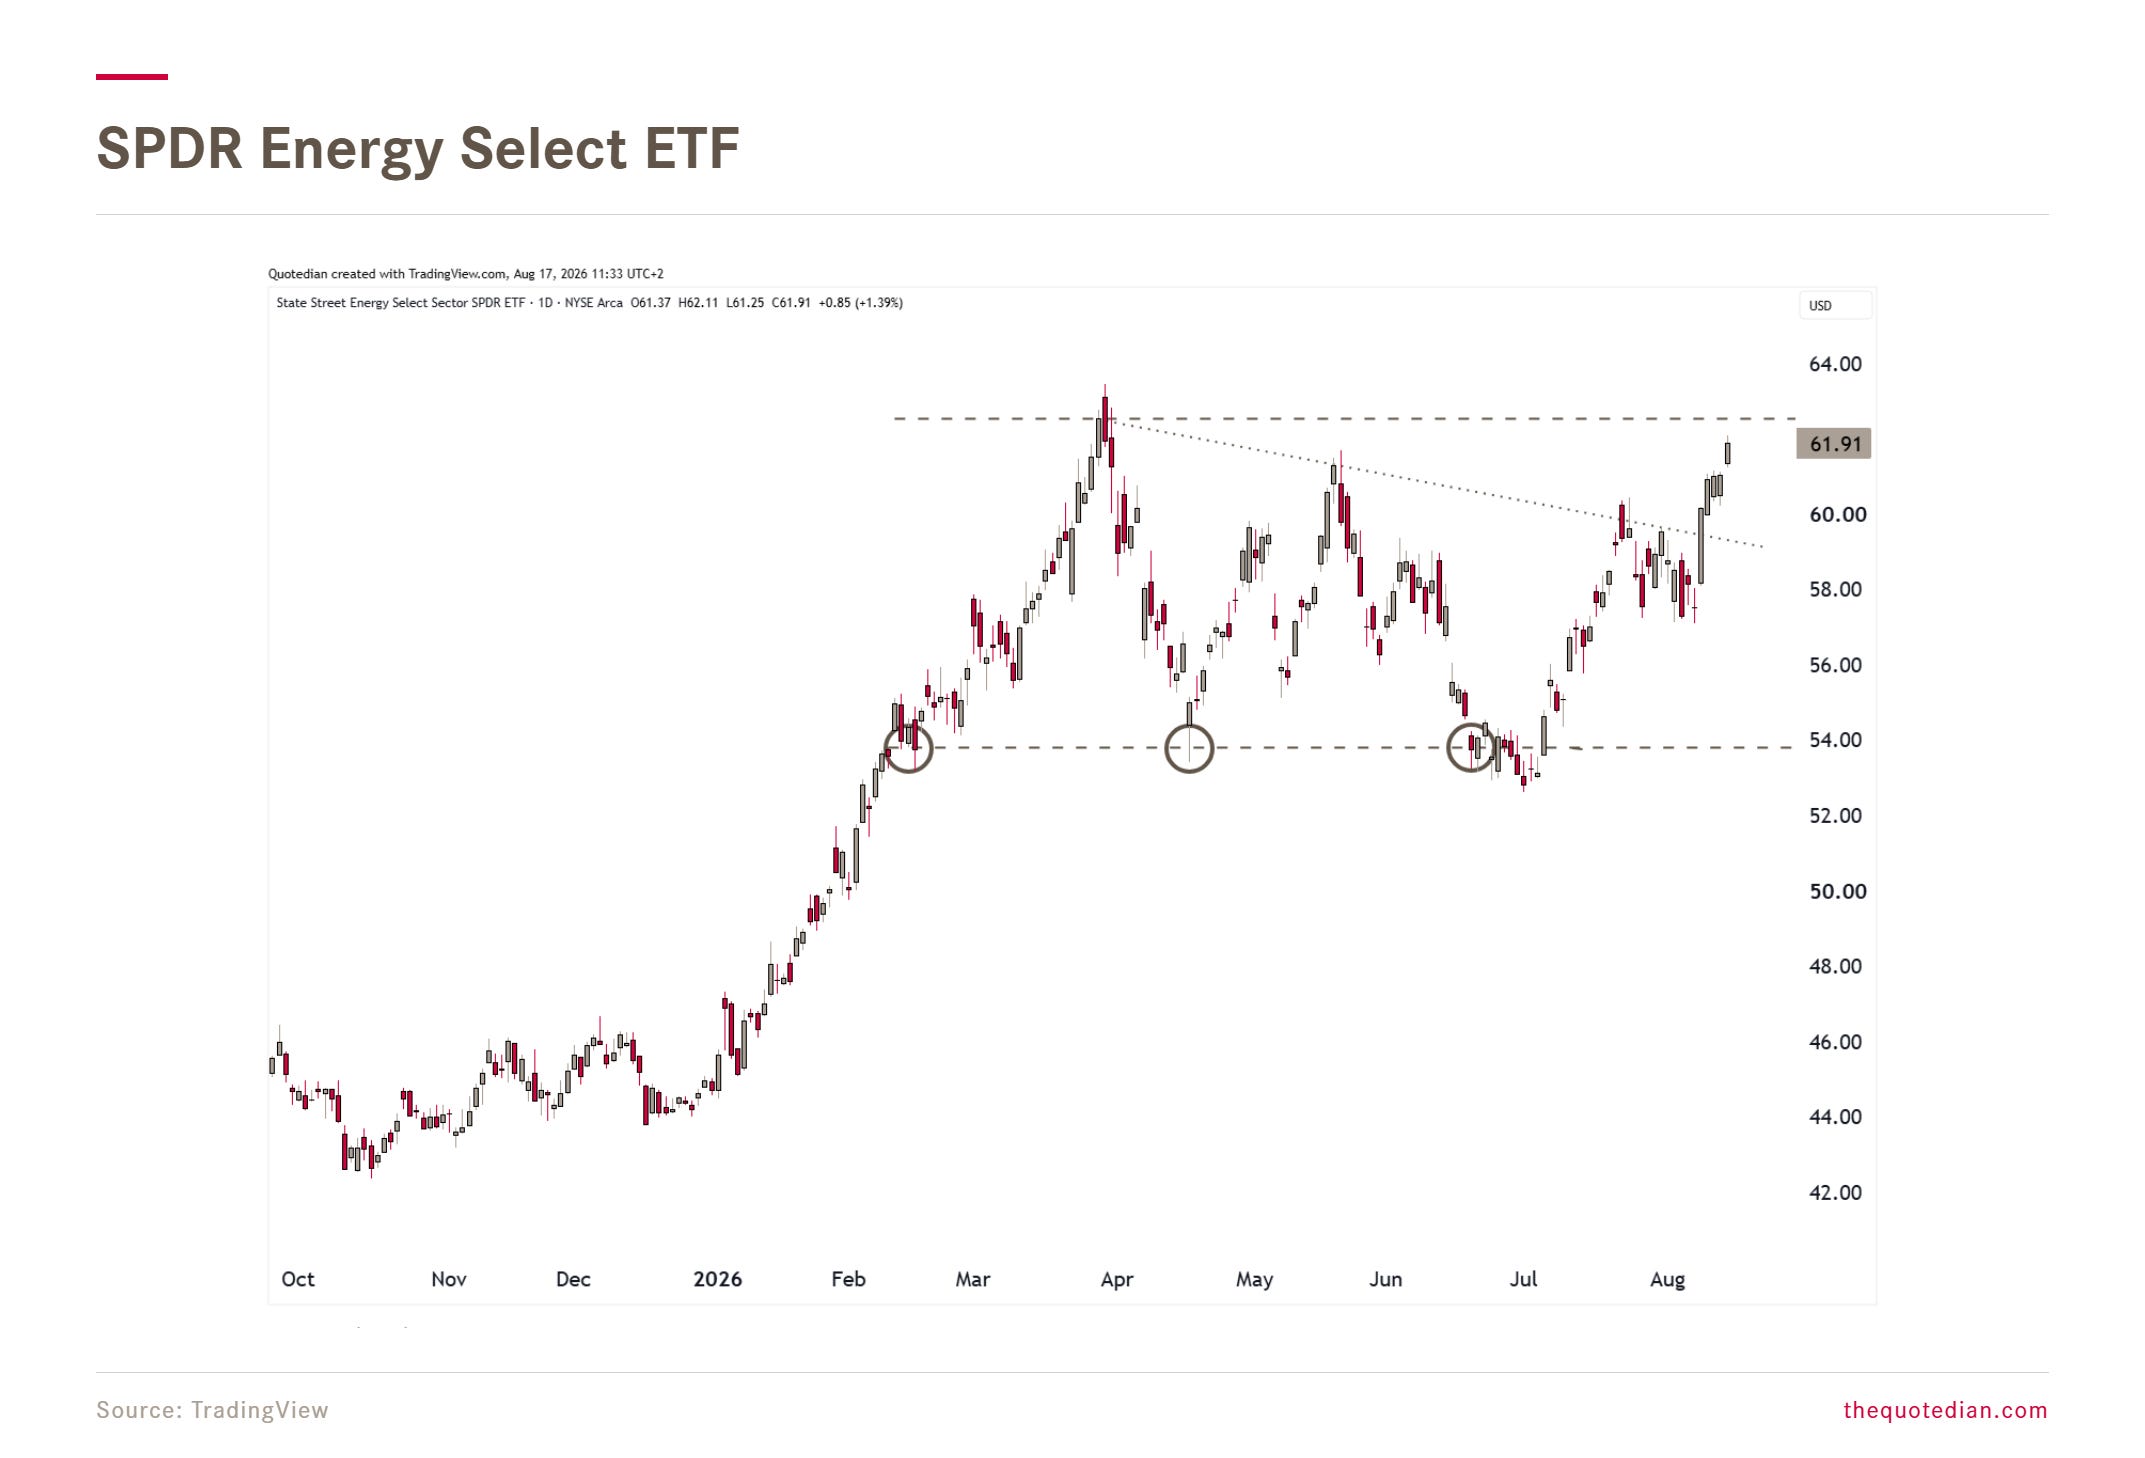
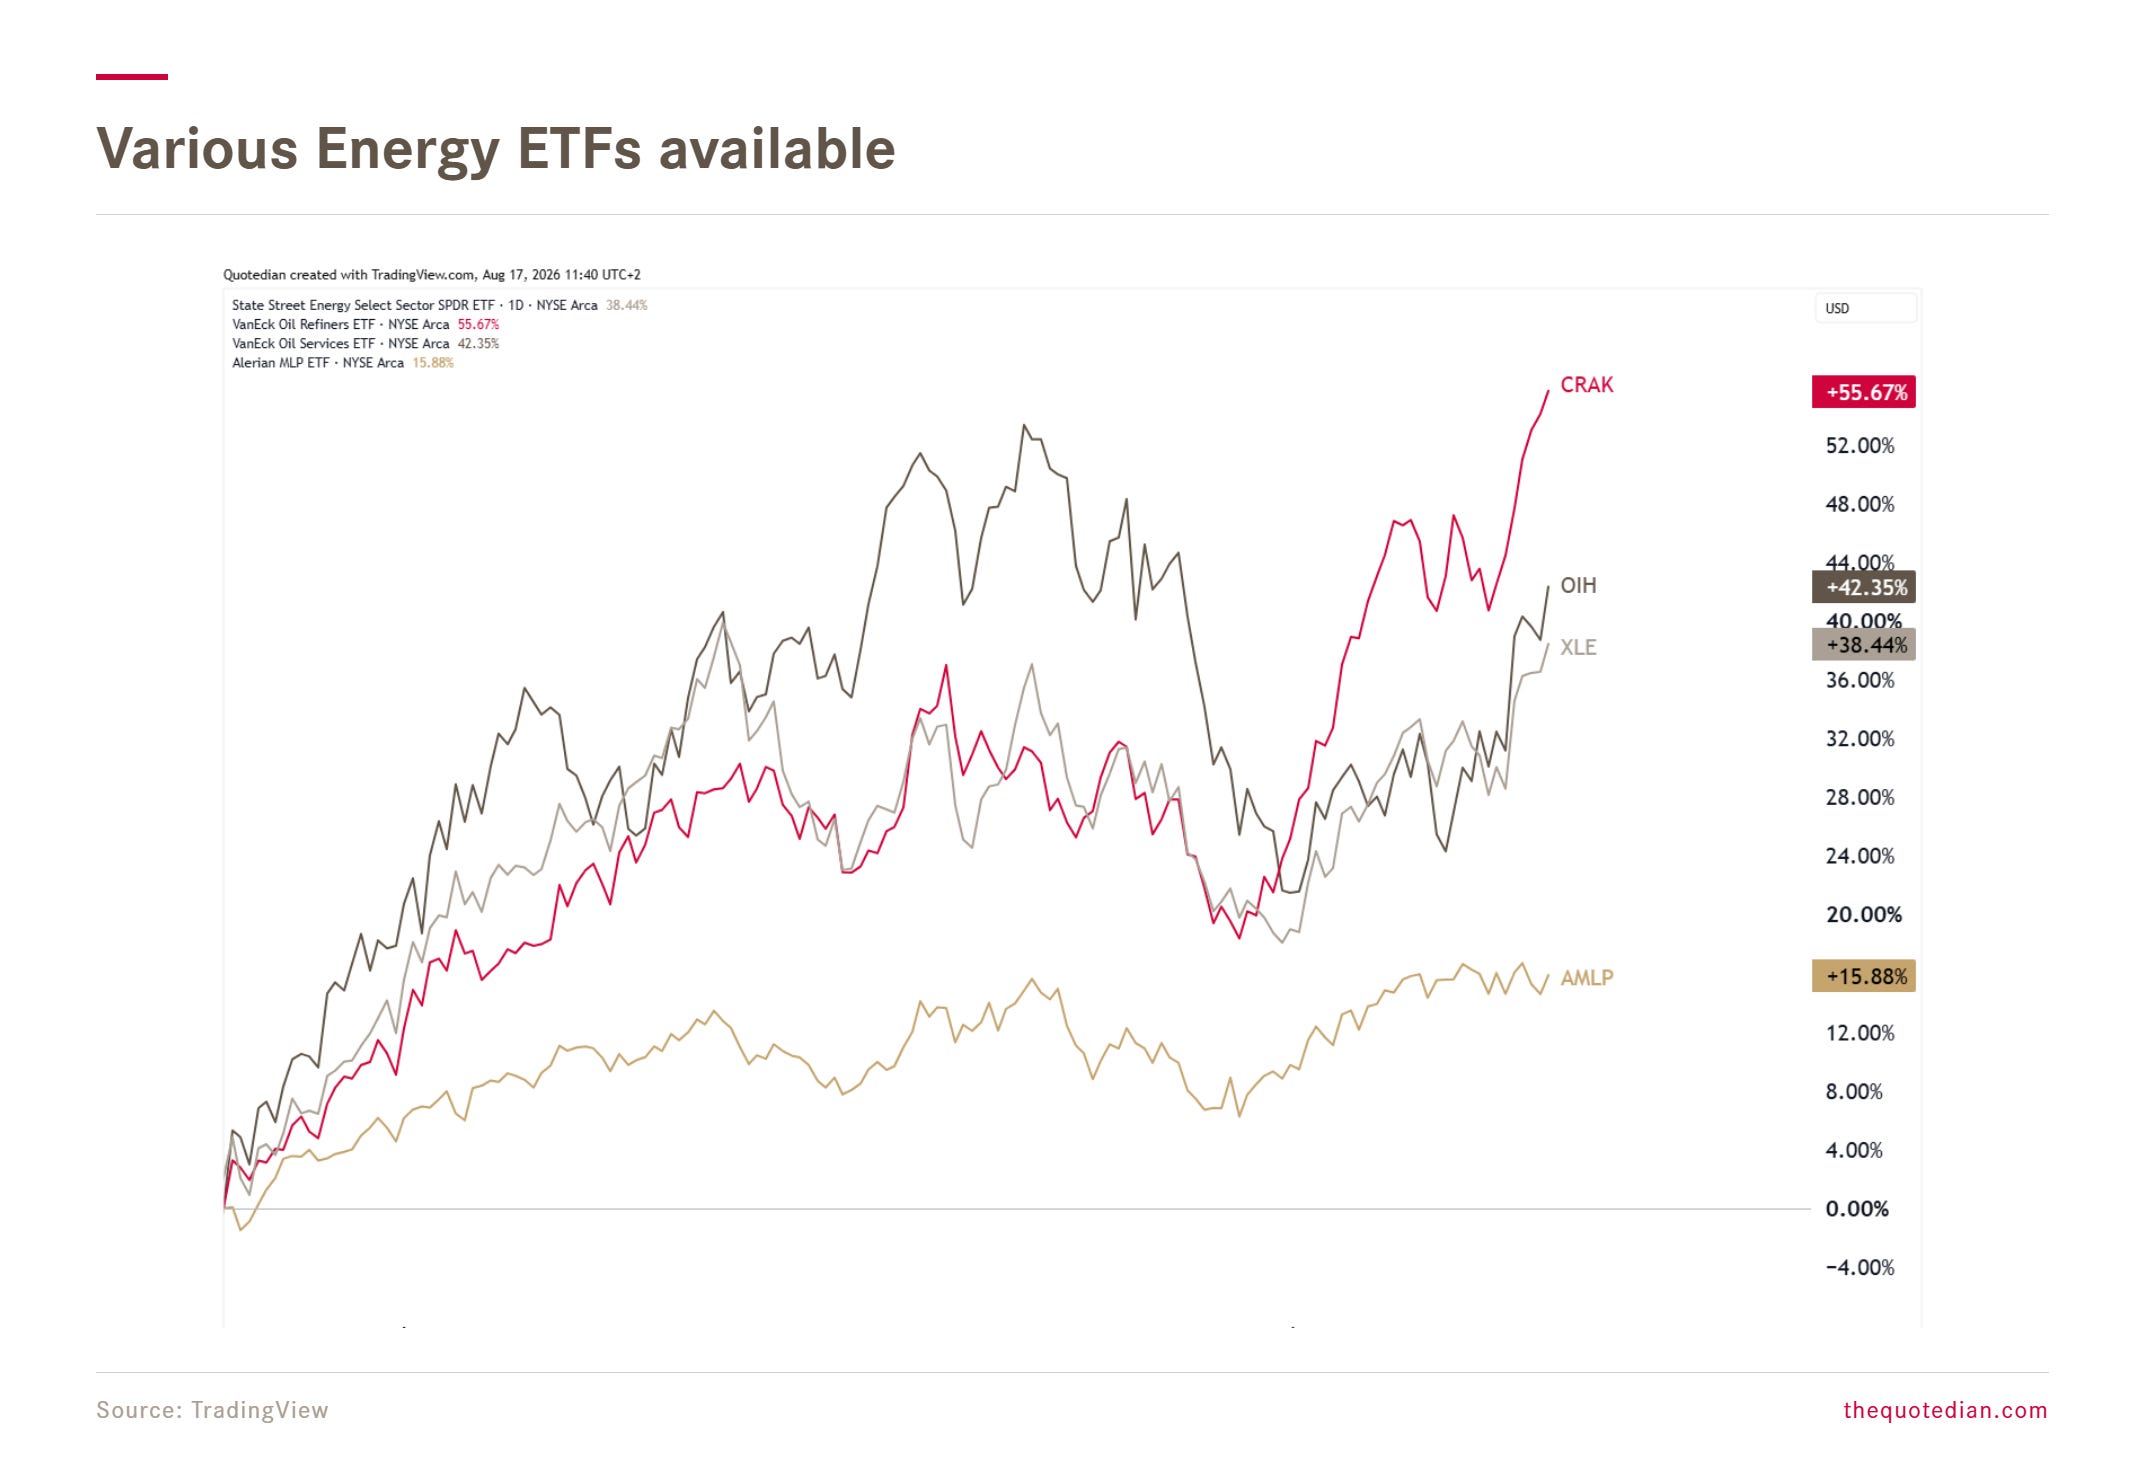
One last sector I would suggest to keep in mind, and we’ll use this as a segue into the bond section of this letter, is energy stocks. Both, the setup in the US focused SPDR Energy Select ETF (XLE),
AND the more global exposed iShares Global Energy ETF (IXC),
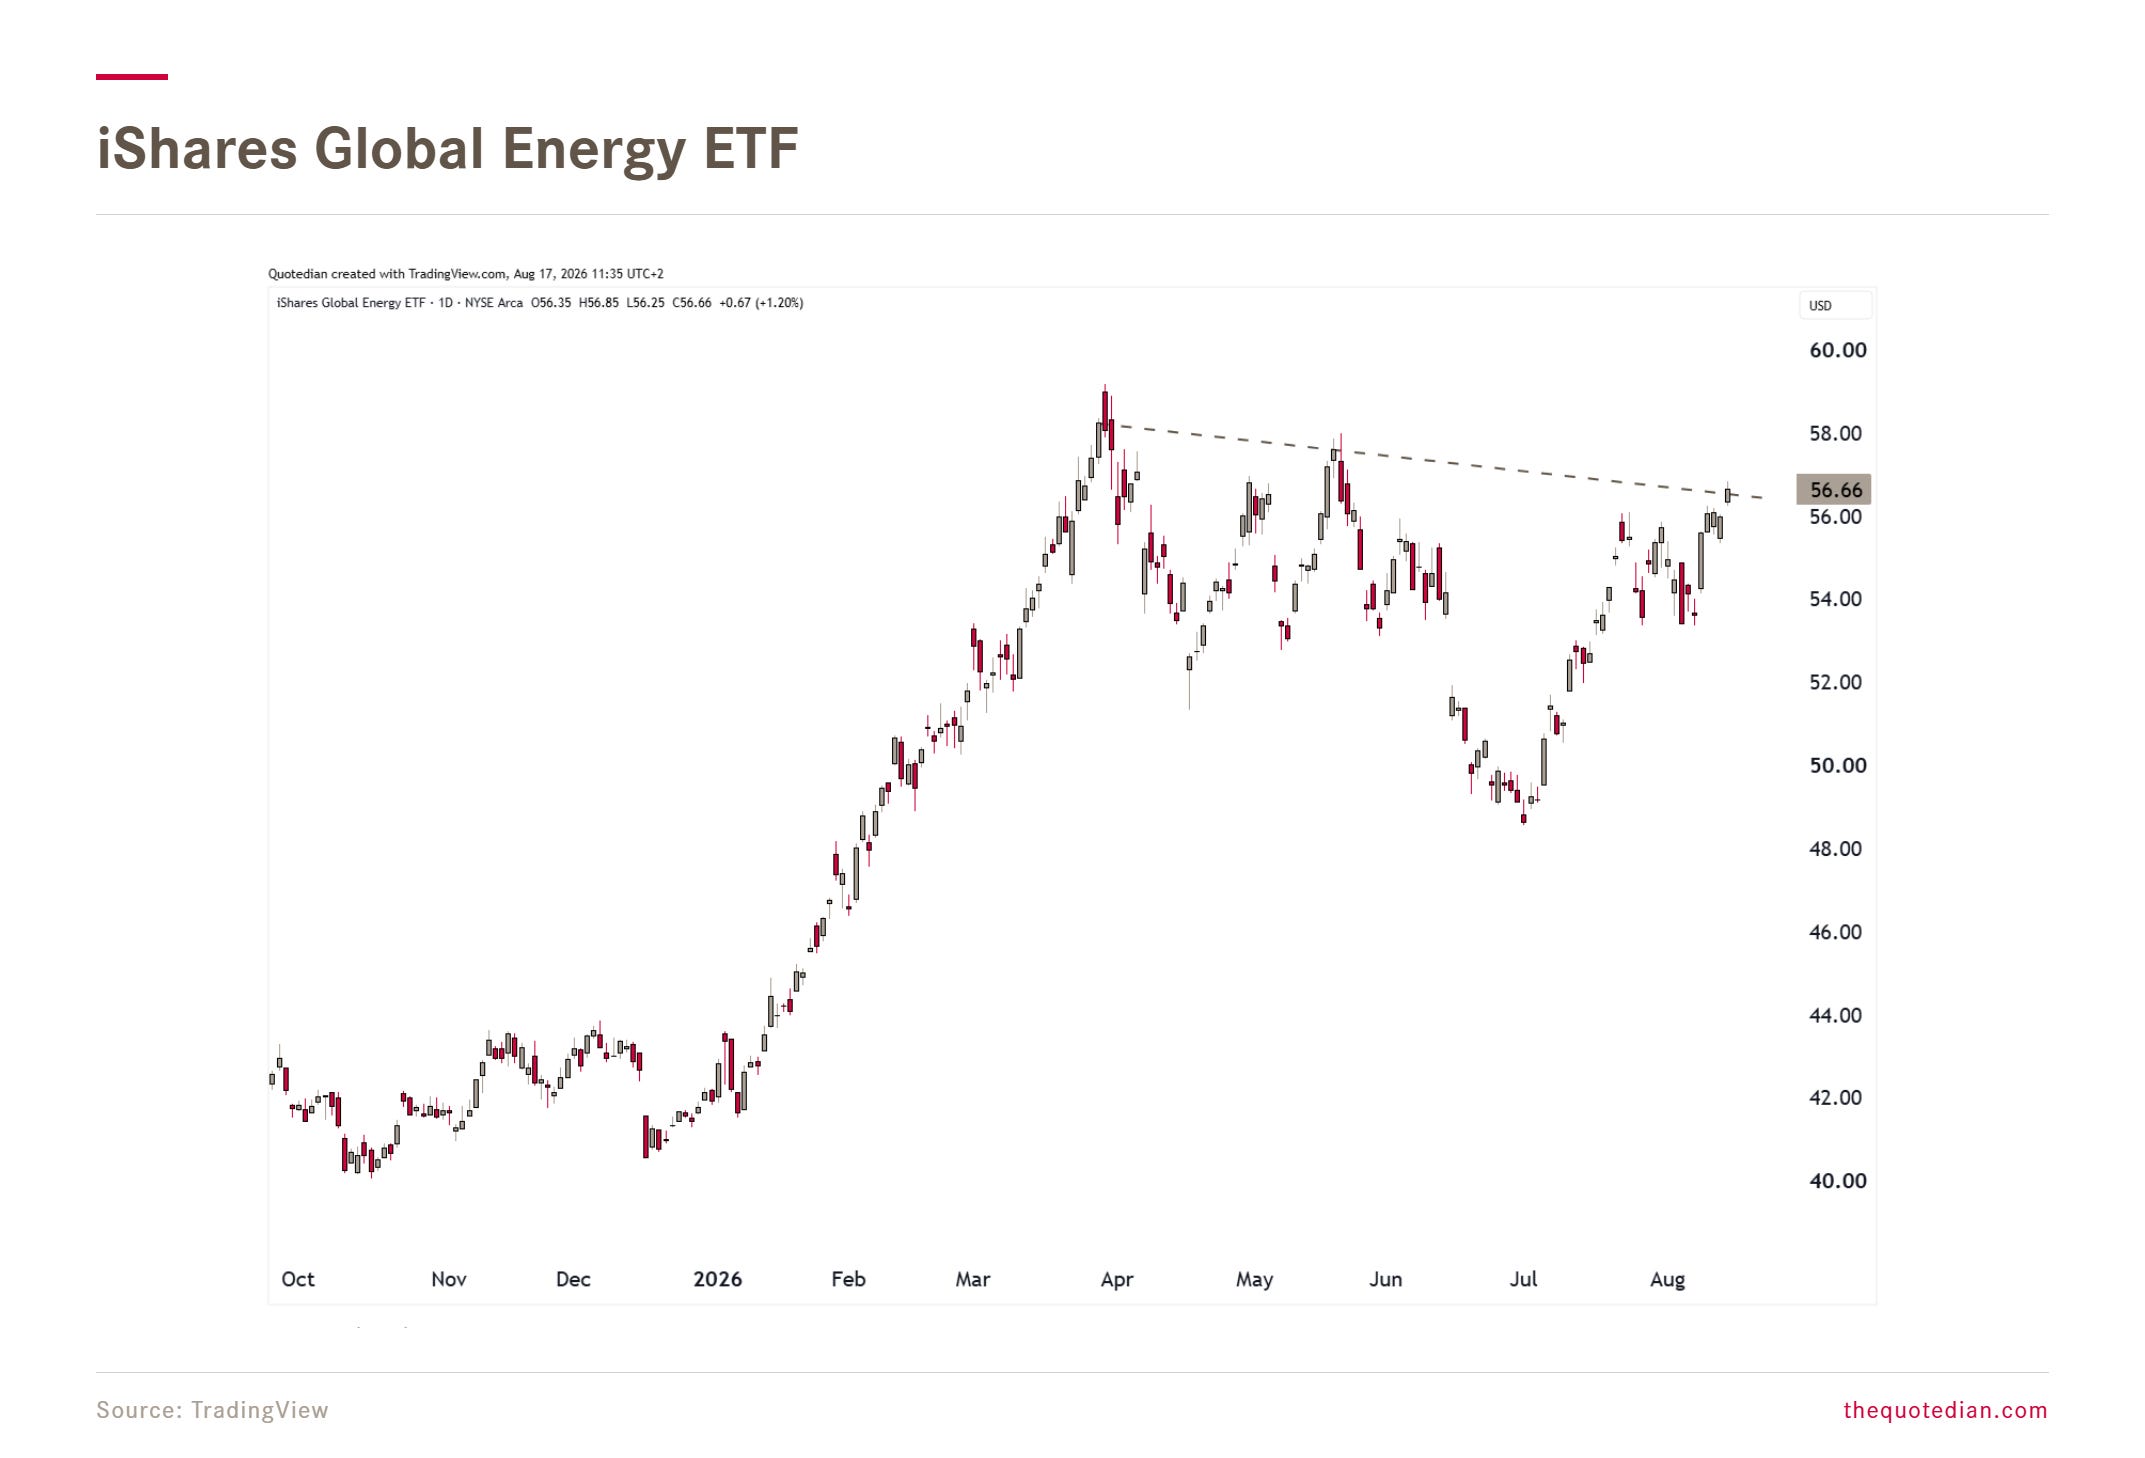
look very promising.
Luckily, the energy sector is one an investor can play with varying degrees of intensity (read: volatility):
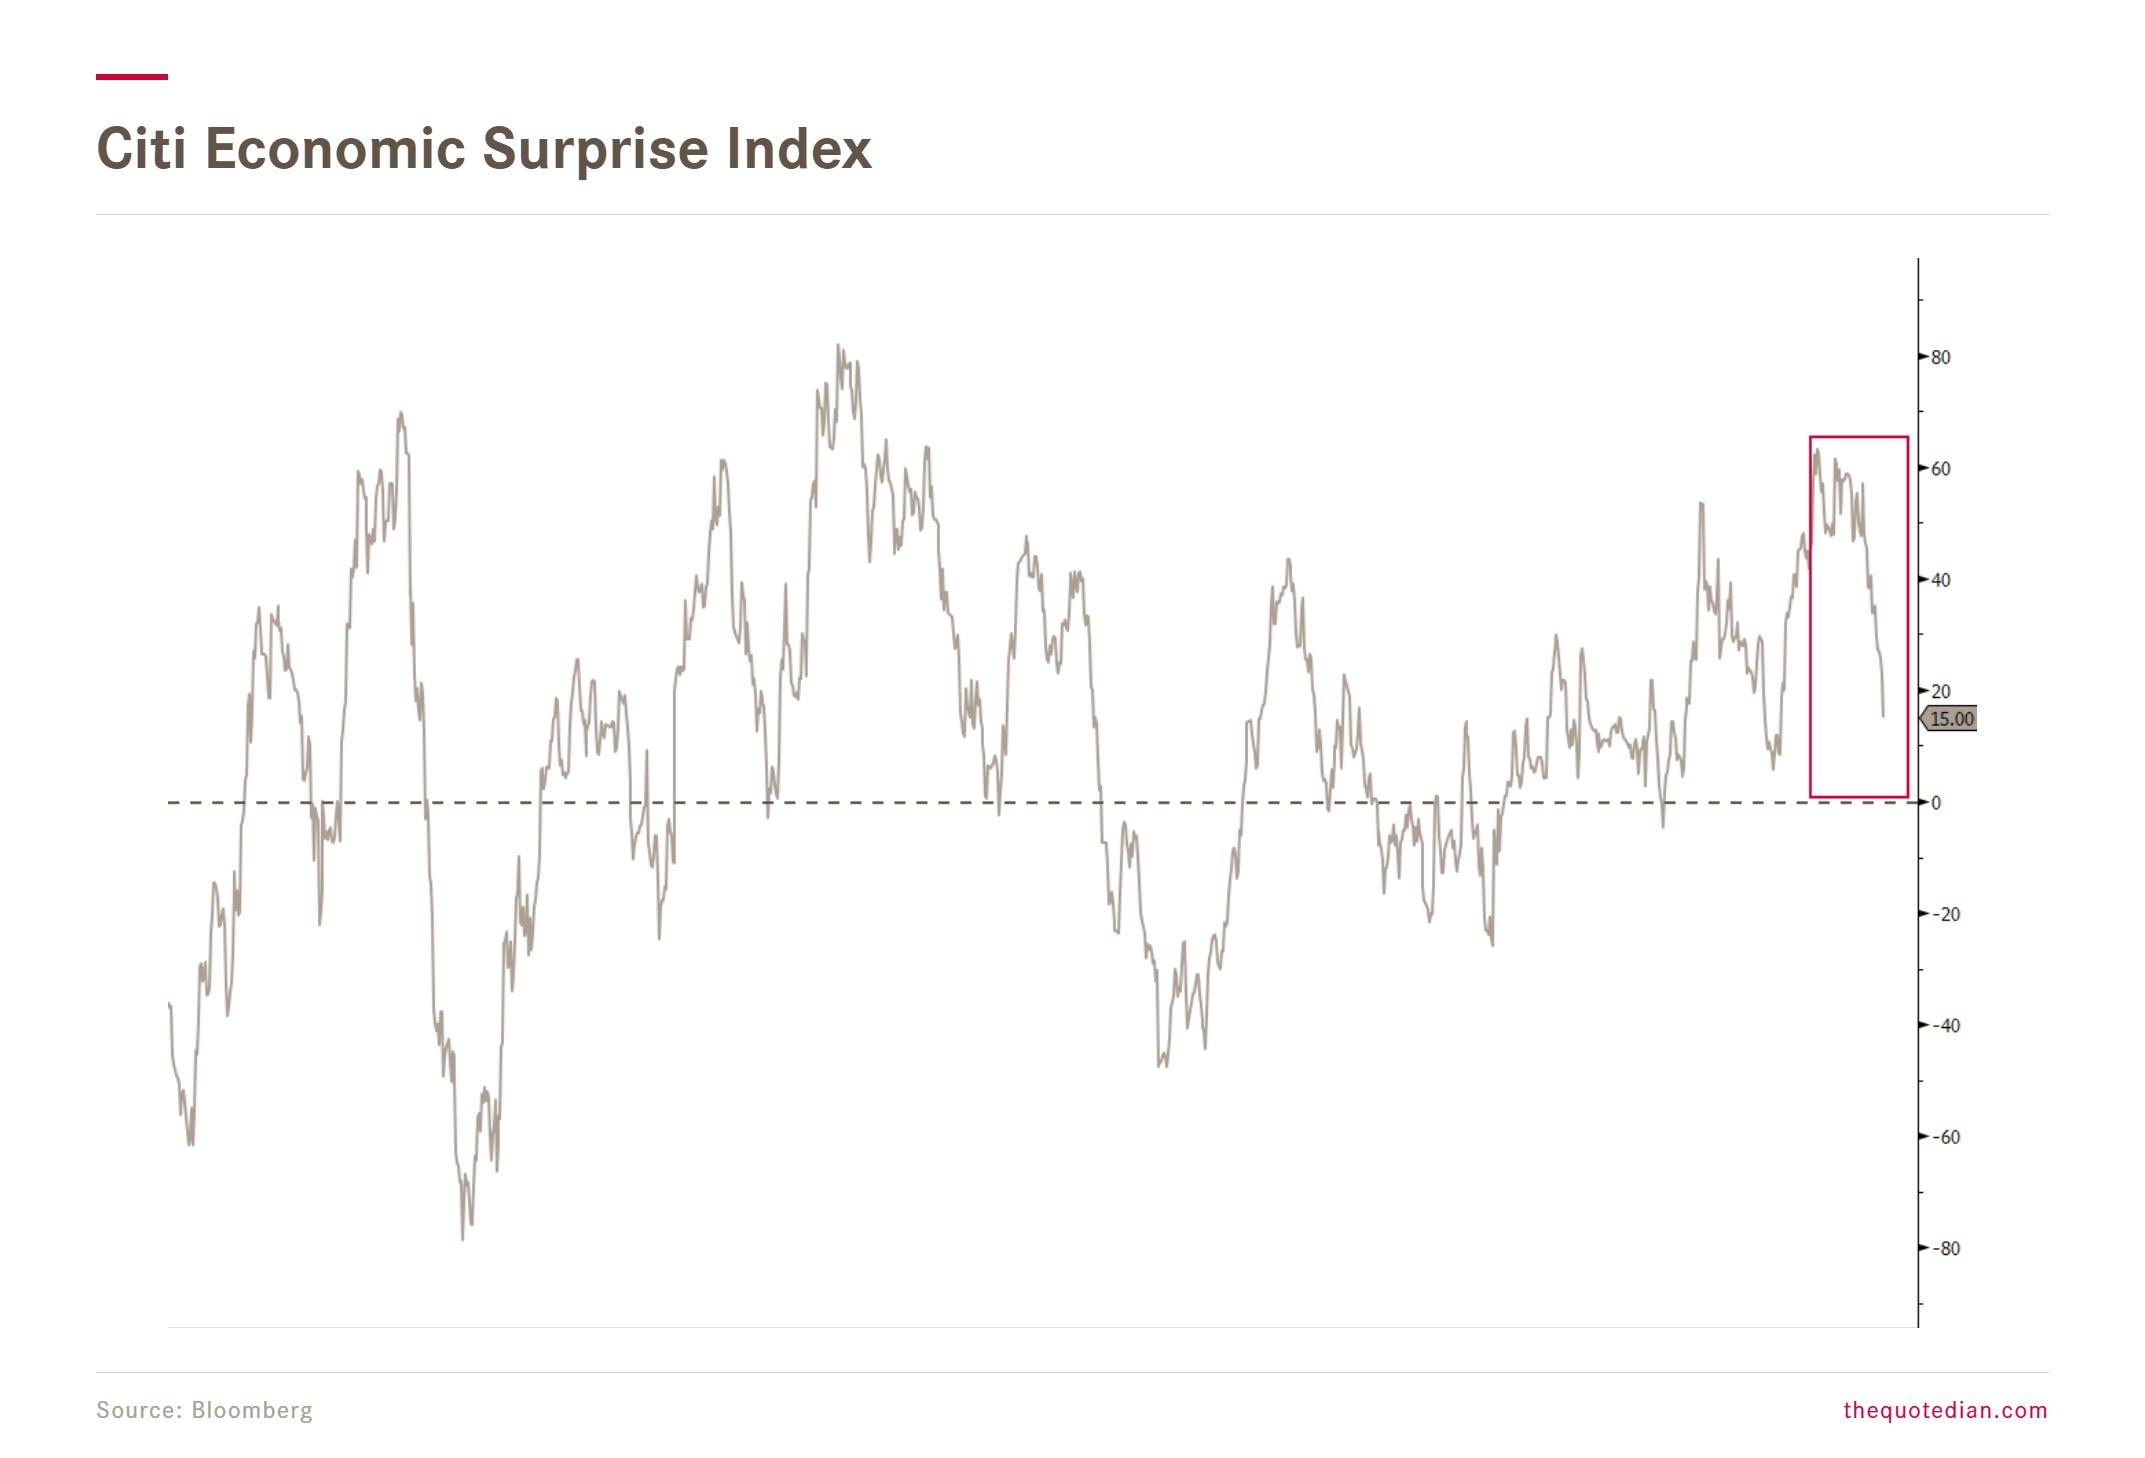
Turning to fixed income, respectively rate markets, last week has all been about (or not) the hopelessly lagging (and manipulated) US inflation numbers in the form of the CPI (Consumer Price Index) and the PPI (Producer Price Index).
On balance, both numbers were at the lower end of expectations and this coupled with an already soft NFP (non-farm payroll) number the week before, has led the Citi Economic Surprise index
AND the Citi Inflation Surprise index
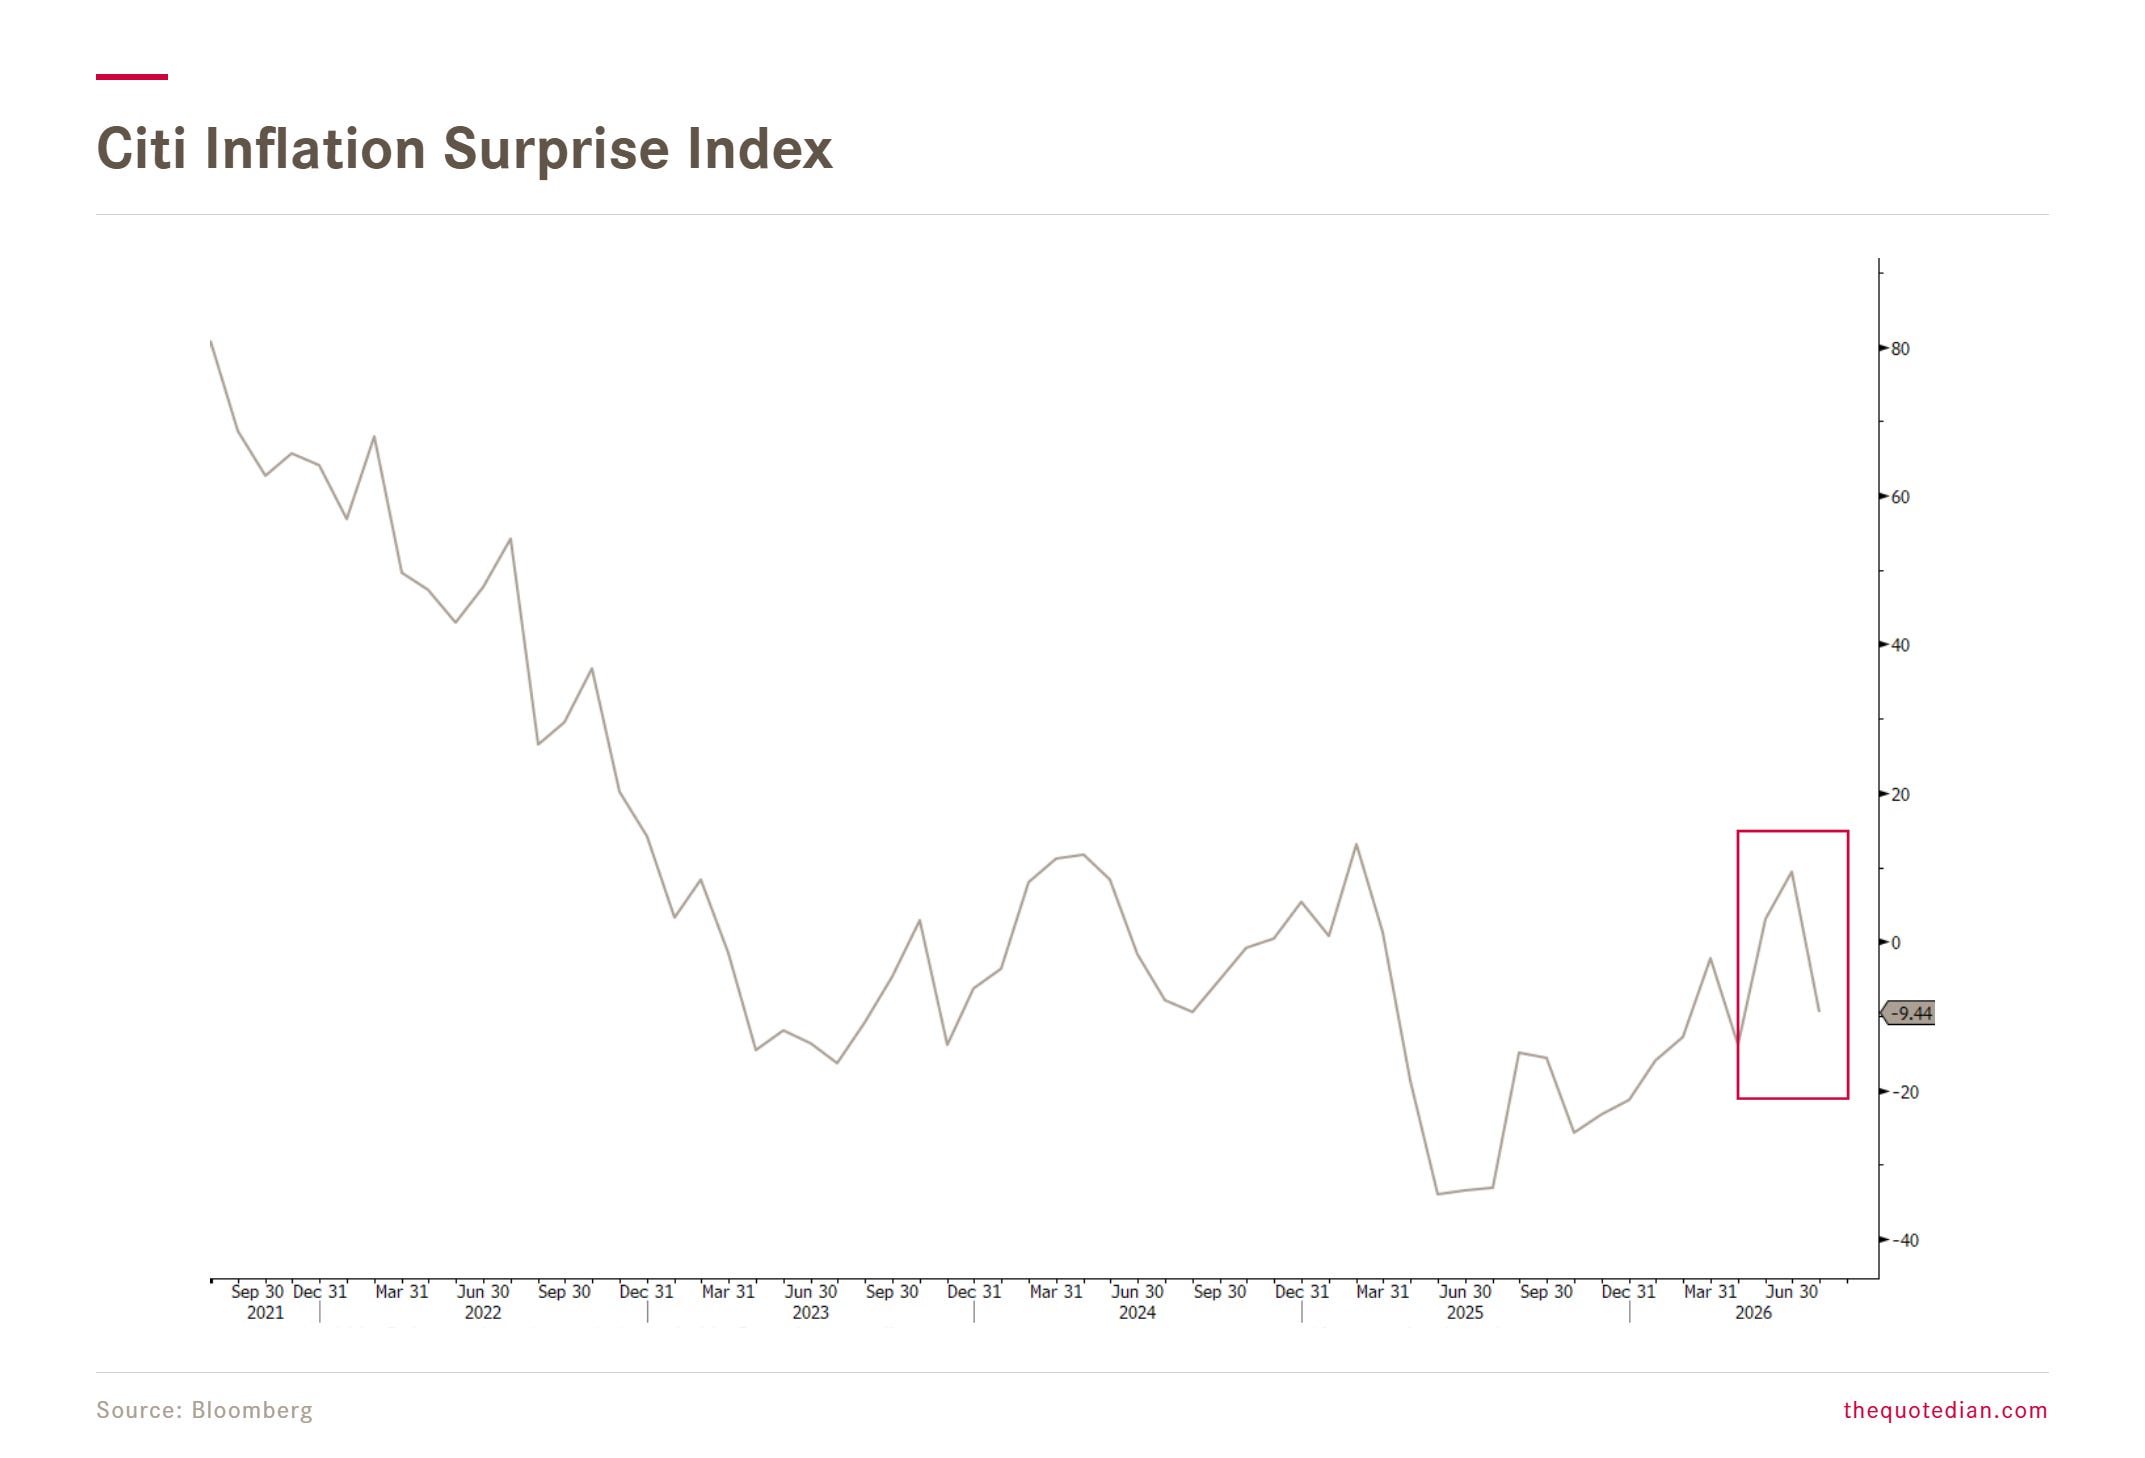
for the US drop quite precipitously.
This has provoked investors/speculators to reduce their bets on the number of rate hikes still to come this year to below one:
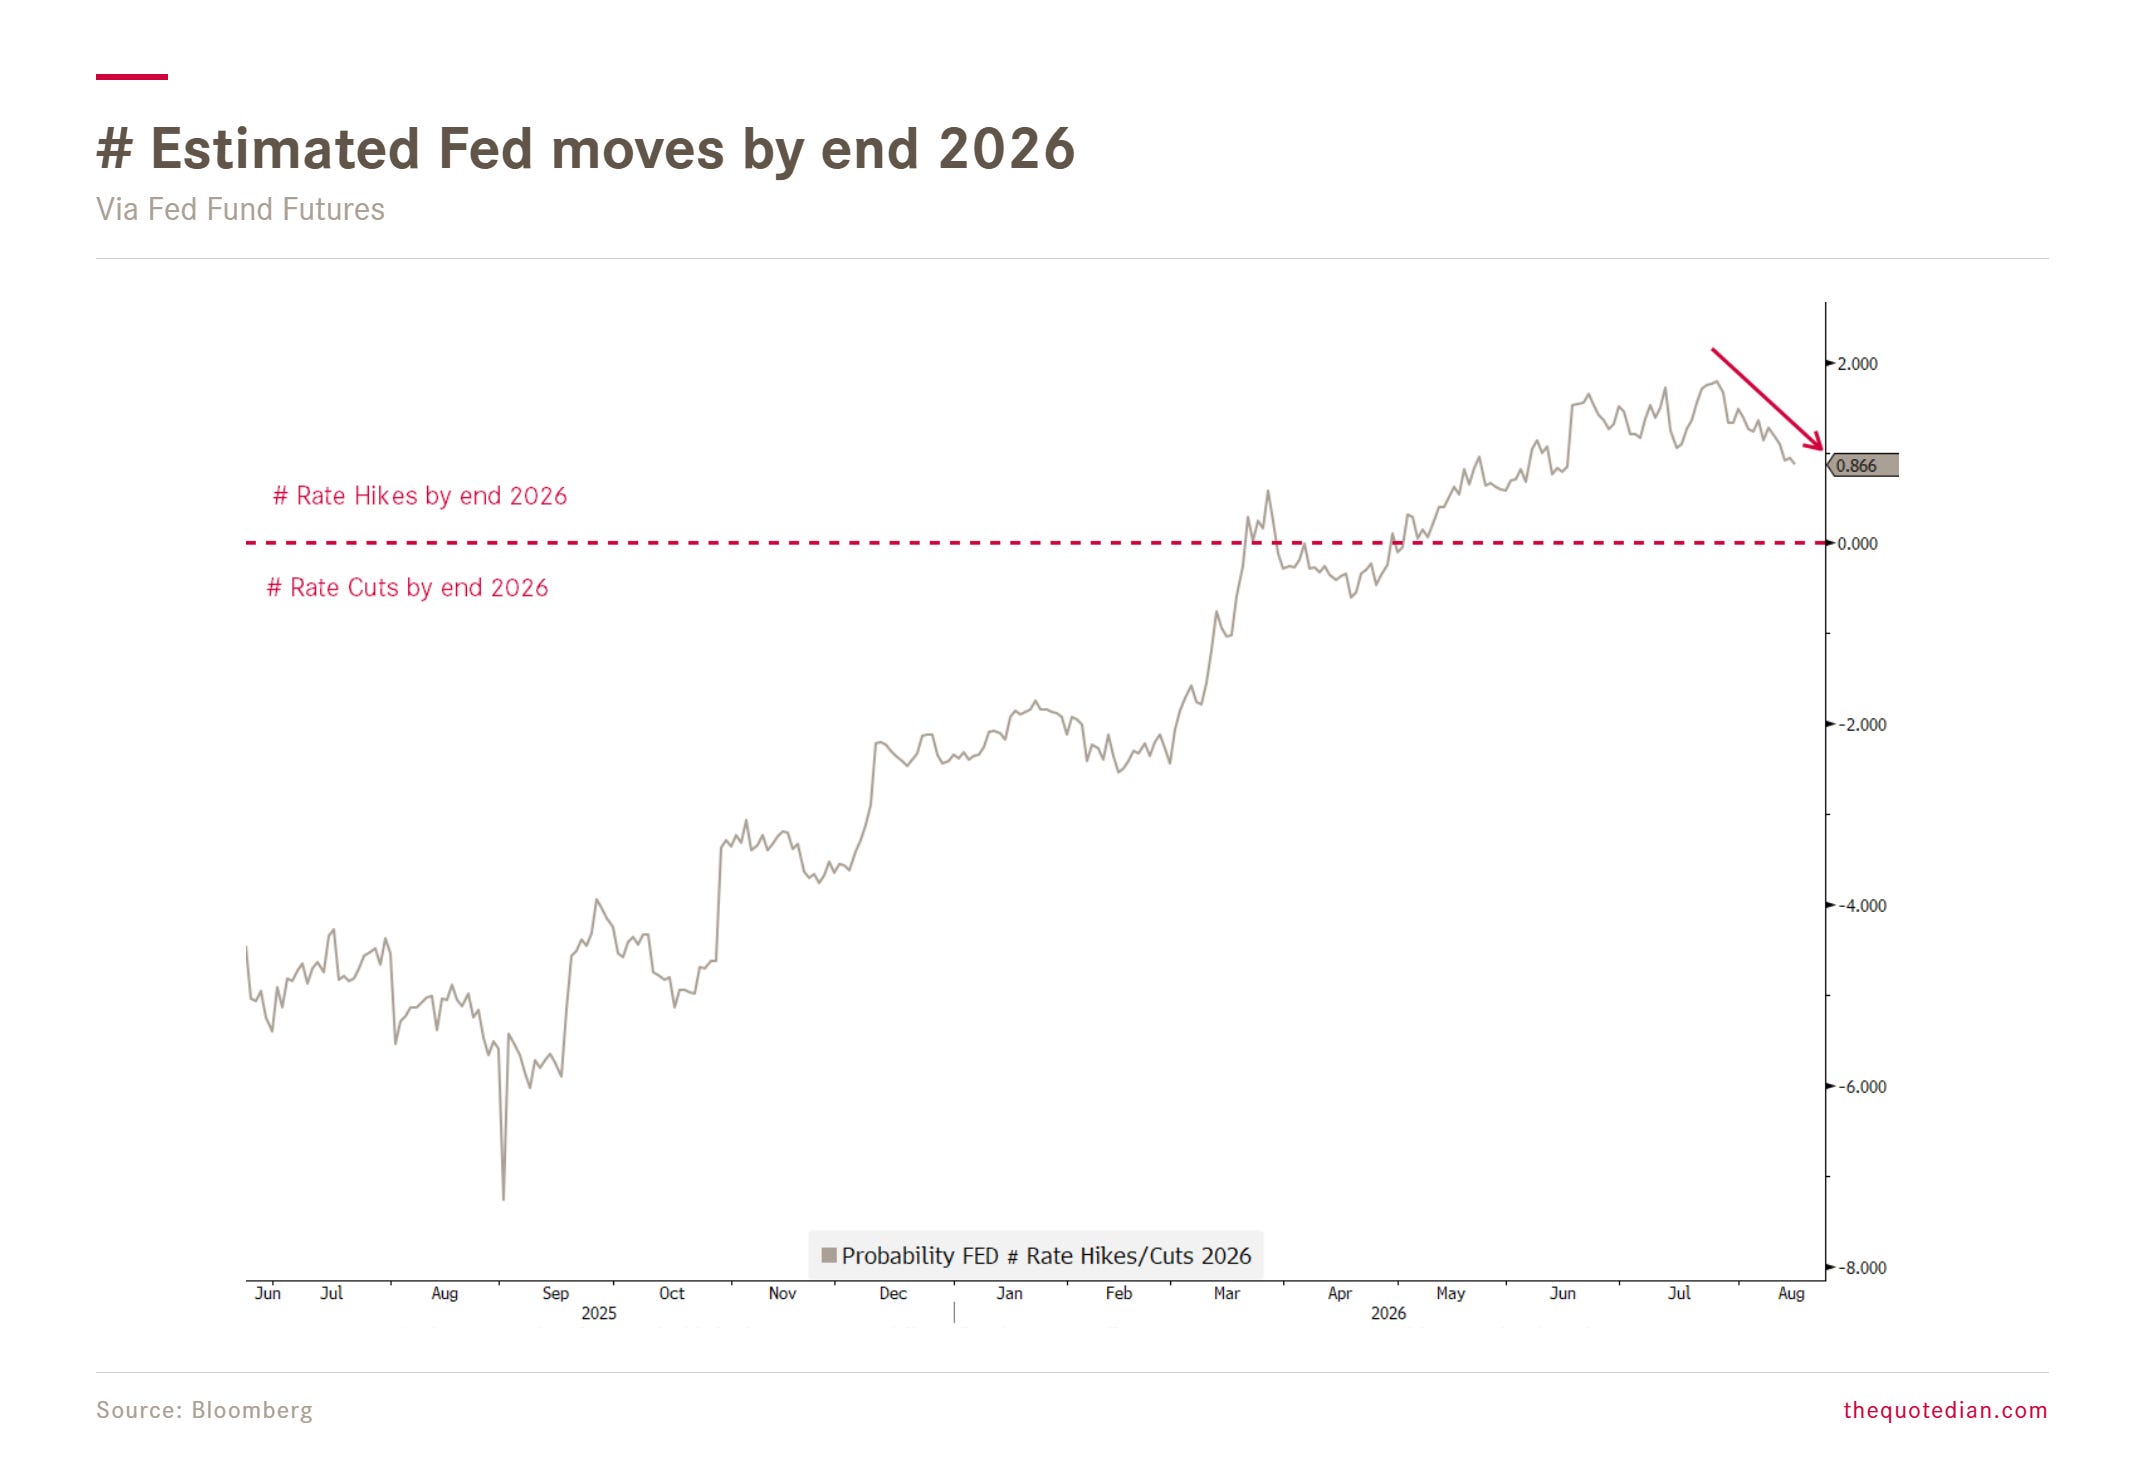
So, we ask the question: is bad news (softer jobs market, less inflation/growth) equal to good news (no hikes) then?
Perhaps.
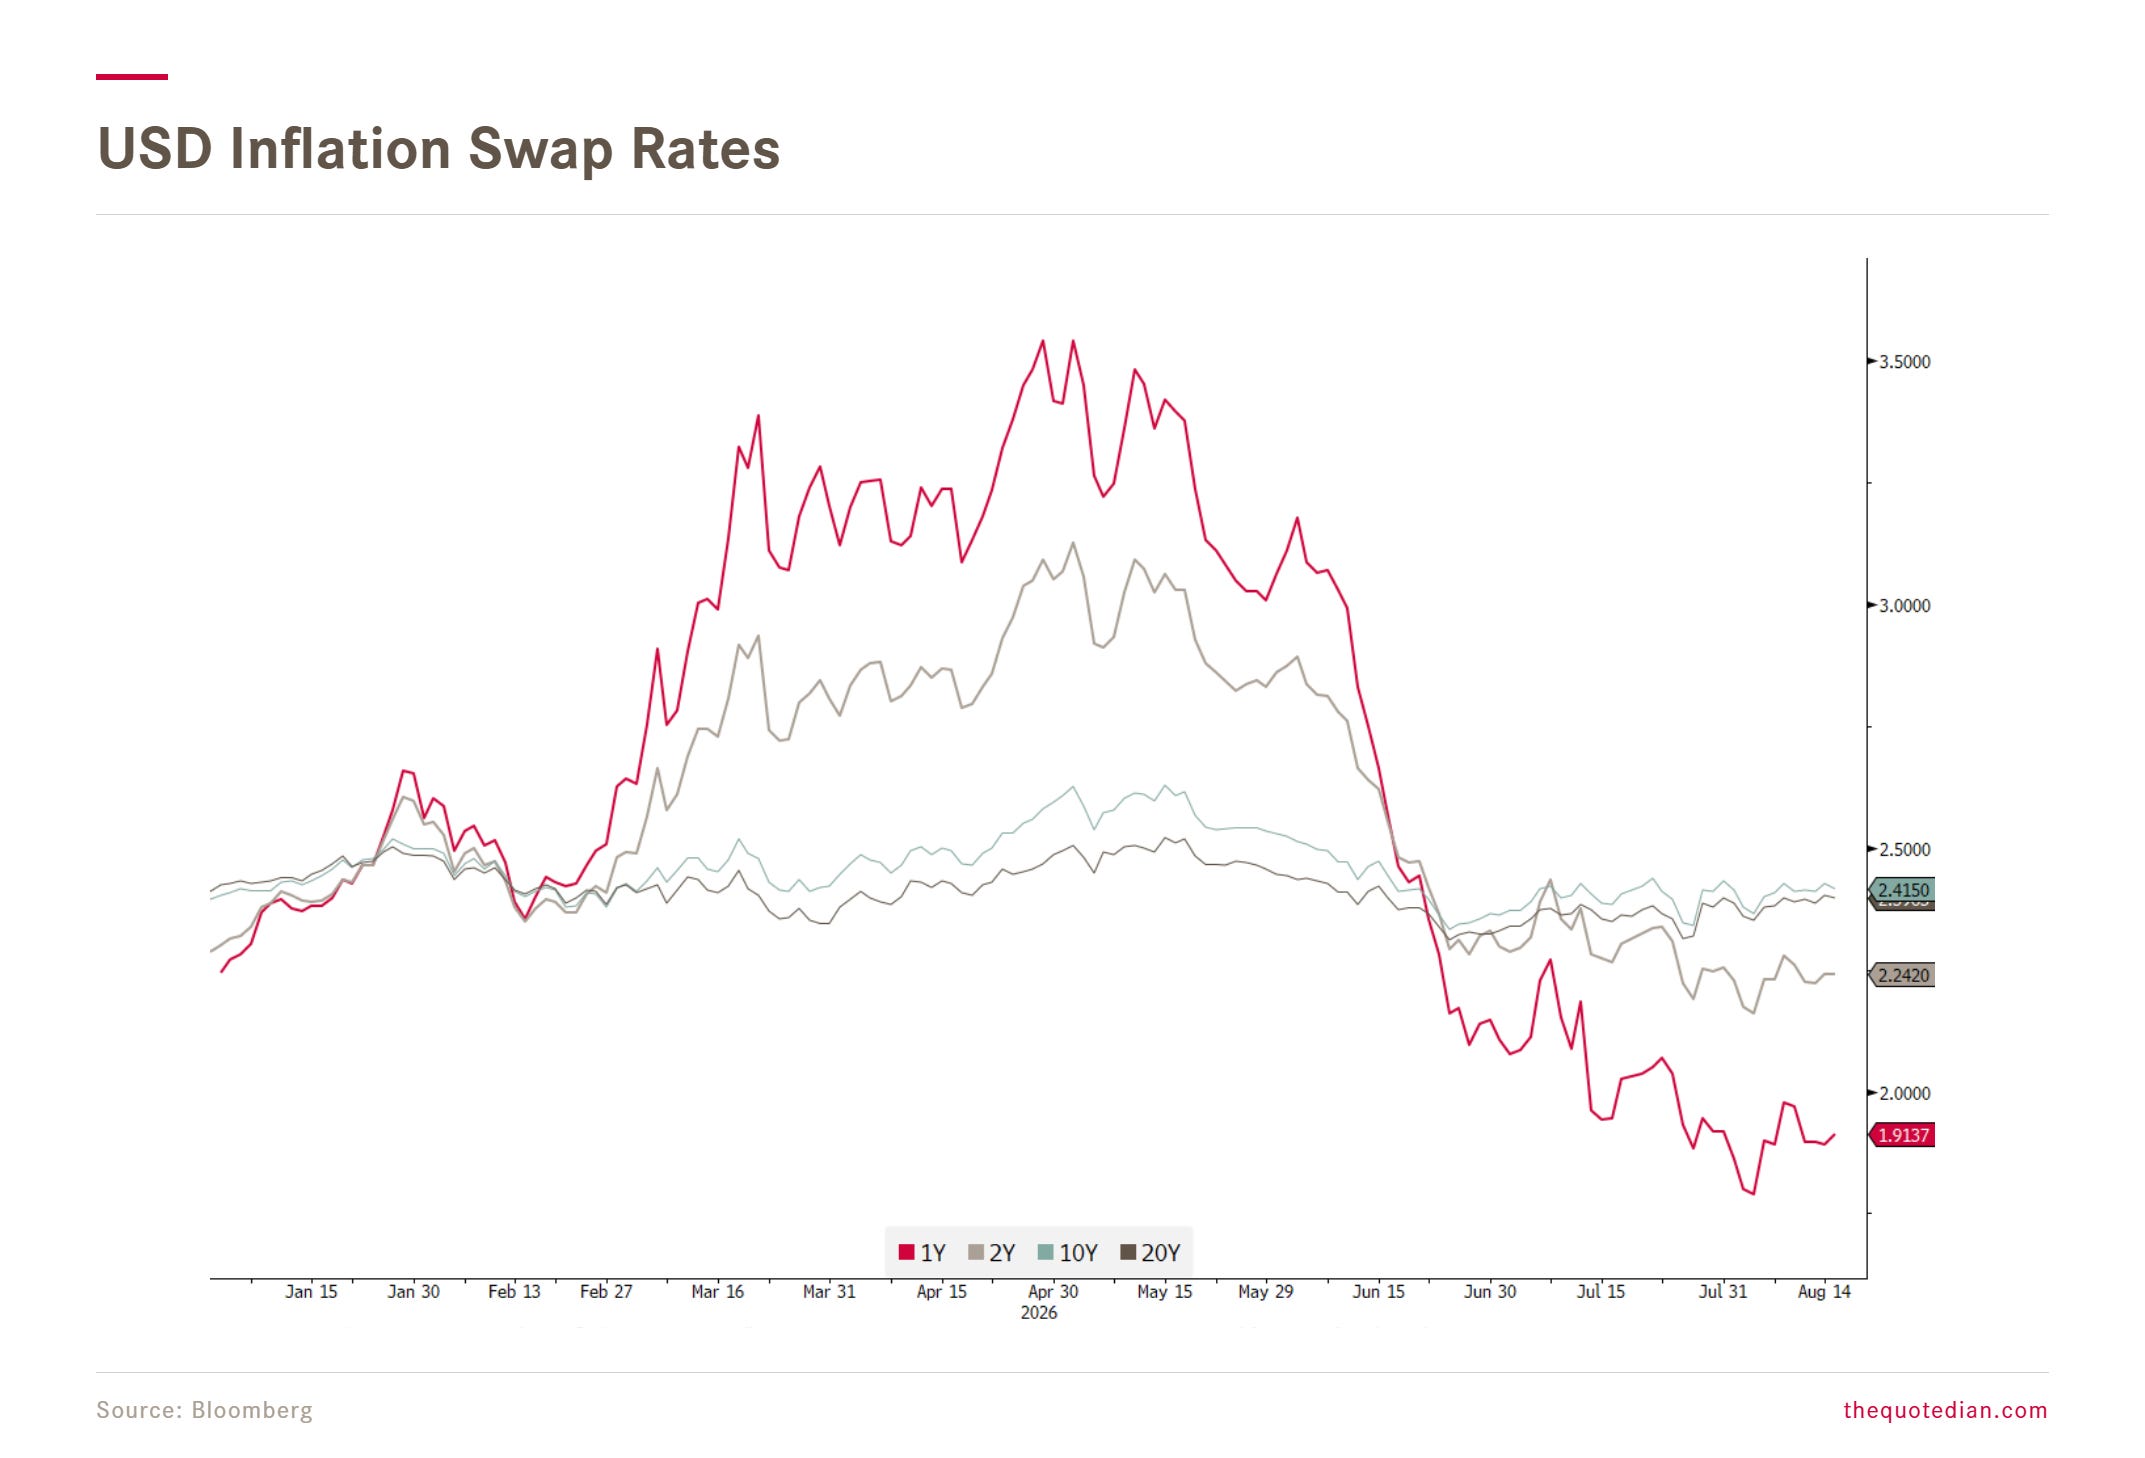
BUT, the market had already anticipated that inflation ‘calming’, with inflation swap rates, especially at the very short end, trading lower for the past few weeks:
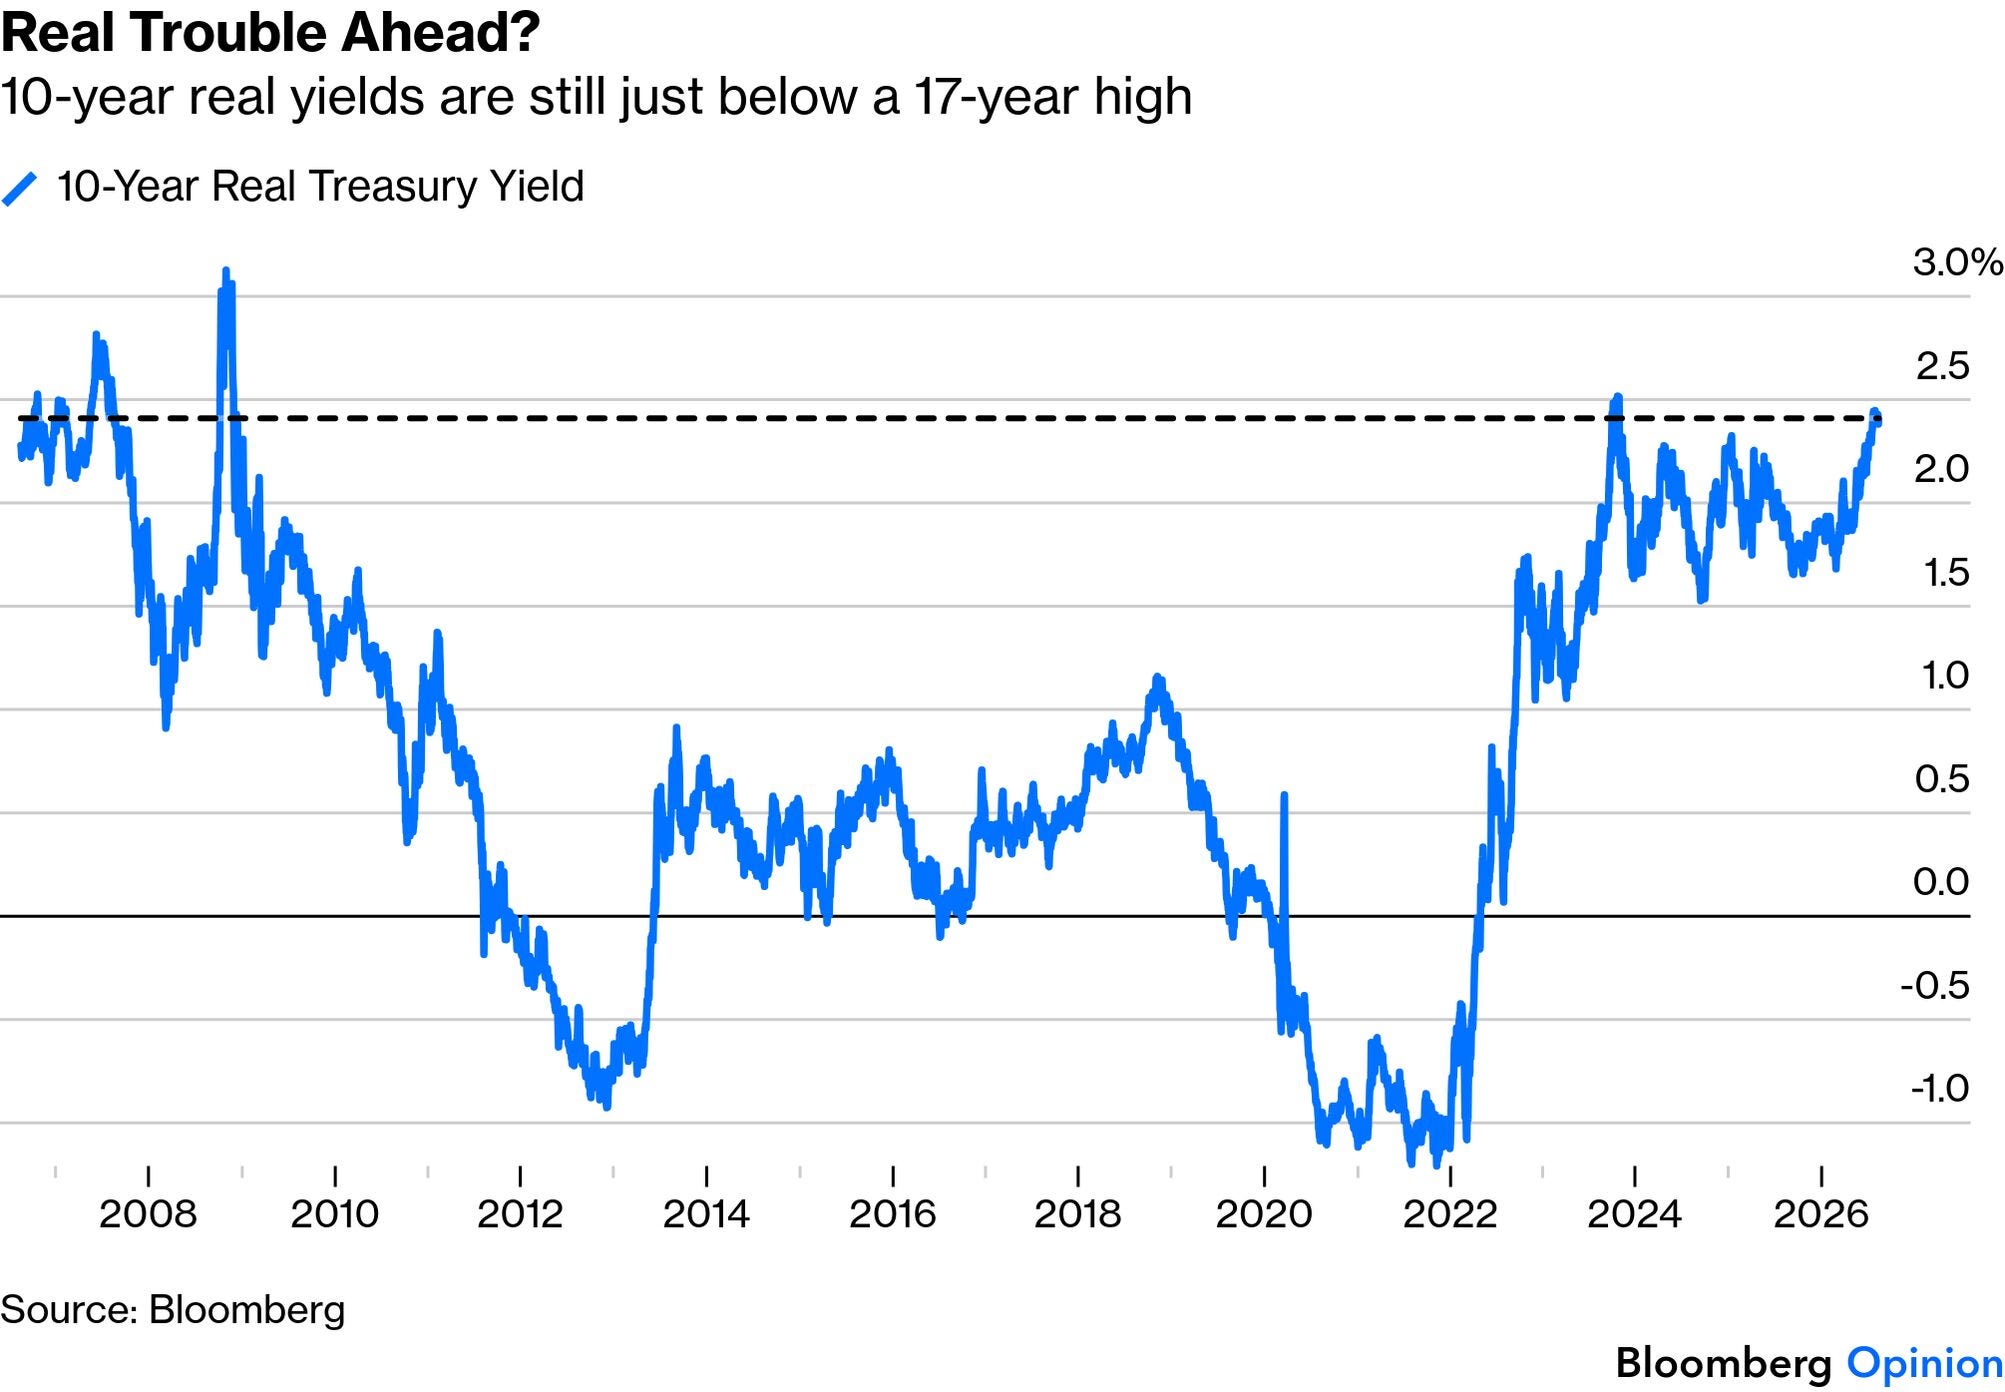
However, nominal yields, mostly failed to head lower on the ‘good’ news out of the inflation camp. Here’s the US 10-year Treasury Yield:
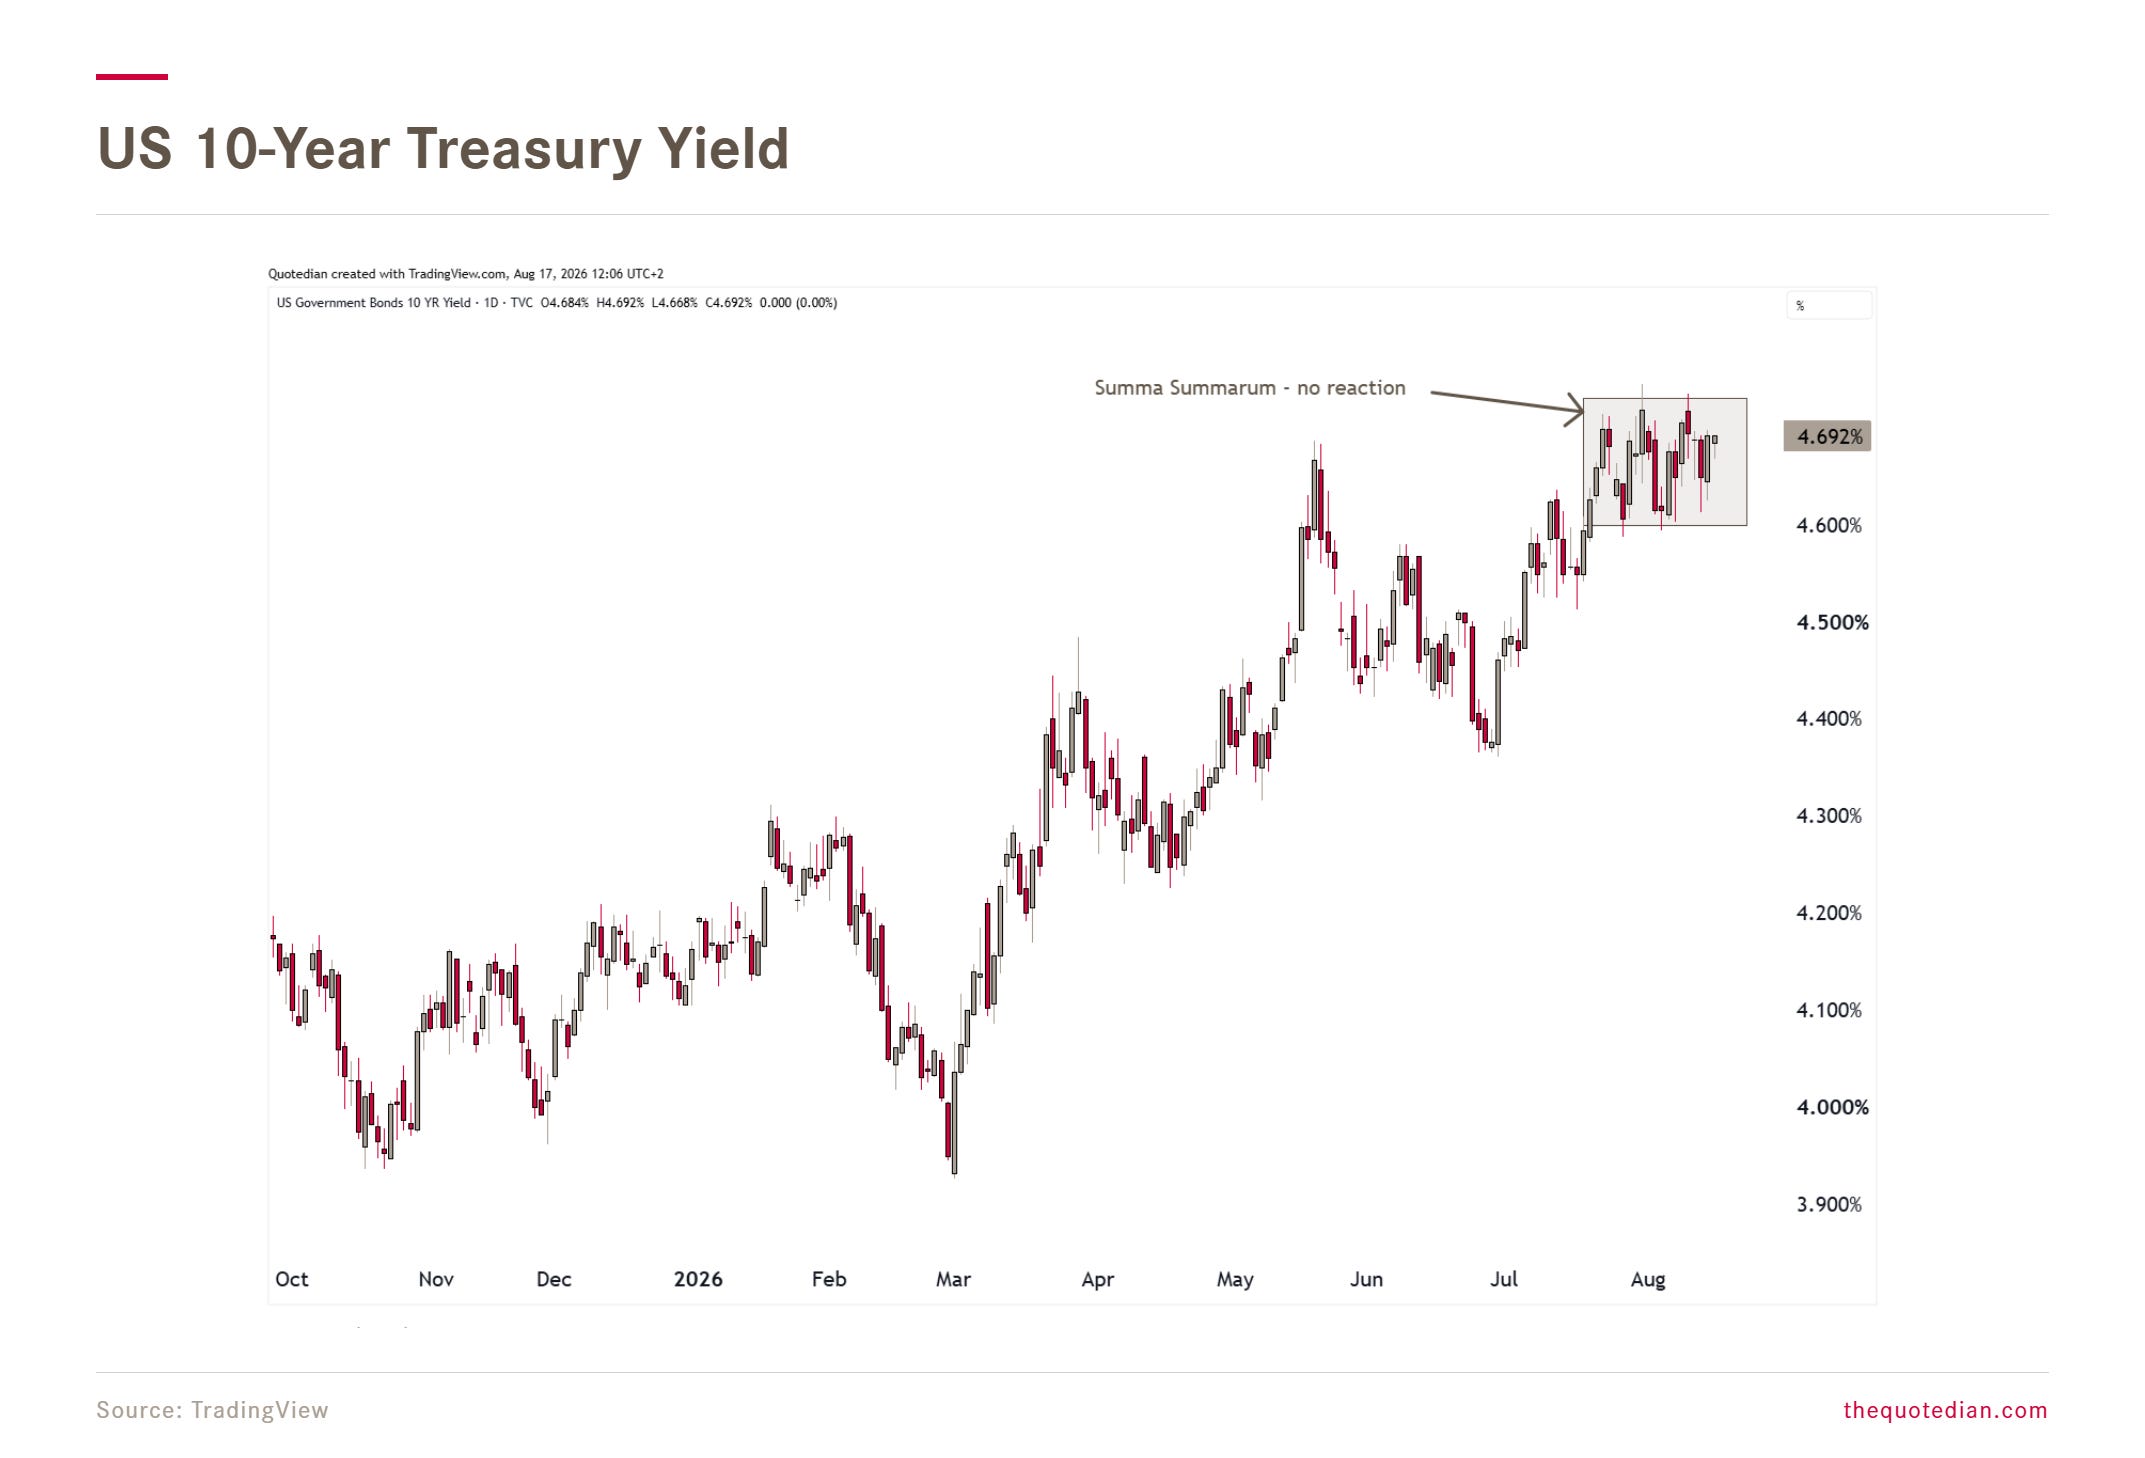
Has the bond vigilantes’ focus then maybe shifted from inflation to debt?
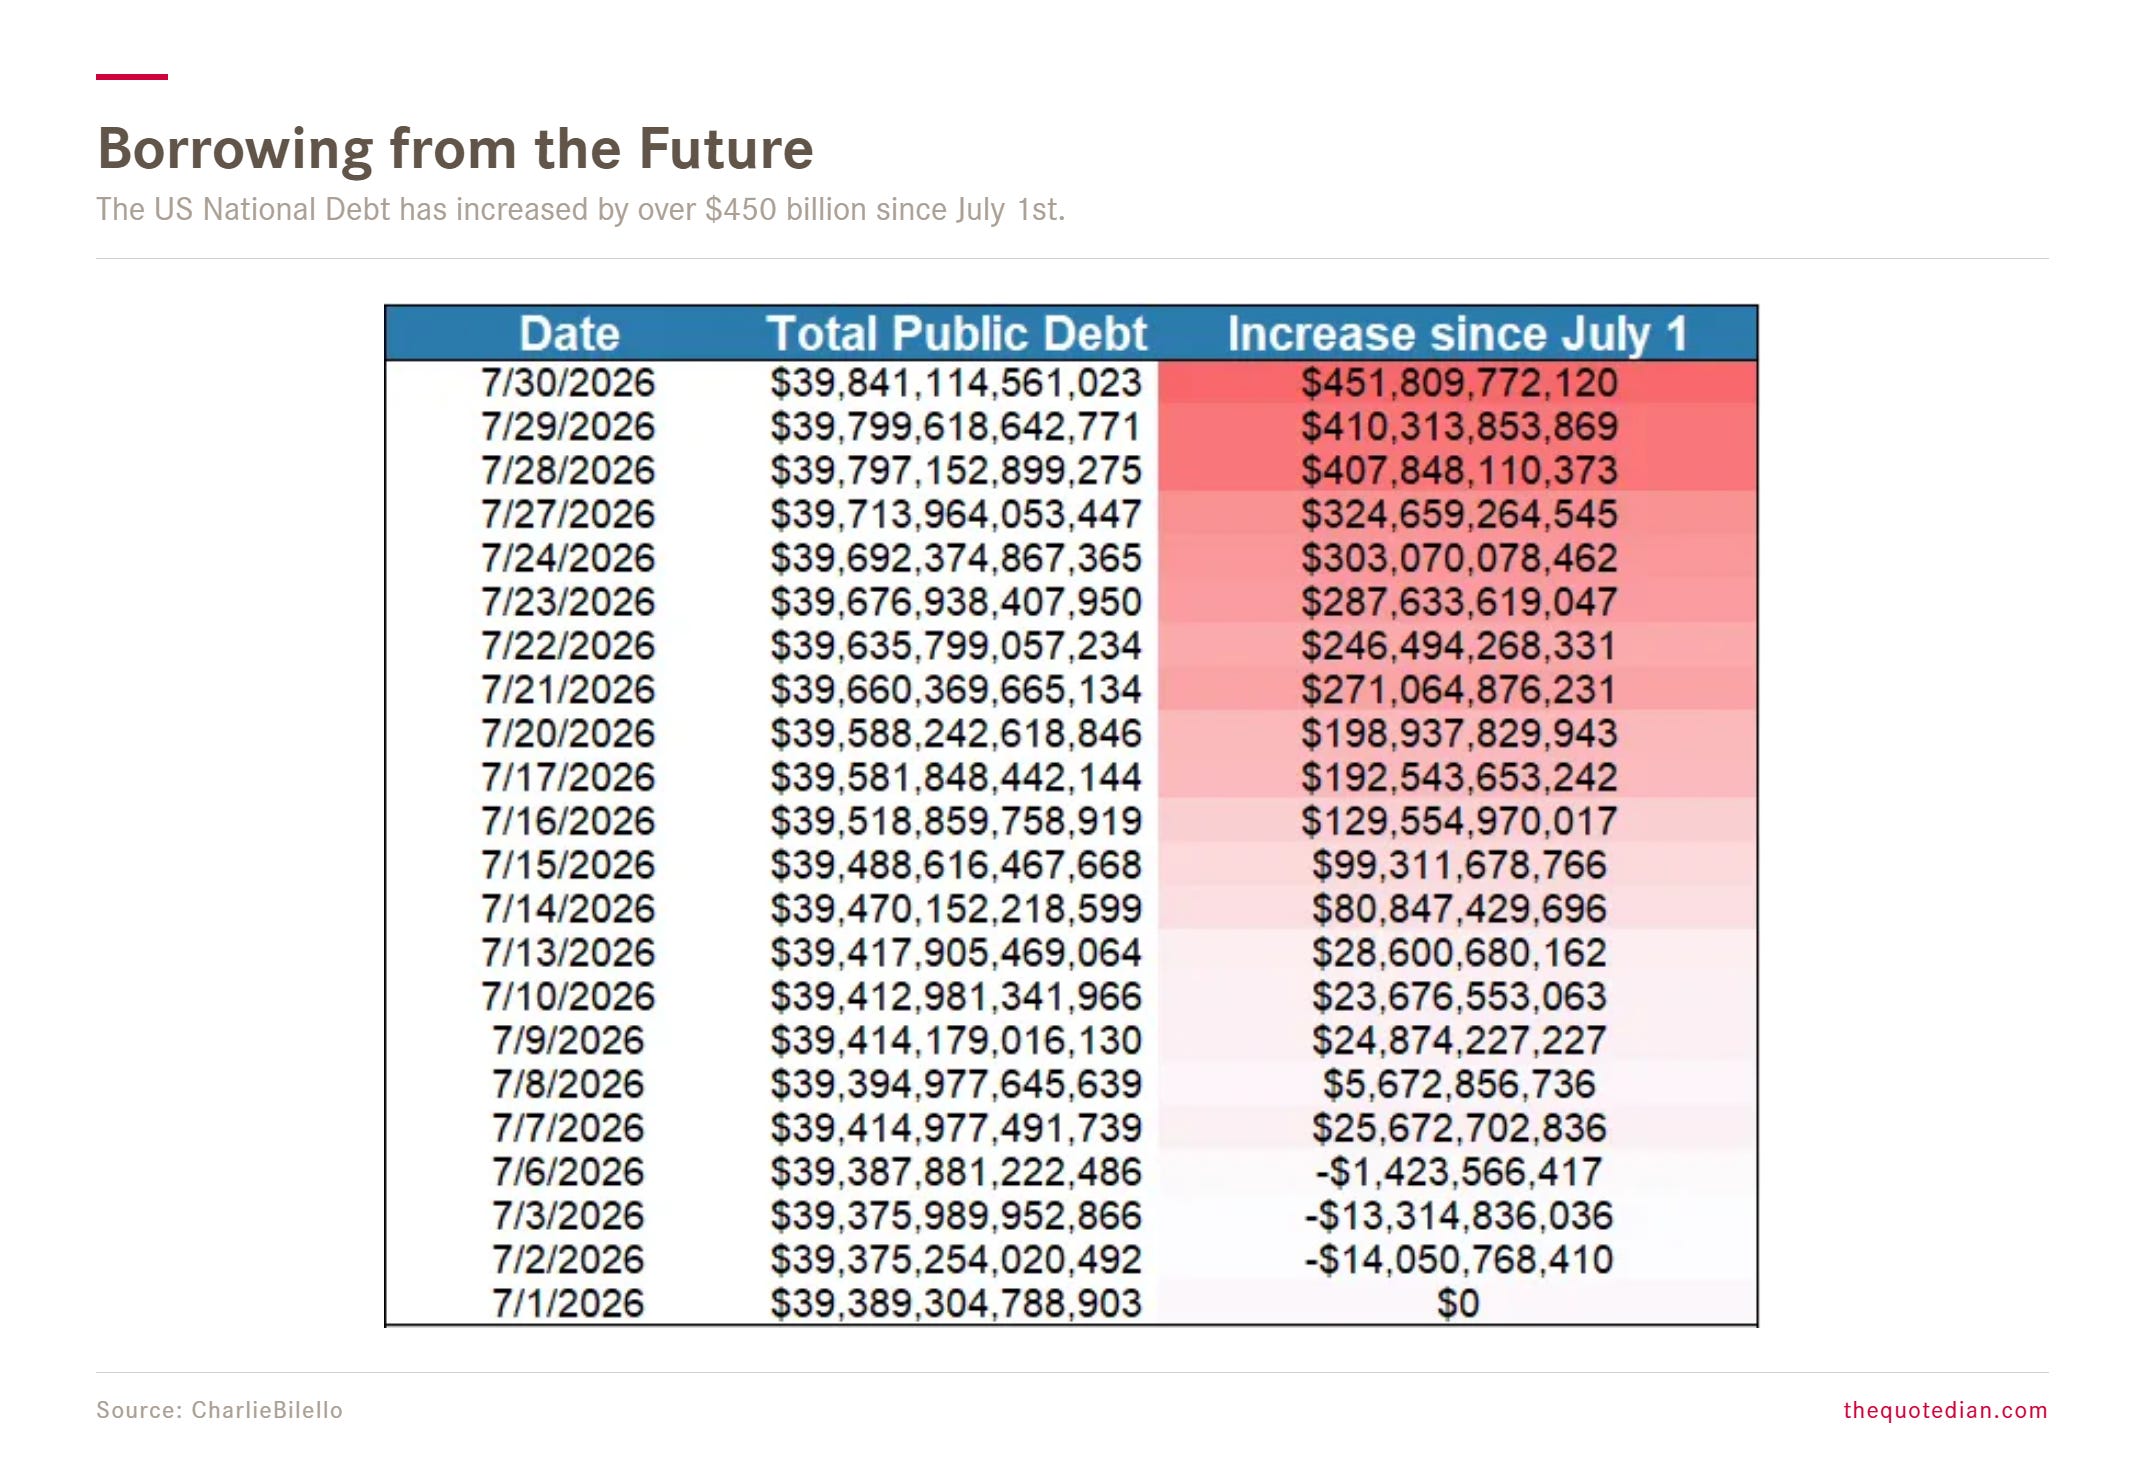
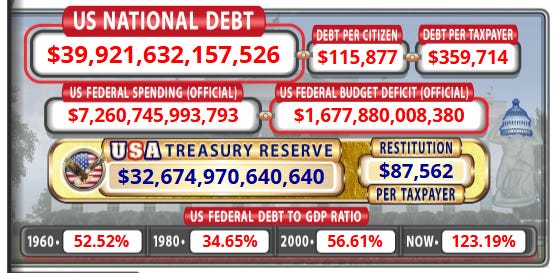
Likely, as the national debt has now increased $3.7 trillion in 13 months, fast approaching $40 trillion:
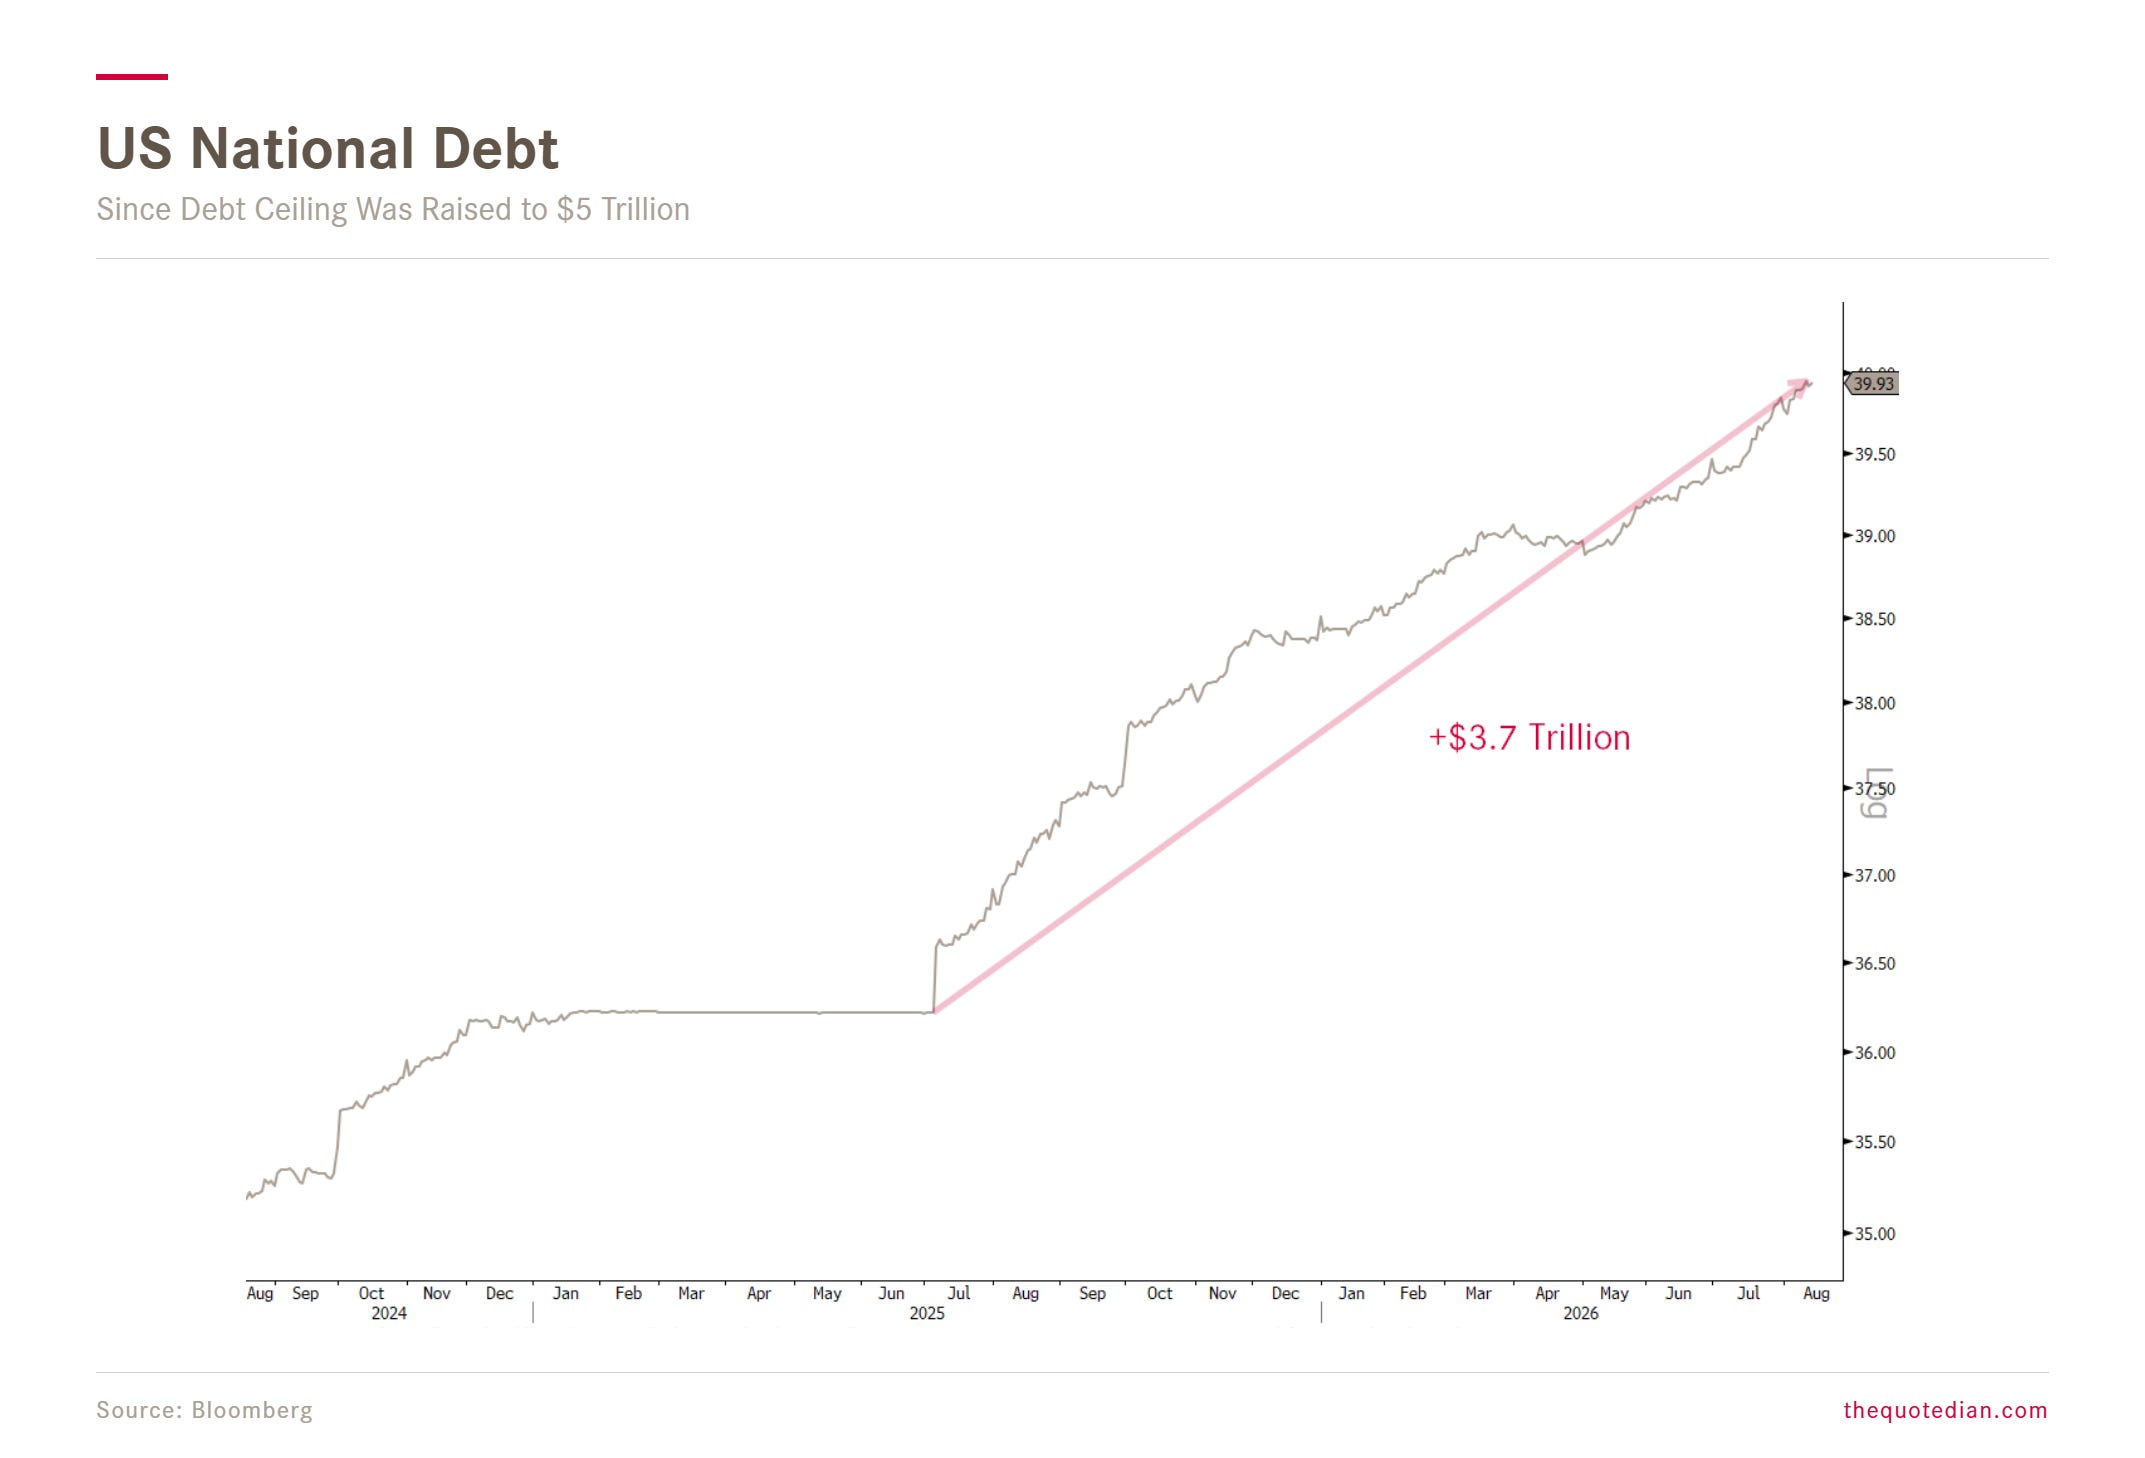
Just like last week we were able to watch the Sun’s total eclipse ‘live’, we can probably witness the US National Debt hitting the $40 Trillion level today or tomorrow ‘live’ too (click here):
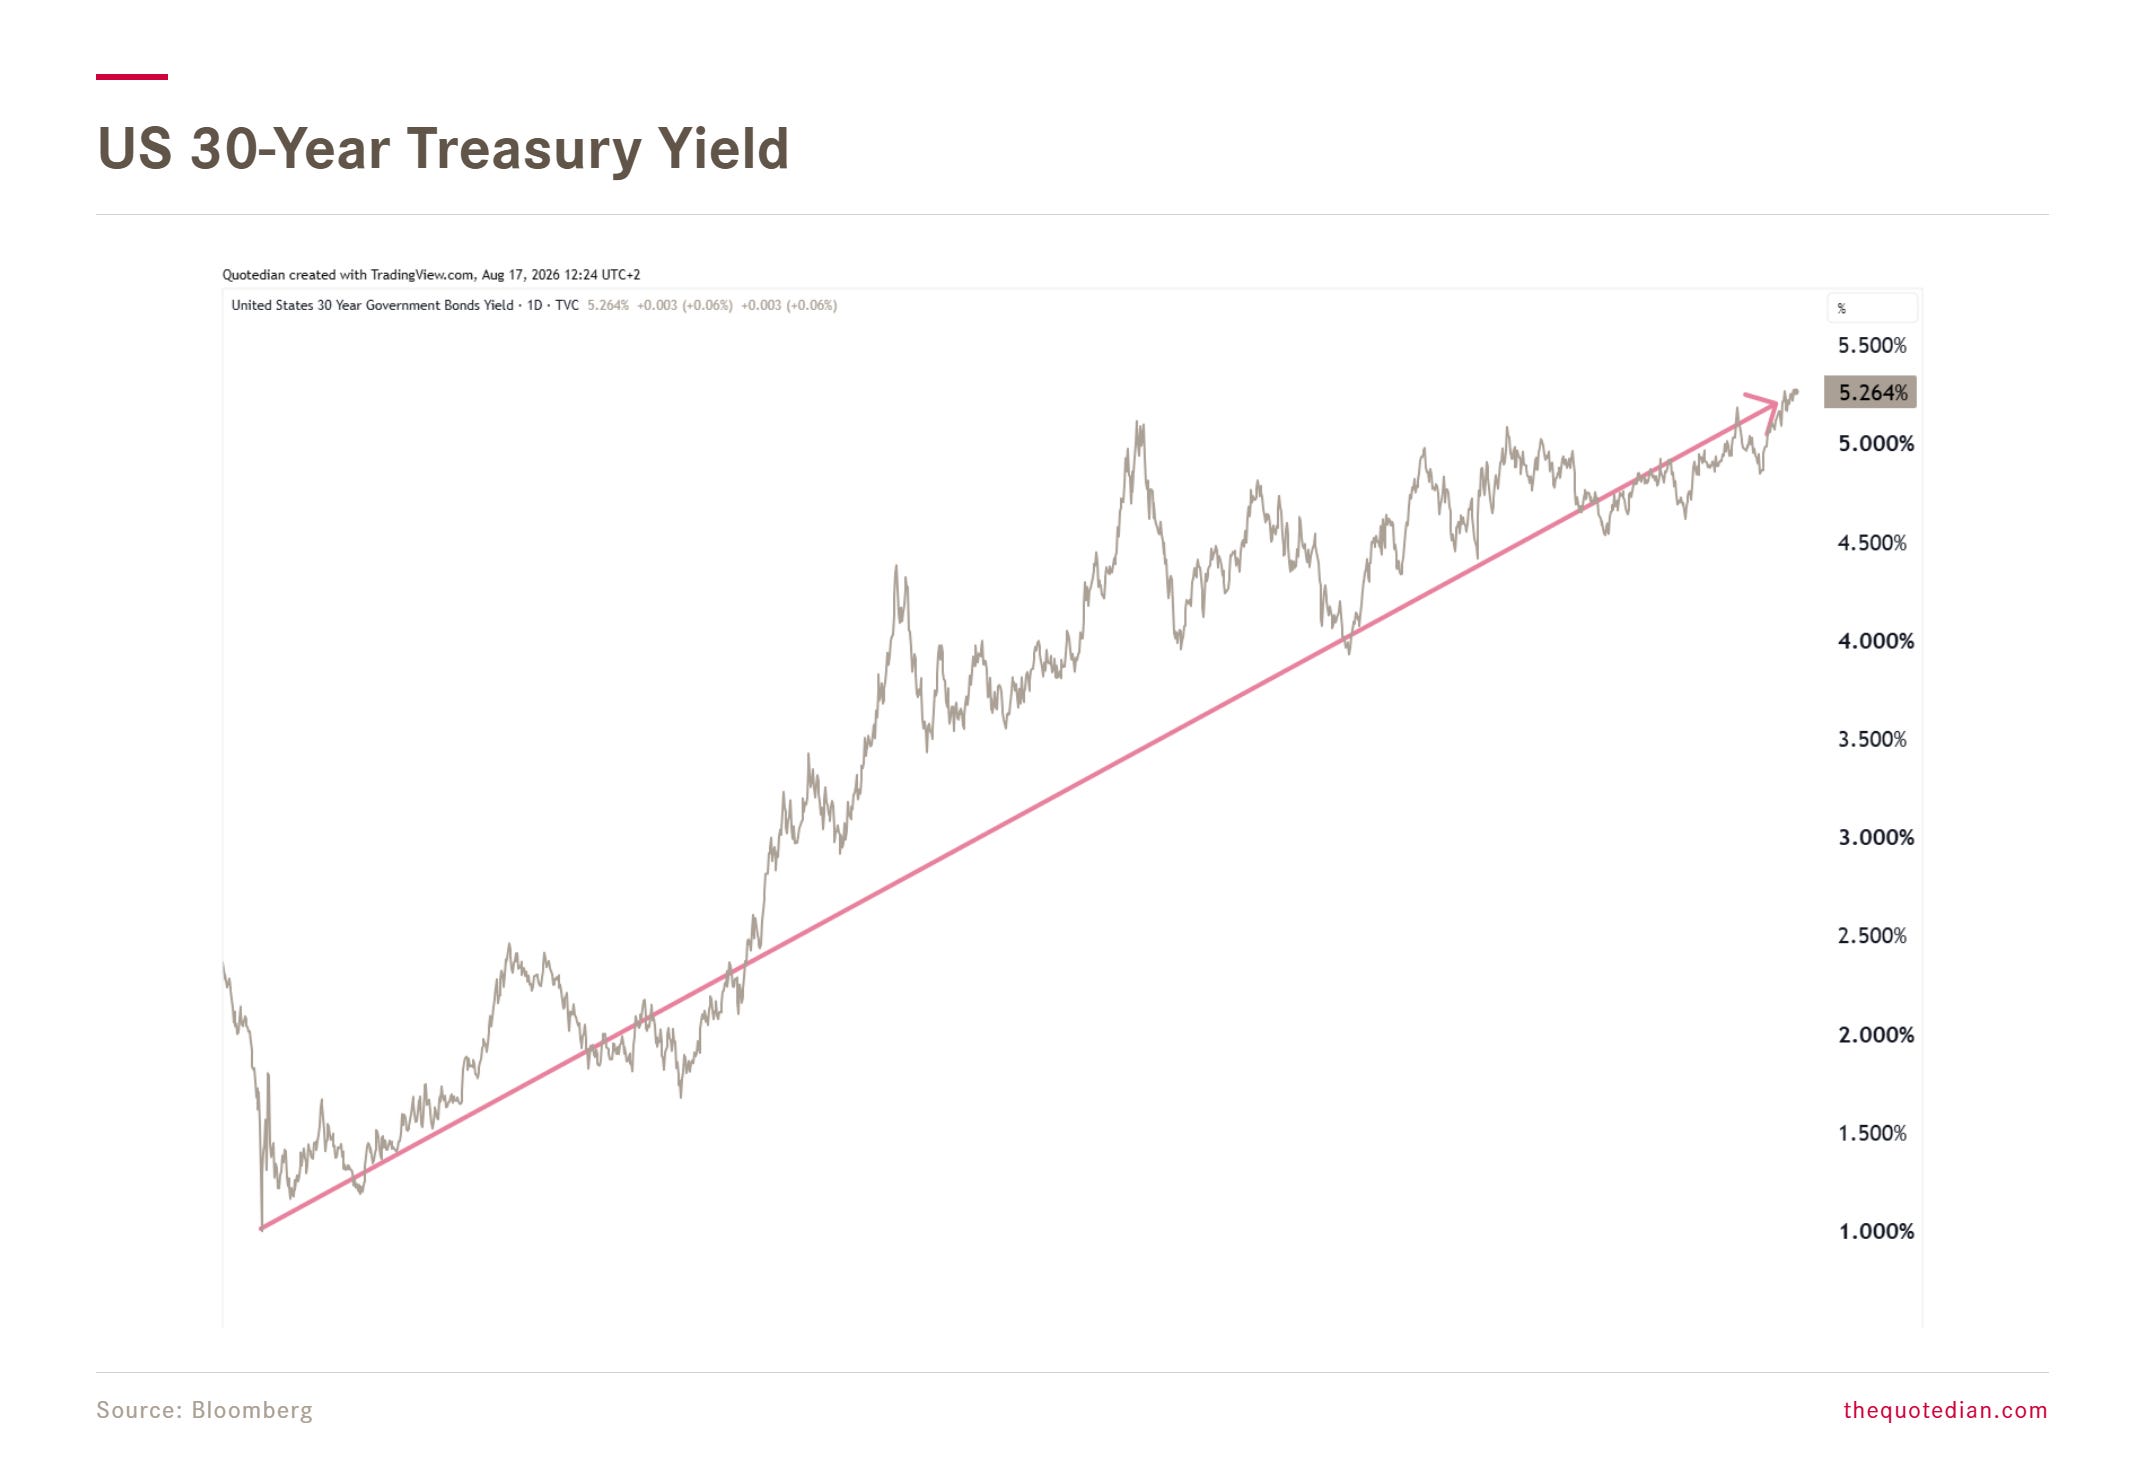
The Long-Bond (30 years), which saw its yield hover around the 1% level at the beginning of the decade is now at 5.26 and pushing higher:
Maybe there will be some short-term relief (yields sell-off, bond price rally) from the extreme position out of the speculators camp, where both, large (hedge funds) and small (retail investors) speculators are still vastly underweight bonds:
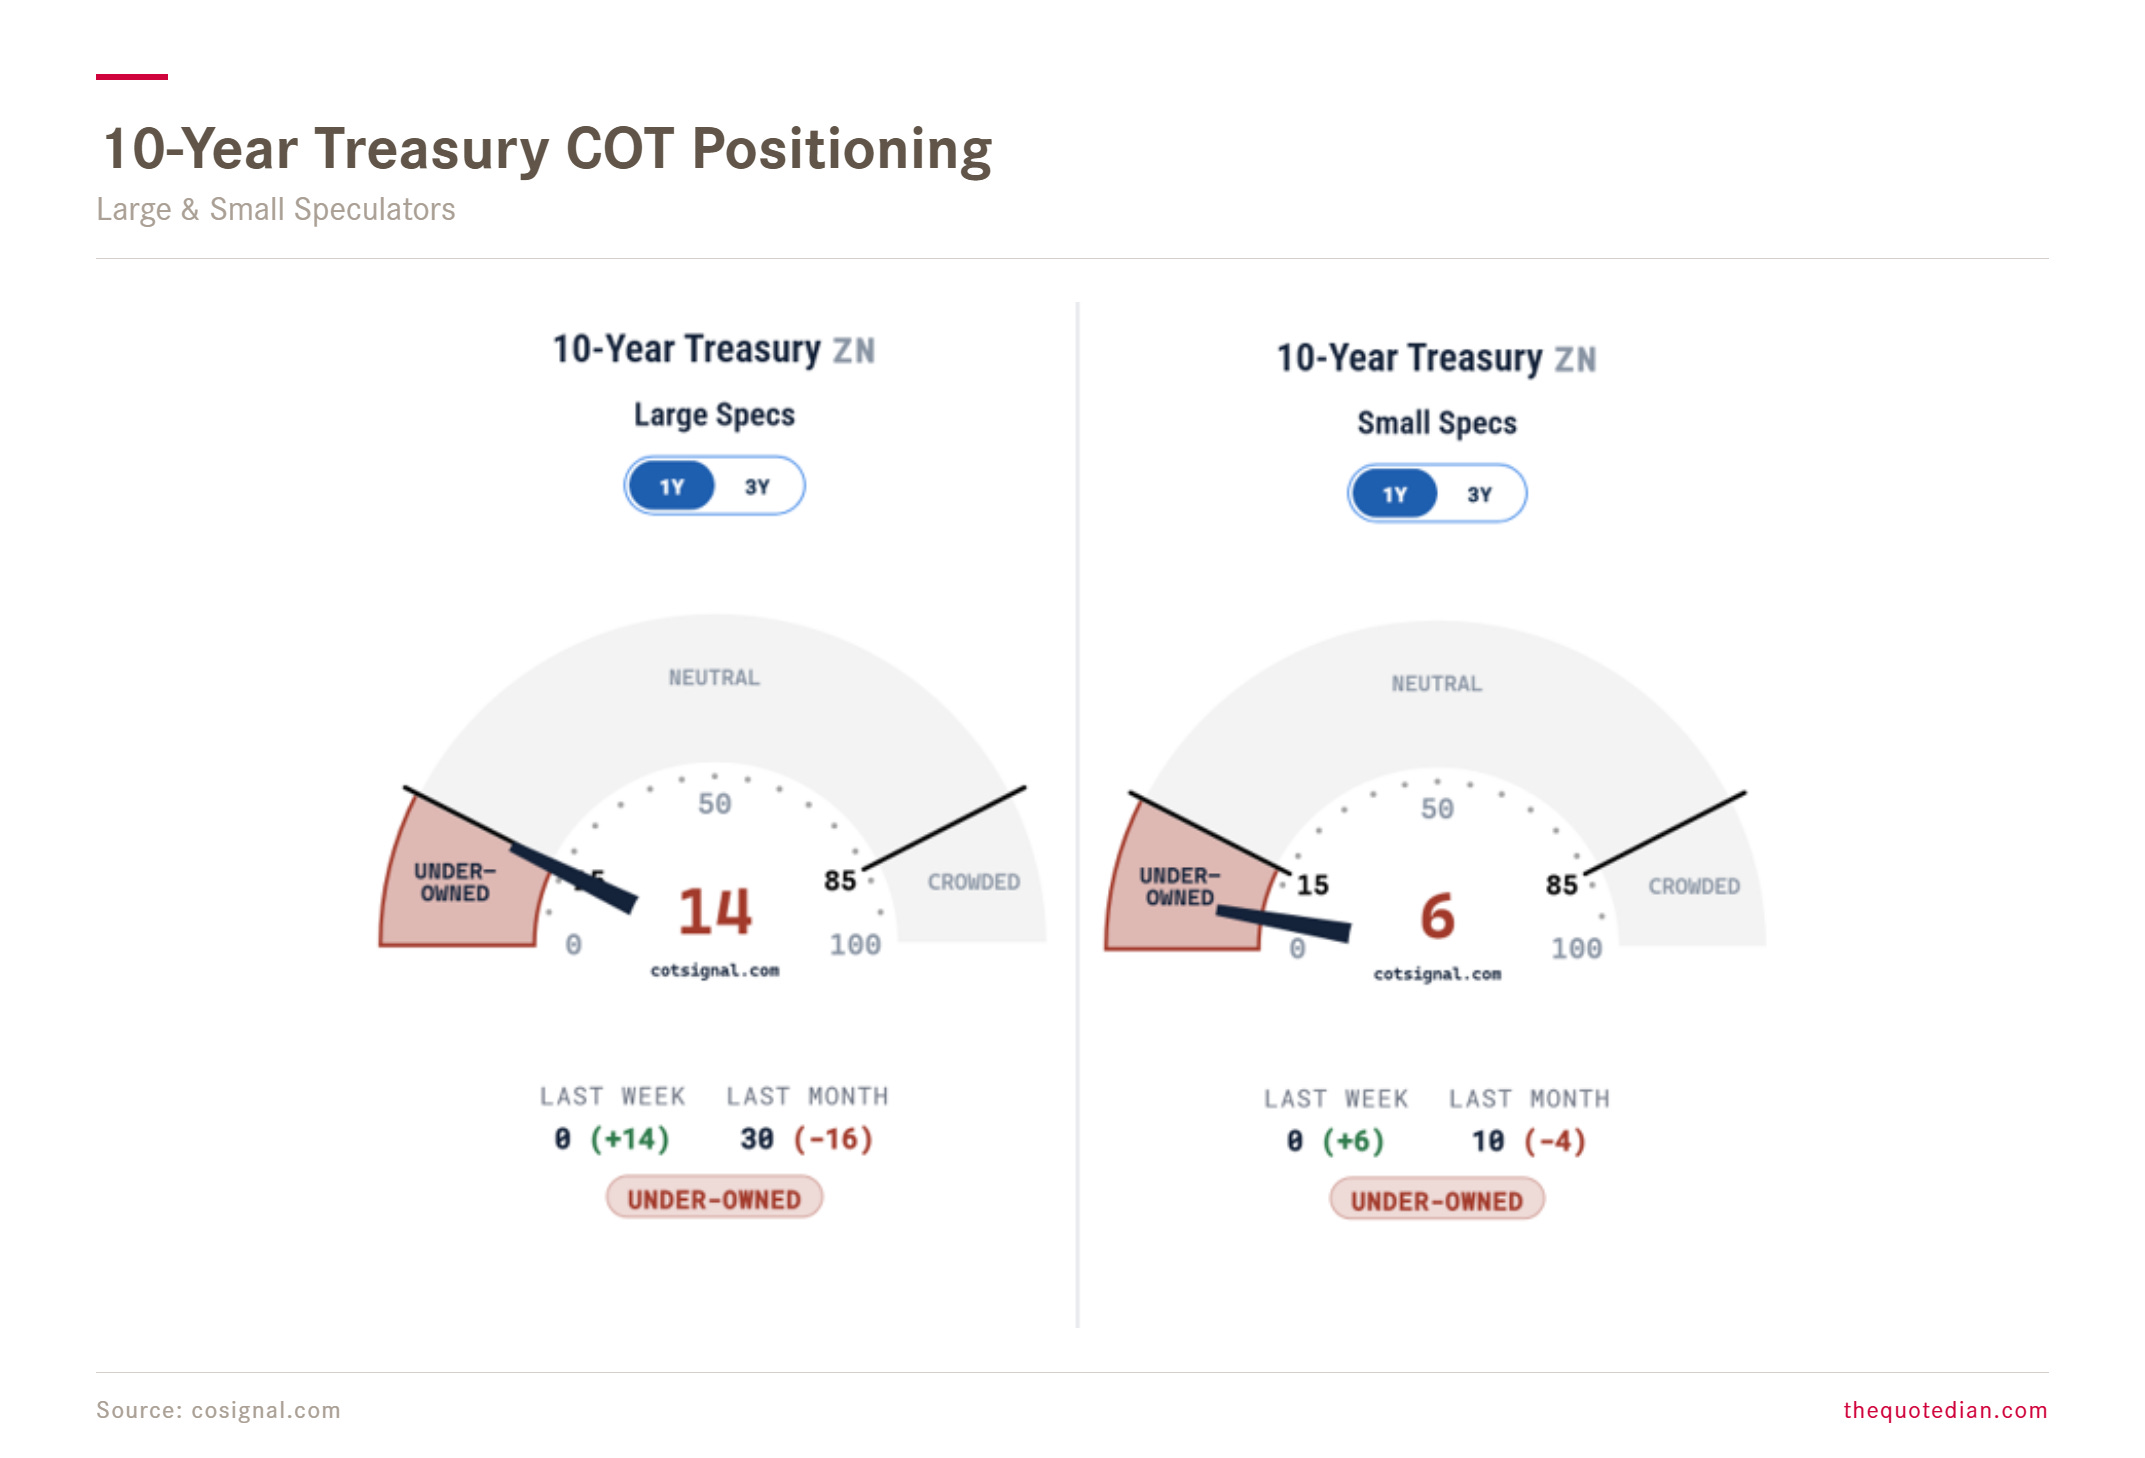
But then again, this would likely only be a short-term rally (weeks to months) and an opportunity to reduce a bit further on long duration fixed income exposure.
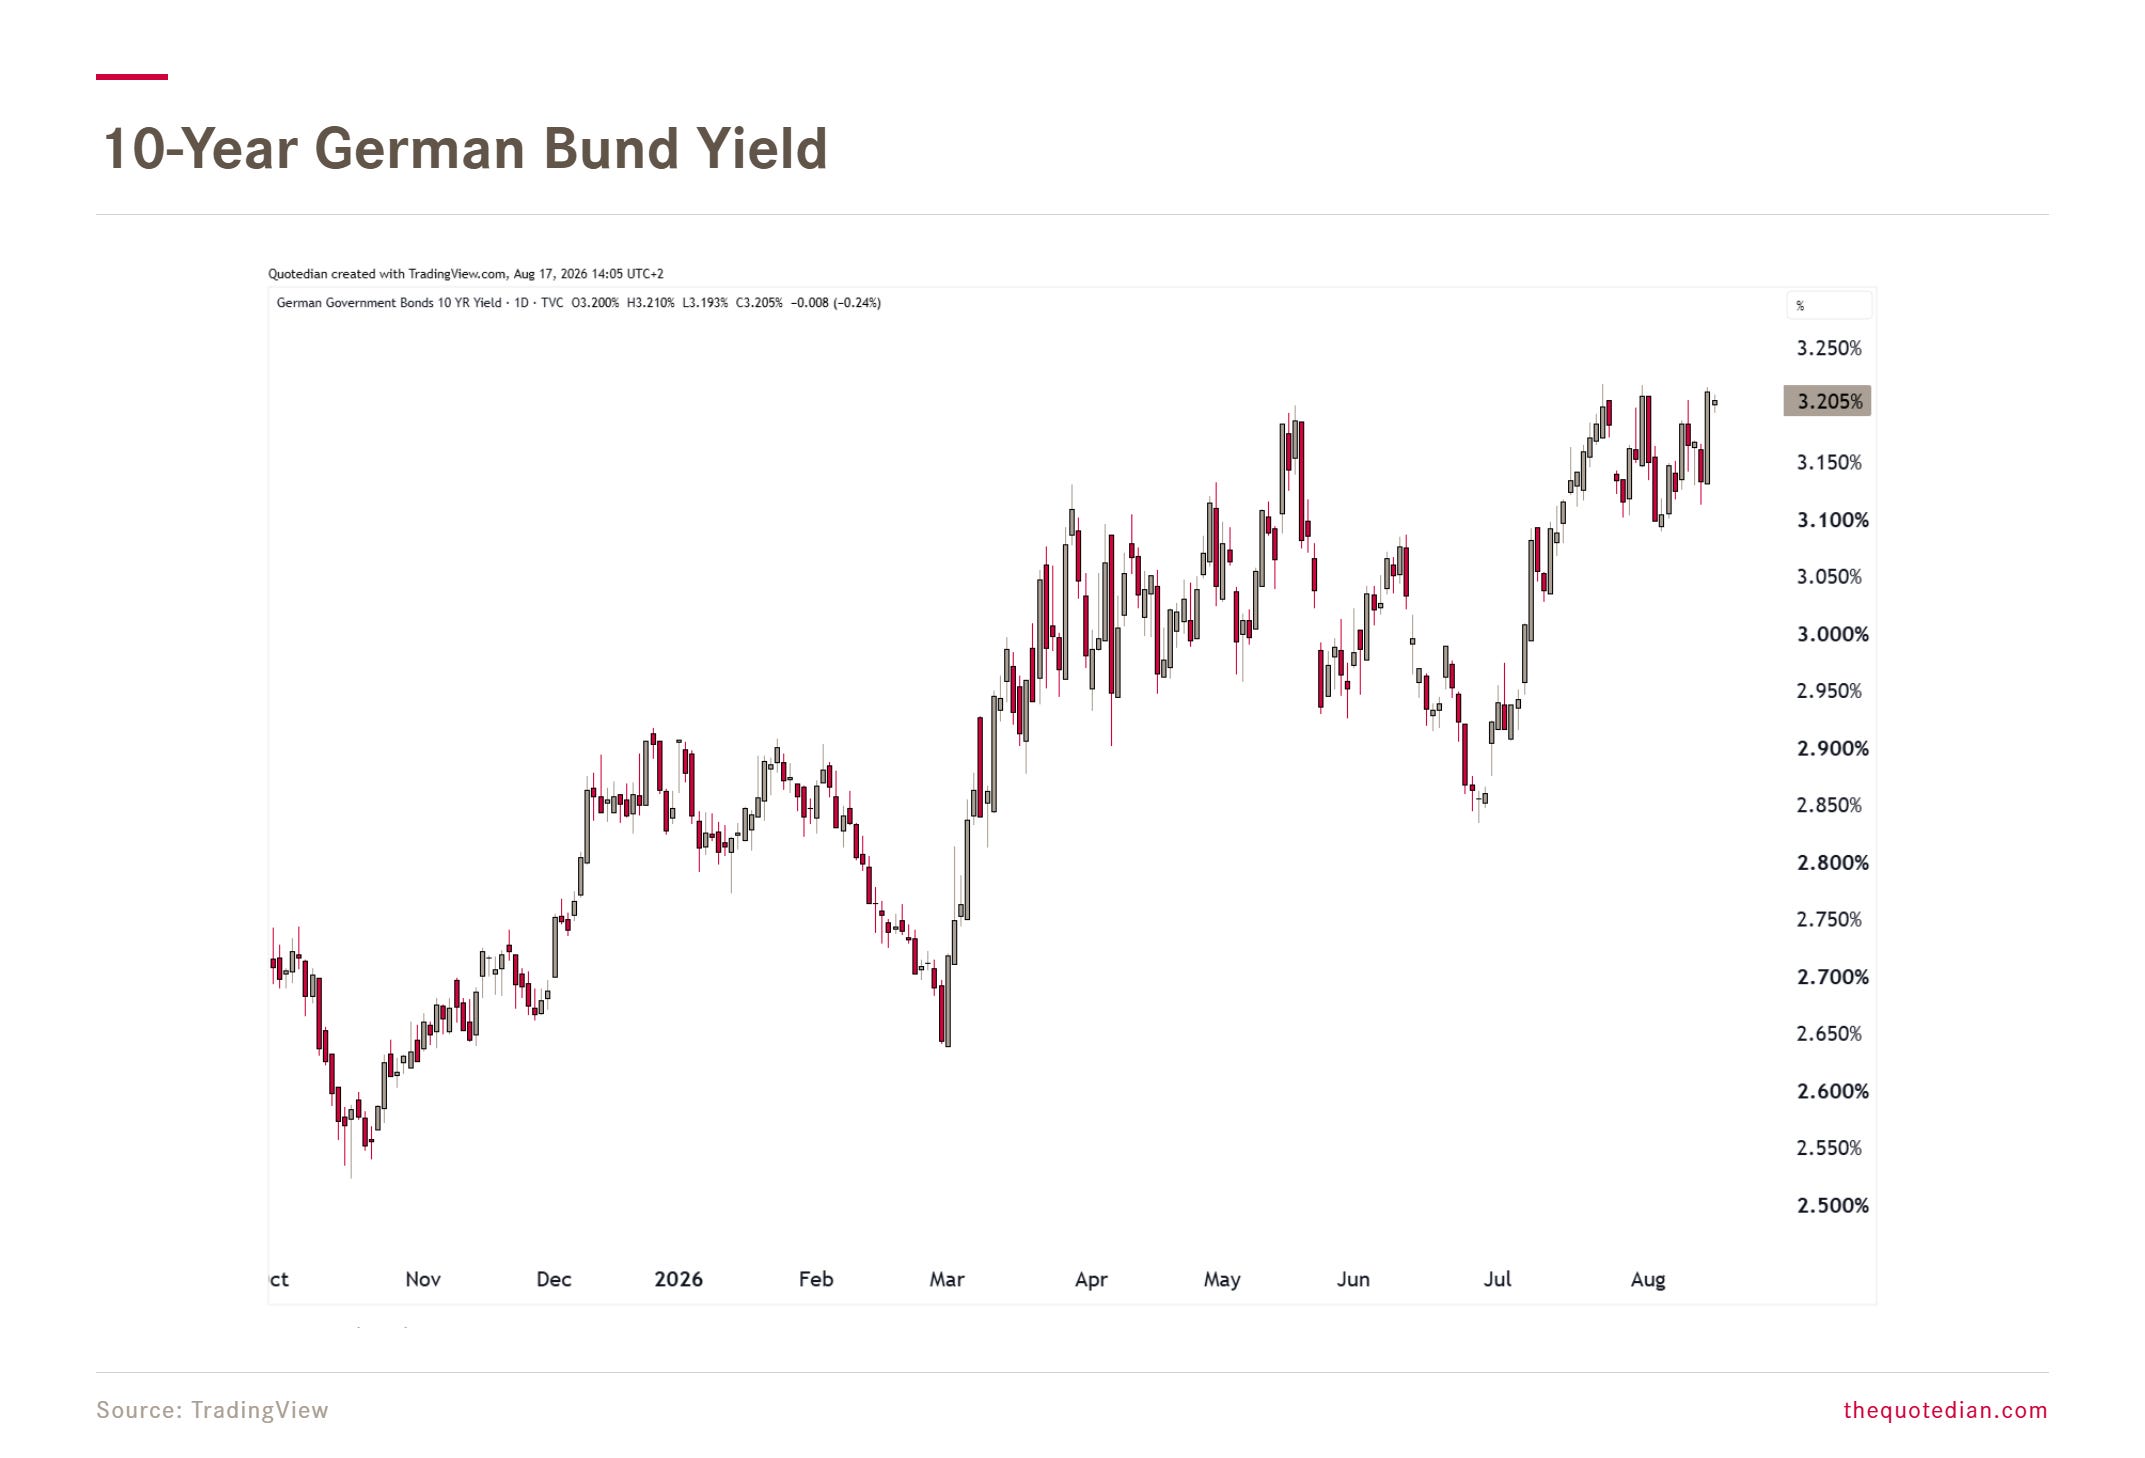
European yields, below proxied via the 10-Year German Bund, are also pushing higher again:
Recent skirmishes within the “Union” (big fat inverted commas there) regarding the handling of waves of illegal immigration in the Spanish enclave of Ceuta, including one country (Italy) ‘lifting’ the Schengen agreement with another country (Spain), just shows on how shaky grounds everything stands.
But the real test for European cross-border love may come in Q2 of next year, when the French are to be holding national elections. As it looks today, it will be a stand-off between the far left and the far right - pick your poison …
In that context, time has probably come to dust off our old German-French 10-year yield spread chart:
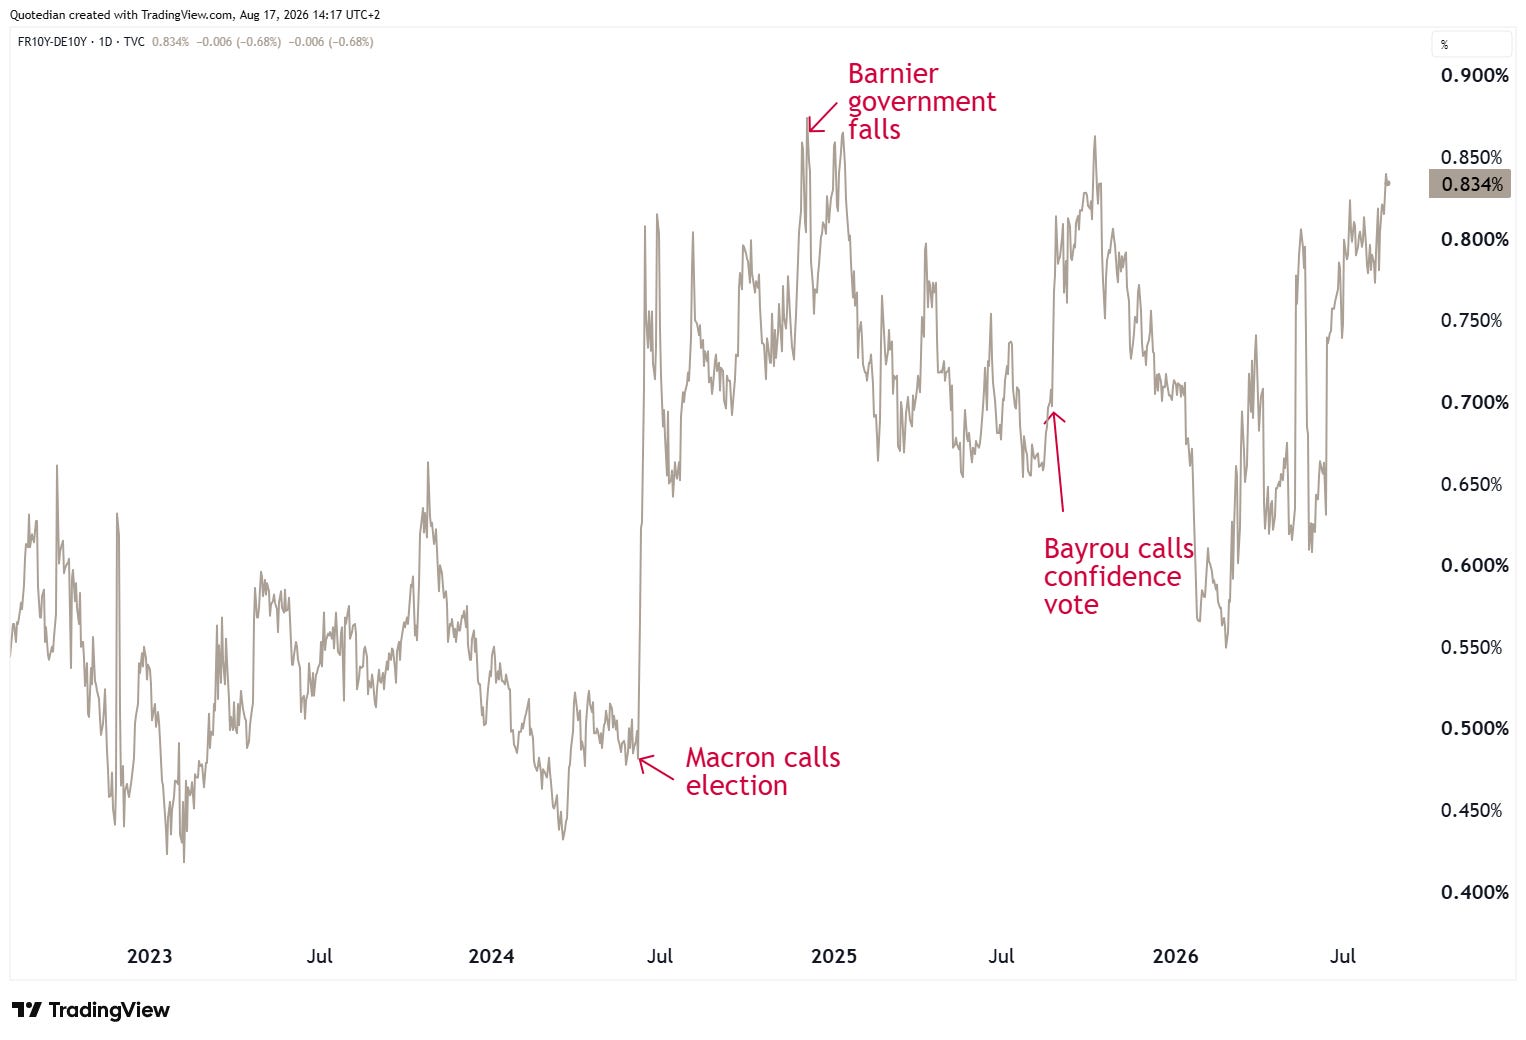
Ha! Already back at the highest levels of the past years - seems we’re not the only smart cookies in the room …
Finally, despite (or amid?) that the Bank of Japan is trying to keep bond yields in checkers by keeping the policy rate artificially low,
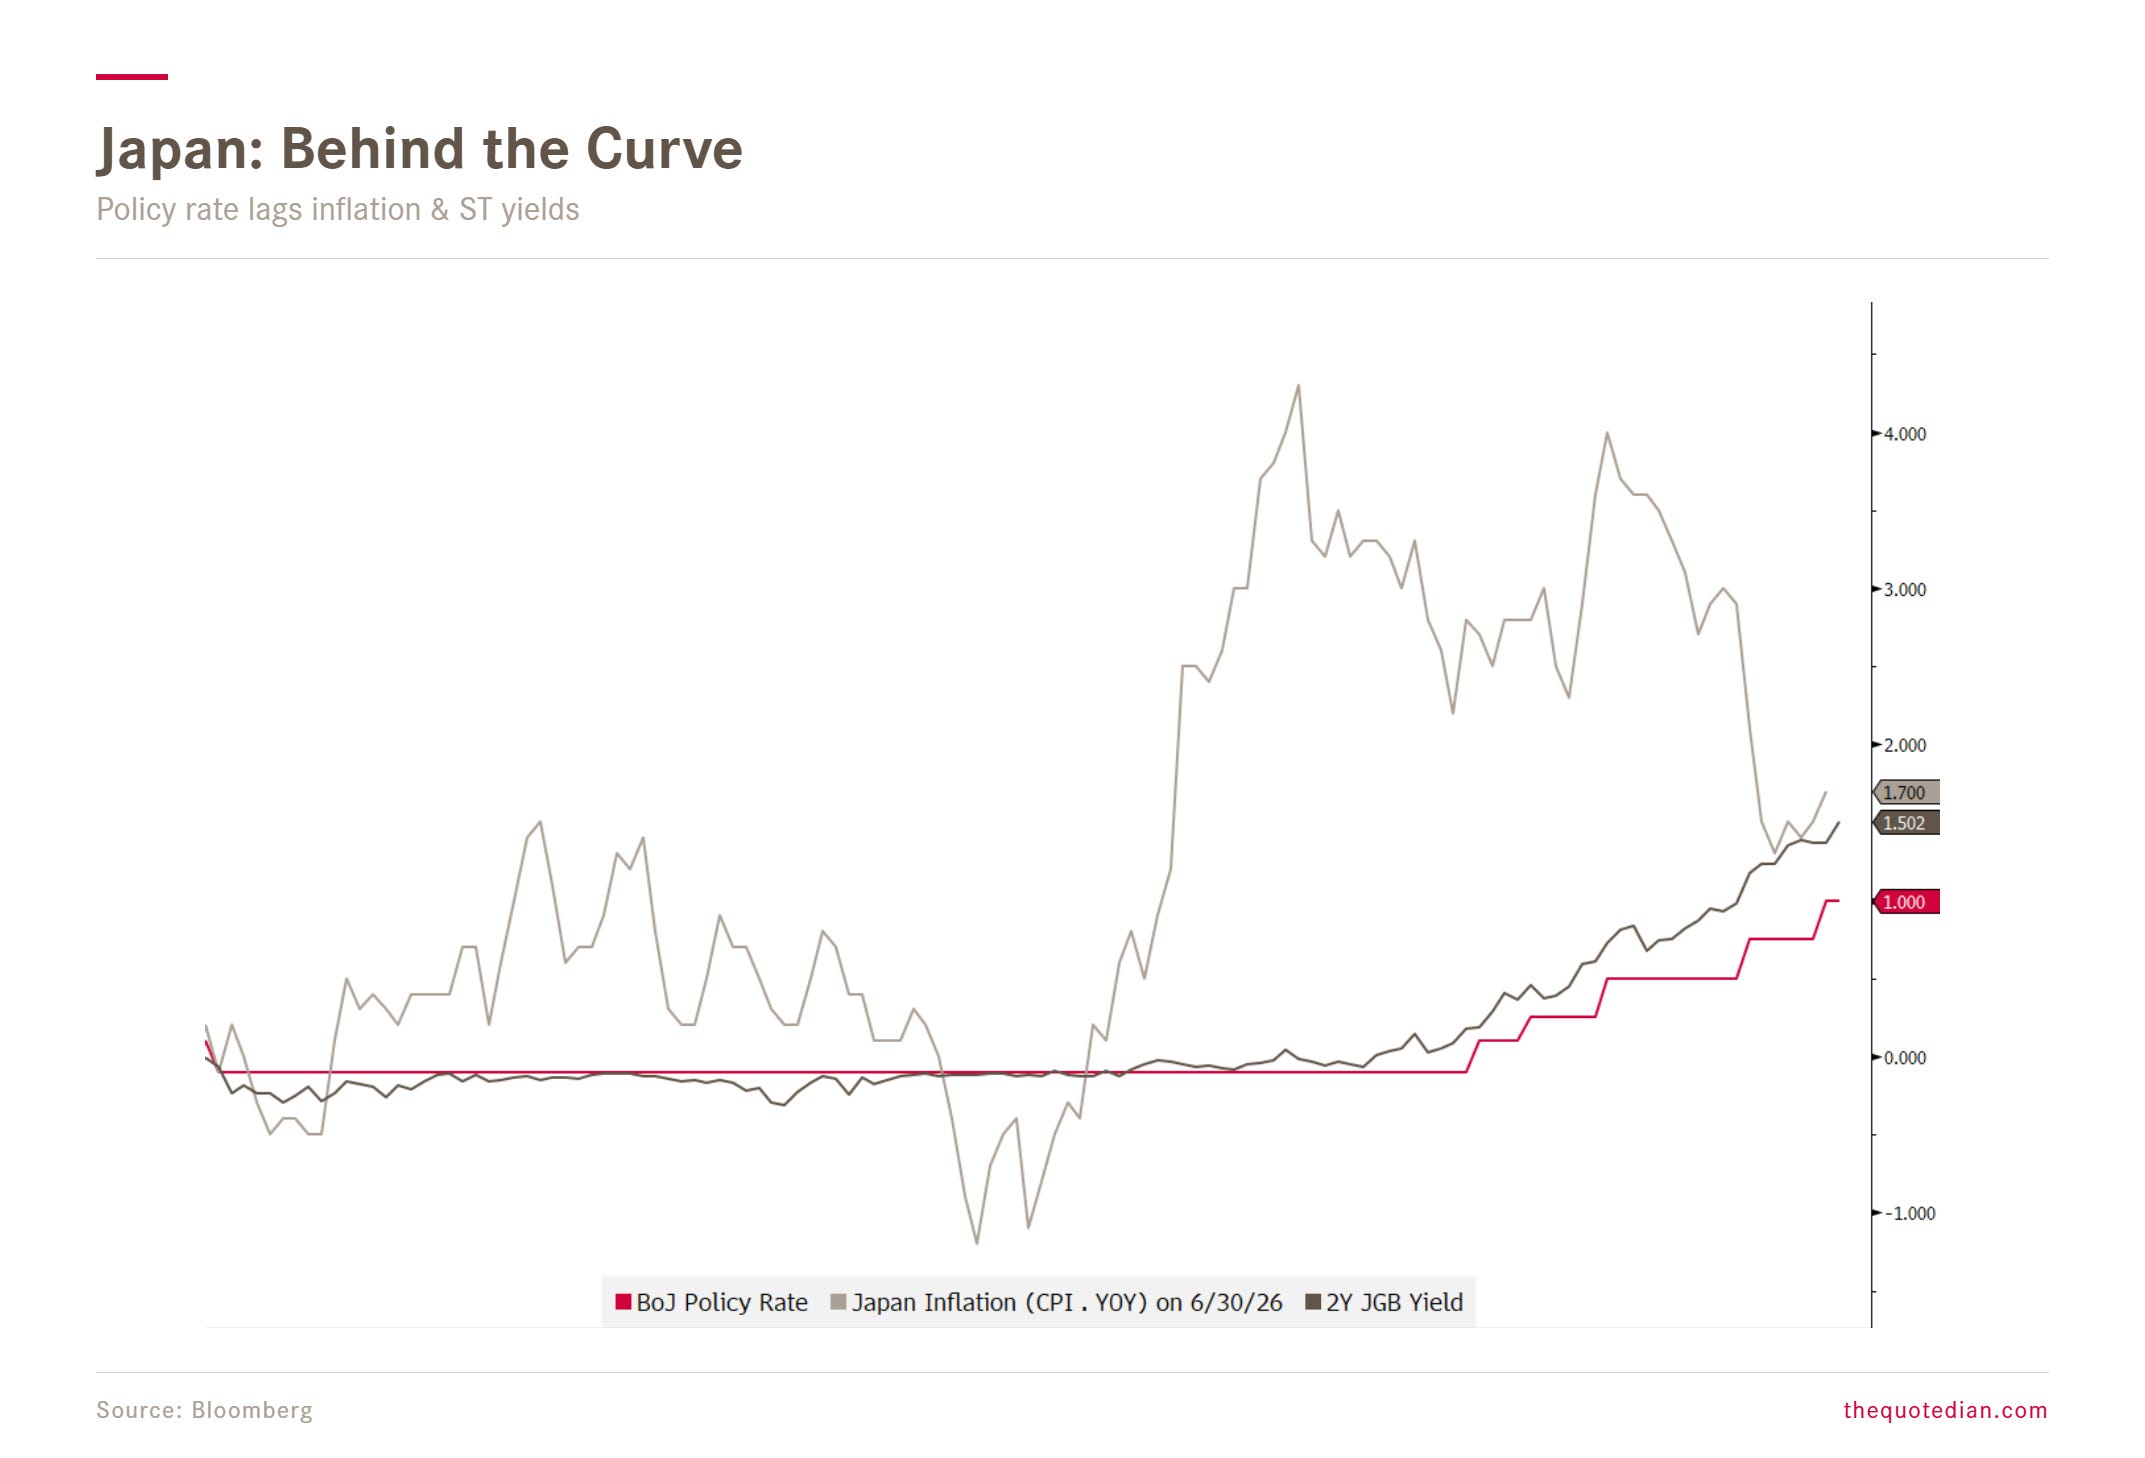
yields at the long end are stampeding higher again:
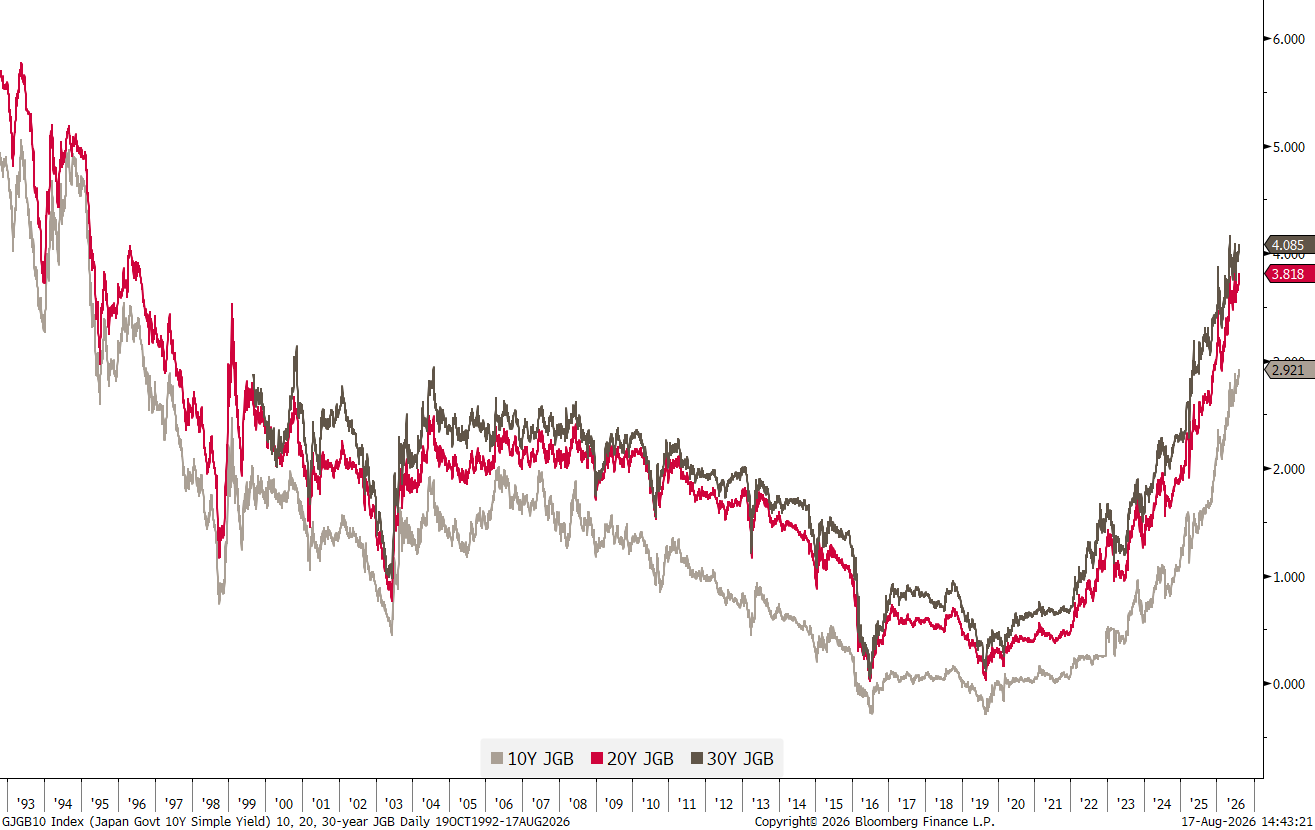
Zooming in on the 10-year JGB, we note a renewed jump higher in today’s session:
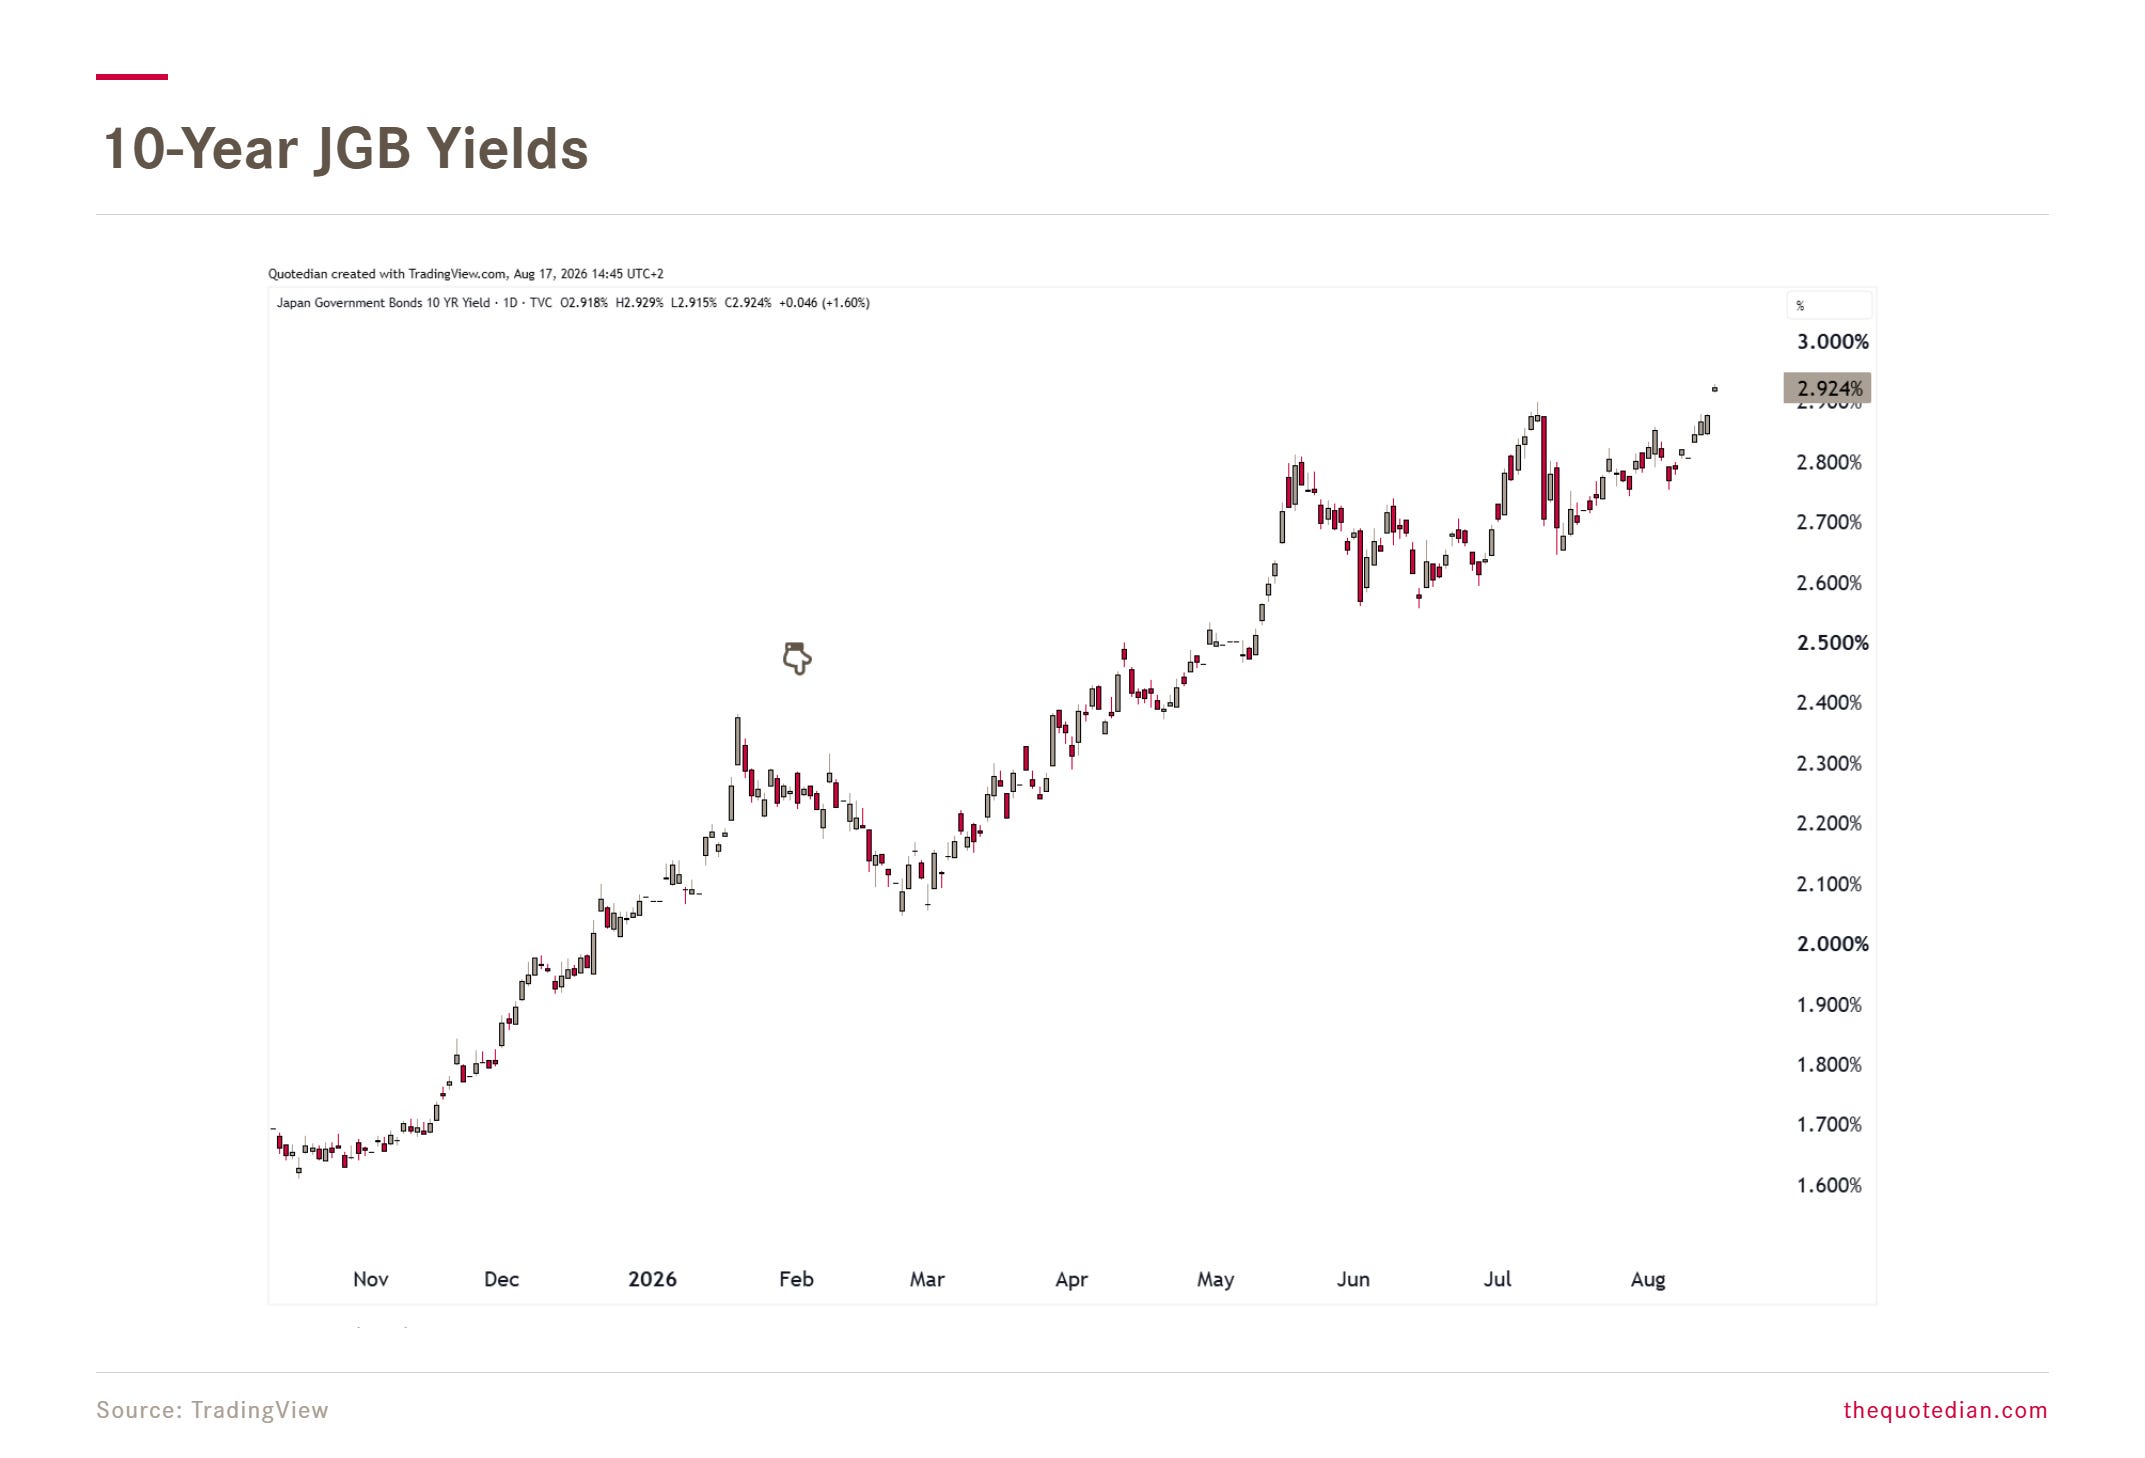
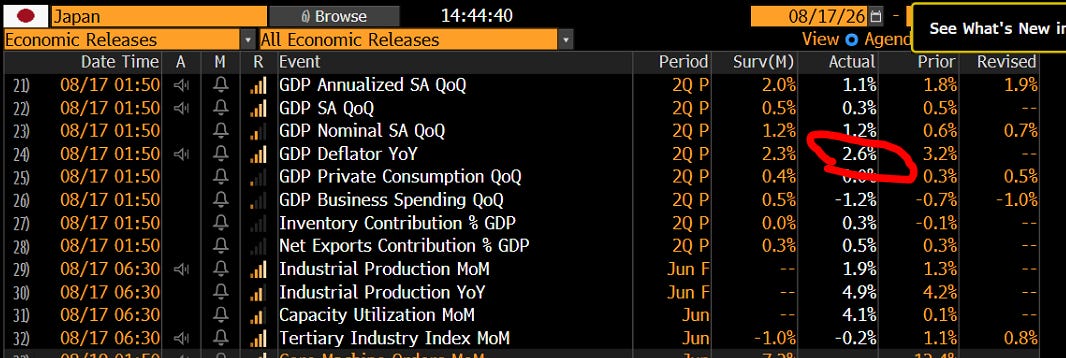
Whilst nominal GDP disappointed earlier today, it is probably that jump in the GDP Deflator to 2.6% that made yields scream higher:
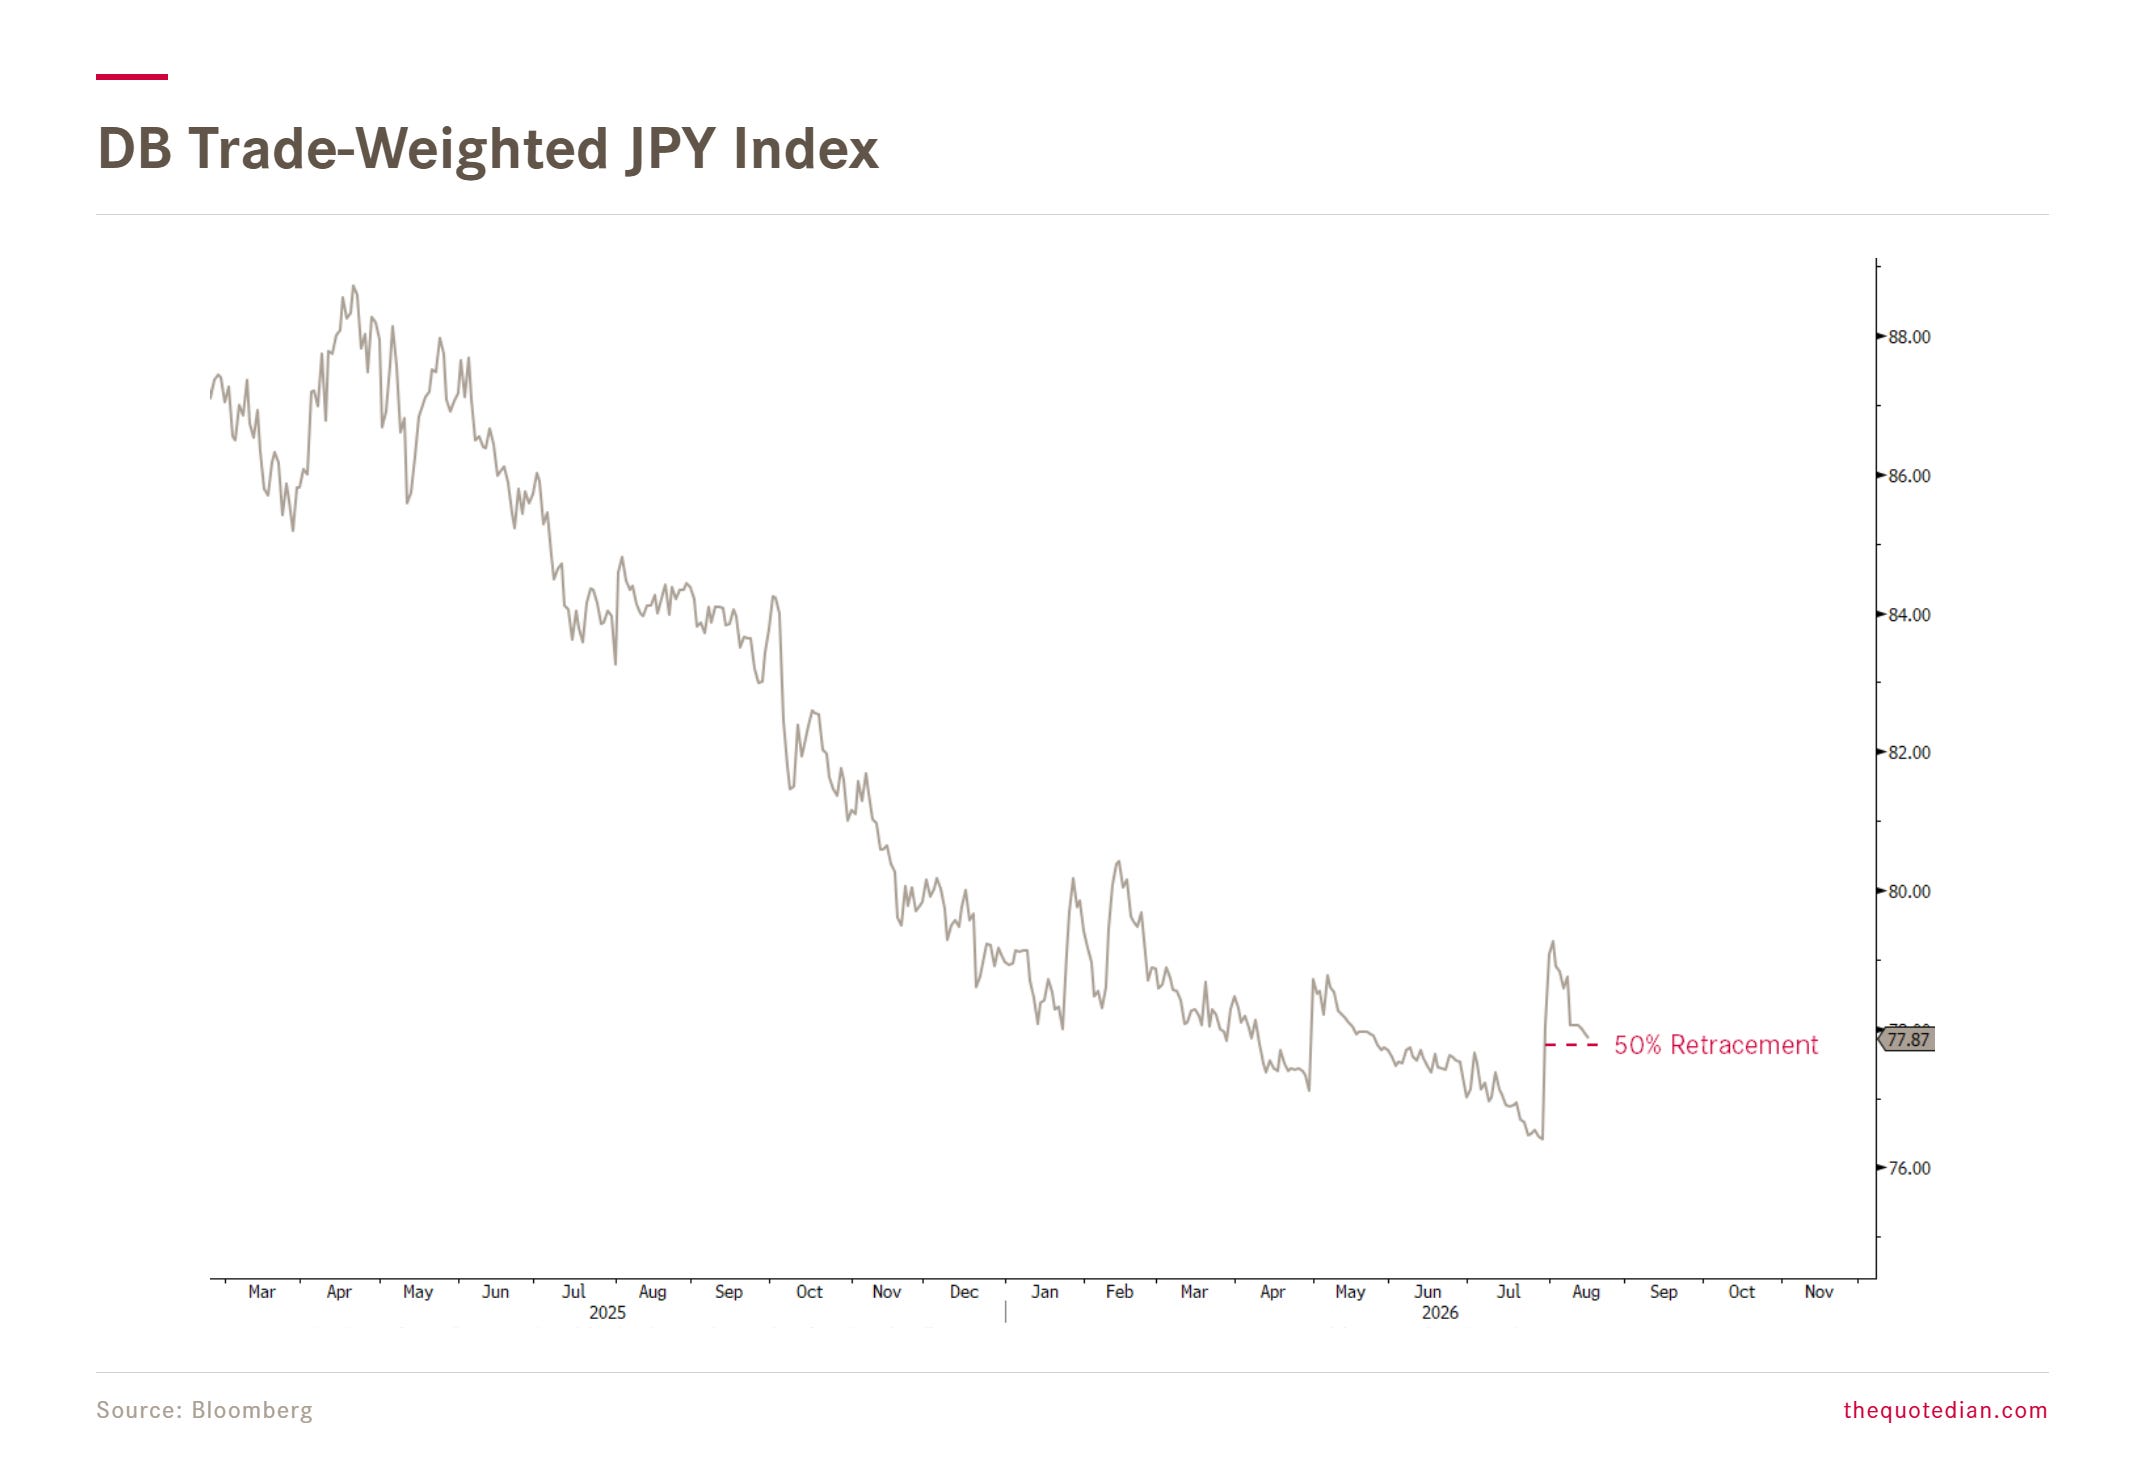
Now, let’s stay in (on) Japan, but switch to foreign exchange markets, where the nation’s currency seems again to be pressure valve of bad monetary decisions by the BoJ. Nearly gone is the intervention effect from two weeks ago:
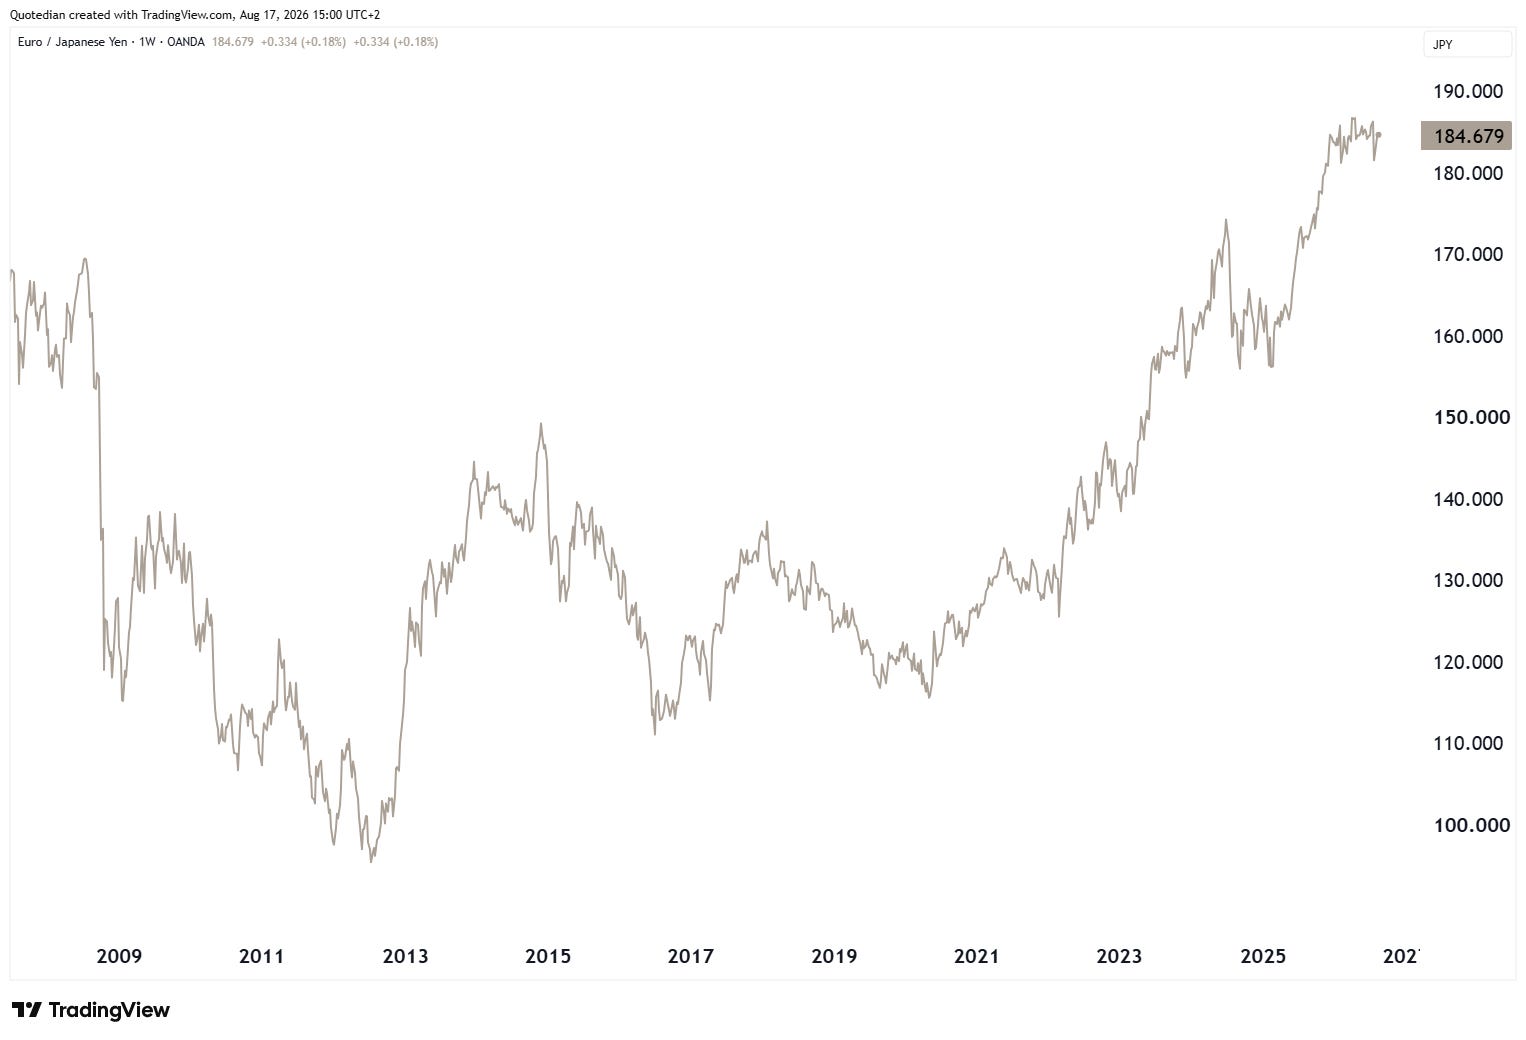
Surprisingly so, or not, has the EUR/JPY recovered nearly fully from the Treasury induced selling slump:
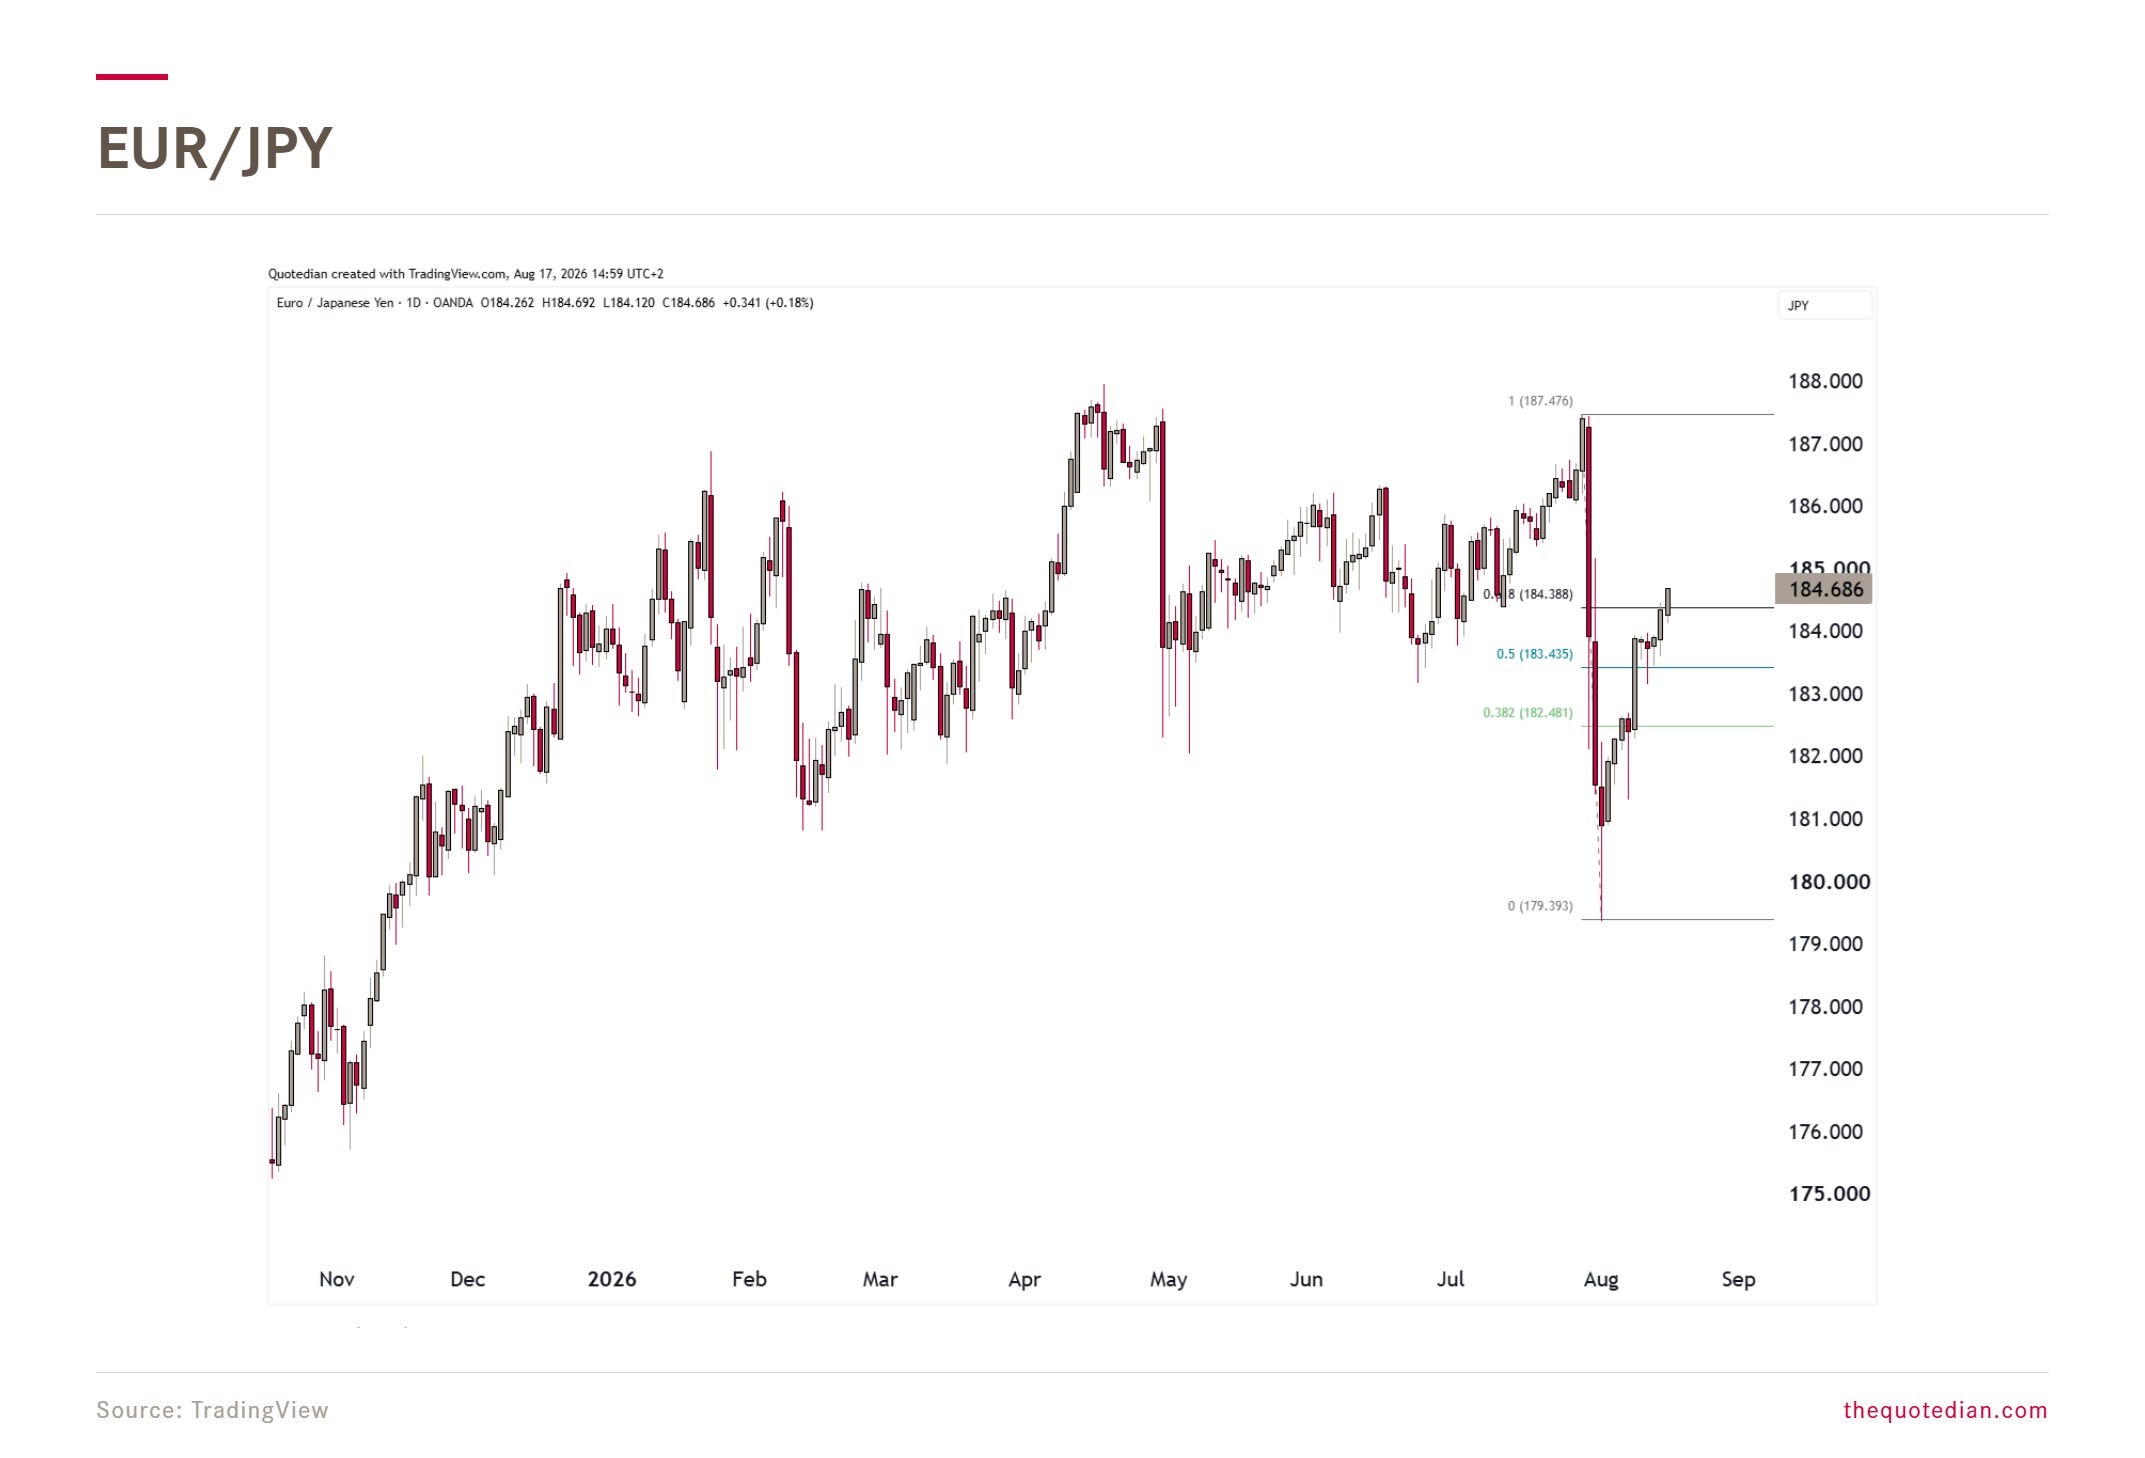
Hence, maybe there is a trading opportunity here. If you:
are EUR negative because of the upcoming French election
are positive JPY due to cheapness and favourable currency intervention
and like to position yourself aligned with the Soros/Druckenmiller line of thinking (as Bessent used to work for them)
then a short EUR, long JPY might be a position for you. Here’s the longer-term chart of that currency pair for you again:
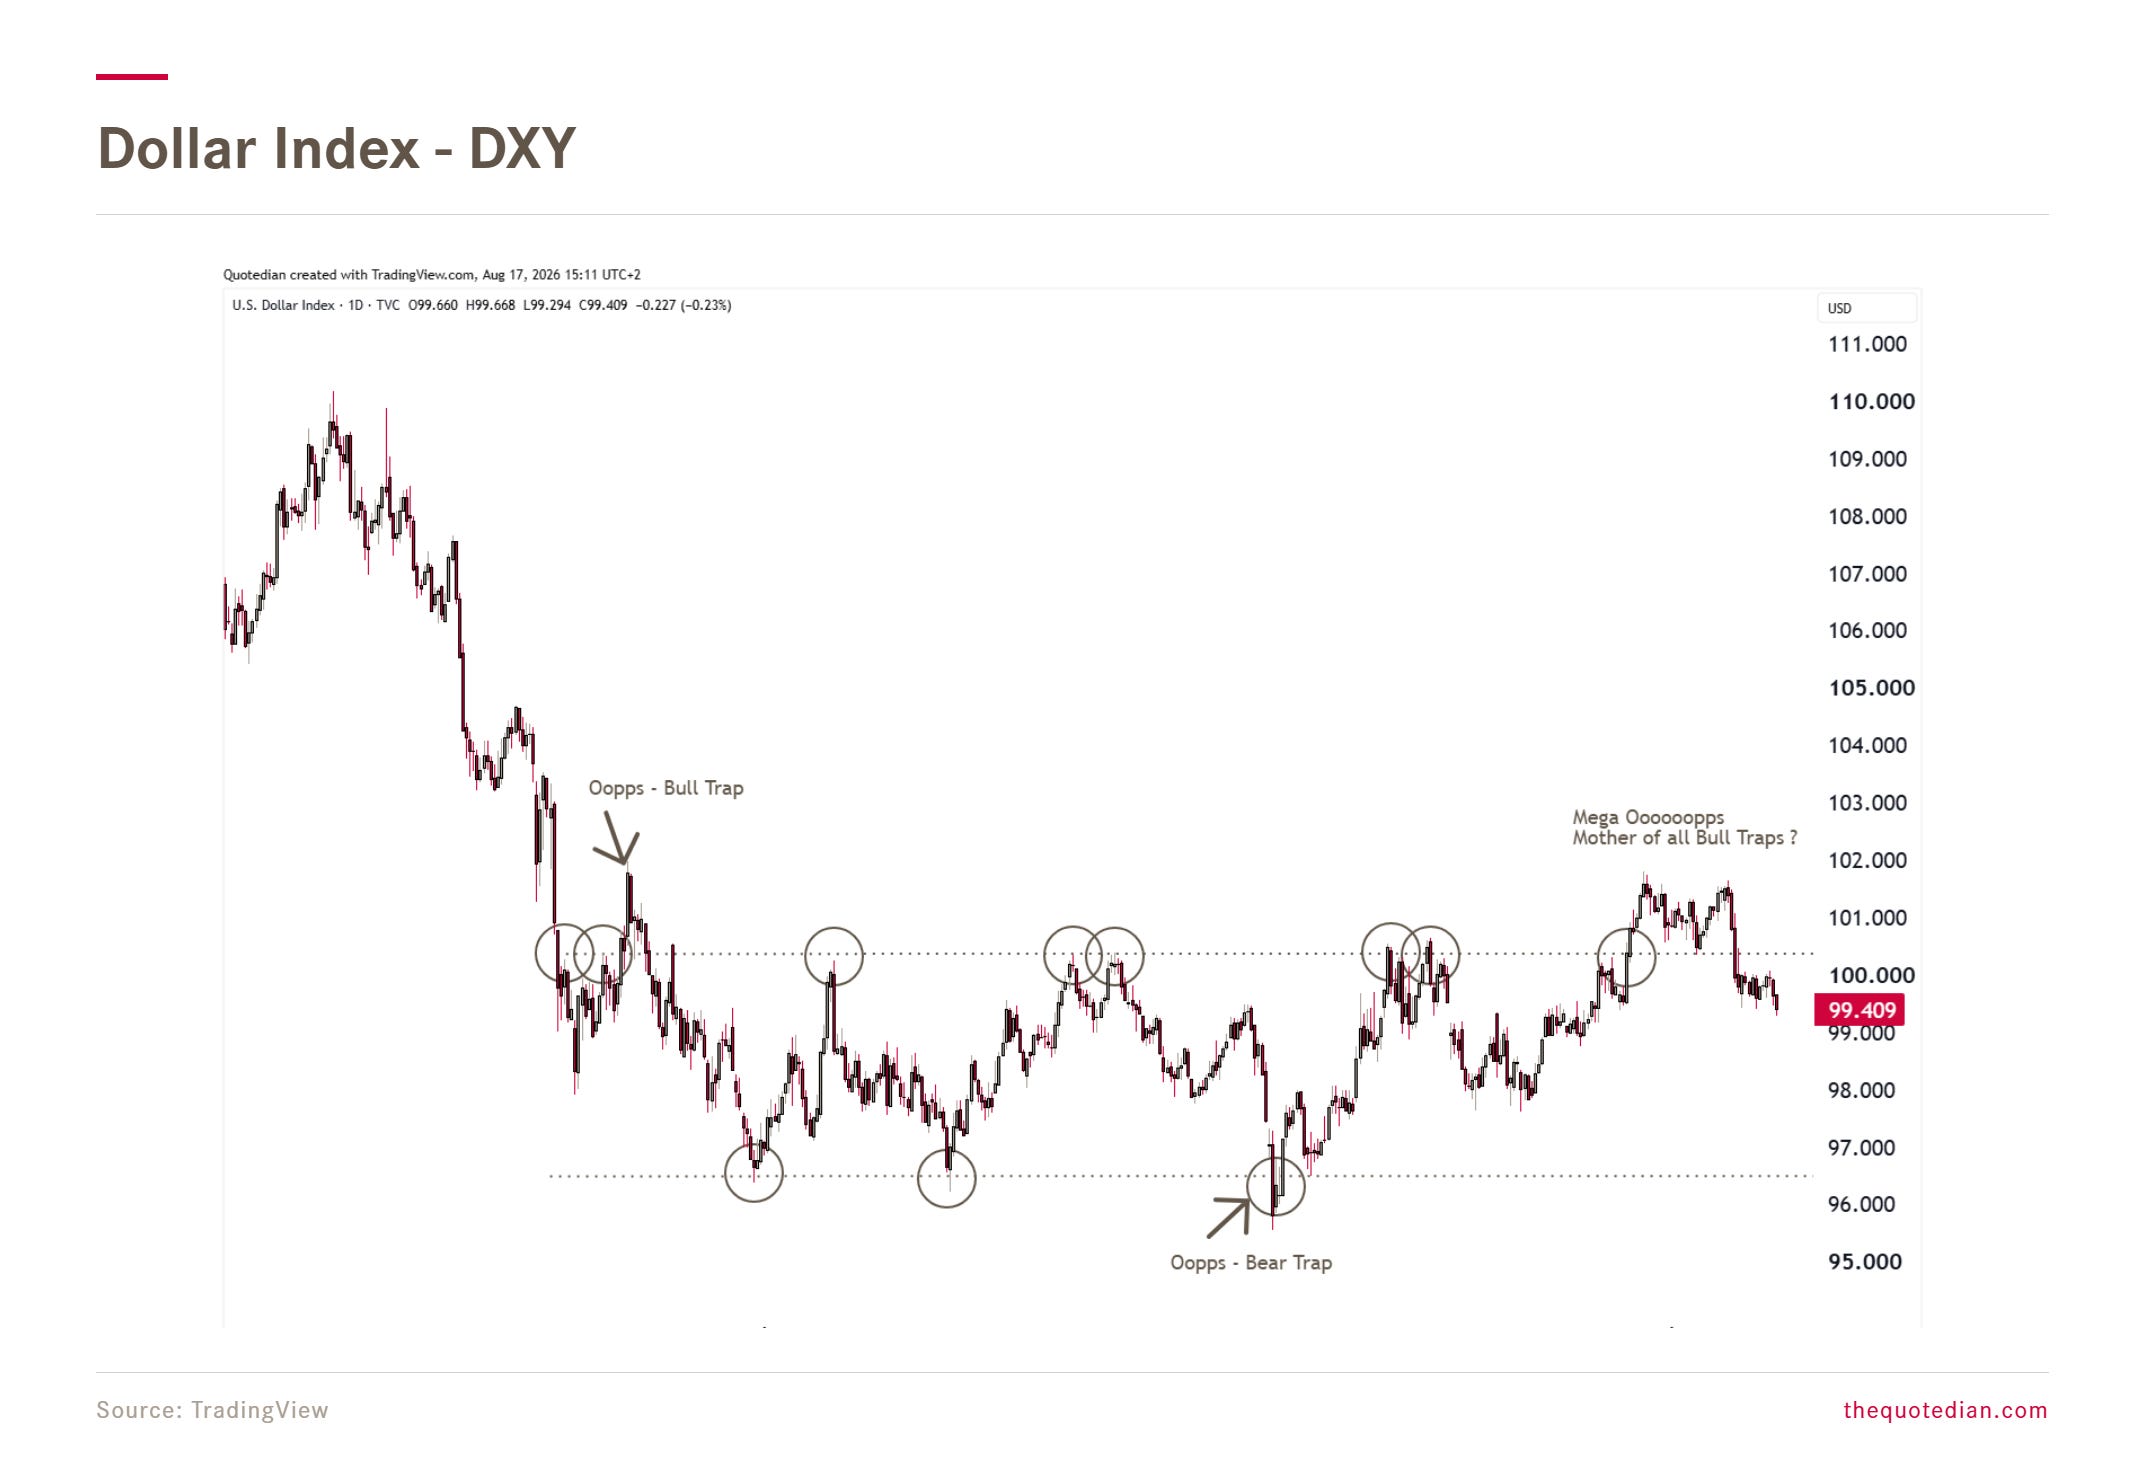
Apart from that, we remain stubbornly in the bear camp. Not least because the Greenback has fallen quickly back into its old trading range after only a brief excursion,
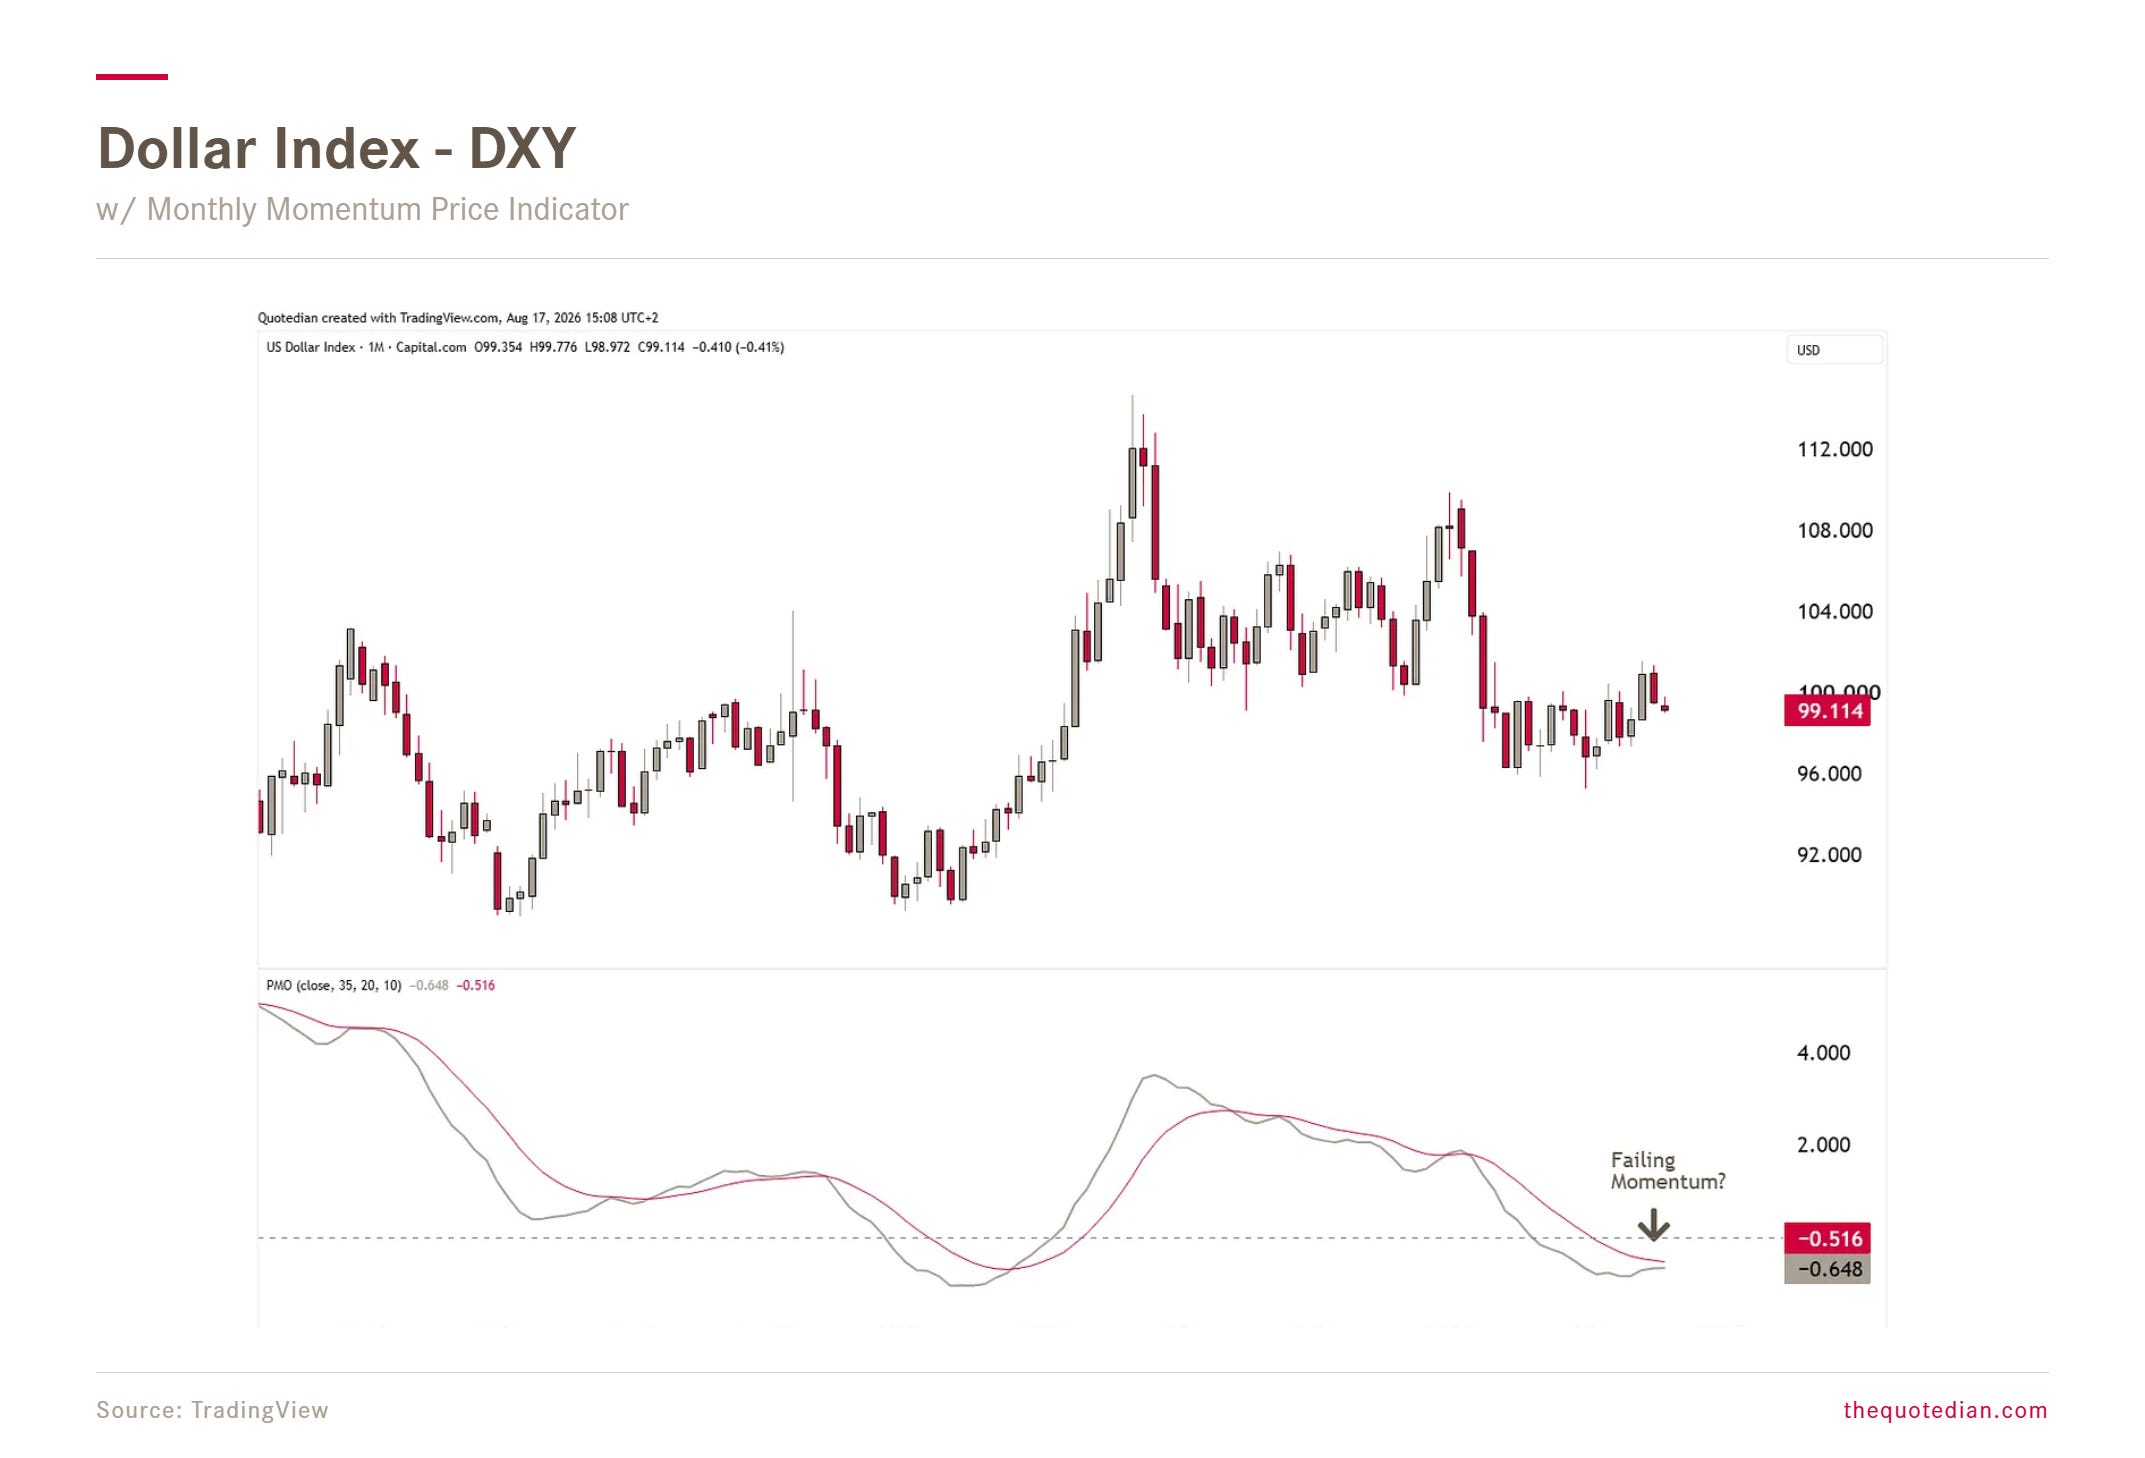
but also because the long-term (monthly) momentum indicator seems to be rolling over (lower):
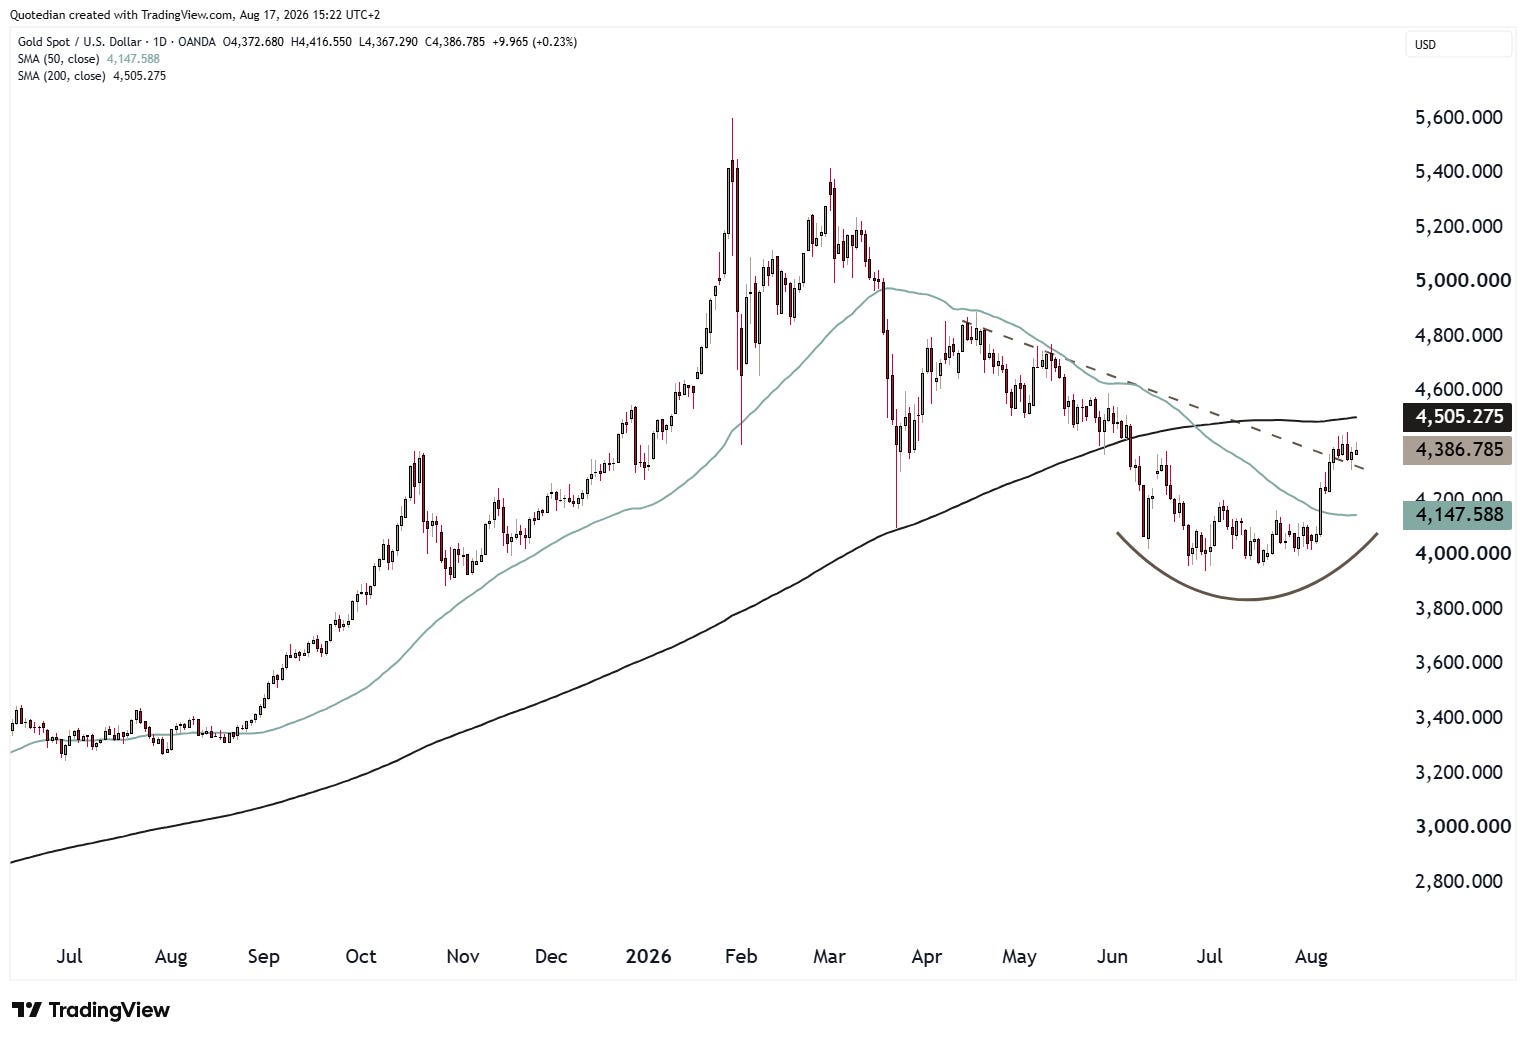
Not completely unrelated to a weakening US Dollar, does Gold seemed to have found a (or the?) bottom:
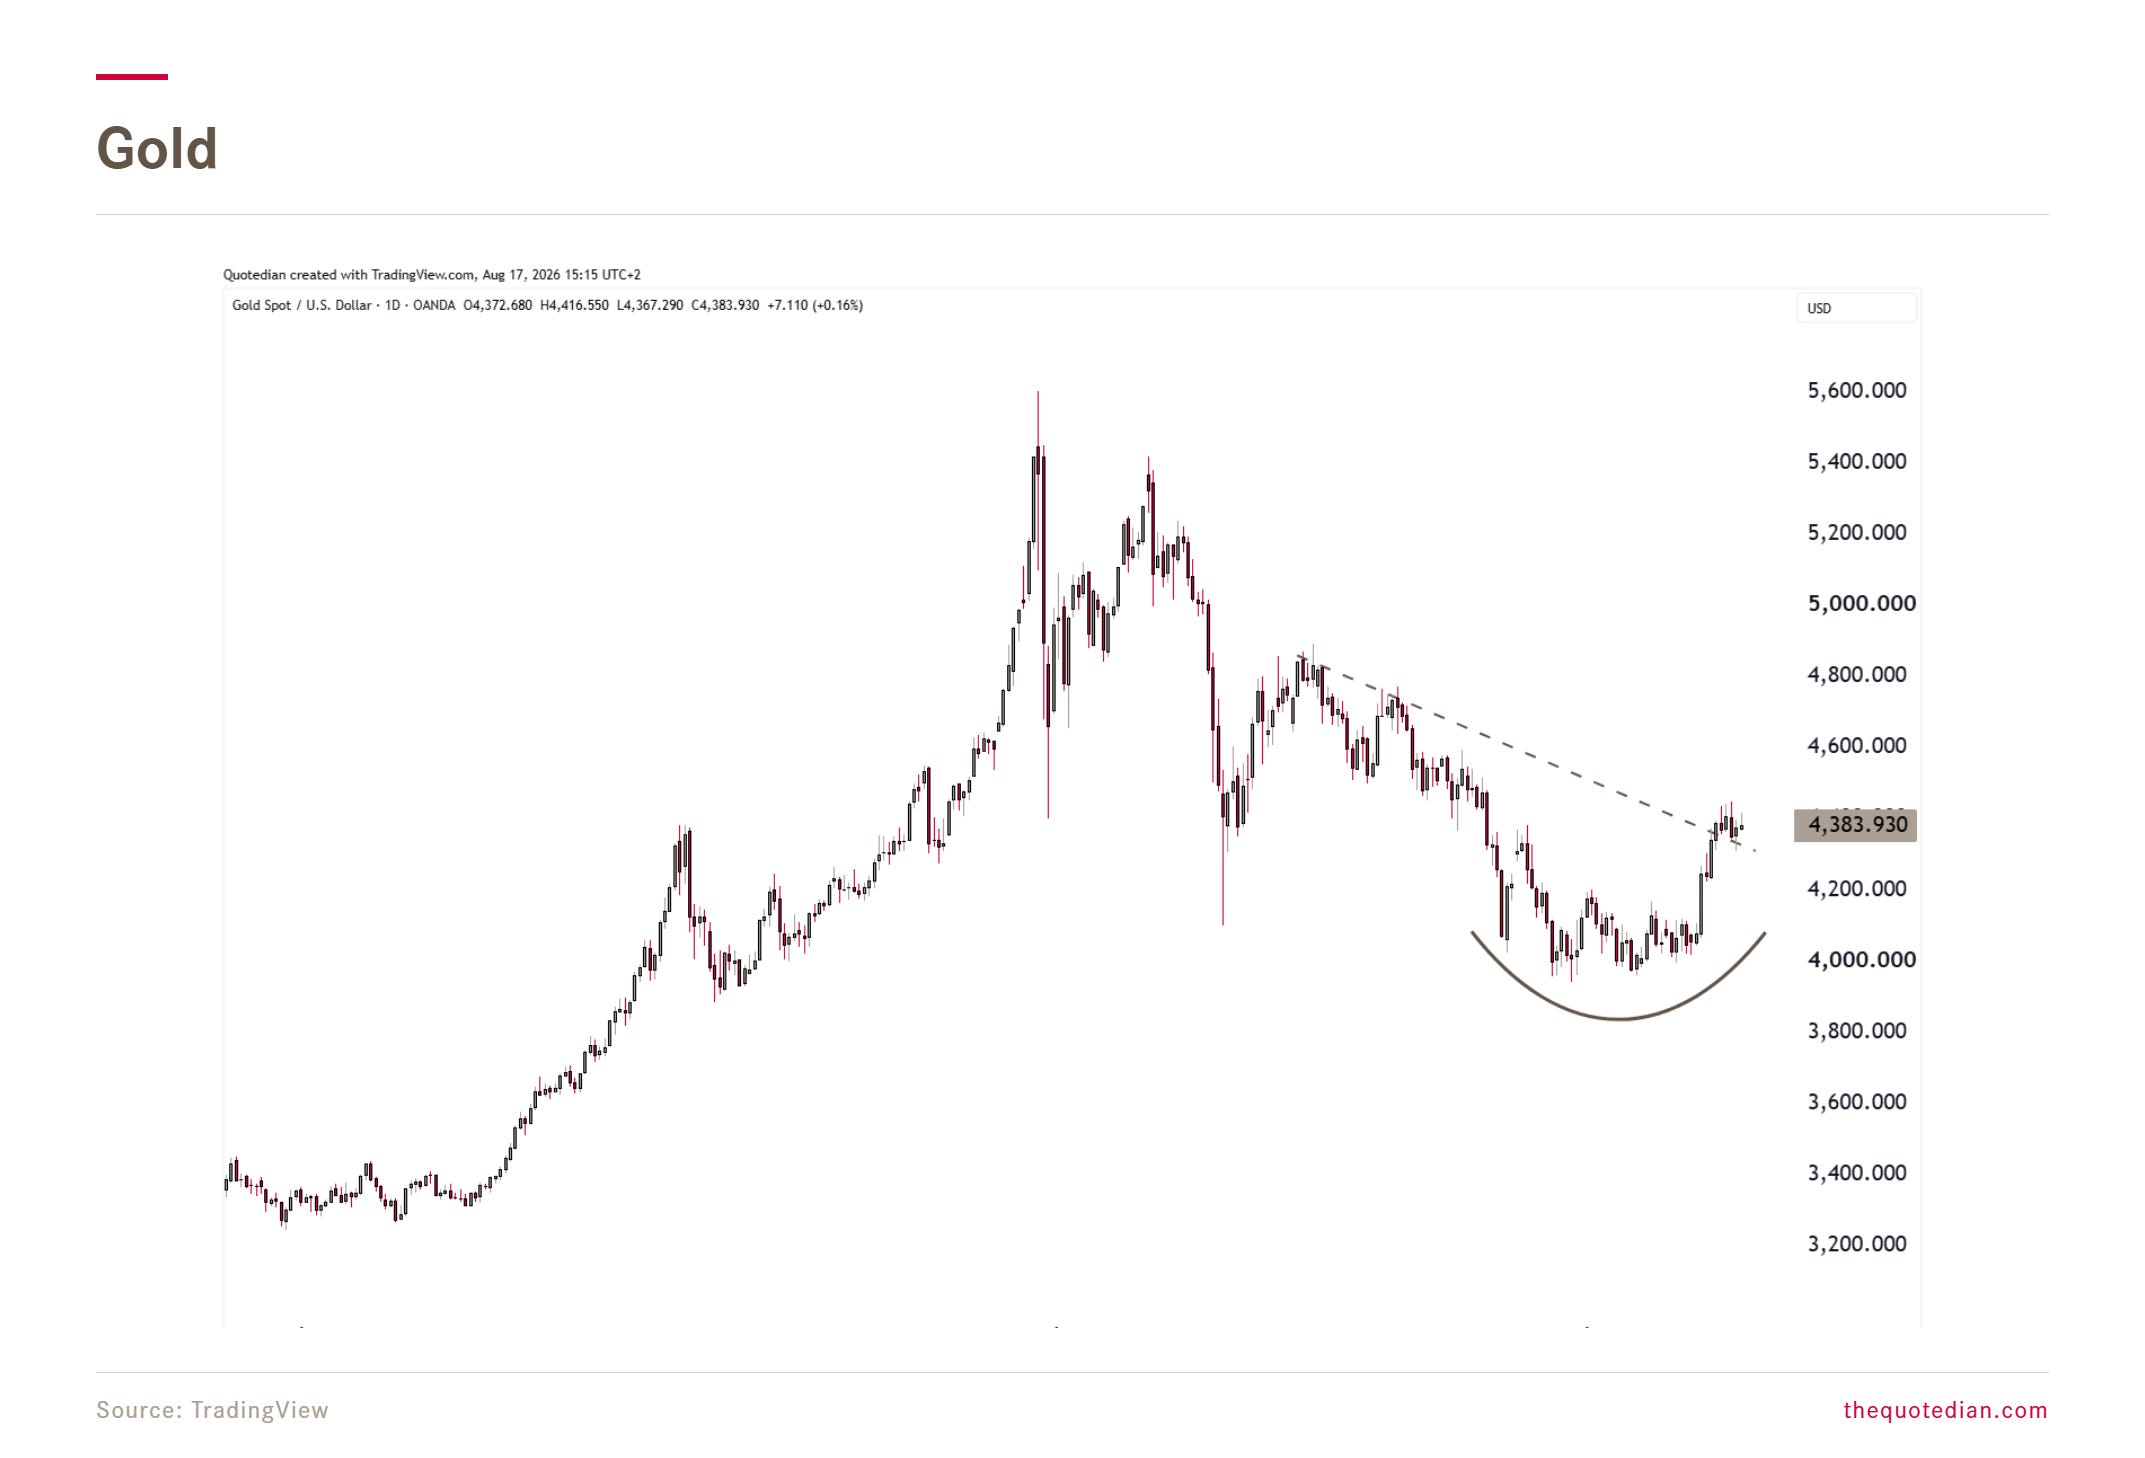
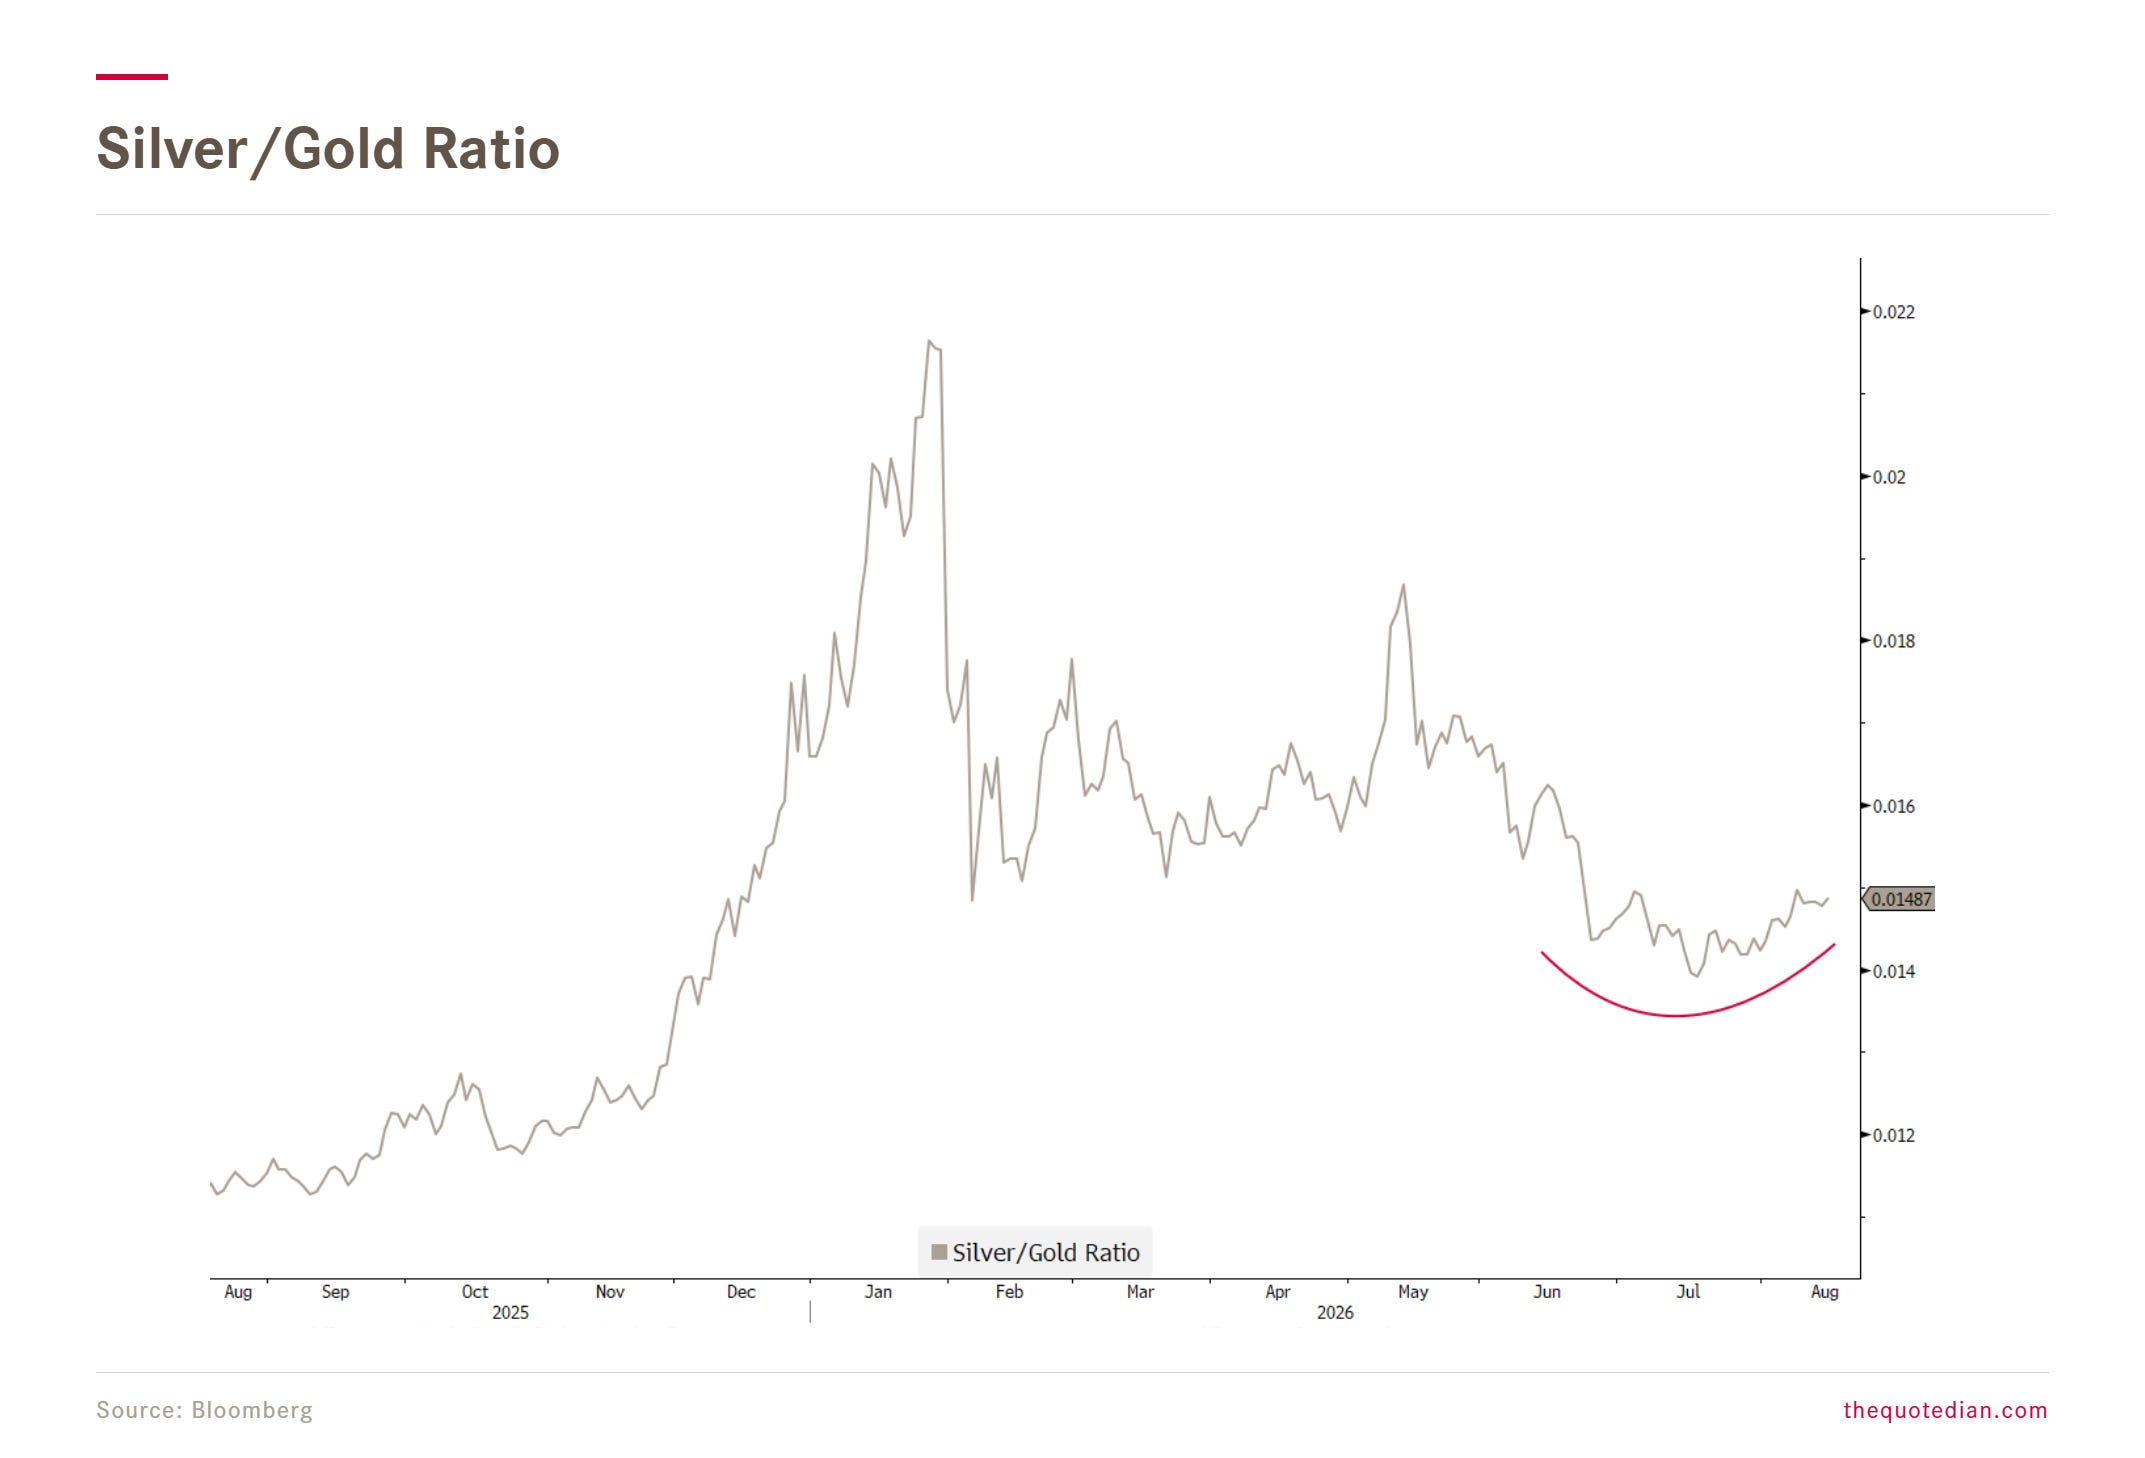
Still no rush to run after the price, but probably is the buy-on-dips or a put-selling strategy the right approach going forward. This view is further emboldened by the upturning of the Silver/Gold ratio, with a rising ratio bullish for precious metal prices in general:
Back to the Gold chart for a moment, where we note that the 50-day moving average (MA) has been reclaimed. Next stop is the 200-day MA, which by the way is still rising…
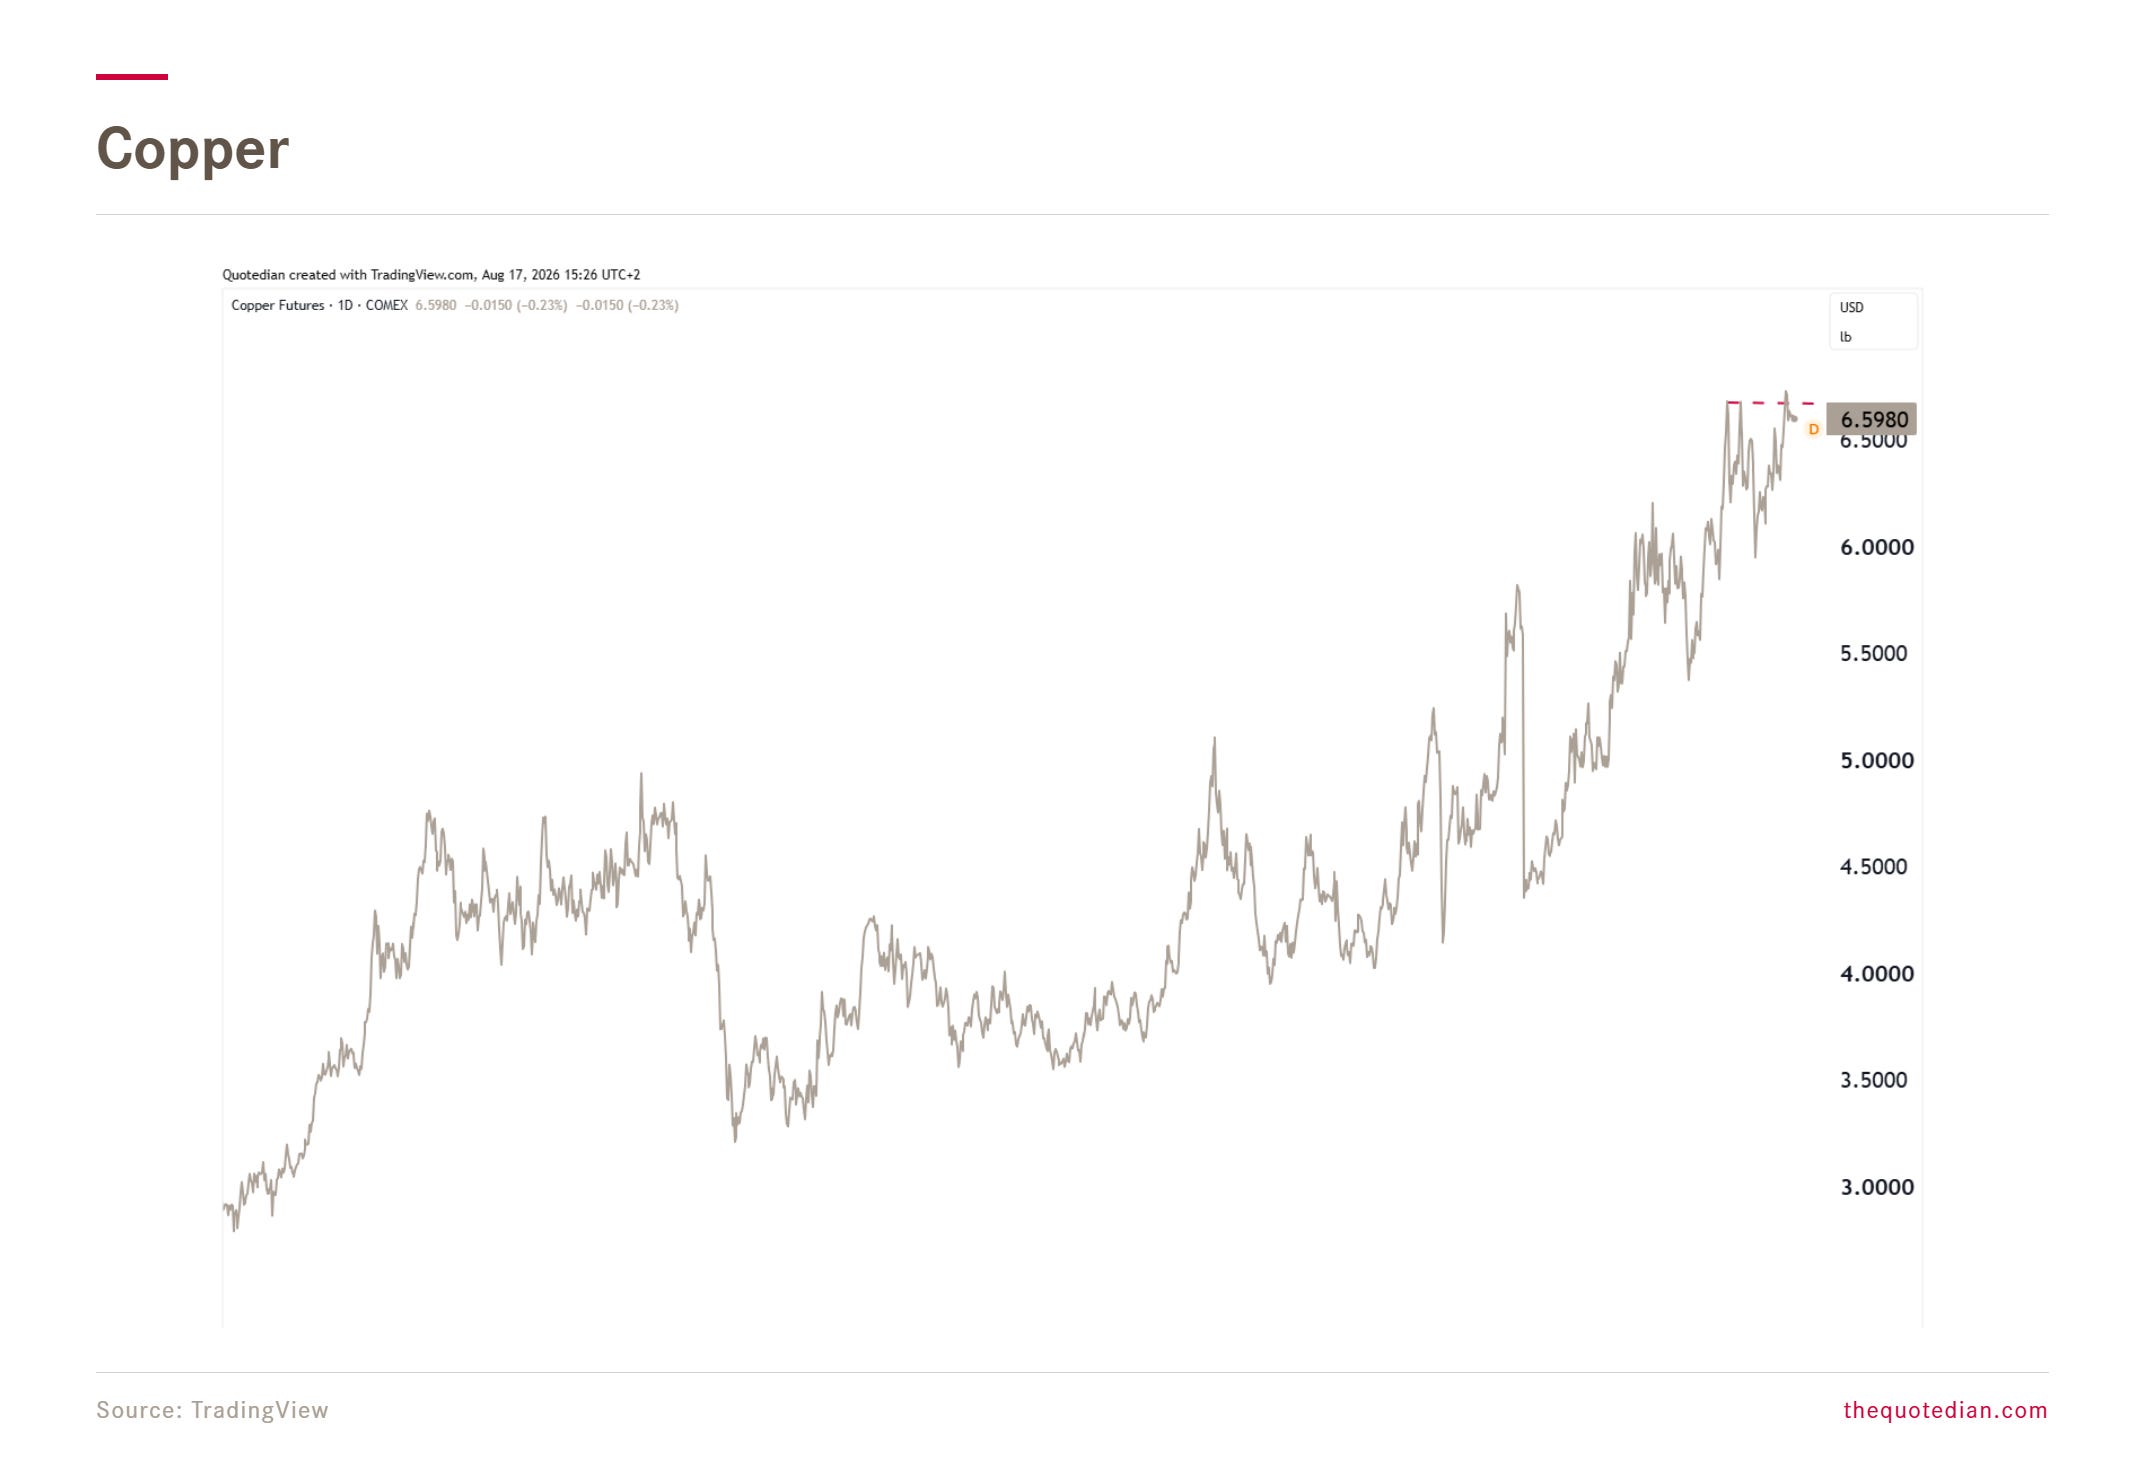
Last but not least, and ignoring fingernail-biting volatility, our long copper trade is still working well, with the red metal printing a new ATH only a few sessions ago:

As outlined in the TL;DR section, given the absence any exogenous shock (read: Trump social media feed post), equities should be able to drift higher into early September, when political life in the US restarts and mid-term elections move into focus.
For now, the equity rally is broadening and we see interesting opportunities in the industrial (Aerospace & Defense) and Cybersecurity sector.
The bond vigilantes could create a headache for equity investors if rates are pushed much higher on the back of increasing debt loads.
In currency markets, we remain firmly in the bearish US Dollar camp and see a trading opportunity (short) in the EUR/JPY.
We consider going long gold again, but probably through option strategies rather than just outright long the shiny metal.
May the Trend be with You!
André

Everything in this document is for educational purposes only (FEPO)
Nothing in this document should be considered investment advice
Investing real money can be costly; don’t do stupid shit
Leave politics at the door—markets don’t care.
Past performance is hopefully no indication of future performance
The views expressed in this document may differ from the views published by NPB Neue Privat Bank AG