

Clear and Present Danger
Vol VIII, Issue 10 | Powered by NPB Neue Privat Bank AG

"Economic expansions do not die of old age; they are murdered."
— Rudi Dornbusch
"The stock market has predicted nine out of the last five recessions."
— Paul Samuelson
Enjoying The Quotedian but not yet signed up for The QuiCQ? What are you waiting for?!!

So we are in of those delicate moments, at least from a US equity market and chart point of view, where we need to decide whether now is the time to increase exposure again … or … if the tipping point (read: support zone) will be surpassed and a deeper correction/bear market evolves.
That’s why we have two quotes of the week in this issue - each addresses one of the situations just outlined.
Let’s look at each quote in turn below in the equity section, but just before that, we voted on a new nickname for the Editor of The Quotedian and his endless affinity to chart painting a few weeks ago. Participation was lower than expected, but still, FWIW here are the results:

Hence, the Chartfather made it!

With that out of the way, let’s dive right in!

Here’s how global equity benchmarks have performed last week (all numbers in percent):

That’s another more five percent performance differential between the German Dax and the S&P 500, despite a nearly two percent sell-off on Friday in the Dax and a half a percent rally in the SPX.
Since the European outperformance begin in earnest towards the end of November, the DAX-SPX spread has now widened to 23%:

But let’s stick with the US market for now, going back to our first quote of the week:
"Economic expansions do not die of old age; they are murdered."
— Rudi Dornbusch
It is save to assume that dear Rudi referred to the Federal Reserve Bank as the murderer as they usually overtighten monetary policy when trying to cool the economy and hence throwing the whole thing into a recession.
In the (potential) 2025 murder case, the suspect for the crime is probably rather the recently inaugurated US administration. Whilst there is no denying that
they have probably started with more bang than any other previous incoming administration,
and their intentions are surely only the best,
plus it can be well argued that their policy changes may have very good long-term implications,
their policies of tariffs, deportations and federal government job cuts could mean some (massive) short-term pain.
But, dear Editor, you will be thinking, we know that Mr Trump loves the stock market and therefore there must be a “Trump Put” close by, no?
Well, probably not. Trump 2.0 is a different beast than Trump 1.0. The latter had tweeted over 200 times on the stock market during the four years in office from 2016 to 2020. Since January 20th 2025? Once, or twice max.
And then this: When asked about the stock sell-off on a particular ugly stock market day last week Trump said,
"No nothing to do with the market. I'm not even looking at them (stocks) because long term, the United States will be very strong with what's happening here. It’s globalists who see how rich our country is going to be and they don’t like it.”
No. Trump. Put.
For now at least.
And if you do not believe me, believe US treasury secretary Scott Bessent, who was on CNBC last Friday (7/3) for a lengthy interview (for full interview click here). The embedded video below show Joe Kernen asking regarding the put question and Bessent confirming “no put” at 16:30:
One thing that has been going through my mind, and which I want to take a deeper dive into during one of the upcoming Quotedians, is the effect of the … well … “Wealth Effect” and the possible reversal thereof.
In very short, the average US household (upper average that is) has become increasingly wealthy over the past years, mostly thanks to a ripping stock market. Invest passive, and make 20% per year. Need to buy your wife a LVMH handbag for a forgotten anniversary? Buy and hold NVDA … for a week. Done.
Not the same as the “Wealth Effect” during the 2005-2008 housing bubble, but parallels are undeniable to those who have lived (read: invested) during both periods.
What if markets suddenly only go sideways due to overvaluation? Or worse, they start tanking, forcing those who are “saving “ via stocks only to exit in a hurry? Could get ugly, but as I said, more on this another day.
Let’s get finally started on those charts…
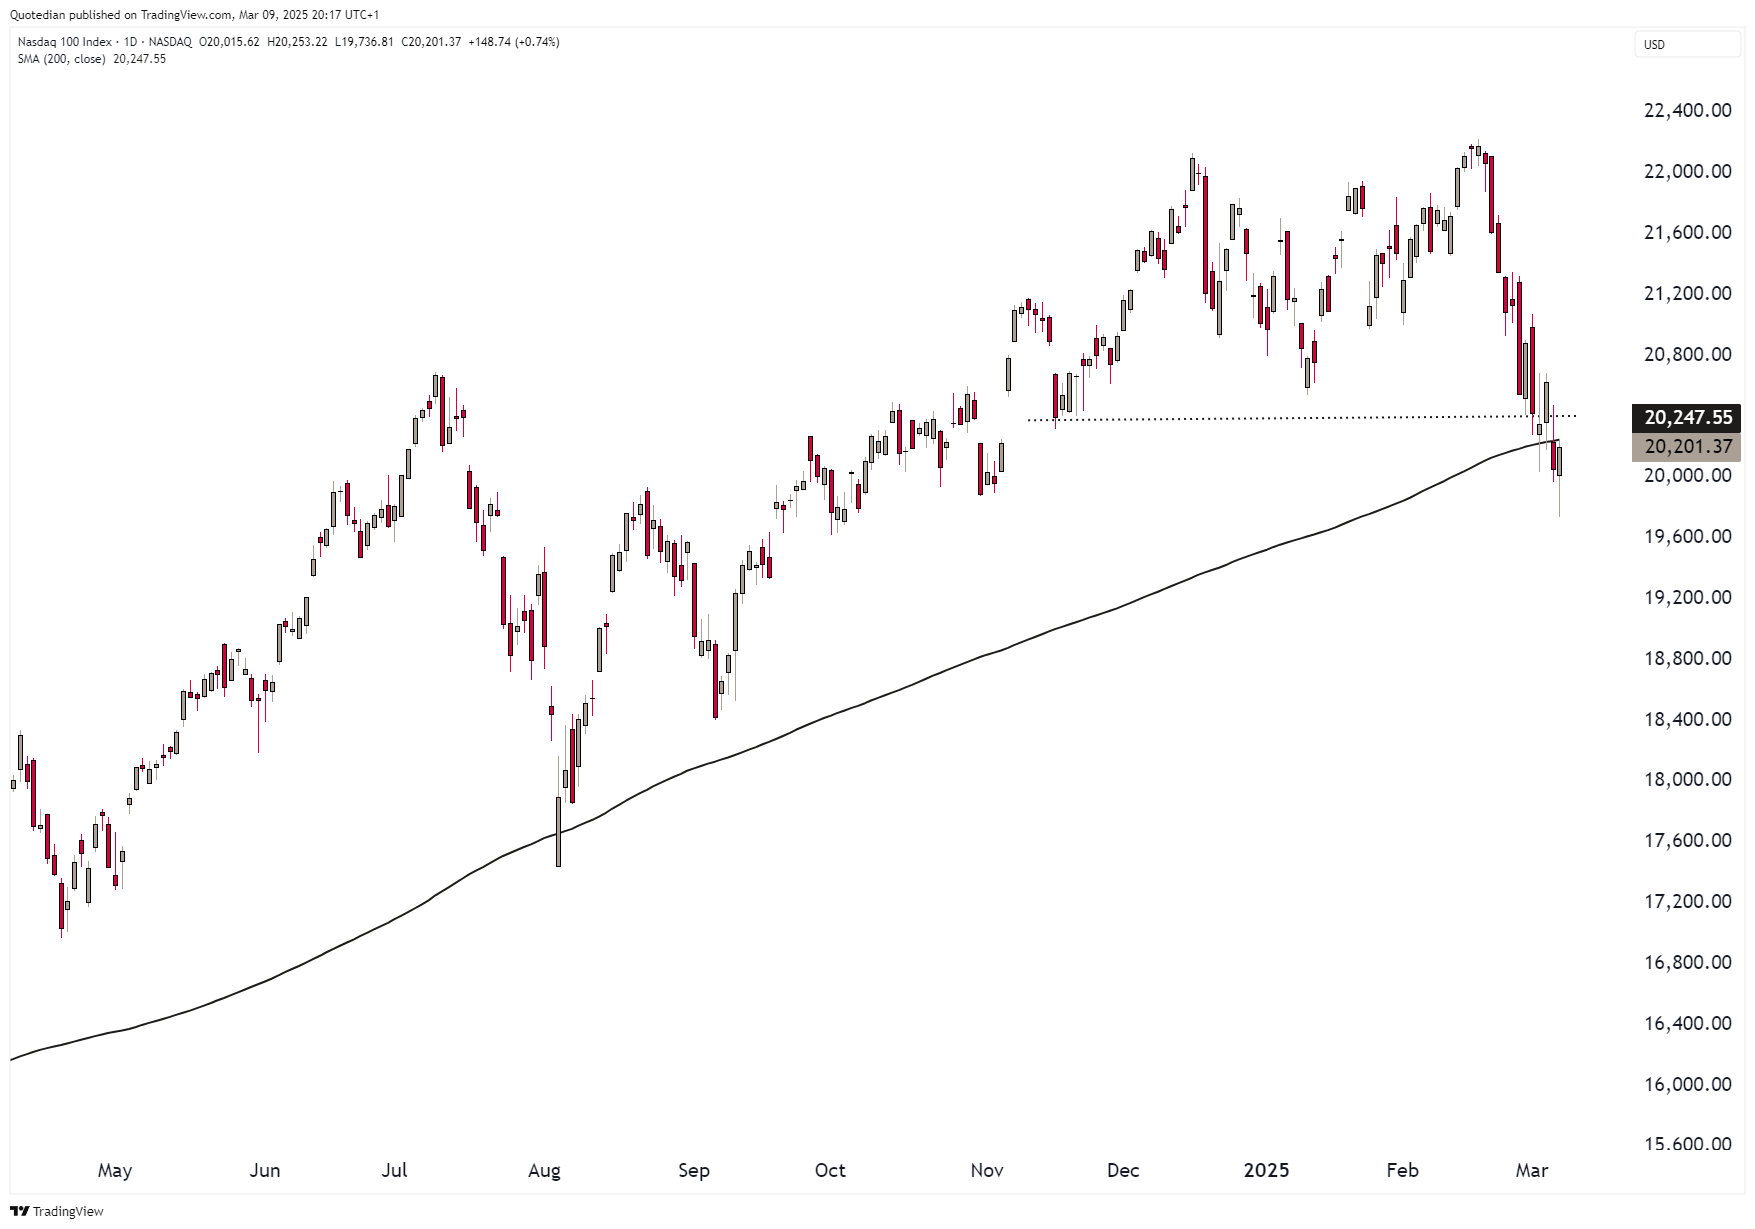
Here’s the daily chart of the S&P 500:

Very clearly, bulls and bears are carrying out an epic battle at the 200-day moving average (black line). Here’s a close up:

For now, the index has not closed below that aforementioned 200-day MA, but the series of lower highs and lower lows continues. The index is down about six percent top to current, which classifies the move as a pull-back. A break would increase the possibility of a correction (10-20%) massively.
A clear and present danger.
There’s more to worry about. For example, the megaphone pattern on the same index:

A widening trend channel (aka megaphone) can have bearish OR bullish implication, but in the current set-up I worry about the former.
There’s more …
Breadth hast not been great, with a clear divergence between stock participating in the rally (less) and the index continuing to rise:

And our very own indicator of new 52-week highs versus new 52-week lows has shown substantial weakness:
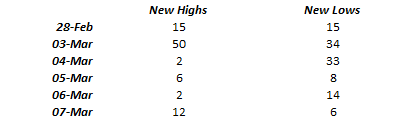
A clear ‘deprovement’ over the past few sessions.
Let’s turn to the Nasdaq now:
This index has closed below the 200-day MA for two consecutive sessions now, plus Friday the bulls were rejected below that MA, increasing the odds for further downside. The index delved into correction territory (>-10%) already Friday on an intraday basis, but a late, post-European close rally avoided that classification … for now.
Knowing this, the following tweet from the outstanding Jim Bianco at Bianco Research is enlightening:
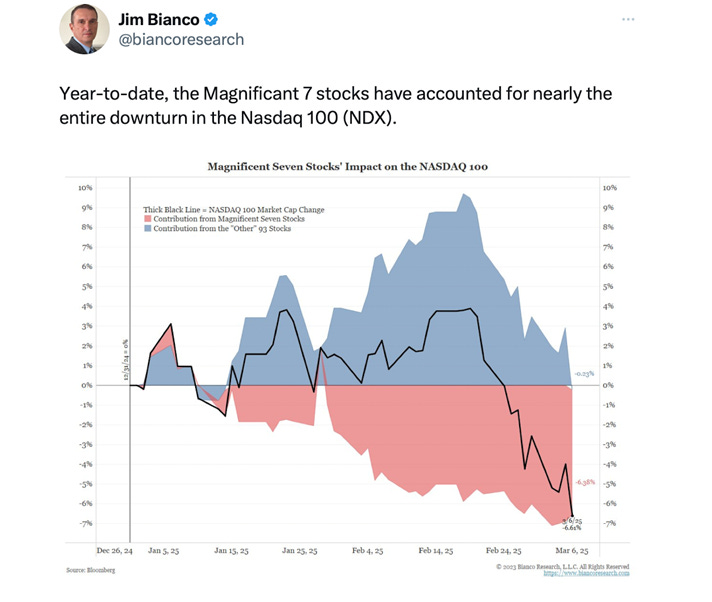
Taking a closer look at the bull-driver of the past two years, the Magnificient 7, we note that those are down 16% already:

Maybe we should call them now:

US small cap stocks (Russell 2000), which many (including us) thought would be the main beneficiaries of a Trump election win, are now 6% below the level of November 4th and 16% below the most recent top (25/11):

That call will need, well, patience…
So, according to the previous “Clear and Present Danger” charts we are all gonna day, right? Well, yes, one day… but here’s the strange thing. The MSCI EAFE index, below proxied via the EFA ETF, which is basically global developed markets ex-US and Canada, closed half a percent shy of an new all time high, with the ATH set in 2007(!):

Not bearish.
Hence, we are now in the area of our second quote of the week:
"The stock market has predicted nine out of the last five recessions."
— Paul Samuelson
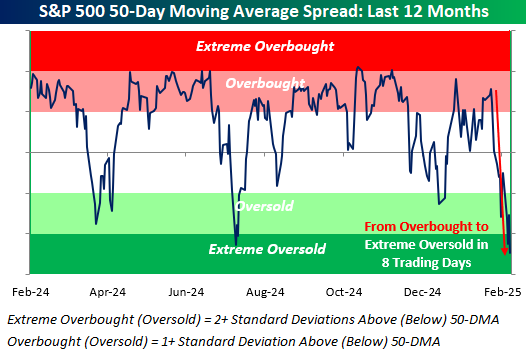
In the spirit of that the market sometimes gets ahead of itself, let’s look at some stuff to keep revive our spirits.
As the following chart from Bespoke Investment Group shows, the S&P 500 has gone from overbought to very oversold in 8 session:
Now, thinking of it, the S&P this year (red line) is following P-E-R-F-E-C-T-L-Y the script of the 30 past years (grey dotted):
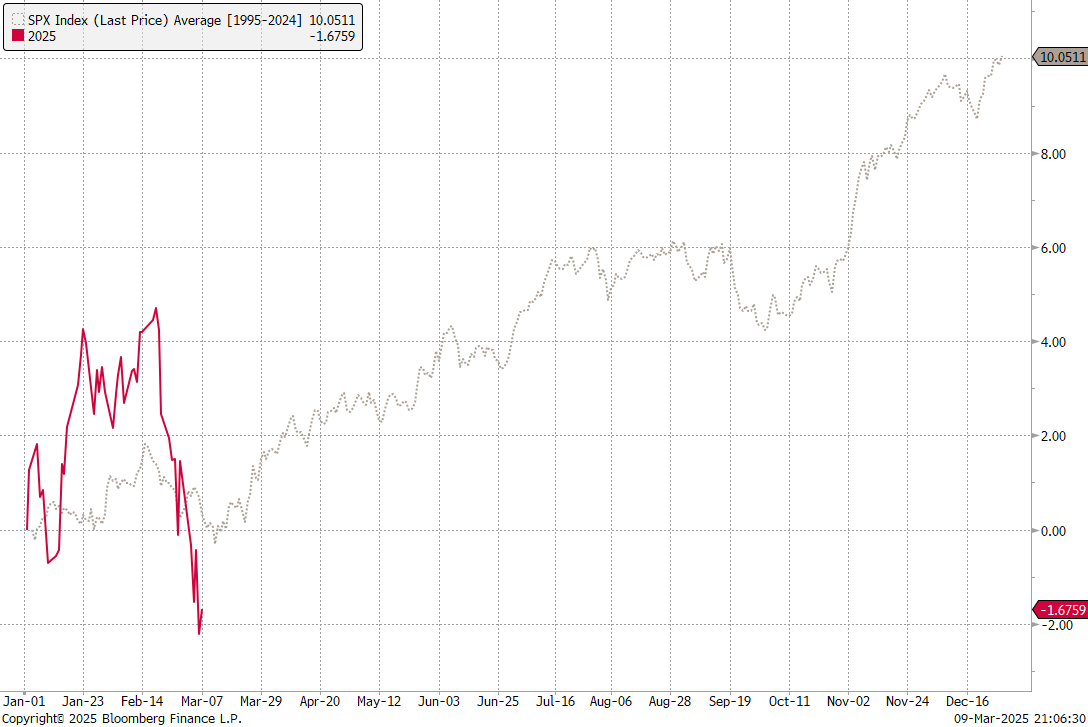
Mark March 12th on your calendar!
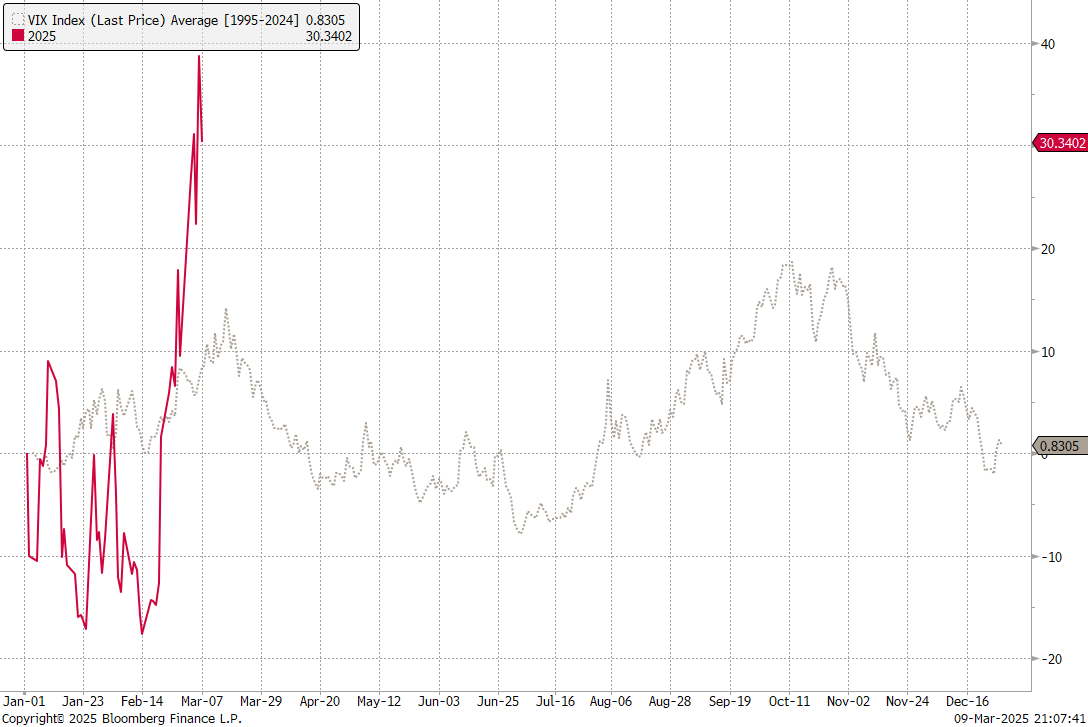
The inverse look, via the CBOE Volatility Index (VIX) also hints to a mid-March high for vola:
And then there is this dark voodoo magic chart fitting the picture:

What could possibly go wrong …
All this is happening at a time where sentiment is rock bottom. The number of bears in the AAII survey, is at levels usually associated with market bottoms or at least meaningful bounce:

CNN’s handy Greed & Fear index is also bombed out:

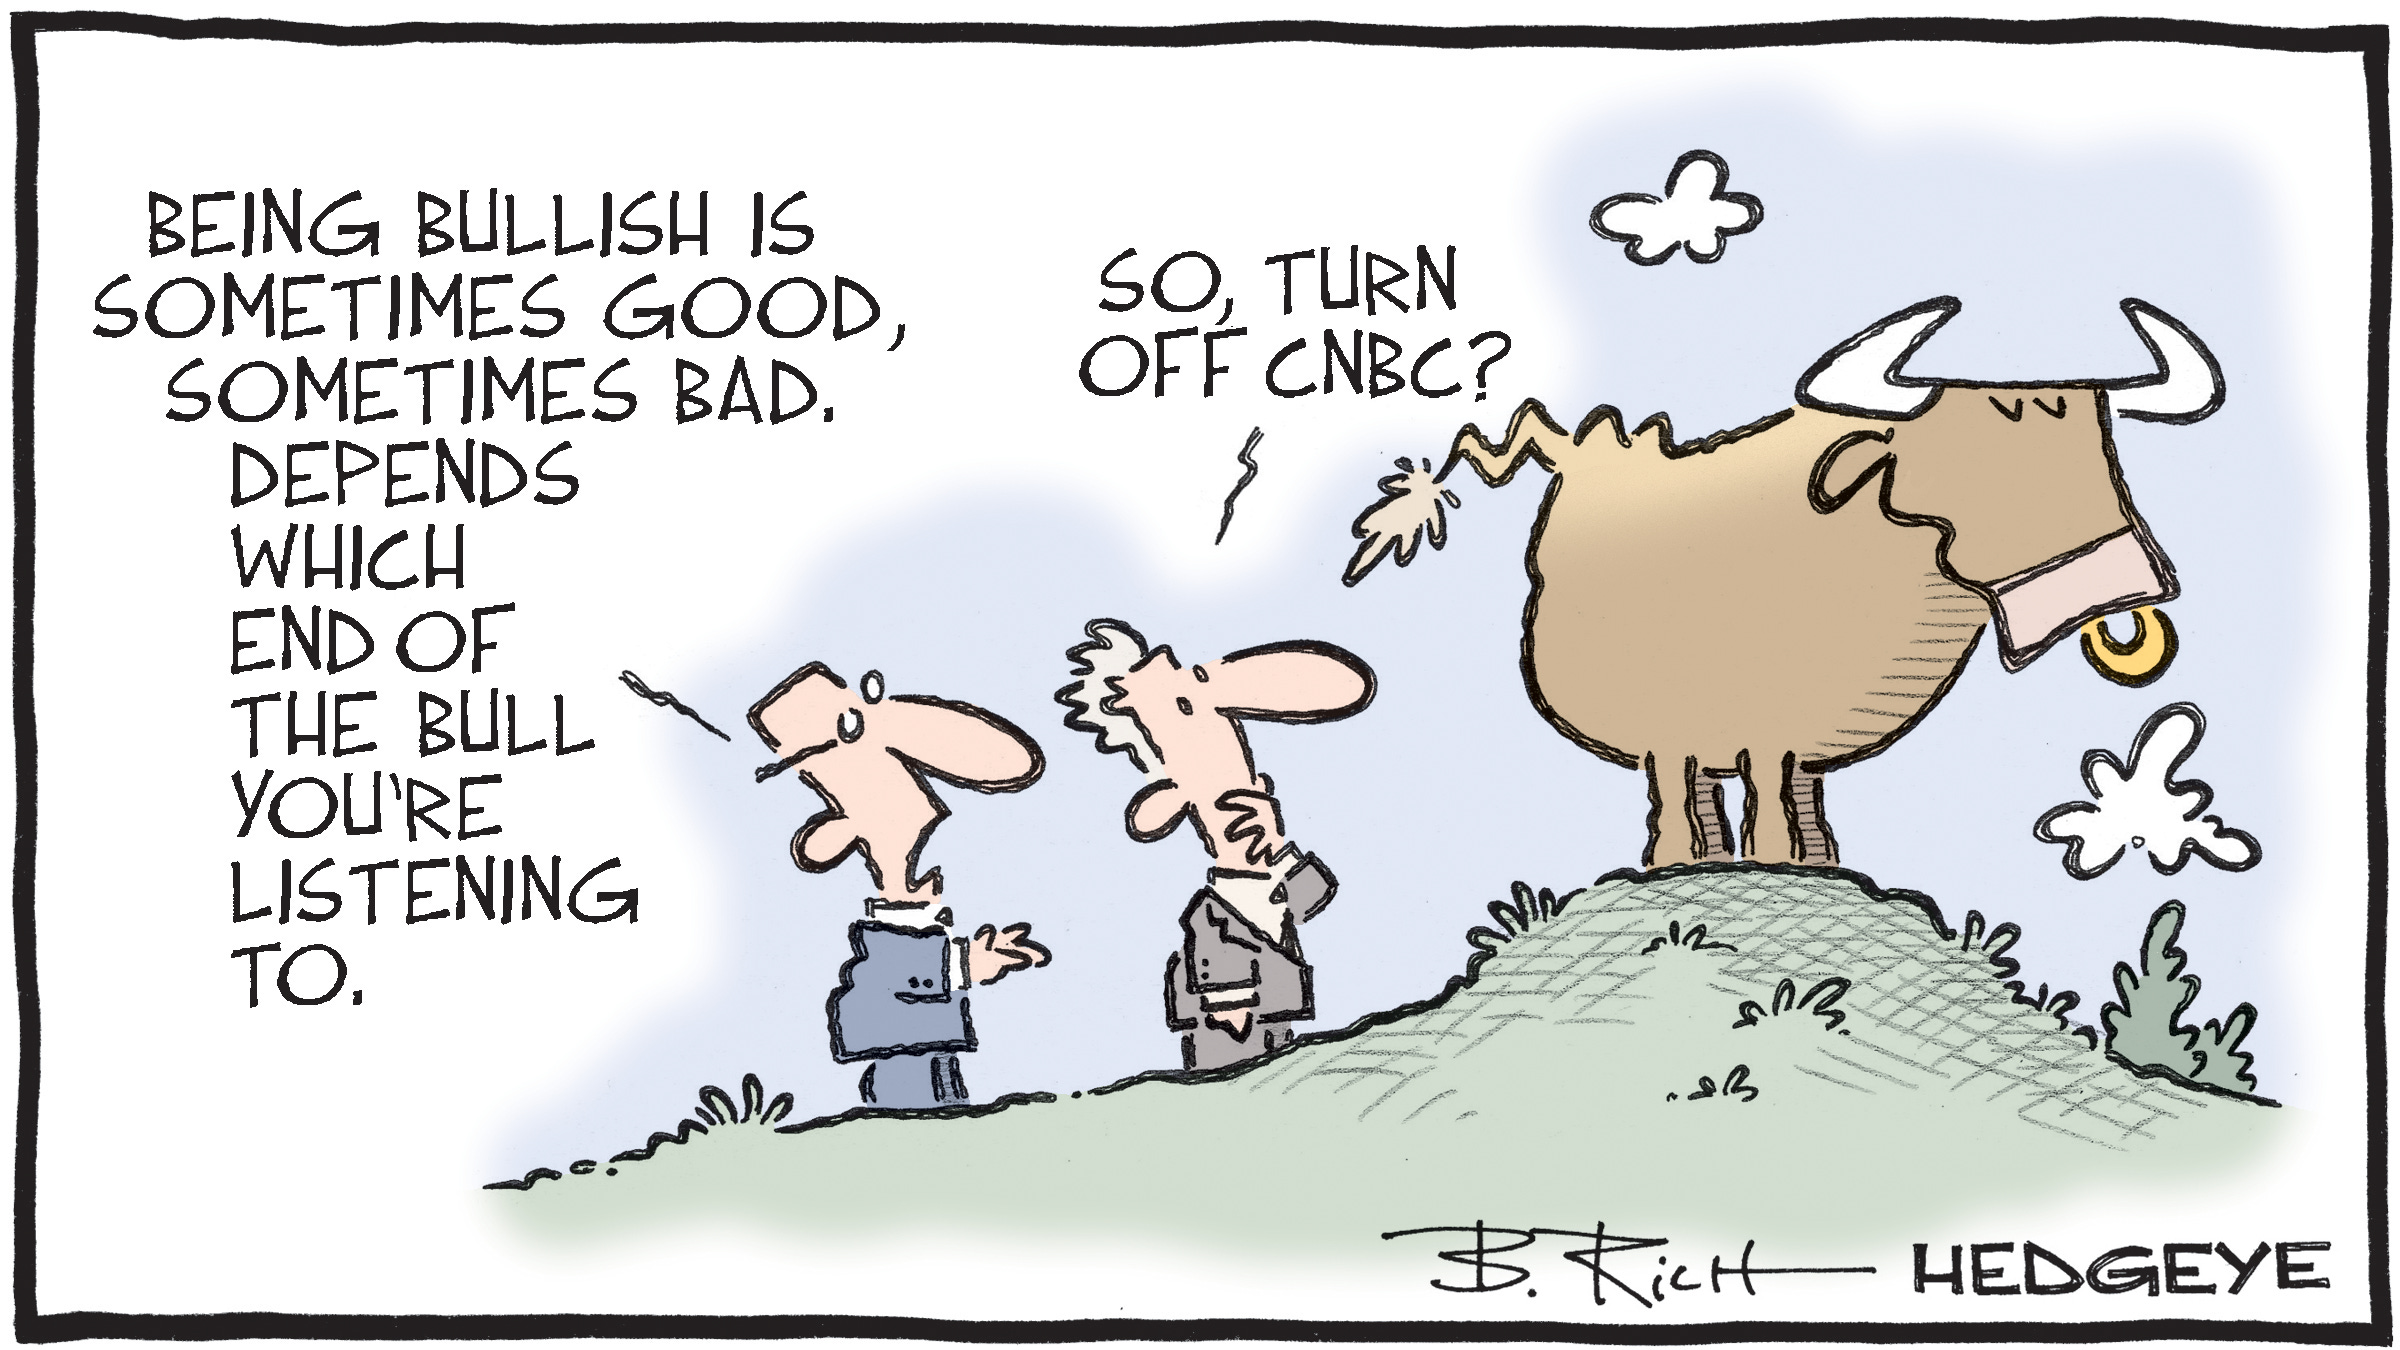
In conclusion, regarding the current situation for the US stock market, here’s the “graph” that sums it all up:
Ok, speed round on some major indices. Starting with Europe’s STOXX 600 index, we note extremely bullish price behaviour by that index:

Holding above support @550 and just 1.5% away from a new ATH, despite the weakness on Wall Street. Whatever happened to when Wall Street sneezes, Europe catches a cold?
In order not to bloat the equity section even further, I will not show the SMI and the Footsie-100 today, which show very similar patterns to the chart immediately above.
In Asia, Japan’s Nikkei is at clear and present danger of breaking lower:

Au contraire, India’s BSE500 may have found a footing, just a the upper end of our target zone we highlighted months ago:

A move above 32,900 (2% away from current) would be an initial confirmation that the worst may be over.
And then there’s China/Hong Kong. Tariffied of what?

Alright, time to move to some sector charts, starting with a glance at our propietary aReS model:

The rise of defensive sectors (Consumer Staples #1, Health Care #4) is as impressive as the downfall of the previous darlings (Technology #11, Consumer Discretionary #9).
In technology, that possible relative double-top we highlighted over 9-months ago for a first time remains intact:

Amazing, isn’t it.
Similarly, but at the other end of the performance gamma, we highlighted in early December how Consumer Staples stocks had hit a relative all-time low, which seems to have been the kickoff for a turnaround in the staples’ fortunes:

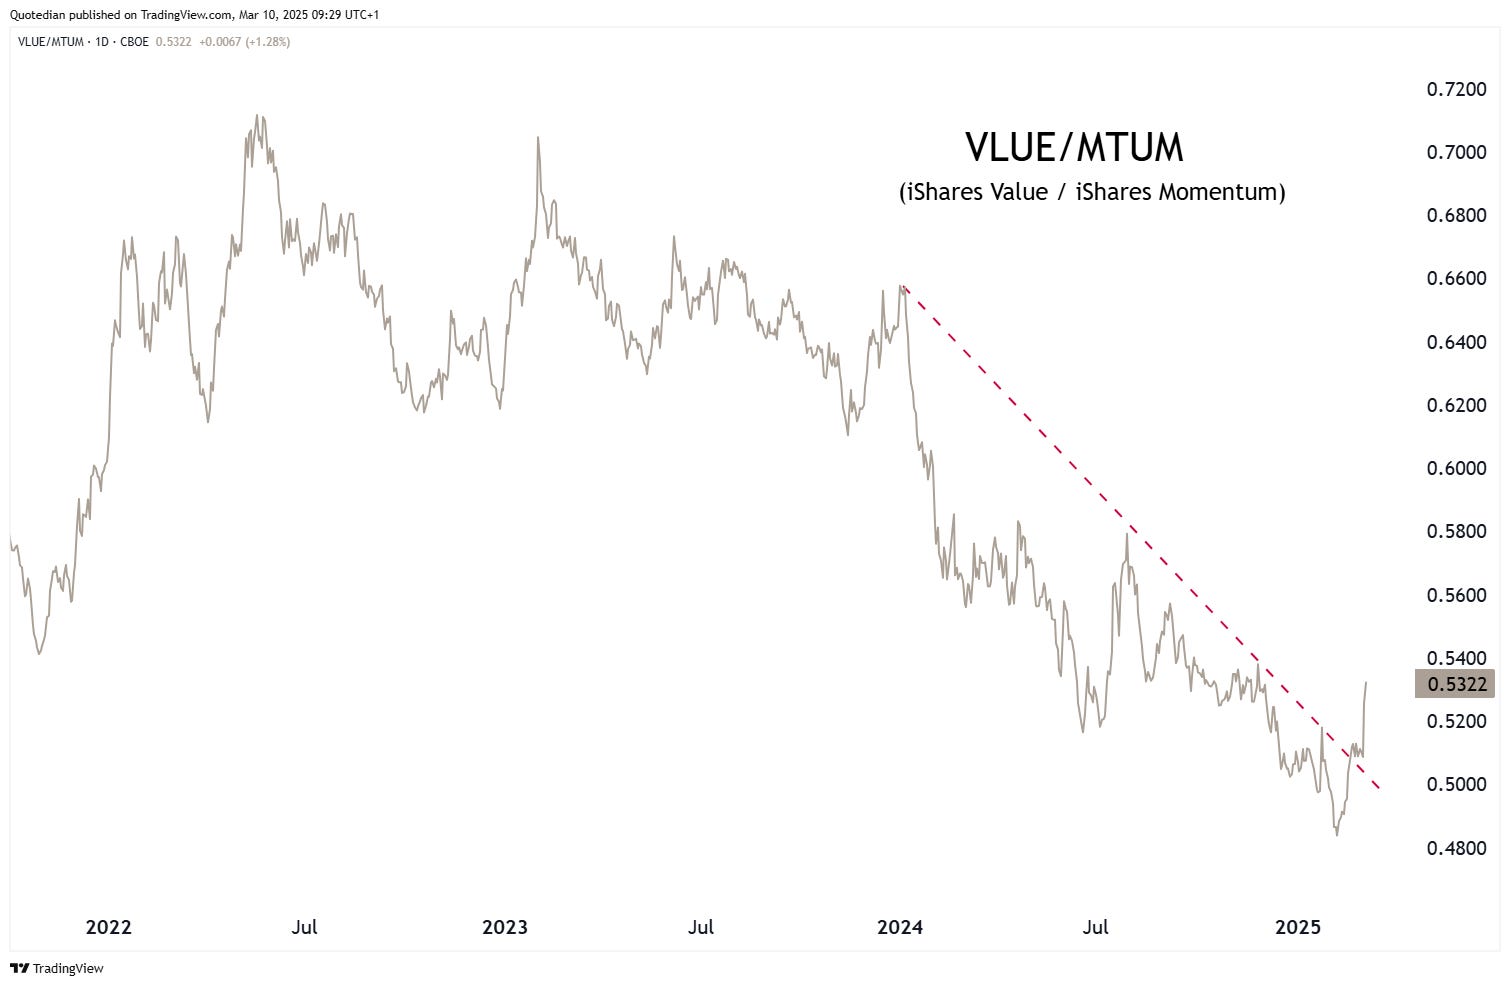
And speaking of performance gamma, a quick glance at the factor performance table is a telling story of what happened in markets last week:

The momentum crash is very evident, what is less so is if it just another pause as we have seen so many time during cyclical bull markets

or, if we have regime change at hand:
Alright! High time to have a look at one of our favourite parts of the newsletter: The top 25 performing stocks in Europe and the US on a year-to-date basis and their %-change over the past week.
As usual, let’s start with the US (S&P 500):
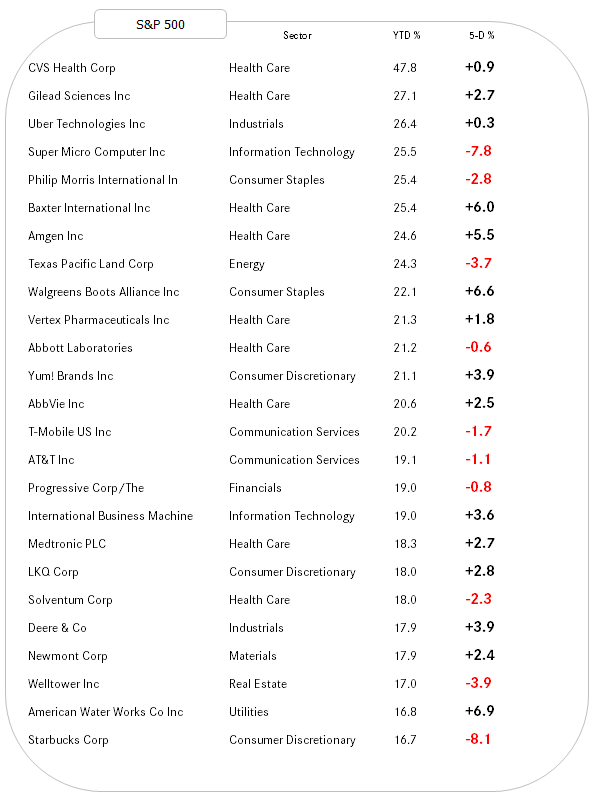
Remember that the S&P was down in excess of three percent last week? Very comforting then to see that many of the best performing stocks have continued to up. Don’t overthink it - strength begets strength.
Here’s the European (STOXX 600 Europe) list now:
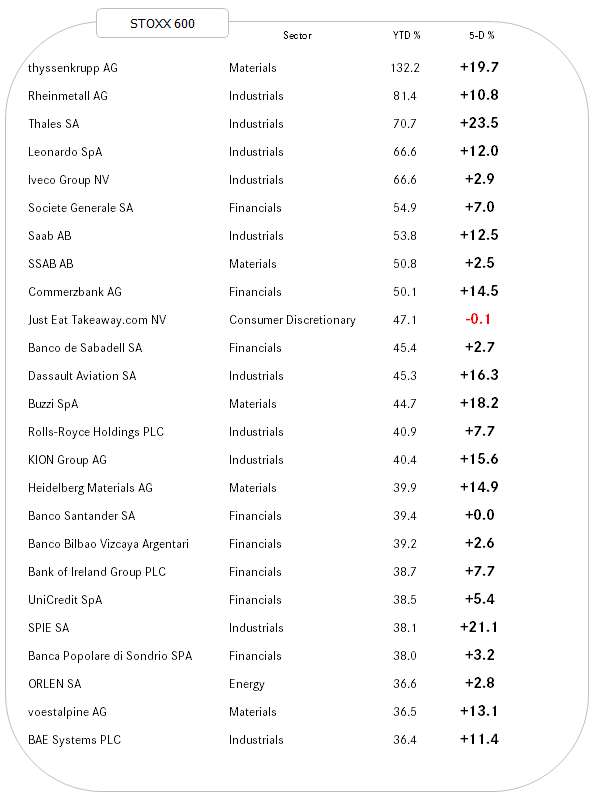
One, just one stock (TKWY) had a negative performance of a scandalous tenth of a percentage point last week. Don’t overthink it - strength begets strength (repeat intended).

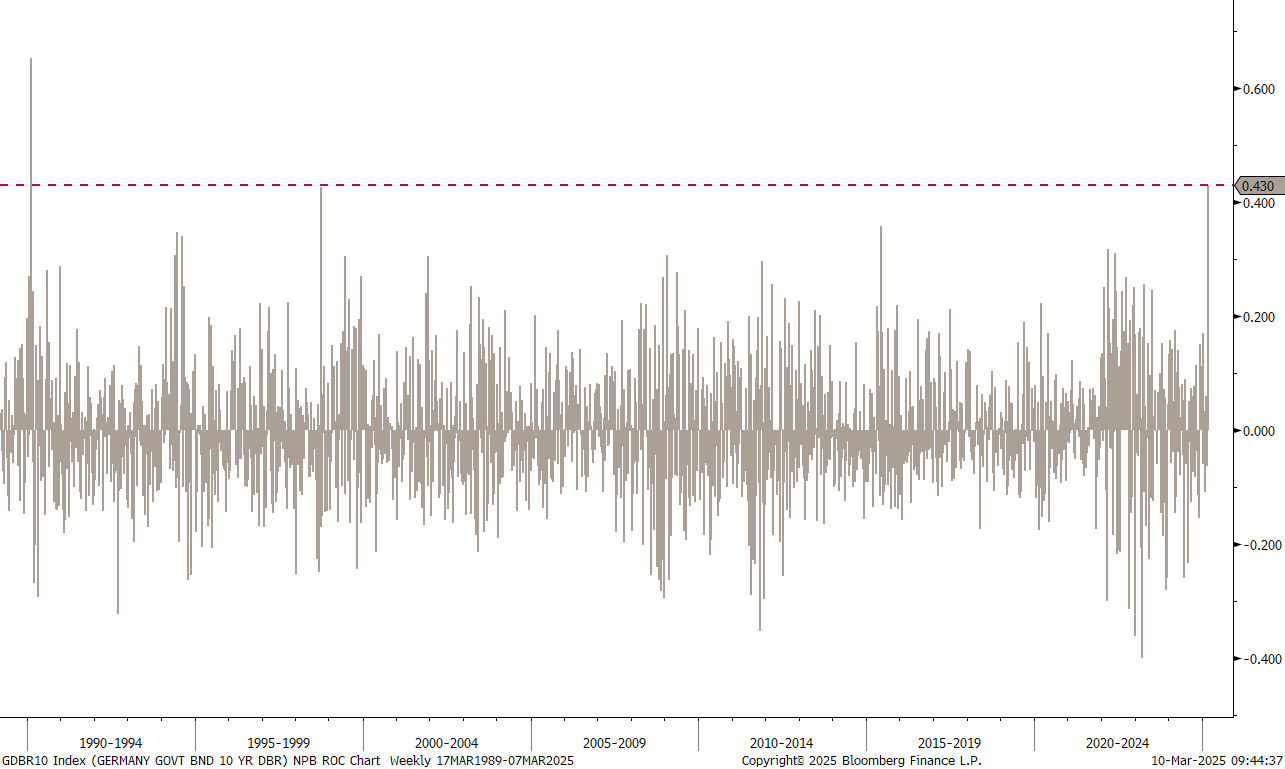
In the wonderous world of interest rates, focus was clearly on the European rate complex last week. Taking the Bund (German 10-year Government Bond) yield as a proxy for the zone, the move observed has been truly extraordinary:

On a weekly basis it has been the largest move since the German reunification:
Of course, we also had the ECB cutting their key policy rates for a sixth time in the current cycle last week:

At first, I was slightly sceptical regarding the necessity of the cut, given the tectonic shift (read: spending intentions) by the Eurozone and in light of how Bund yields reacted to those. But given that they had well telegraphed the cut in advance, it was probably best for their credibility to follow through with the cut and accompany it with a hawkish press conference.
And indeed did rate cut expectations come down nearly by two cuts last week, with only one done:

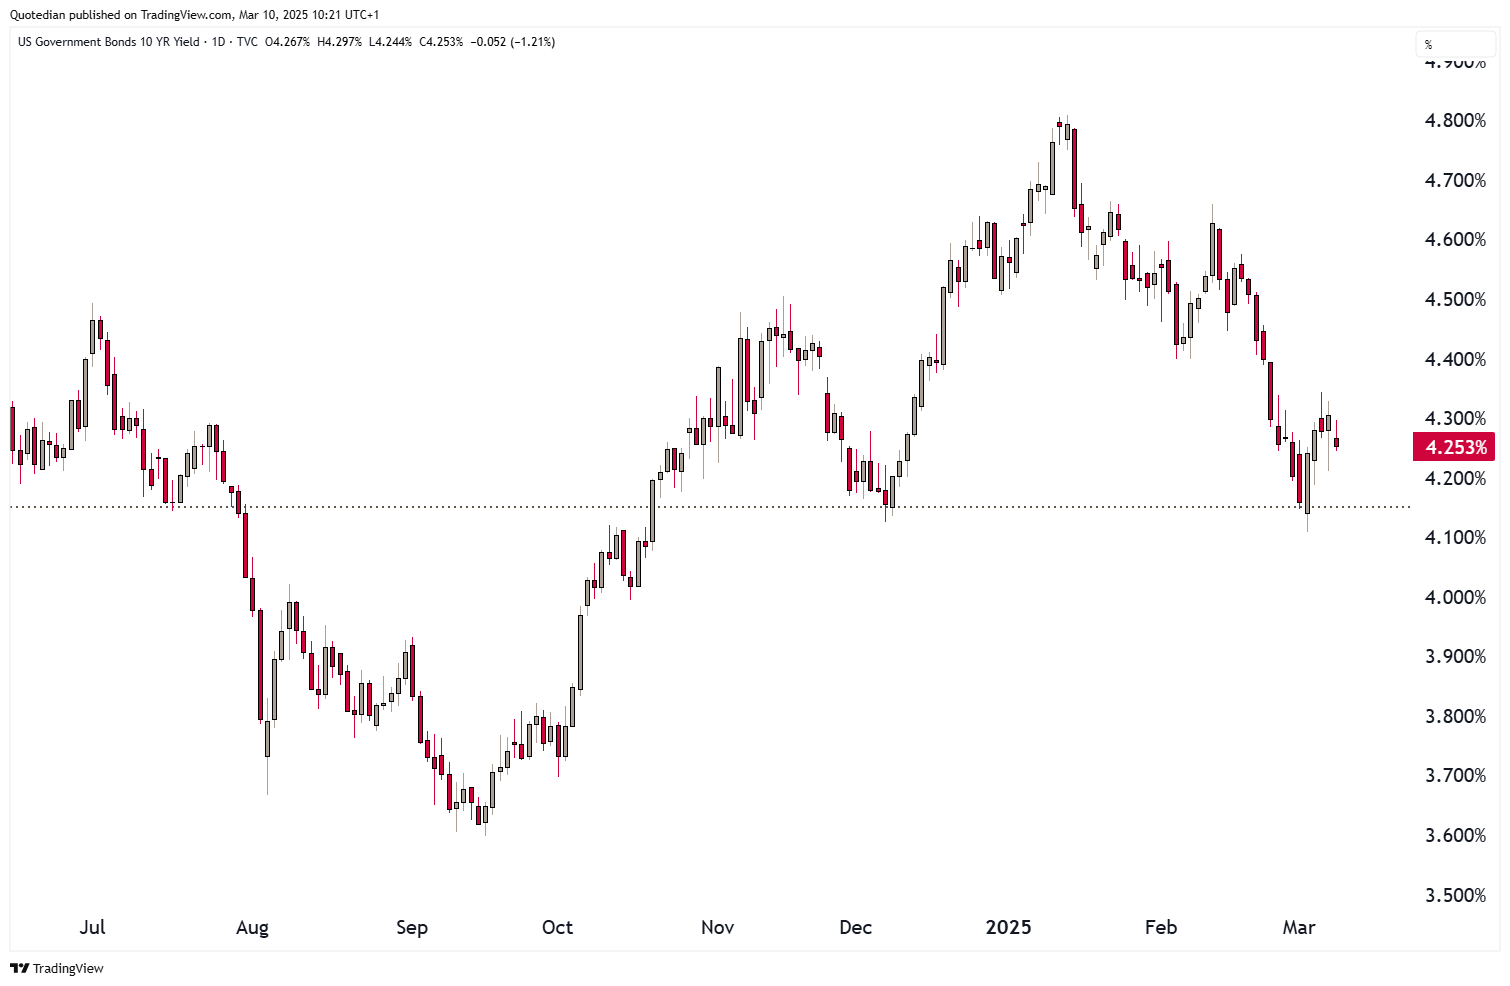
In the US, 10-year yields rebounded from key support at around 4.15% - but rather unconvincingly so:
Weaker economic data readings, now spreading into the employment market too coupled with still stubbornly ‘high’ inflation numbers, have made the word Stagflation a popular search term again:

Last week several agencies reported their take on the US labour market. The Challengers US Job Cut Announcements version was a bit a shocker to the market:

But should it be, given all the DOGE initiated government layoffs?
Credit spreads have finally shown also a widening, but continue at record tight levels:

In the US High Yield space, I would hold a close eye on the Consumer Discretionary spread if layoffs continue (and remember the “Wealth Effect” discussion from further up):


In mythical world of foreign currency exchange rates, here’s chart I have been showing the past week(s) to explain the sudden top-of-pinhead turn in the EUR/USD cross rate:

The grey line is the EUR/USD FX rate on the right-hand-scale, whilst red is the inverted the US minus the German 10-year yield spread. With US rates heading south over the past weeks and the sudden “northern” explosion in European rates, the change in interest rate differential become to important to be ignored by FX traders.
Where are we heading now? Well, overall, we are still in a 2-year old, wide trading range of 1.02 to 1.12:
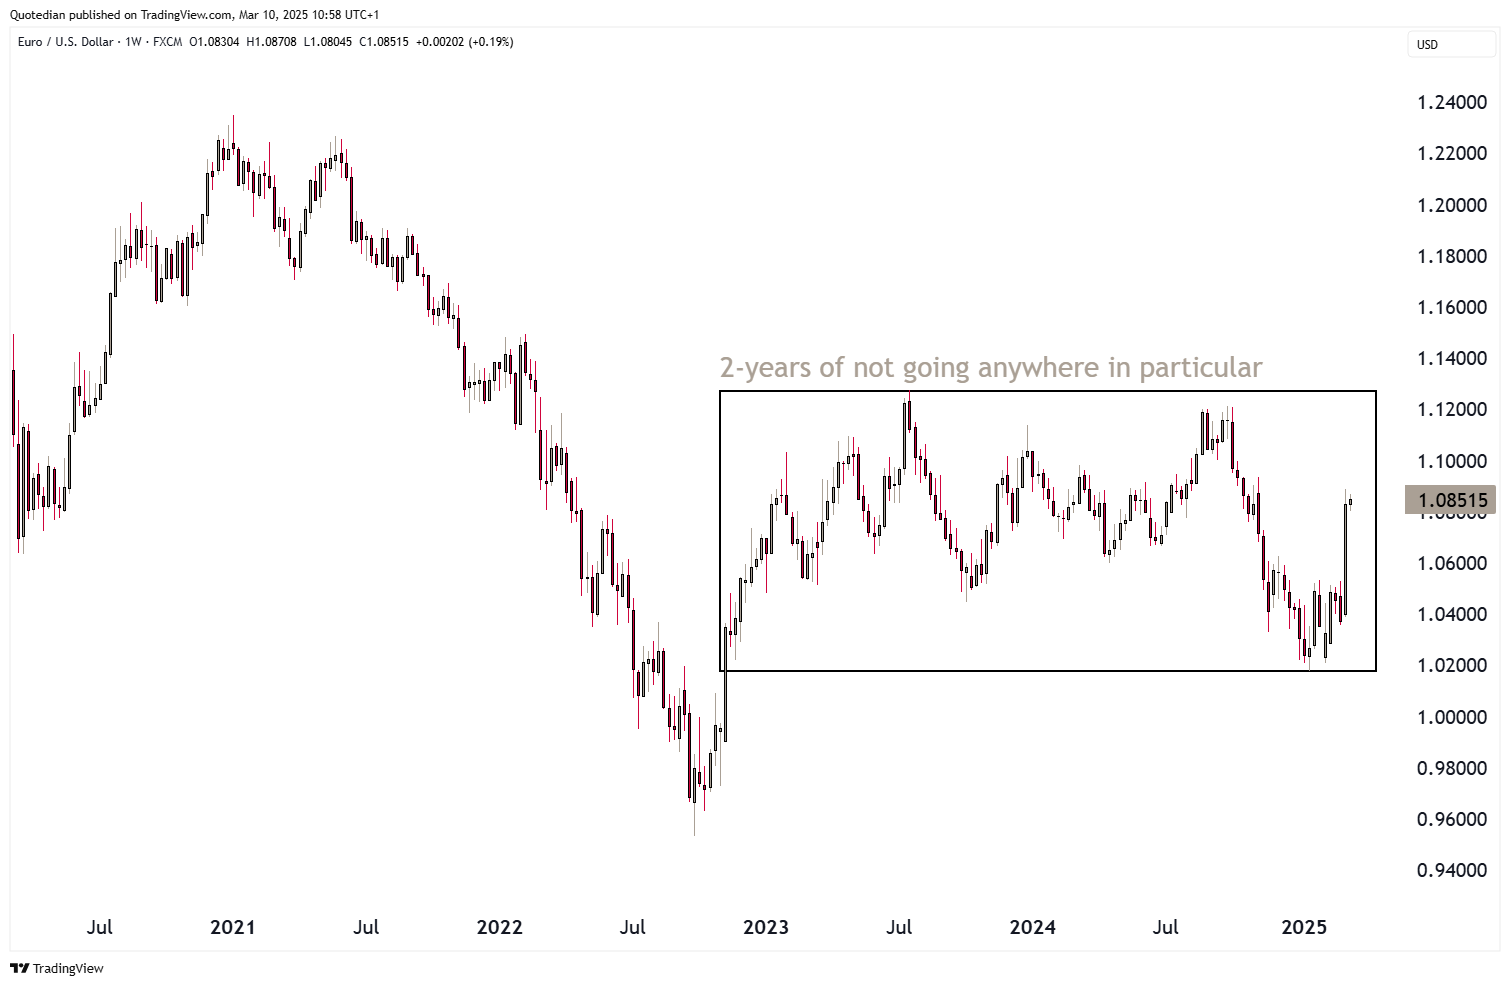
Zooming in and twisting my arm behind my back, I would guess that a down-then-up sequence could unfold:

But the US Dollar’s weakness has not been just versus the Euro. Over the past week, the Greenback is lower versus just about anything:

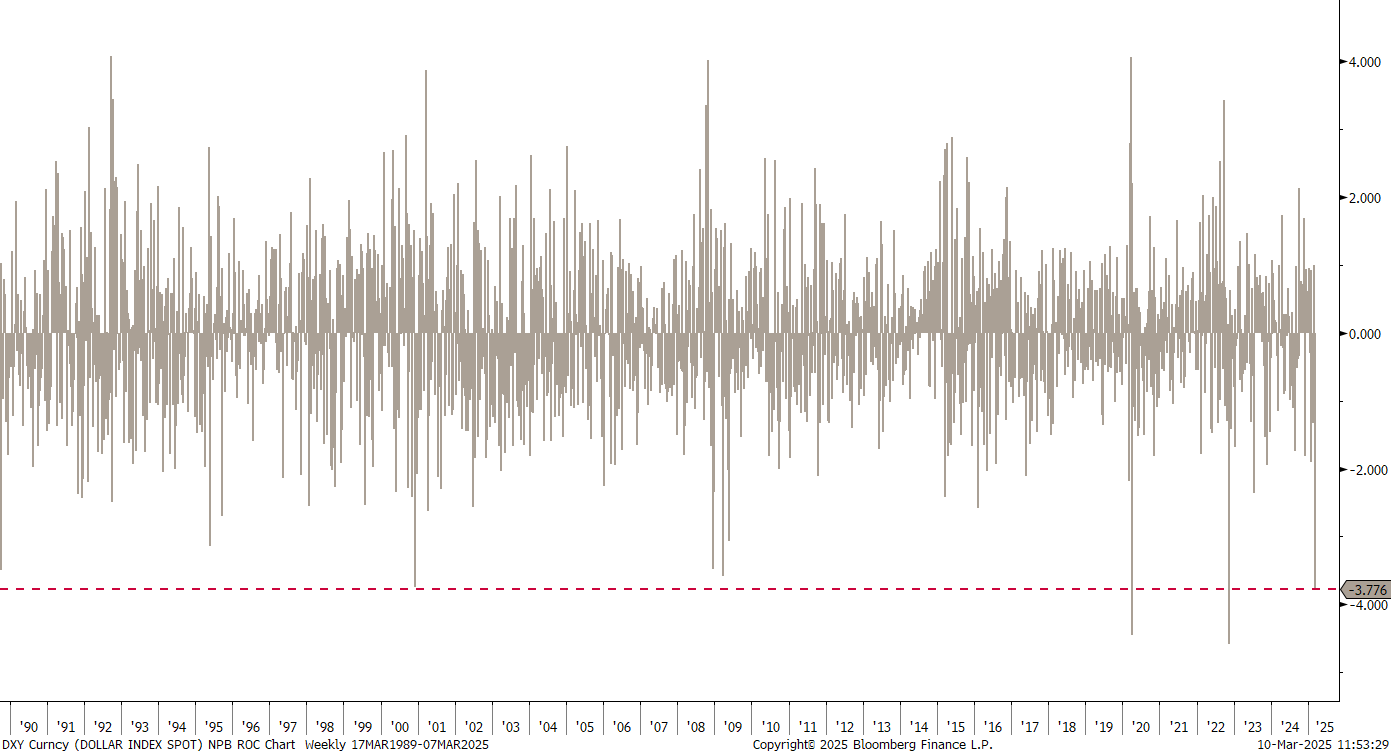
Trump’s inauguration on the 20th January has indeed been a turning point for the USD. Here’s the Dollar Index (DXY) chart:

As a matter of fact, only two weeks have been worse for the USD (DXY) than last week over the past 25 years:
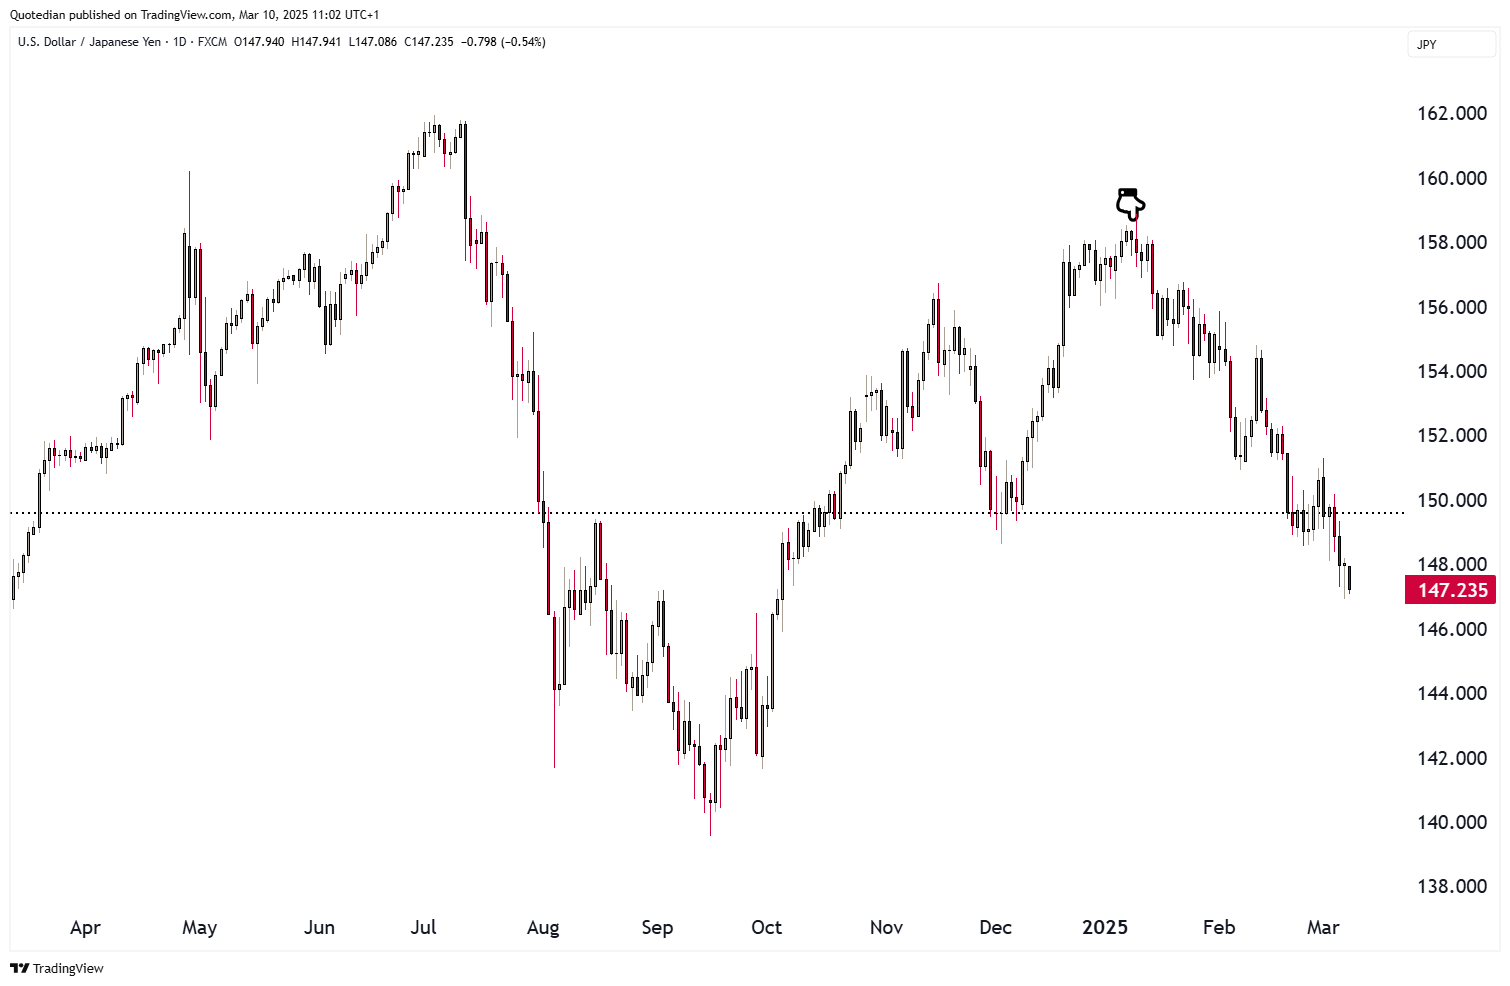
Our short USD/JPY trade is picking up pace very satisfactorily:
The Dollar/Swissy has after initial resistance also started to weaken and is now at key support (dotted):

But, if you are looking for something that has been even weaker than the Dollar …. look no further! Here’s the performance of some popular cryptocurrencies over the past five days for you:

I think it was last week or the week before where I joked that this was your last chance to buy Bitcoin above 90k. Well, now’s maybe your last chance to buy it above 80k:

Target 73k-ish?

In the commodity realm, Gold seems to have already finished its pull-back:

But before we get overly excited for potential Gold upside, let’s look at it unemotionally (i.e., like a pro):

Add to the position only above 2,950. Reduce exposure only below 2,850.
Now, Gold is not only in an uptrend versus the US Dollar (see charts above), but also versus the S&P 500:

The longer-term (5-years, weekly) suggests that we may be on the cusp of a multi-year breakout:

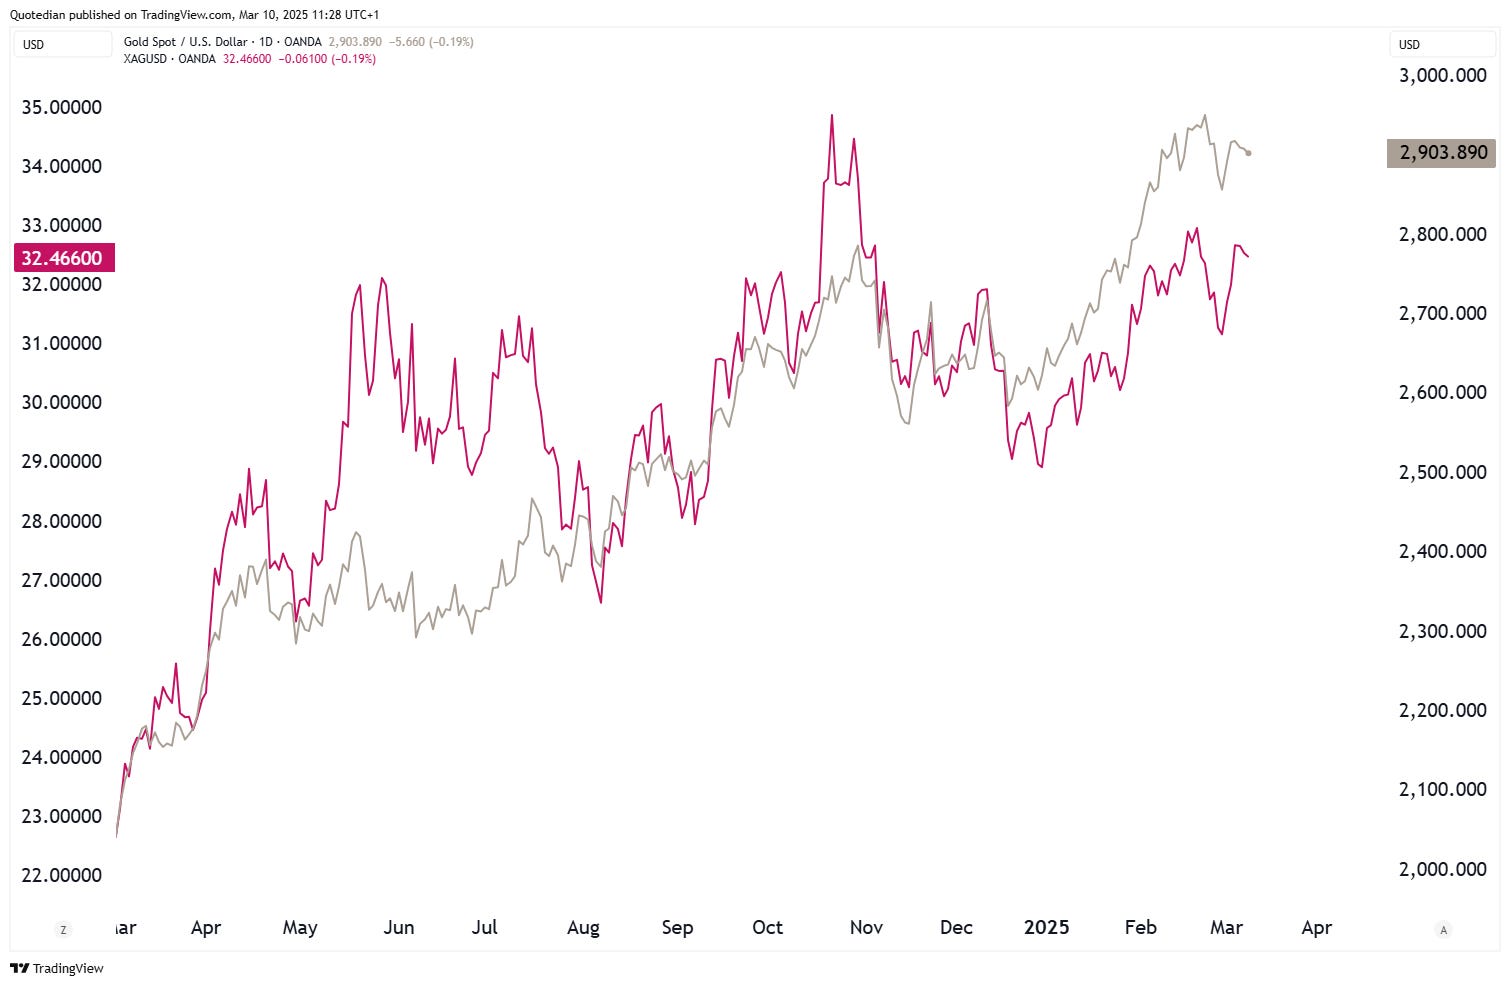
Gold (grey) and Silver (red) continue to trade “in sync”:
Oil prices (grey) have been front-running US 10-year yields (red),

but both suggest at minimum a mid-cycle slowdown ahead.
For (US) natural gas, other dynamics are at force:

Volatility is extreme, with the price of NG up close to 150% since early September, but does two rapid correction in October and January representing 25% respectively 30% moves!
But the trend is up and that view is reinforced when looking at the longer-term picture:

Canada tariffs yes, Canada tariffs no, yes, no, yes, no … very confusing. Lumber futures (a lot of lumber comes out of Canada) have increased by 30% since mid-December to a recent peak, and despite having come down a tad since that peak, the long-term picture has very bullish implications for Lumber prices:

Time to hit the send button, but just before I do that, let me show you two pictures from the fantastic Ted Gioia at The Honest Broker (click here).
The first one is an excellent summary of the Dopamine Culture:

And this one on how corporate logos have evolved has shocked (i use that word on purpose) me:

Uniformity all abound …
Alright, that’s it for this week. Same time, same place, next week. And don’t say I didn’t warn you.

Everything in this document is for educational purposes only (FEPO)
Nothing in this document should be considered investment advice
Investing real money can be costly; don’t do stupid shit
Leave politics at the door—markets don’t care.
Past performance is hopefully no indication of future performance
The views expressed in this document may differ from the views published by Neue Private Bank AG