Climbing the Wall of Worry
The Quotedian - Vol V, Issue 106
“You make most of your money in a bear market, you just don’t realize it at the time.”
— Shelby Cullom Davis
DASHBOARD
AGENDA
CROSS-ASSET DELIBERATIONS
Alright! This is the last weekly vacation update - we are back to the daily publishing schedule starting Tuesday.
So, let’s take our weekly review approach of the past month to get us up-to-date on what has been going on and then we will examine some developments closer over the coming few days. Let’s dive right in!
Starting with equities, the risk-on mood continued with an excellent performance scorecard over the past five days:
It is of course, once again (sigh), the most hated rally EVER, as many investors have been caught Über-Bearish and Under-Weight this asset class. I mean, we all just KNEW how horrible the earnings season will be (yours truly included). However:
With over 90% of the companies in the S&P 500 having reported their Q2 earnings, the picture is one of more positive than negative surprises in revenues and profits. Yes, some early reporters such as retailers Walmart and Target disappointed severely, however, earnings of higher-end consumer stocks have held up better-than-expected. This proves that (once again) screwflation inflation is largely impacting the poor.
Even the basket case of the European Rim with all of its zombie companies did noticeably well during the second quarter of the year (80% reported):
But of course, the big ‘issue’ of last week was the US CPI finally (but maybe only temporarily) peaking, which triggered another move higher in stocks. Does this make sense? You can argue both sides, but as we have discussed on many occasions in the past: “Don’t fight the Tape”. And the tape is moving higher. Remember the falling chart I showed last Sunday?
I said:
“Thereafter, 4,229 (green line) would be the “last excuse” for equity bears to hold on, which is the 50% retracement of the entire down move.”
Well, this is the updated chart as of this Sunday:
Nothing to argue there.
At the same time, investors’ sentiment is only slowly improving with still more bears than bulls when taking the AAII weekly survey as a gauge:
Another point of interest is that in my proprietary asset allocation model equities have now jumped to the top spot (most favourable) in the course of just three weeks. At the same time, commodities have dropped to least favourable in a very short time span:
As you can see from the allocation chart above, positioning tends to be pretty constant over several months (every dot represents a week).
However, the wall of worry to be climbed remains high, as we are closing into September, the usually most volatile (and on average worst) month of the year:
Plus, we have the upcoming US mid-term election, which could also act as a headwind until early November.
Moving into fixed income markets, it was a flattish weak for US yields, with a slight upwards drift at the longer end, leading to some reversion of the strongly inverted yield curve:
With equity markets continuing in rally mode, credit spreads also continue to tighten, both in Europe and US and in investment- and non-investment grade:
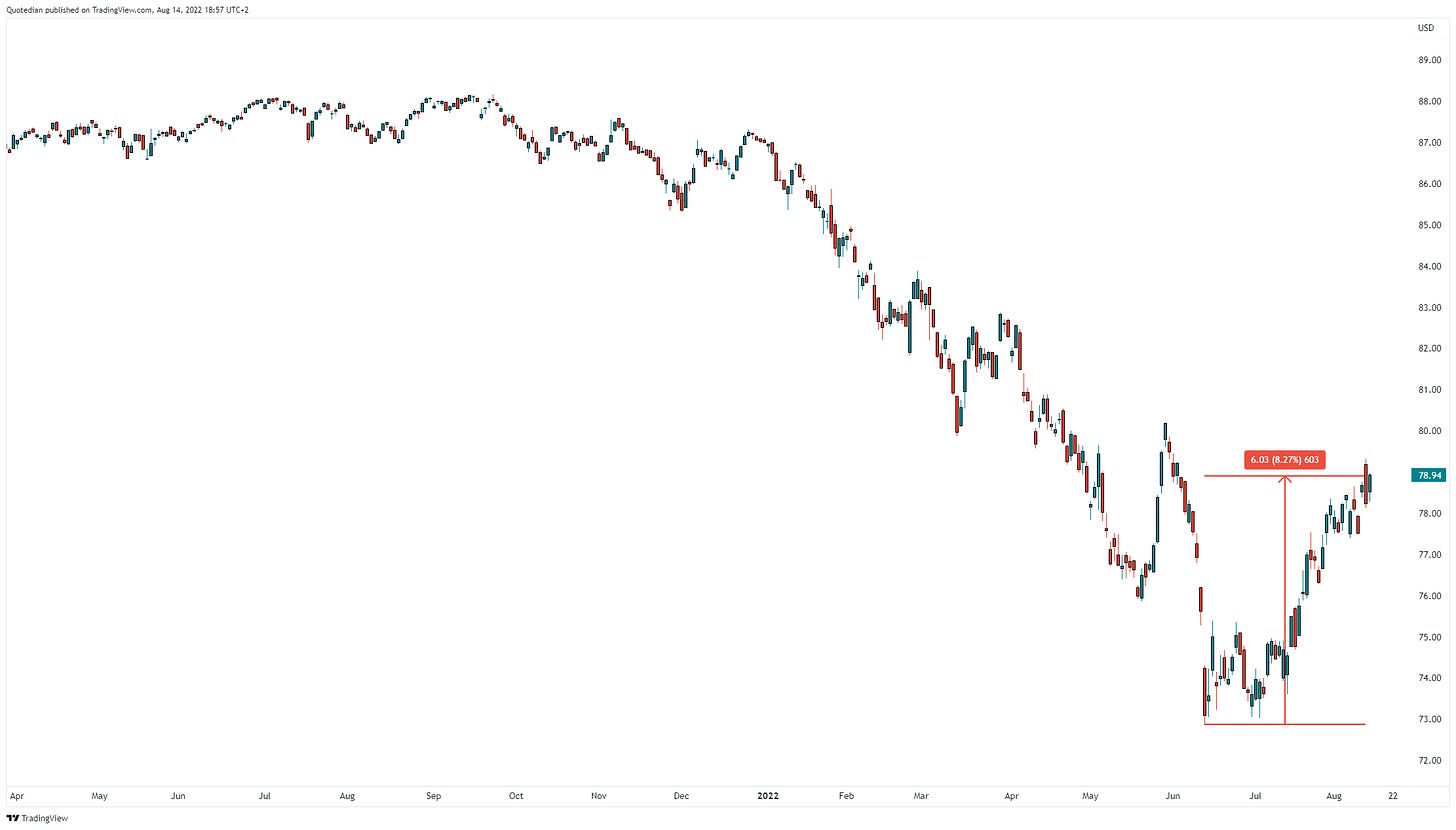
This can then of course be well seen in the rally of high yields bonds. Here’s the iShares iBoxx High Yield Corporate Bond ETF for example, up over 8% from its recent lows:
The combination of flattish yields and contracting spreads is then reflected in the weekly performance table, with corporate bonds outperforming govies:
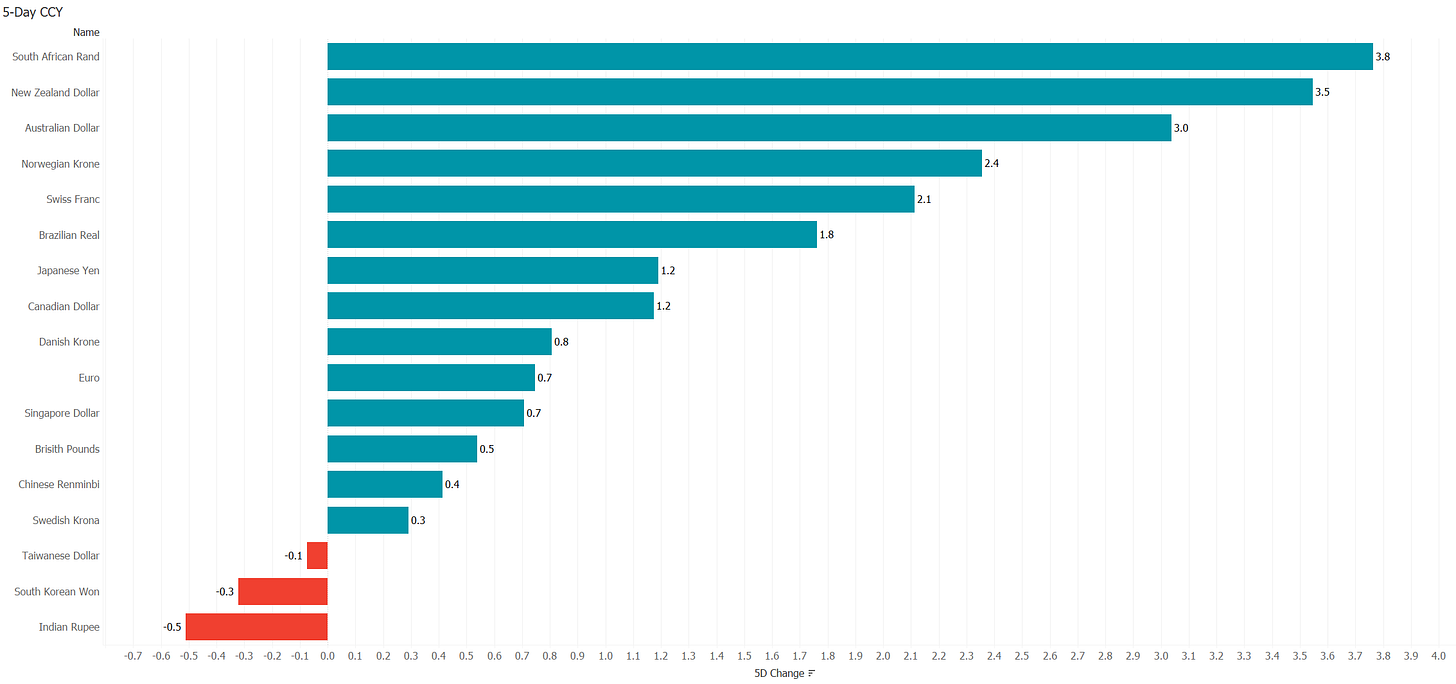
Pushing on into currency markets, the weekly performance below shows that the US Dollar fell against most currencies, most likely as a direct result of the lower-than-expected CPI print:
Looking at the US Dollar Index (DXY) the current correction can be continued to be defined as just such. A close below 105.00 would be a first warning sign of a medium-term trend change, whilst a close below 103.80 would be confirmation thereof:
On the EUR/USD chart those levels translate to approximately 1.0400 and 1.0780 respectively:
And finally, moving into the commodity space, it was a good week for this asset class after the fore-mentioned US Dollar weakness was probably the biggest driver:
Gold, albeit one of the smallest advancers last week, continues to exhibit one of the best trend reversals. Here’s an update to the chart already shown last week:
Oil (Brent) has worked its way back into our previously defined (and violated) trading range. A small advance from here to above $100 would be very constructive:
And finally, don’t look now, but copper is up over 15% from its recent lows, possibly signalling renewed economic strength which would destroy the narrative of central banks cutting rates as early as next year:
And talking energy here’s a meme out of the category “sad but true”:
Time to hit the send button, but remember, starting Tuesday we are back on our daily publishing schedule. And, as mentioned at the outset of today’s letter, next week we will look at each asset class in some more detail.
Don’t forget the hit the ‘Like’ button at the bottom (only if you like the Quotedian of course).
CHART OF THE DAY
The following chart from the always brilliant Andreas Steno Larsen could be titled “OMG!”.
LIKES N’ DISLIKES
Improved section coming soon
DISCLAIMER
Everything in this document is for educational purposes only (FEPO)
Nothing in this document should be considered investment advice
Past performance is hopefully no indication of future performance


