Consumers throwing in the towel
The Quotedian - Volume V, Issue 88
"Successful investing is having everyone agree with you… later"
— Jim Grant
DASHBOARD
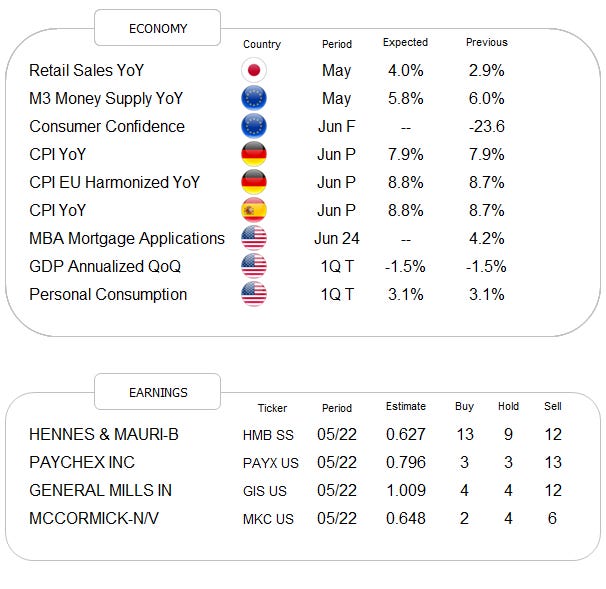
CALENDAR
A curated list of economic data and earning reports
CROSS-ASSET DELIBERATIONS
Well, I guess Turnaround Tuesday works both ways and if the past few sessions have been up, it was time for (big) down. It seems that markets gave away under the pressure of a series of negative consumer confidence readings. In chronological order it looked liked this:
Germany - GfK Consumer Confidence
France - Consumer Confidence
US - Conference Board Consumer Confidence
Even though the first two reports were much worse in terms of their proximity to previous lows, it was this last, US conference board report in combination with a awful regional manufacturing reading from the Richmond Fed, that marked the top in equity markets for the day:
In case of the latter, the Richmond Fed manufacturing index it is important to note that this was the third out of four regional Feds reporting a contracting manufacturing activity. Chicago reports on Thursday, with the national ISM number out on Friday.
Anyway, the S&P closed down the day two percent, whilst the growthy stock Nasdaq managed a three percent drop. The S&P 500 intraday heatmap shows quickly that only one sector (energy) was up on the day:
So, all in all, the prevailing cyclical (secular?) bear market gained overhand yesterday, despite quarterly rebalancing, which, in theory, should provide some important tailwind for stocks over these past few sessions of June. Yesterday’s sell-off leaves the technical picture in an awkward situation, with the pattern of lower lows and lower highs still in place, but also the June 16th bottom remains valid for now. I would not take any aggressive bet until either side breaks, keeping in mind that the prevailing longer-term trend is DOWN, until proven otherwise:
Moving to fixed income markets (kind of), we observe then that in the tug of war between equity bulls and bears, it was then that the chart I highlighted yesterday of high yield bonds failing to confirm the equity up move that won the day.
Asian markets are down across the board today, as are European equity futures, though as a ‘green sprout’ US futures are trading firmer as I type.
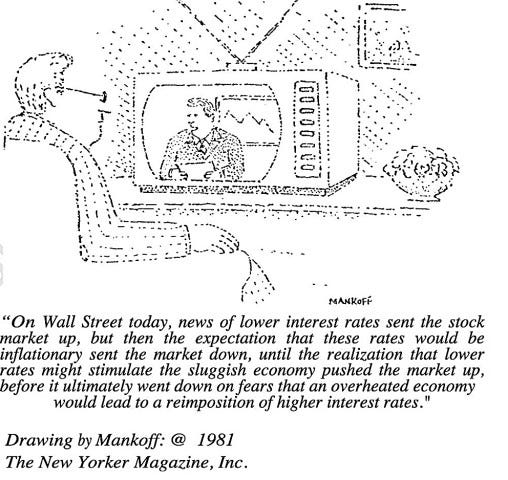
Interest rates themselves moved higher in yesterday’s session, especially after some (very relatively) hawkish comments from ECB’s Lagarde, though have eased somewhat again in the meantime as equity markets tumbled. Once again, no better way to explain yesterday’s bond session then with this:
The important thing on the cartoon above is the year it was initially released. Forty years plus later we are basically still scratching our heads …
Still some charts to show, so let’s move on, but not before highlighting three more credit-related ones. No comment on either necessary I think:
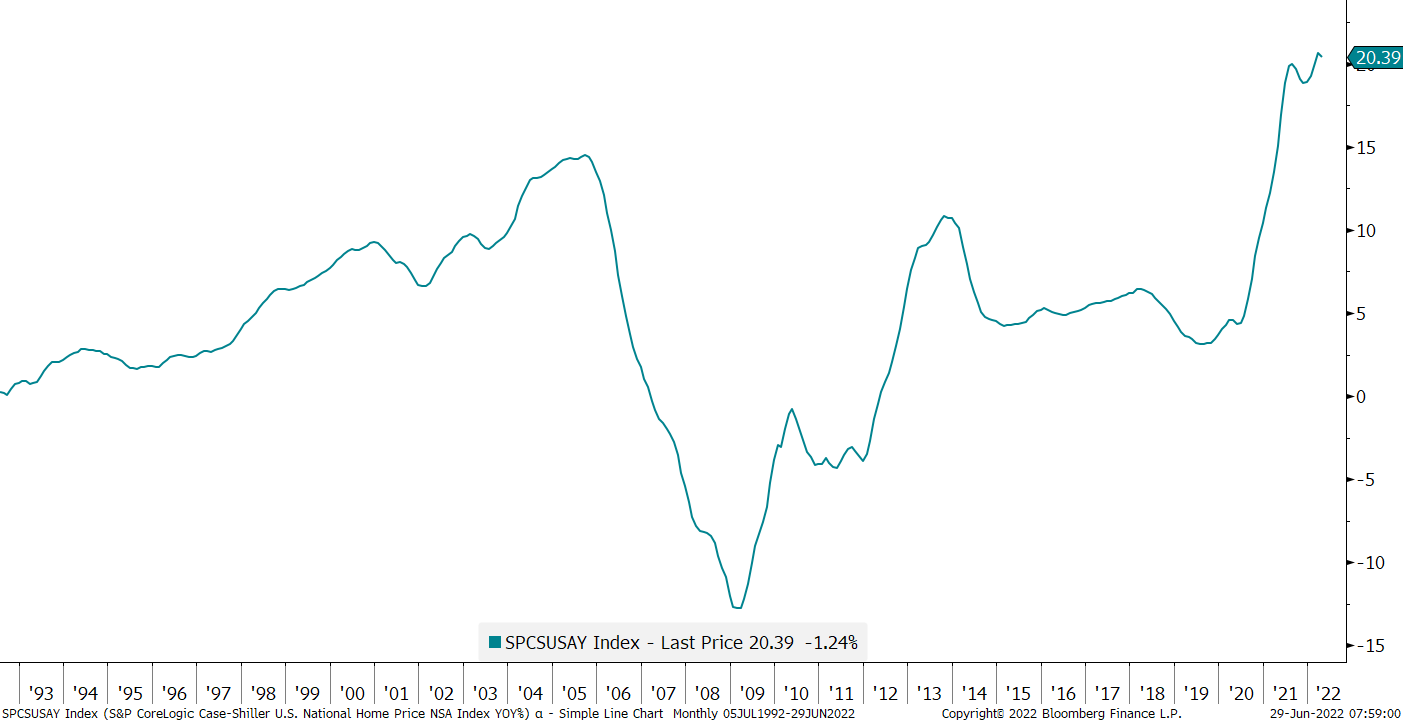
Not a Meme-stock, but US National House Prices:
Not a meme-stock, but US 30-year fixed Home Mortgage rate:
Not a meme-stock, but US total credit card debt:
In currency markets, the Euro failed to find a bid amid ‘hawkish’ ECB comments, and is drifting lower again:
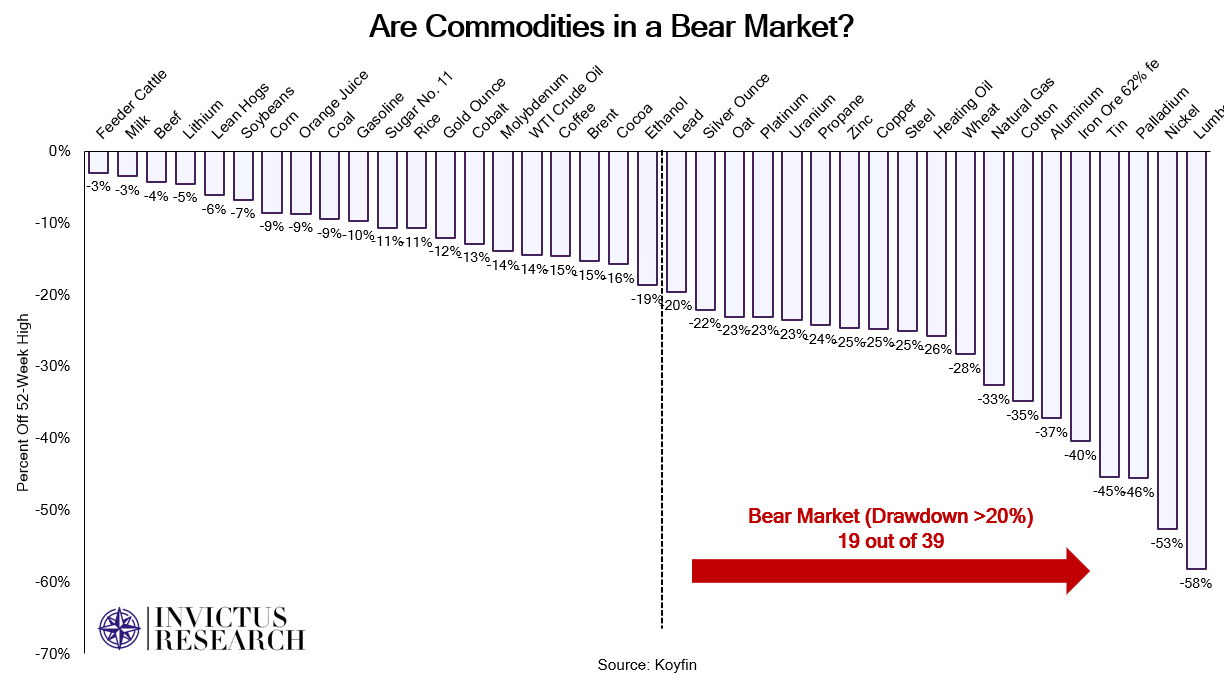
And quickly moving into commodities, I showed yesterday that not only Copper had fallen substantially from recent highs and had violated key support levels, but also that Cotton had dropped noticeably from recent highs. In that context, the following graph is interesting then, showing that 19 out of 39 commodities are down more than 20% (bear market?) since there 52-week highs:
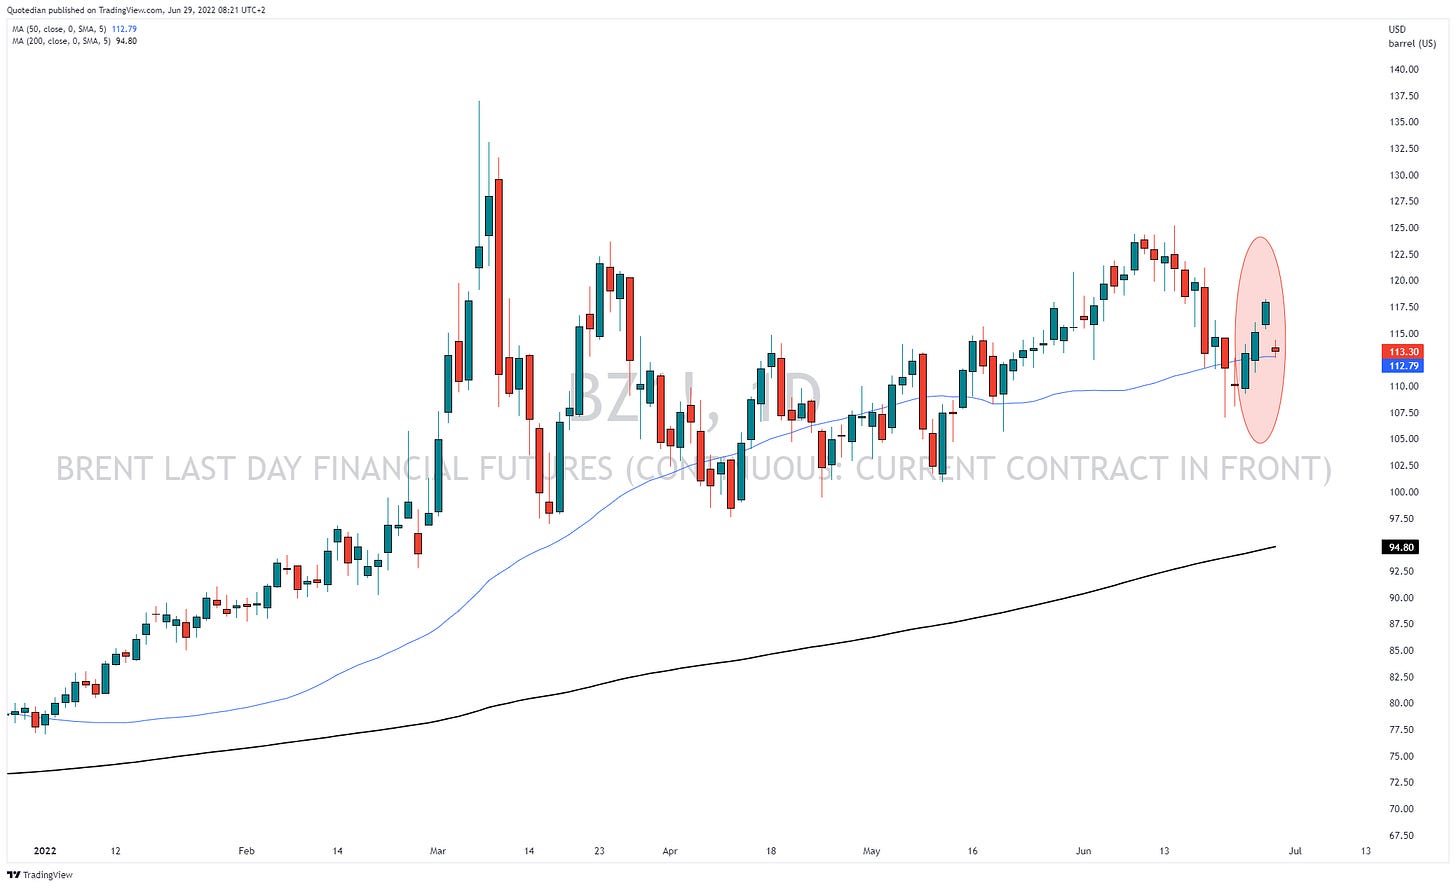
Oil had been ticking up strongly over the past three sessions (see yesterday’s energy stock performance) though is down today over renewed recession fears as indicated by equity, bond and other commodity movements:
Ok, time to hit the ‘Send’ button, but not before leaving you with the usual chart of the day.
CHART OF THE DAY
Today’s COTD shows the price of oil (WTI - blue line) over the past 40 years or so, compared to the Strategic Petroleum Reserves (green line). Technically, today one could argue over the viability of the term ‘Reserve’. Stay tuned …


