

Disconnected
Volume V, Issue 168


‘"There are no gurus; only cycles”
Michael A. Gayed
DASHBOARD

AGENDA

CROSS-ASSET DELIBERATIONS
Having spent most of the day driving a car yesterday, it was difficult to stay up-to-date with everything that is going on in financial markets. After all, you have to make a trade-off about which app (Google Maps, Coyote or Bloomberg) to use whilst thundering over European motorways, all while keeping wife, kids AND dogs in chequers! Long story short, I am feeling slightly disconnected this early Wednesday, or maybe it's just the current complexity of markets (fundamentals versus technicals versus geopolitics versus macro versus sentiment versus positioning versus … you get the point), expressed via today’s leading picture of the Quotedian above. In any case, let’s try and shed some light on the following paragraphs …
Starting with equities, and just looking at the final result for the US trading session, one could conclude that it was a quiet day with stocks drifting higher. Only pulling up the S&P’s intraday chart to we actually see the “WW3 Blip”:

The initial bullishness of the market came after a weaker-than-expected PPI number in the US kind of confirmed the slowdown in inflation already indicated by last week’s CPI:

Breadth at roughly four-to-one was decent and 9 out of 11 sectors up on the day confirmed that broad market upside:

Here’s the final heatmap for the day:

And talking healthy market breadth, it is interesting to note that highest number of European stocks as measured by the STOXX 600 Europe index have reached a technically overbought status (RSI>70; bottom clip) in many years:
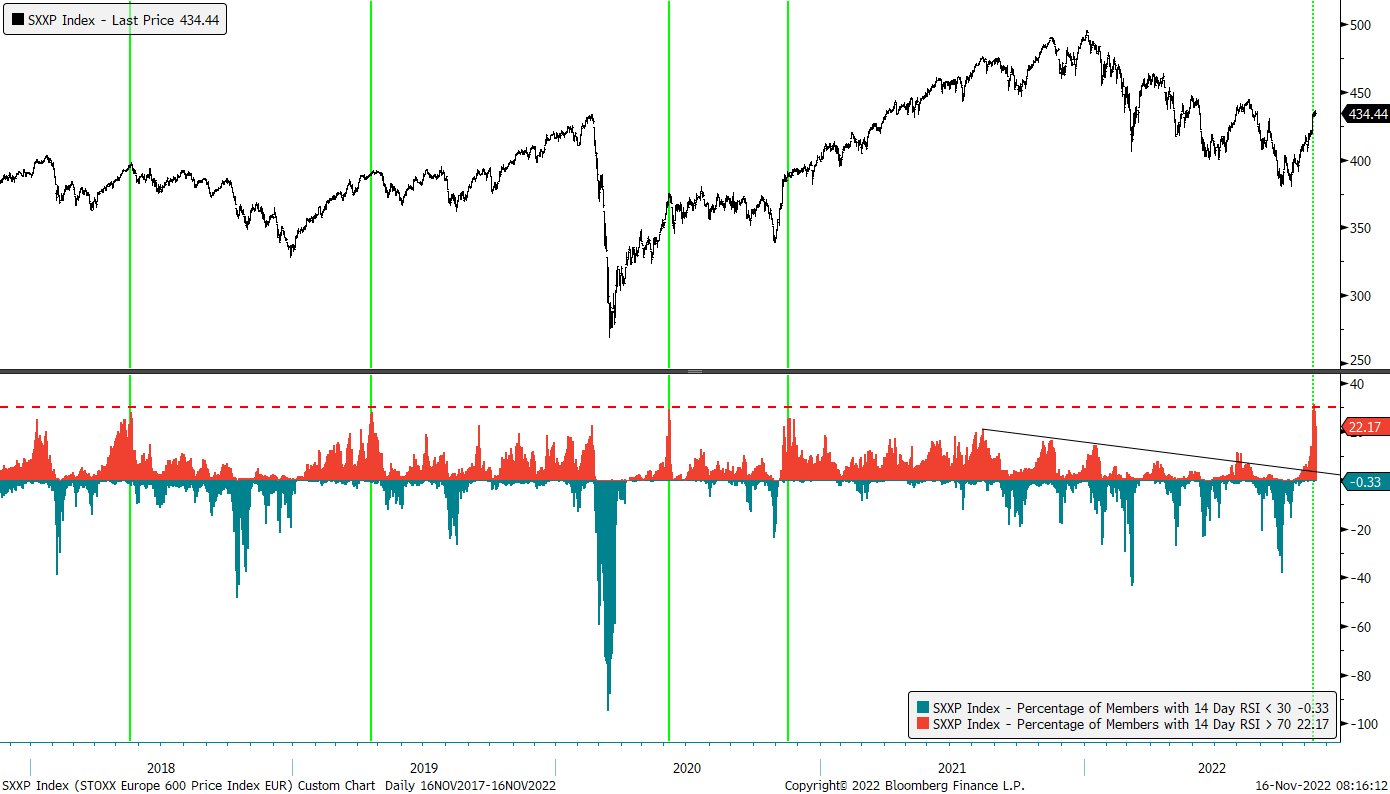
Whilst this is often a level achieved before a short-term correction sets in, it hardly ever marked the end of the bull cycle. In this case, such a higher OB reading is especially encouraging after years of falling breadth by this measure.
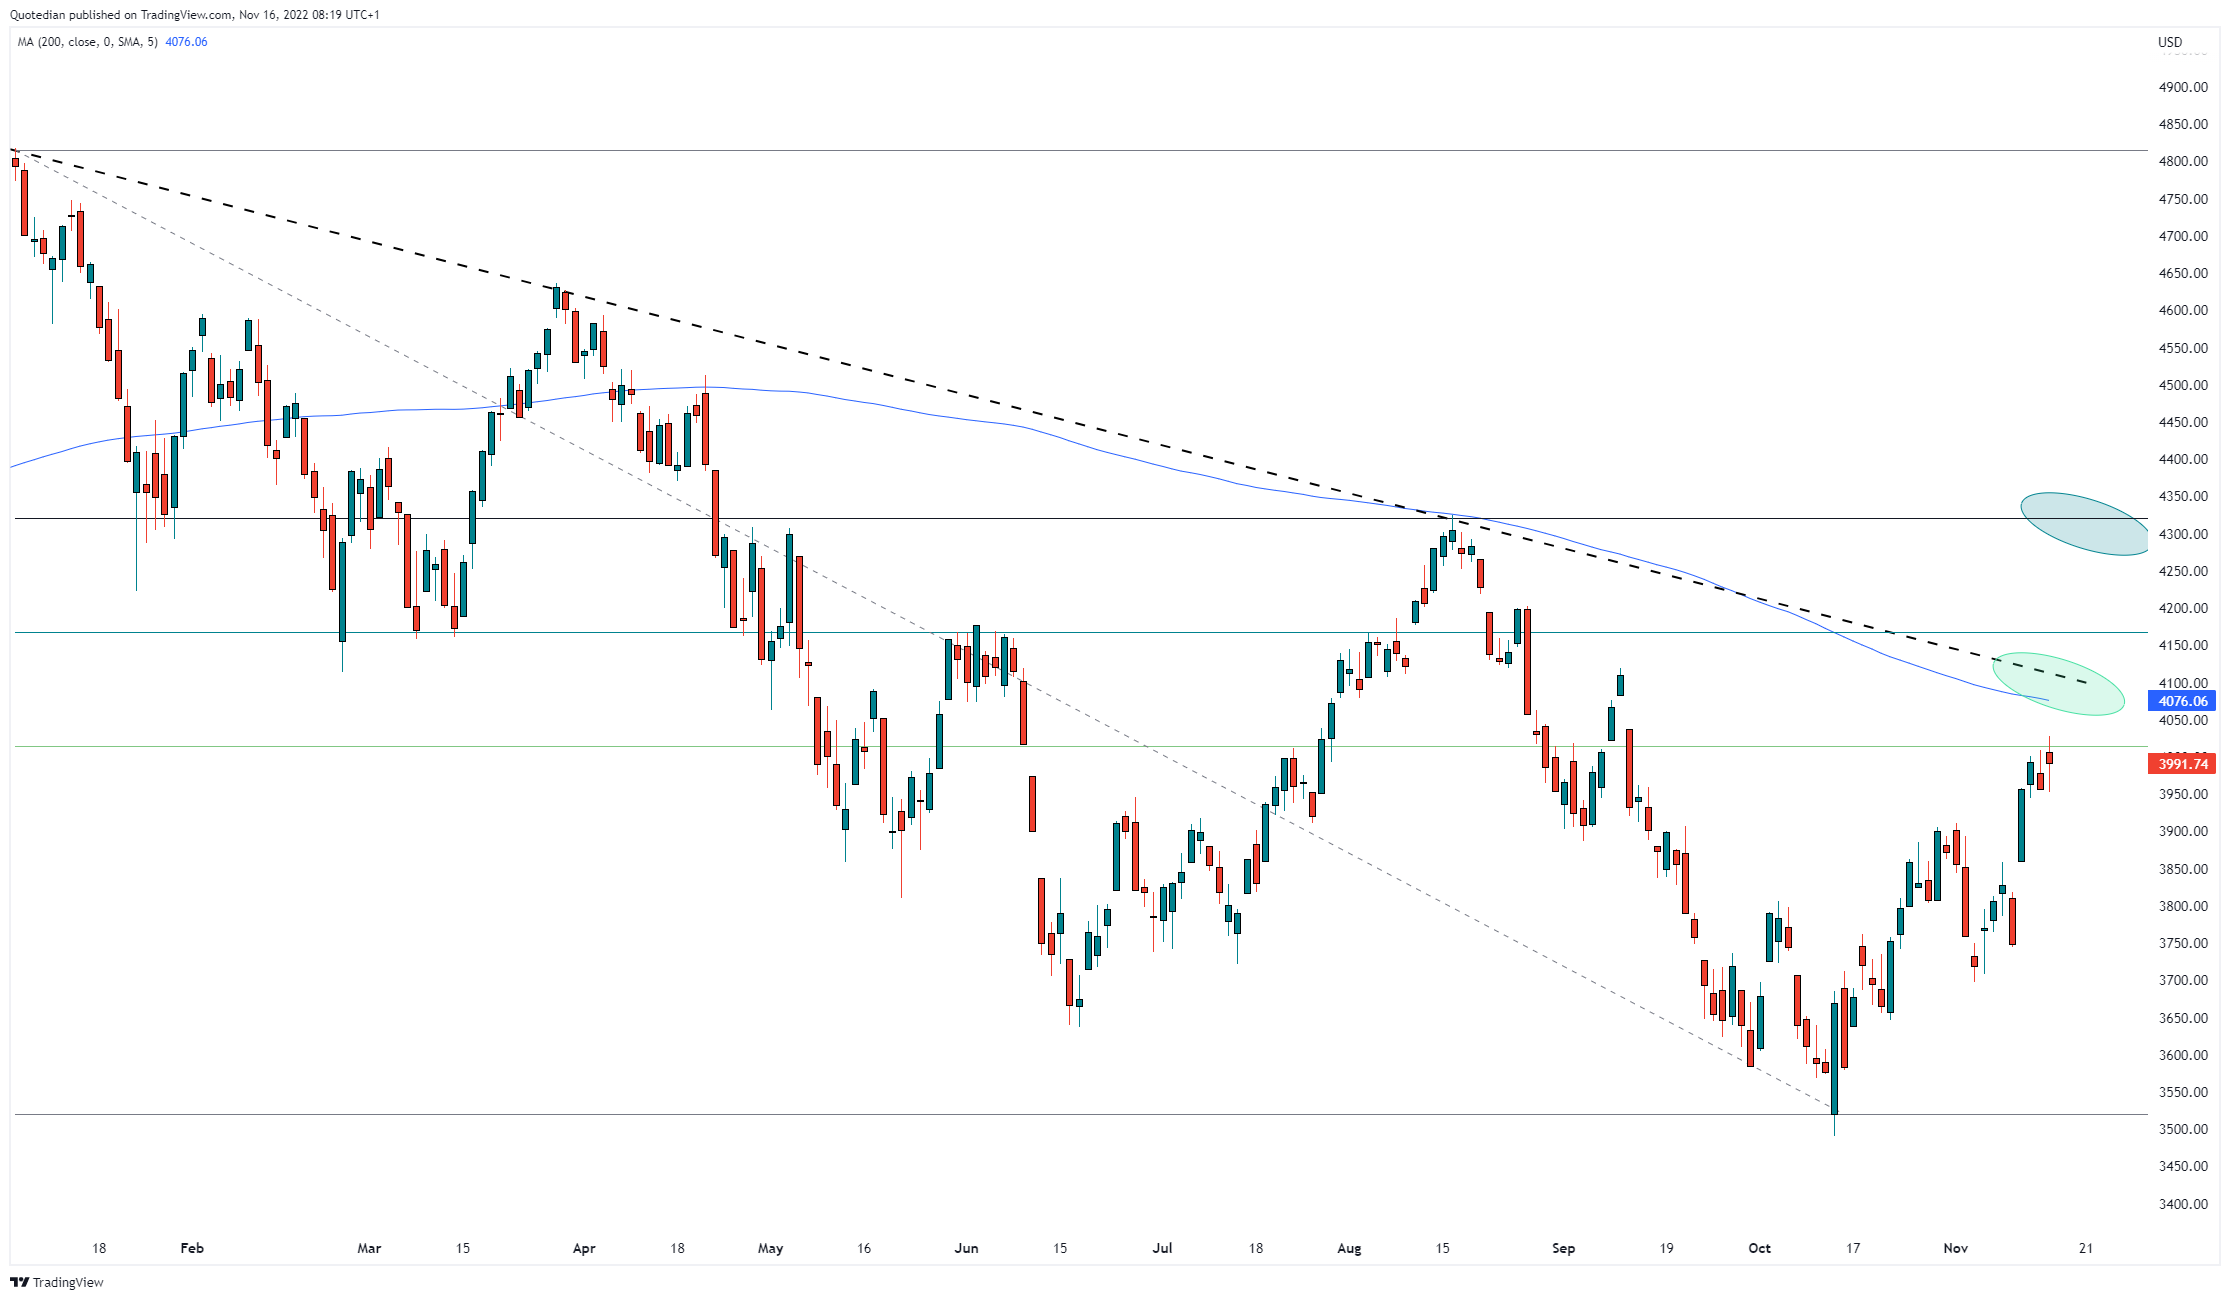
Back to US stocks, where the S&P is rapidly approaching our first target for this bull run as discussed on Sunday:
This at the same time as CNN’s Fear and Greed Index is fully into ‘Greed’ territory, but not quite yet in Extreme Greed mode:

Another market that has just closed in on its 200-day moving average is semiconductors (here represented by the VanEck Semiconductor ETF), at a time when the ‘stock’ is entering into overbought territory (middle clip):

This is especially interesting as one of the sector’s absolute bellwethers, NVIDIA, is reporting after today’s market close.
In fixed-income markets, global bond yields are relatively calm, at least as compared to the movements of the past months, which stands a bit at odds with the bond market’s VIX index, aka MOVE:

The MOVE moved up seven percent in each of the past two sessions, possibly signalling some distress somewhere. It also remains at levels, which are in line with those of the two largest market turmoils (GFC & COVID) of the past two decades.
Maybe coincidence, or not, we also observe that once again high-yield bonds (iShares IBOXX HY ETF - HYG) are once again failing to confirm the advances in stocks (SPDR S&P 500 ETF - SPY):
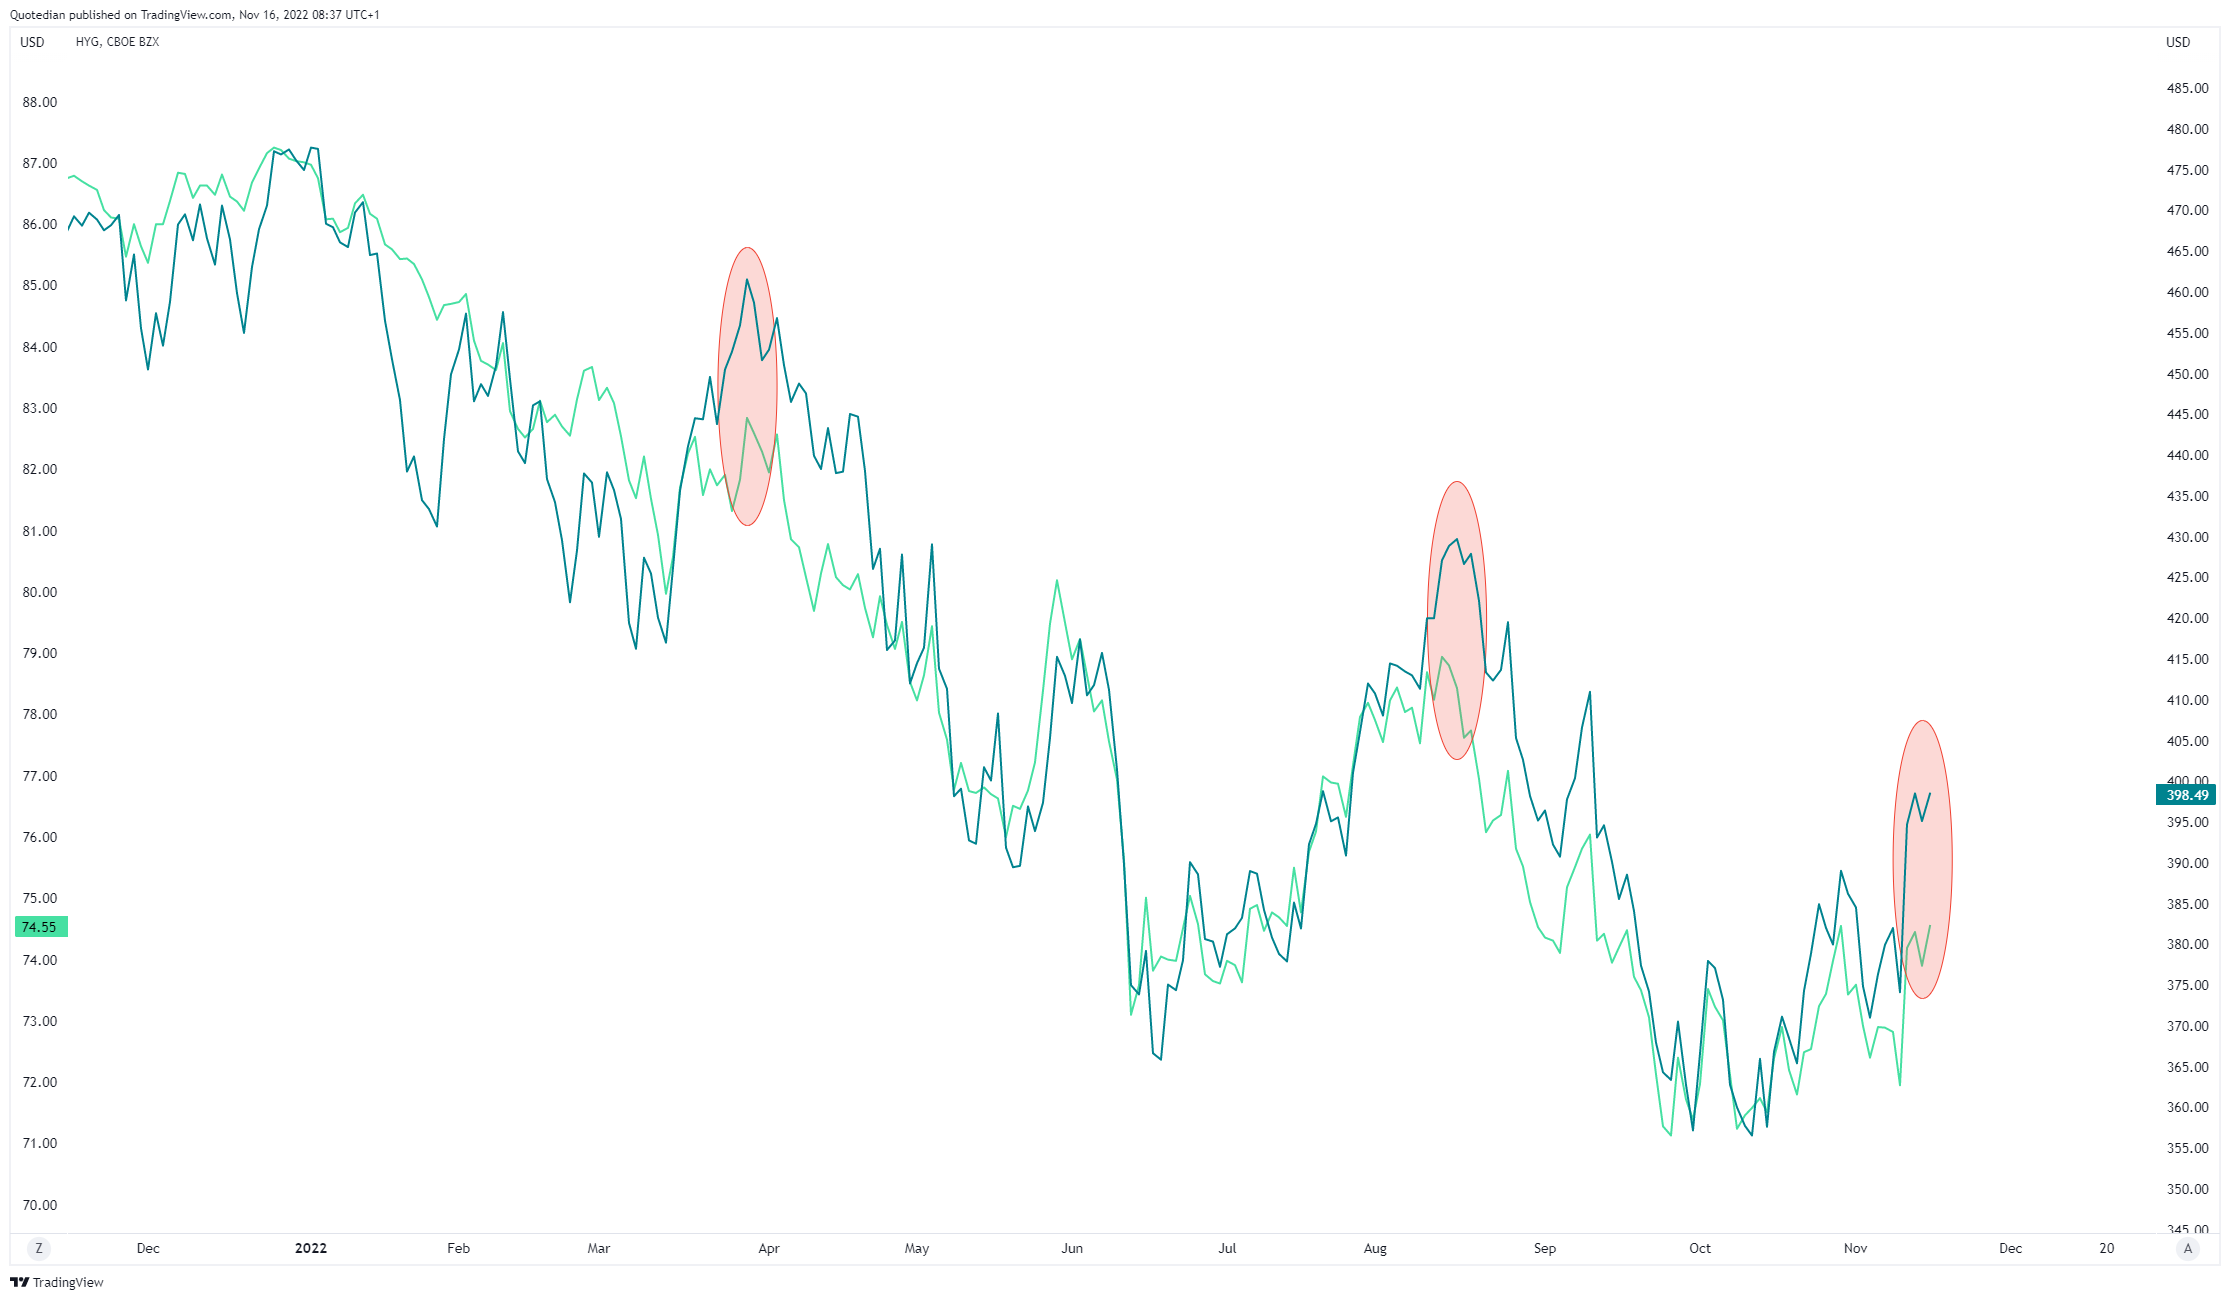
On previous occasions, the resolution was NOT to the upside …
In currency markets, it is probably worthwhile highlighting the GBP/USD cross, which hit an intraday high of 1.20 yesterday. Quite the recovery from the 1.0350 low hit on a Monday less than two months ago.

And as we’re at it, another currency that seems worth mentioning is the Hong Kong Dollar, up sharply over the past few sessions, as some money seems to be flowing back into the country:

Let’s finish today’s round-up with a potpourri of commodity charts, not all of them the usual stuff you look at.
But to start, let’s remain ‘traditional’. Silver has broken and is holding above its 200-day moving average:

This is helping Gold, which is moving in on the same indicator:

Lumber is reflecting the weakness in the US housing market:

European natural gas jumped over the past two days,
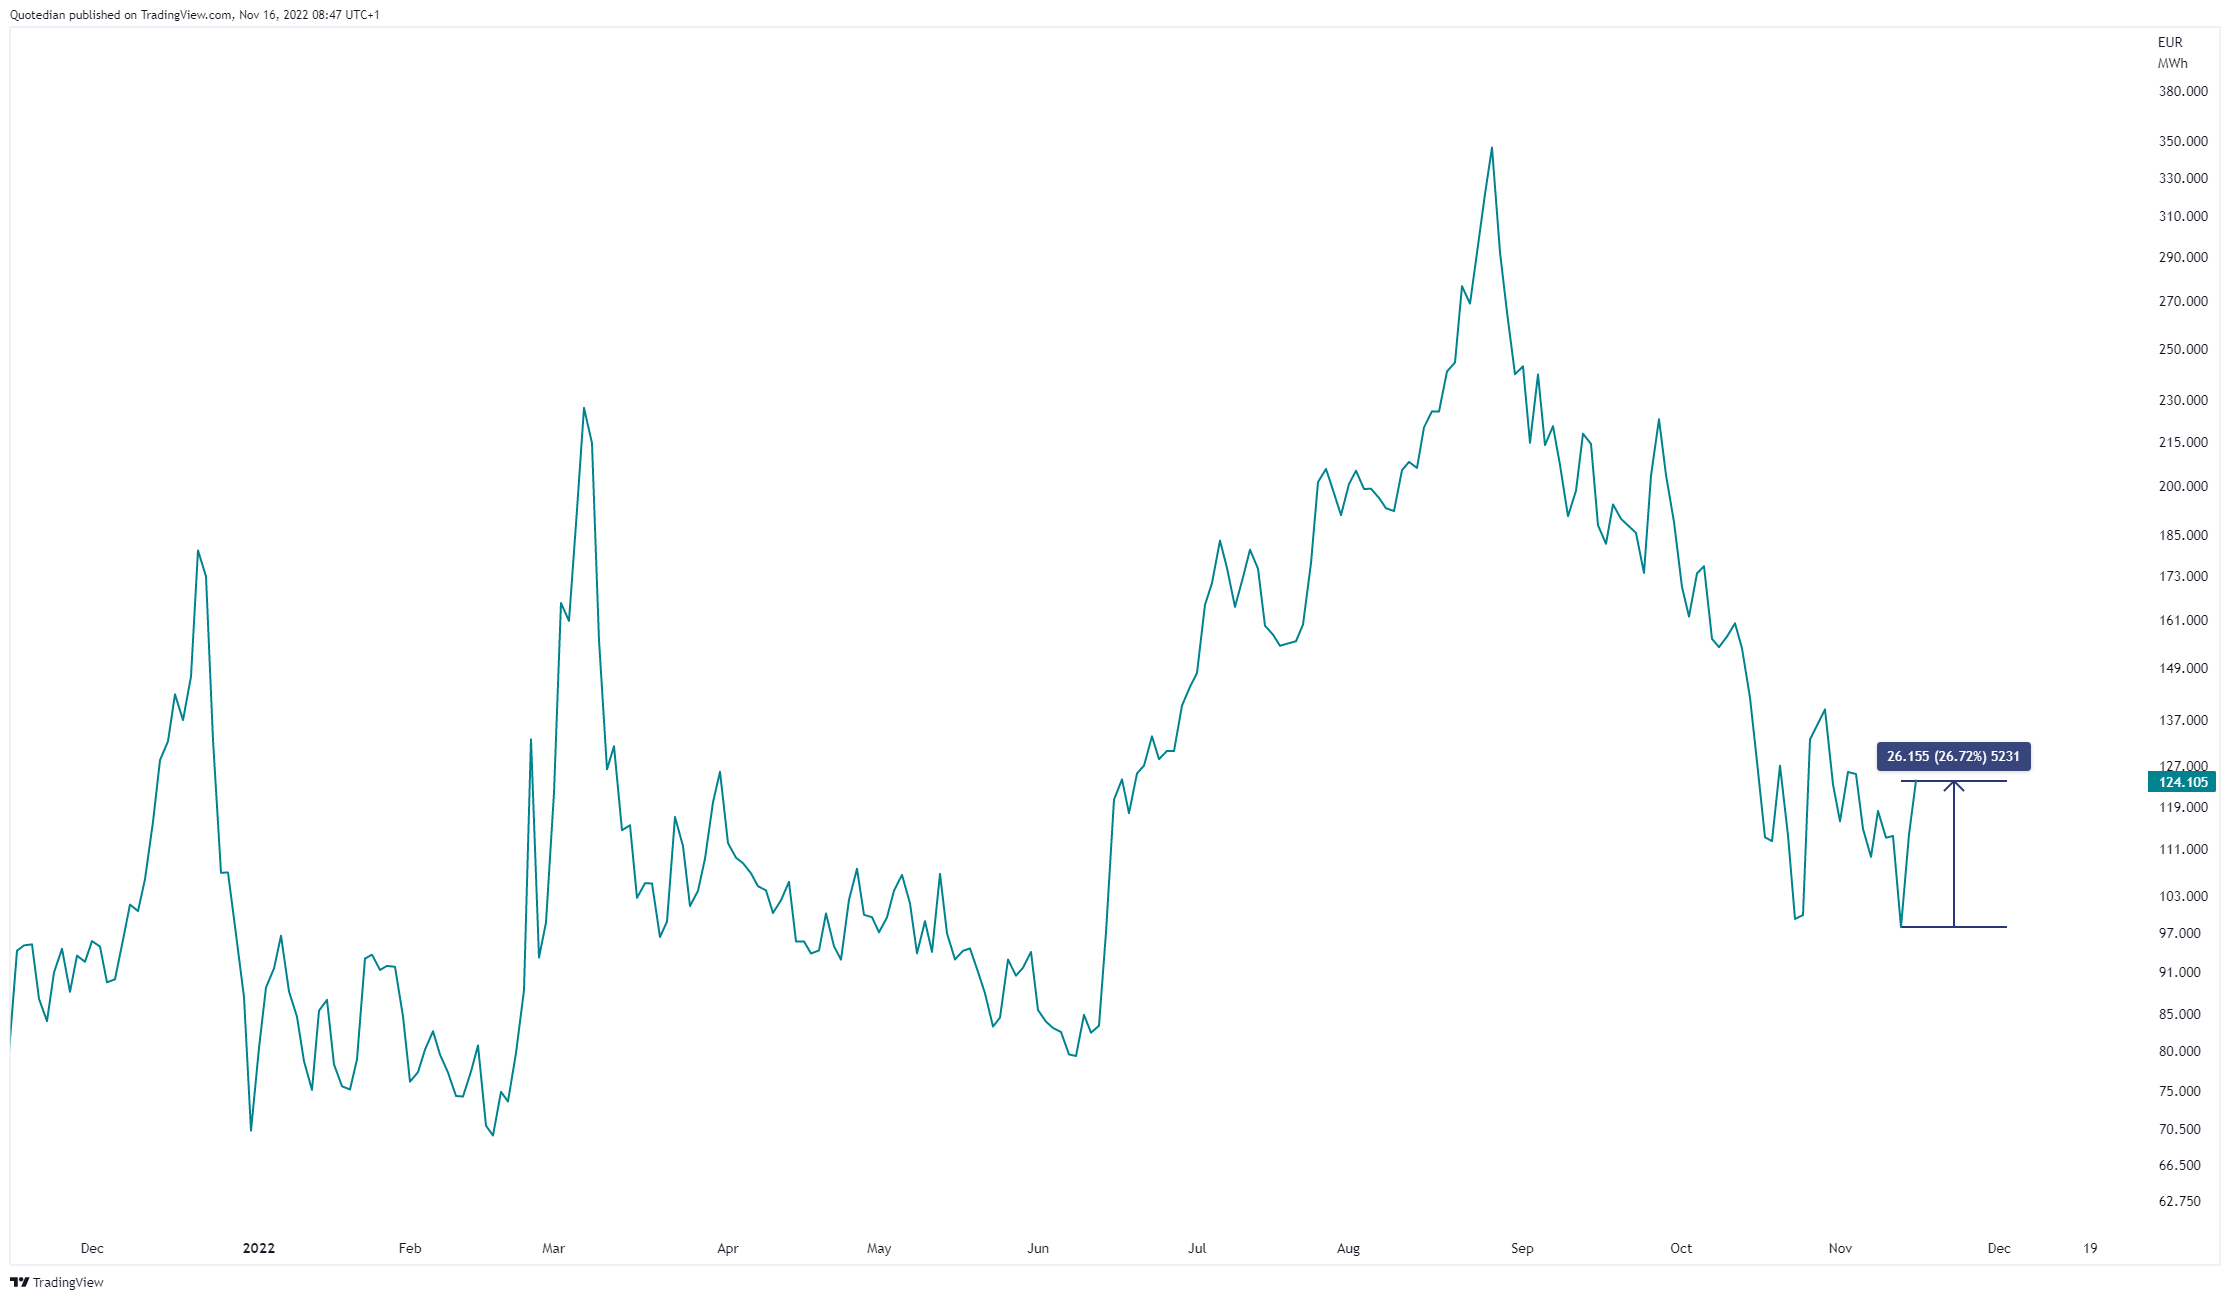
probably on top of this headline:

Ok, ‘nuff said, time to hit the Send button.
Have a great Wednesday!
André
CHART OF THE DAY
We have discussed (and traded) the Biotech sector in the past, and after the recent consolidation period the chart once again looks interesting to try the upside. Using the IBB ETF as a proxy:
Resistance broken
200-day MA turning up
inverted shoulder-head-shoulder formation indication 20% more upside
What is there not to like?

P.S. Do not forget to manage your risk (i.e. stop loss defined before entering long!)
Thanks for reading The Quotedian! Subscribe for free to receive new posts and support my work.
DISCLAIMER
Everything in this document is for educational purposes only (FEPO)
Nothing in this document should be considered investment advice
Past performance is hopefully no indication of future performance