Energized
The Quotedian - Vol V, Issue 142
“I believe in analysis and not forecasting.”
— Nicholas Darvas
DASHBOARD
AGENDA
CROSS-ASSET DELIBERATIONS
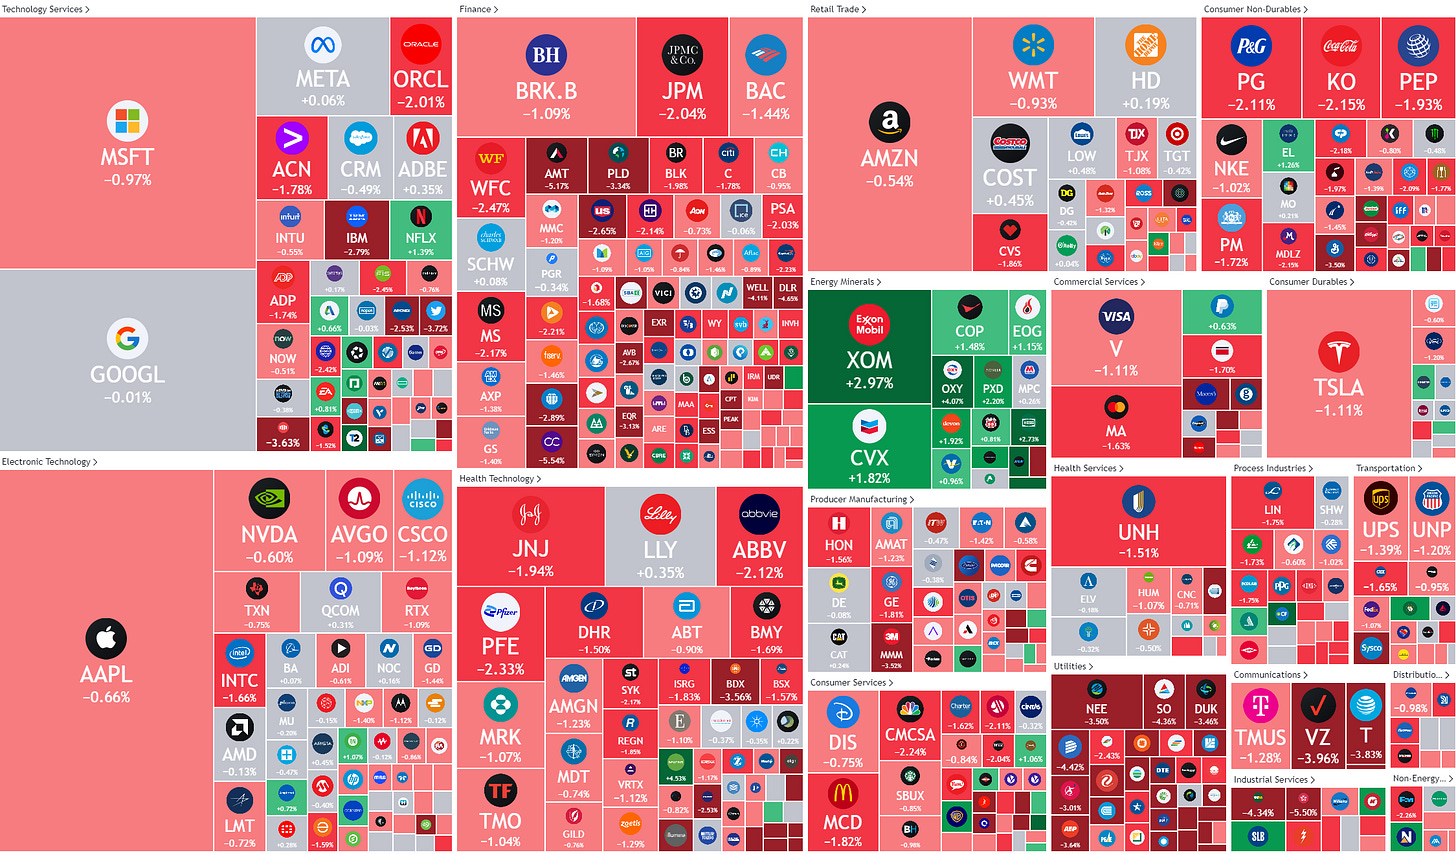
In comparison to Wednesday’s session, yesterday was a true consolidation of some of the gains made on Monday and Tuesday, albeit volumes would suggest it was a relatively ‘quiet’ out there. Major indices in the US gave back around one percent on the day, with a slight relative outperformance coming from small-cap stocks (Russell 2000 -0.6%).
Here’s a quick refresh of the market carpet on the day:
Yes, there’s a small green stain there right in the middle of our red carpet, let’s see where that comes from:
Aha! Energy - again …
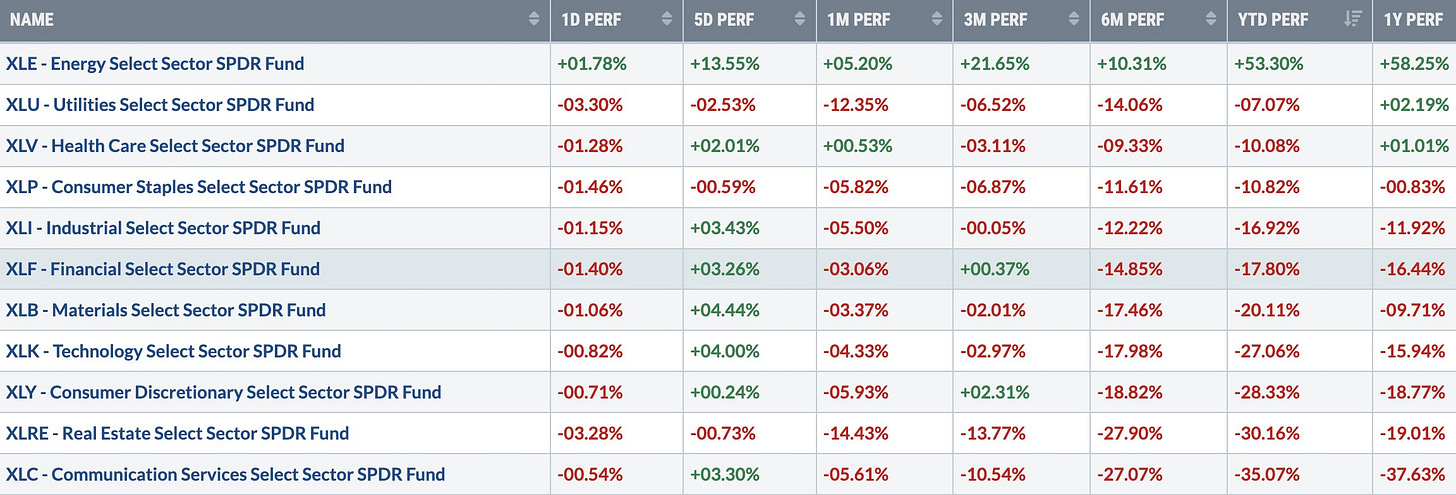
Here’s an interesting table, showing how energy stocks after yesterday’s session outperform on all kinds of time horizons (1D, 5D, 1M, 3M, 6M, YTD, 1Y):
Astonishing, but wait for it … What if … I tell you that the whole move for energy stocks may just be getting started?
You’d likely say: “Hey Mr Quotedian-Dude, what have you been vaping?!” (hint: not JUUL). And taking the following perspective, I can understand your doubts:
Up 2.5x already, why would you buy now?
Well, let me give you this perspective:
Or this one:
Energy stocks have gone nowhere over the past fourteen years (black arrow top chart), whilst the S&P has more than doubled over the same period (and has given back some since).
As the always fascinating Louis Gave, part-eponymous to research boutique jewel Gavekal, highlighted during lunch this week: there is value (P/E 10x), there is carry (Div Yield 4%) and there’s momentum (see performance table above).
Anyway, back to broader markets, where major Asian benchmark indices are showing some signs of profit taking too, albeit at a very civilized pace for now. Index futures in Europe and the US are printing small red, indicating that today there will be probably little going on until 14:30 CET, when the release of the non-farm payroll is due.
Should we analyze the possible outcomes and scenarios of the NFP number? No, absolutely not. Let’s see what the number is, and then, more importantly, see how the markets react to the number, and then analyse 😉.
Moving to bonds, yields are pushing higher again, with the US 10-year edition and representative for others, not far off it cycle highs:
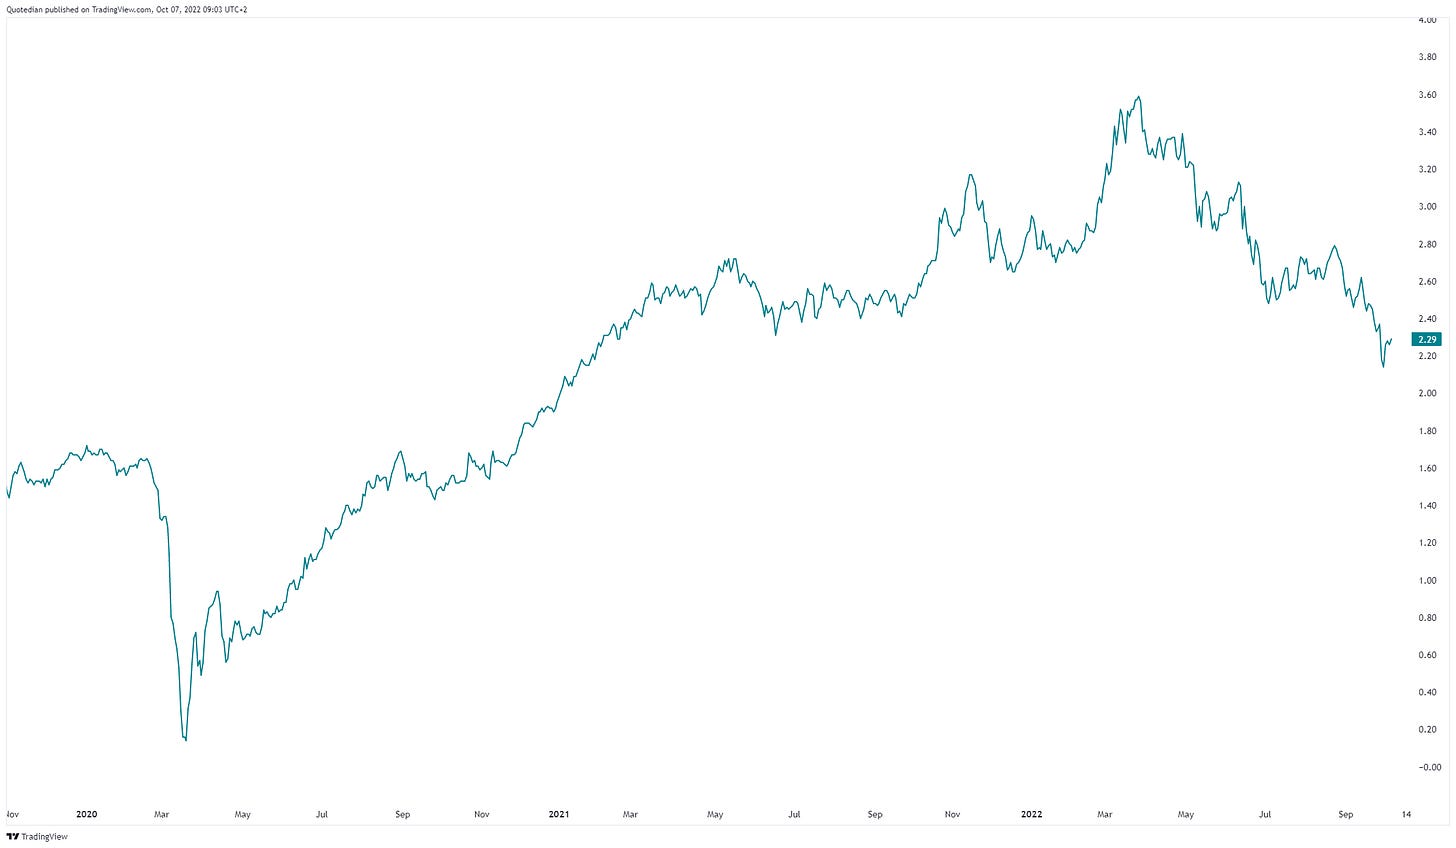
Interestingly enough, and I spoke about this before (but failed to update recently), has the best yield curve-based recession indicator, the 10y - 3m (8 out of 8, not false positives) not given a recession signal yet, and to the contrary is currently showing shy signs of steepening:
And then here’s another, potentially powerful, observation:
Market-based inflation expectations, via breakeven yields, are down noticeably. I will have an interesting COTD on that soon, so stay tuned …
In currency markets, similar to yields, the US Dollar is creeping higher again, increasing the odds that the recent “sell-off” was just another example of those many ‘flag consolidations’ we have seen in the current cycle:
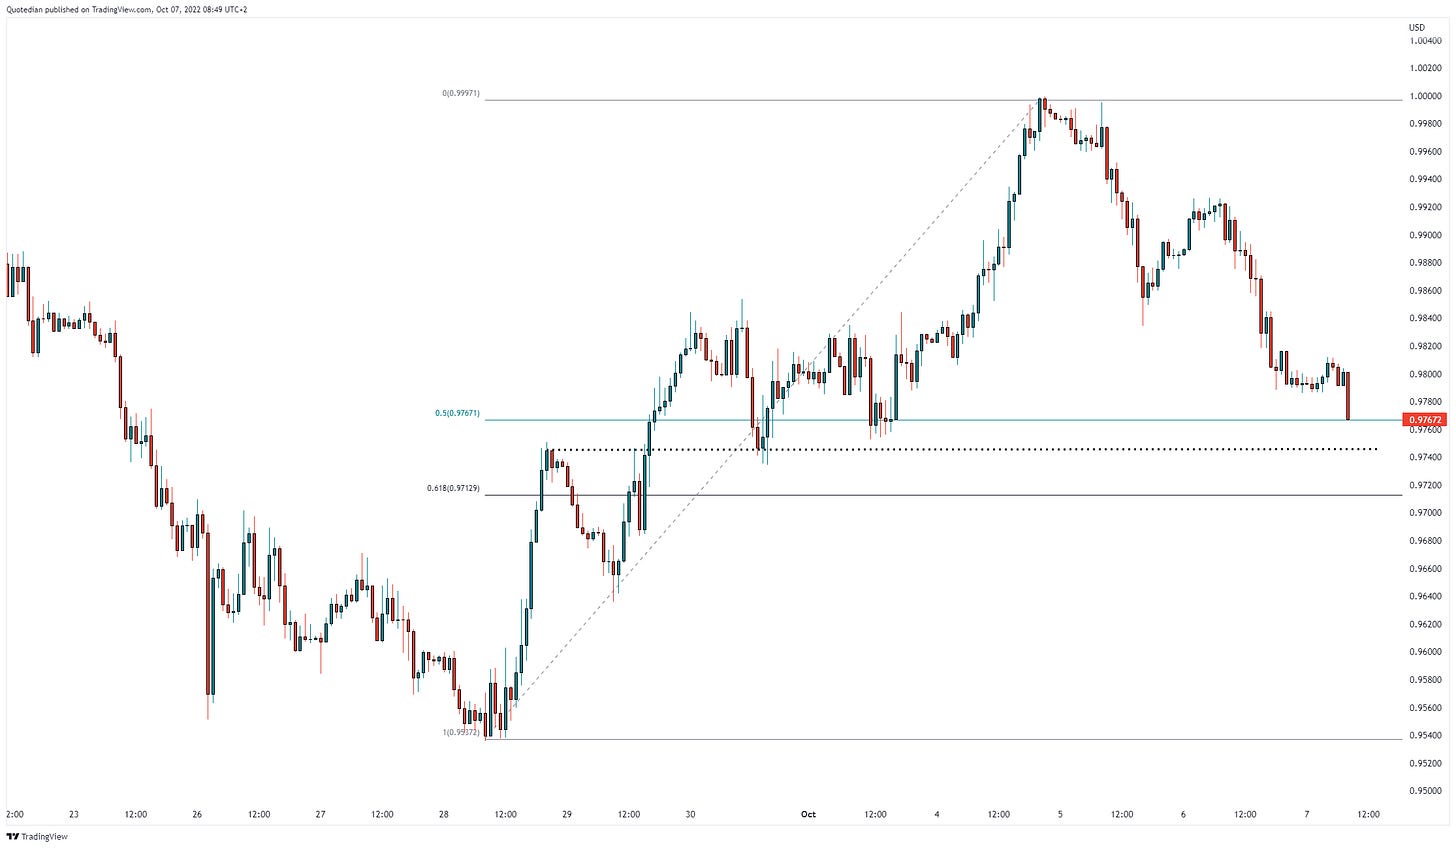
Using the EUR/USD cross-rate to zoom in a bit on this, we see that the USD has now retraced 50% of the recent Euro recovery rally:
Not being a big fan of Fibonacci retracements et al. I still the chart above still shows that the EUR/USD rate should not fall below 97.20, in which case the argument for Euro-bulls goes away from a technical analysis point of view.
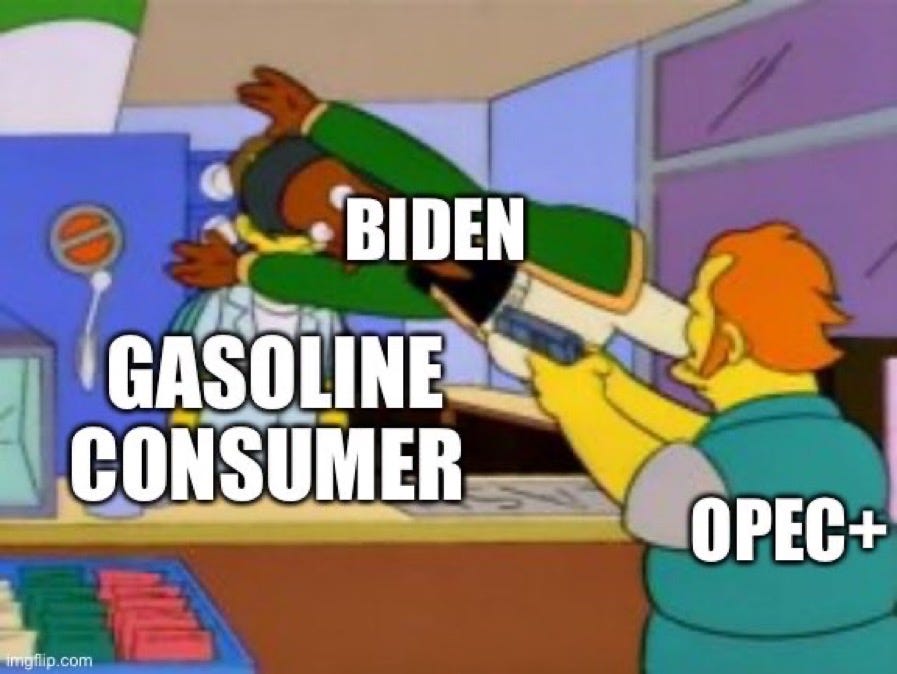
Finally, in the commodity space, I spent so much time talking about commodity-related currencies, that I did not mention the news item of the day, which was basically OPEC+ showing its middle finger to the West. In meme-talk, this is what the situation could be described like:
Anyway, the oil price did react to the upside, even though some cynical analysts (not me!) argued that OPEC+ would actually need to increase production to reach the new, lower quota …
Time to hit the send button - enjoy your Friday, enjoy your Saturday but sharpen your mind for Sunday’s Quotedian edition!
André
CHART OF THE DAY
As today’s Quotedian seems to have become kind of energy-heavy anyway, why not finish with a COTD on the same topic. The graph below shows how much energy is produced with what means by four different economic areas. What stands out to me is that China produces more energy by burning coal than the entire US energy production:
Hence, whilst the West continues to introduce non-plastic-based straws to save the planet, others are a bit less worried.
What’s your takeaway from this graph?
Thanks for reading The Quotedian! Subscribe for free to receive new posts and support my work.
DISCLAIMER
Everything in this document is for educational purposes only (FEPO)
Nothing in this document should be considered investment advice
Past performance is hopefully no indication of future performance


