Energy is Life
The Quotedian - Vol VI, Issue 65 | Powered by NPB Neue Privat Bank AG
“If your hate could be turned into electricity, it would light up the whole world.”
— Nikola Tesla
[Treat today’s DB with a grain of salt. Some technical difficulties, especially in the sector performance section]
Here’s the deal. I will make a positive statement on fossil fuels (companies) today.
You can either,
Write a comment expressing your hate or your love in the comment section:
Invite others to join the hate-or-love debate:
Or simply unsubscribe:
Very conveniently Substack does not offer a button for that, but I think you can find the option towards the end of this post.
Ah, yes, you can also simply give your anonymous nod by clicking the ‘Like’ button somewhere at the top or the bottom of the post.
In any case, enough blah…blah…blah… let’s get on with the job!
(Trying to) Keeping it simple, oil consumption is back to pre-pandemic levels:
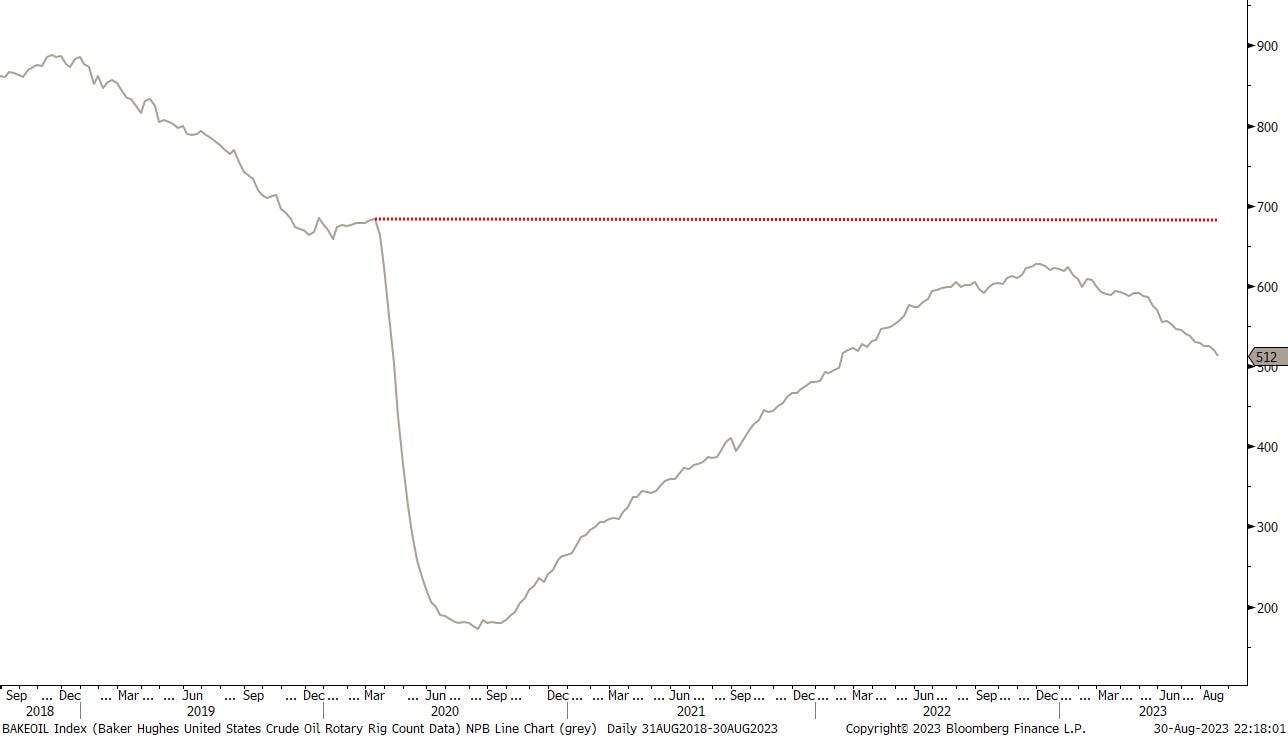
The oil rigs count is not:
Neither is the SPR (Strategic Petroleum Reserve) in the US:
By way of introduction, this is enough for now. The rest of the theme is in the commodity and COTD sections…
Looking for sound investment advice? We have it!
Contact us at ahuwiler@npb-bank.ch
Good thing I decided to come up with a controversial theme for this issue, as today’s session was pretty “late summer lulls”
Hence, let’s keep it short …
On the back of “bad (economic) news, is good (stock market) news, equities celebrated a fourth consecutive up day, as GDP growth and employment (ADP) both slowed.
This apparently incites investors to think that the Fed is done hiking interest rates, which of course is absolutely possible. But why this should be good news to corporate America (i.e. stock markets) in the short-run absolutely escapes me.
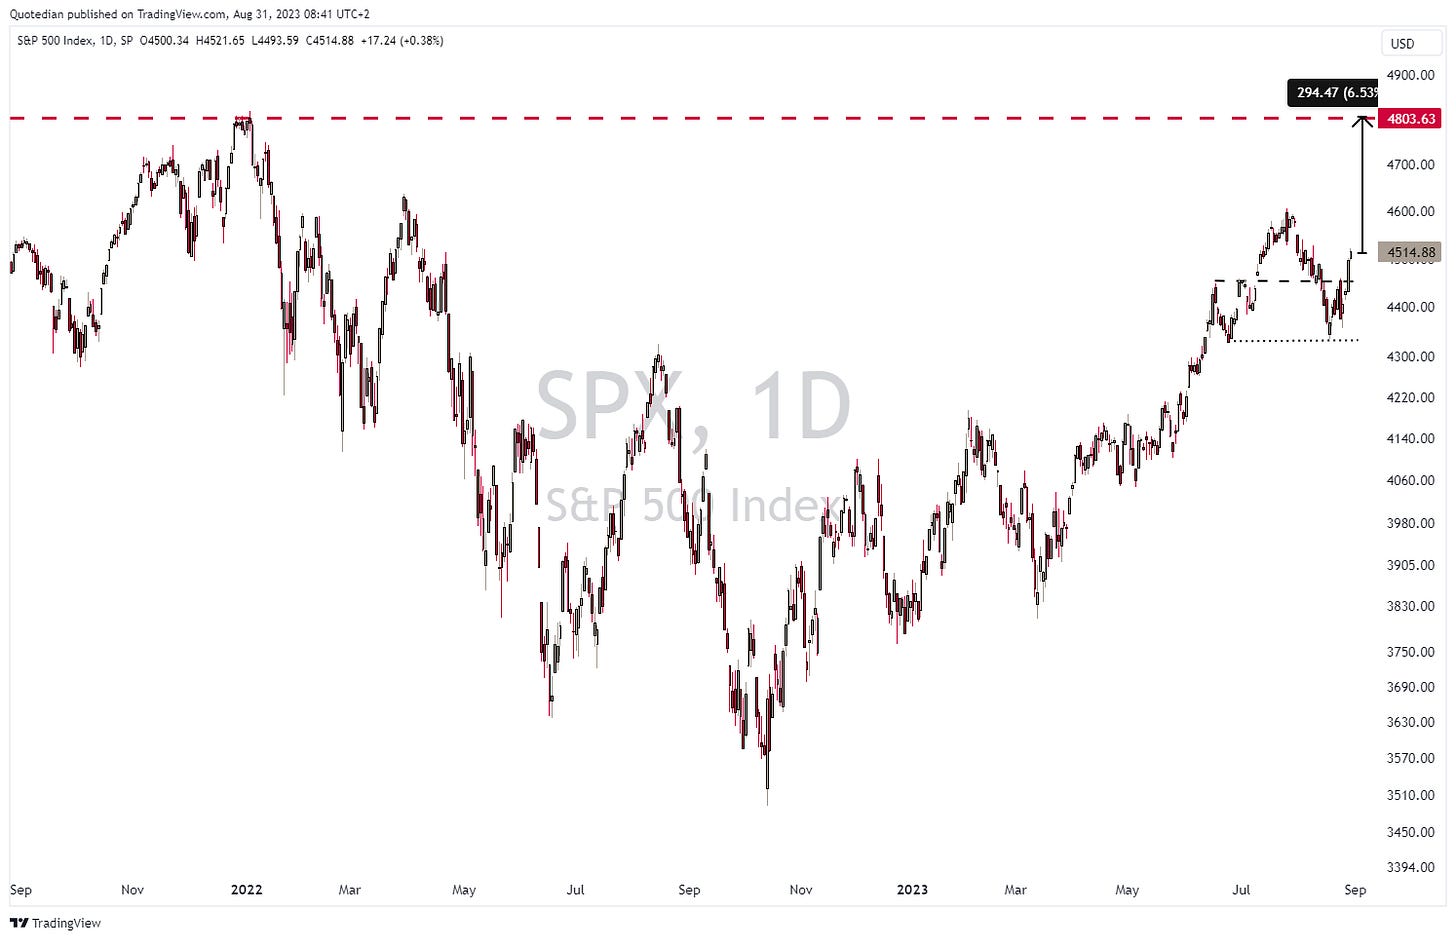
Anyhow, looking at the technical picture, it is actually hard to be anything than wildly bullish. Here’s the S&P 500 for example:
New recovery highs seem to be ahead, and zooming out we note that possibly new all-time highs (ATH) too:
Breadth was decent yesterday, with only two out of eleven sectors down and a decent advancers-to-decliners ratio:
But again, really nothing to write home about…
Two more technically bullish observations:
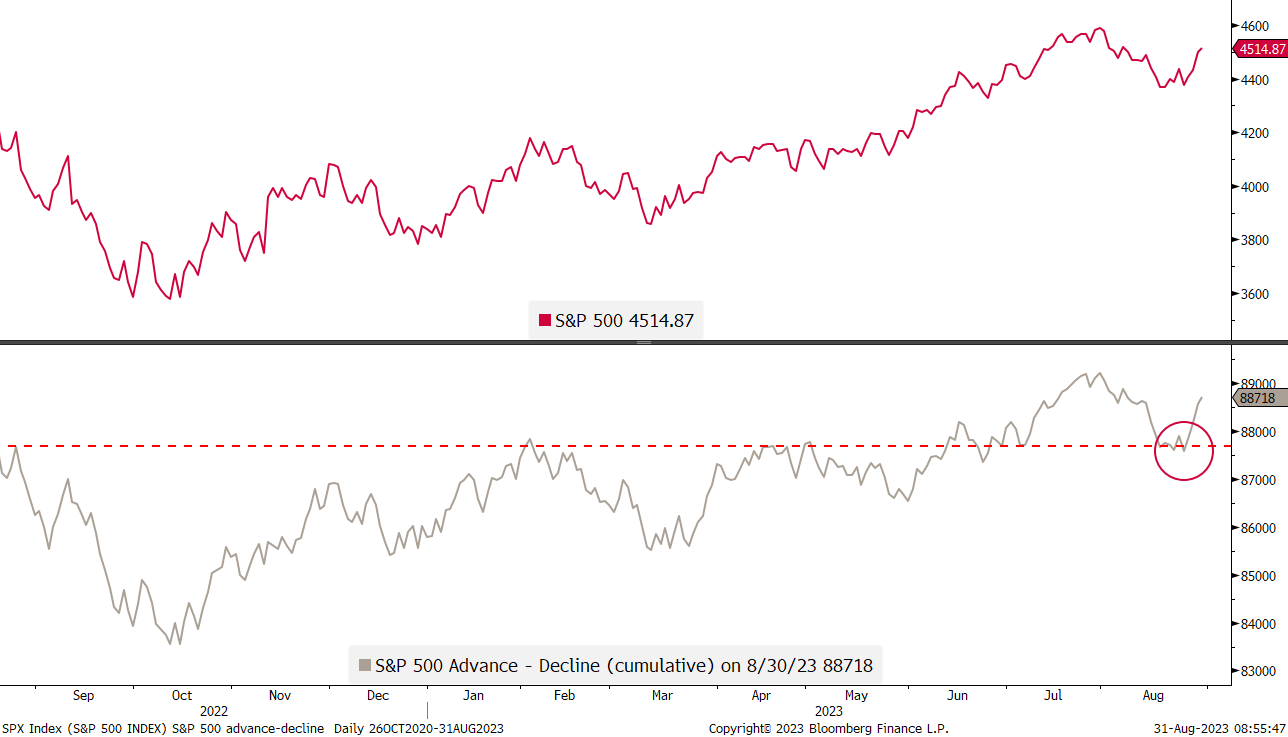
One - The ex-resistance, not turned support, of the S&P 500 advance-decline ratio (lower clip) held up well, and a new high could lay ahead:
Two - Consumer staples (XLP) are hitting new cycle lows versus the broader market (SPY). In other words, investors are not looking for shelter in more defensive sectors:
We will likely look at some relative performance charts/tables in the next Quotedian, which by the way will be the end-of-month edition, so make sure to stay tuned!!
In today’s (Thursday) session, Asian markets are mixed, with mainly Japan, Australia and South Korea holding up the stick for the bullish camp, whilst China, Taiwan and India are negative contributors to the region’s performance.
Talking Asia in general and China in particular, as a follow up to my yesterday’s bullish contrarian call, I found the following chart of interest:
European equity markets will have already opened their cash trading by the time you receive today’s Quotedian and most likely they will have done so with a slightly positive tilt.
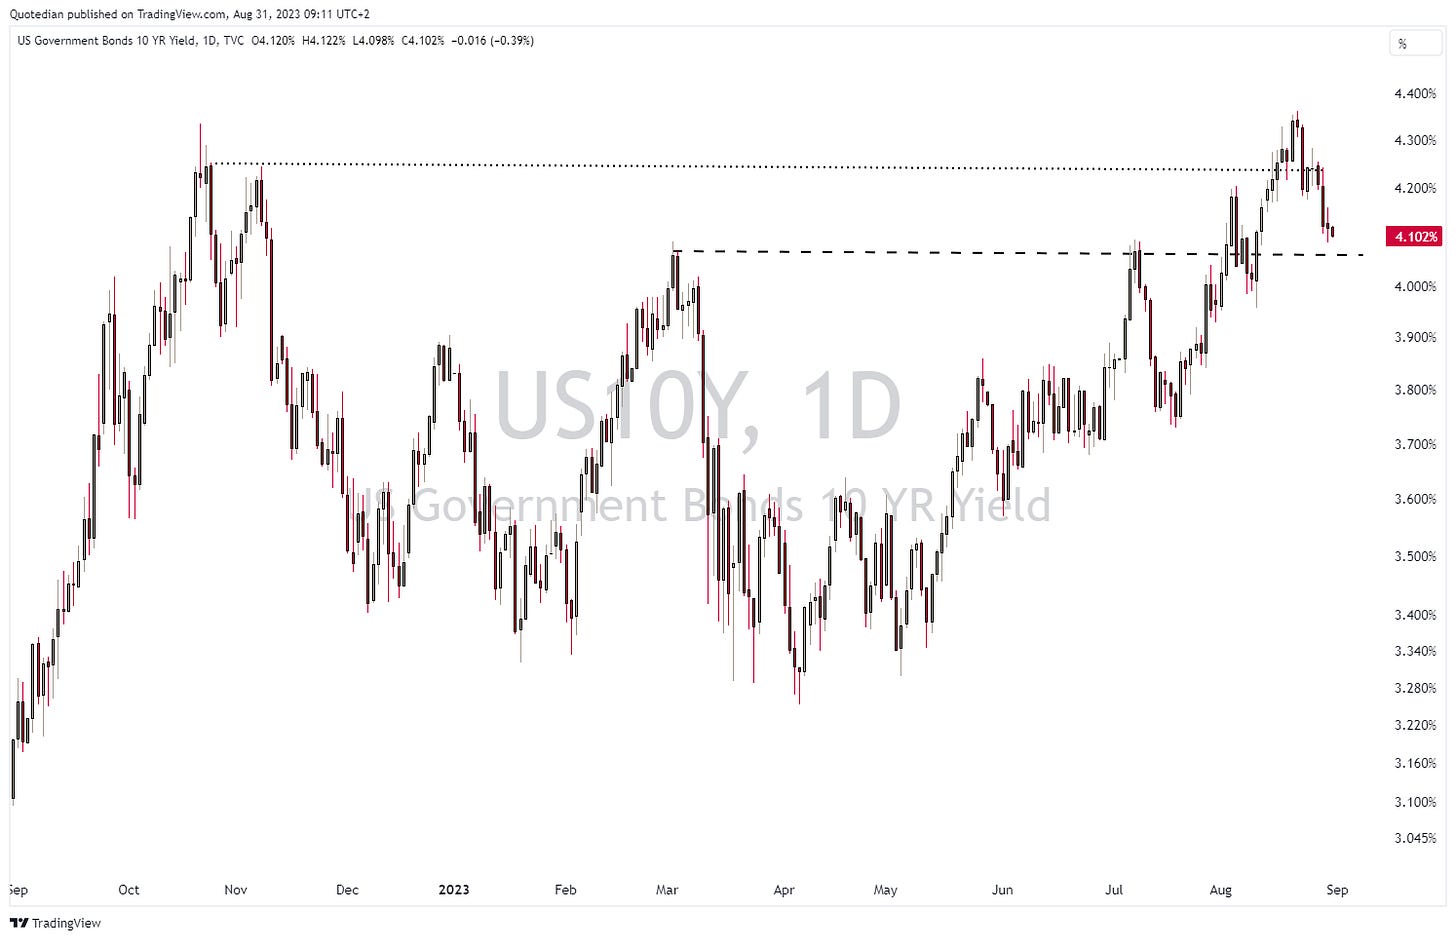
Just one chart of the US 10-year yield in this section today, showing that yields continue to (rightfully so) trend lower on the back of softer economic data discussed above:
In-line with dropping yields, the US Dollar also continues to weaken (EUR/USD in the chart below), however, let’s see what happens later today as European inflation numbers are released (see calendar):
This brings us to the commodity section and back to the main theme of the day. Apart from the oil bullish arguments already provided, the chart of crude itself is also turning pretty constructive, especially since Brent just witnessed its first golden cross since October 2020:
As a reminder, a golden cross is registered when the 50-day moving average crosses above the 200-day moving average and is generally considered a longer-term buy signal (its counterpart is ominously called “death cross”).
But not only crude is looking increasingly bullish. Another ESG-all-time-favourite is also looking like it is heading higher: Uranium!
Here’s the chart of the Sprott Physical Uranium ‘ETF’, about to reach (and breach?) all-time highs:
Accordingly, the Global X Uranium ETF, which tracks the fortunes of companies involved in the nuclear business, is about to break above a long-term resistance:
Last but not least, the largest company in this space, Canada’s Cameco, just filled its 2011 Fukishima disaster gap:
And so we have arrived at today’s COTD, which addresses one possible way to implement a bullish fossil fuel view.
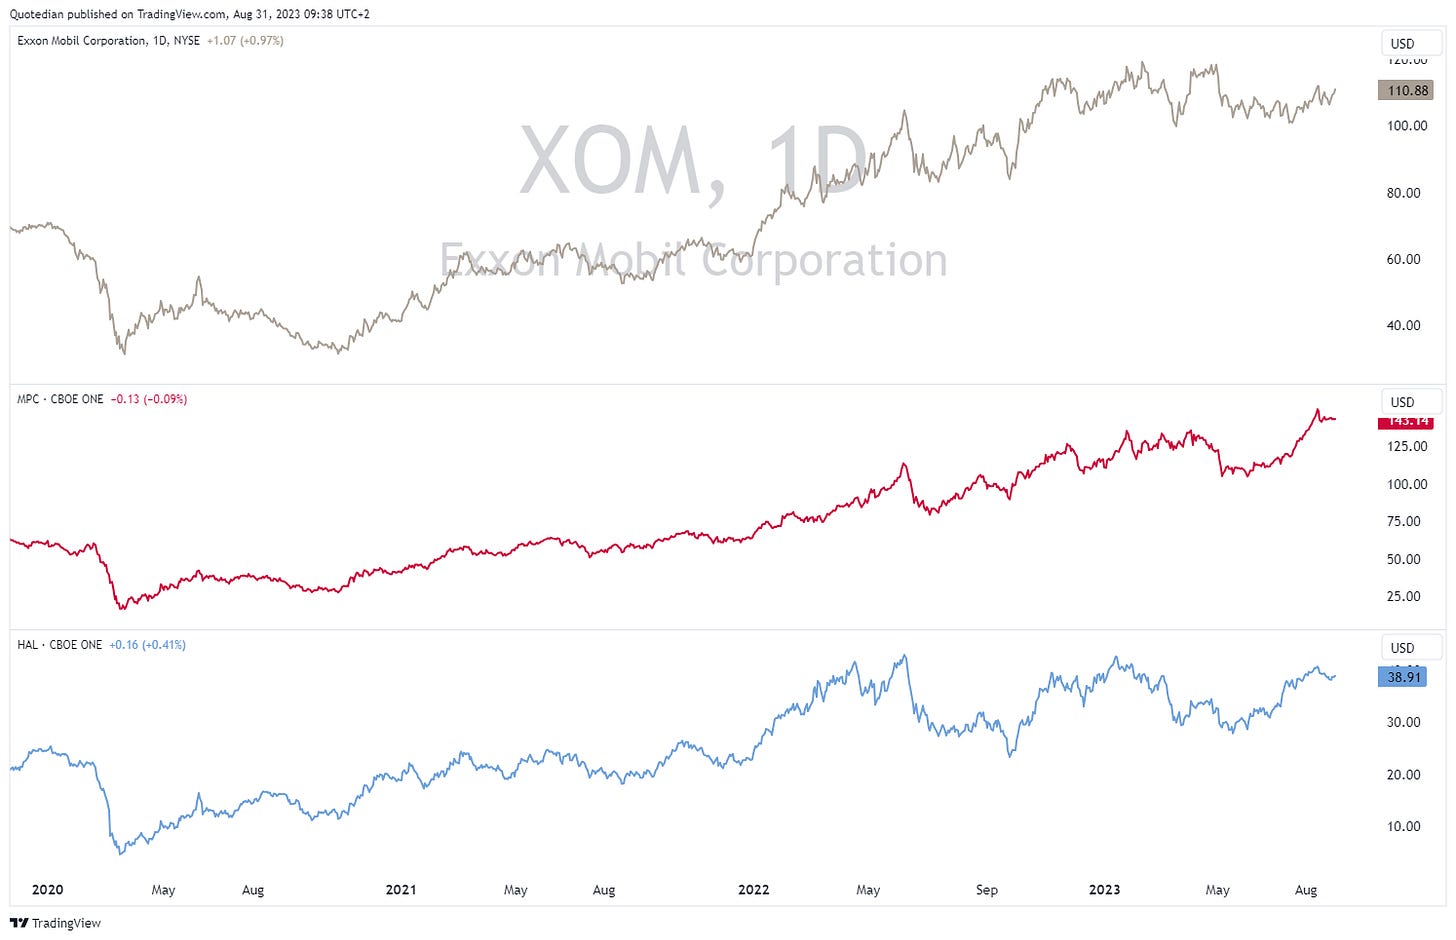
Here at NPB, we looked at the charts of three not-so-randomly picked US oil plays: ExxonMobil, Marathon Petroleum and Halliburton. Those cover integrated, exploration and services and are shown in the fore-mentioned order on the chart below:
Of course, it can be argued that all three had good advances already, but as I have mentioned on several occasions in this space, the sector as a whole has a single-digit P/E and an above-average dividend yield. The iShares Global Energy ETF (IXC) for example trades on 8x earnings and a 4.5% yield.
The construct (structured product) we looked at here was a one-year quarterly autocable worst-of of those three stocks, with a knock-in level at 70% of the strike, i.e. a 30% protection. This is what 30% protection looks like (red dashed line):
This construct would pay an investor an annual coupon of … drumroll …. 21%!! Not too shabby …
Anyway, highest time to hit the send button. The next Quotedian (end of August edition) will likely hit your inbox over the weekend, hence, stay tuned …
André
Coming very soon …
Everything in this document is for educational purposes only (FEPO)
Nothing in this document should be considered investment advice
The views expressed in this document may differ from the views published by Neue Private Bank AG
Past performance is hopefully no indication of future performance


