

ESG
The Quotedian - Vol VII, Issue 9 | Powered by NPB Neue Privat Bank AG


“Trade the market in front of you, not the one you want”
— Larry Hite


I recently had the “pleasure” of working on our ESG-pitchbook - well, as a matter of fact trying to work our ESG strategy overall.
“You START working on your ESG strategy only in 2024!!” you will incredulously shout at me now.
And not without a certain level of pride, I will answer: “Yes, only now”.
Anyway, looking at those three ominous letters, I had a thought. Though, be warned, I might be barking up the completely wrong tree, but bare with me anyway…

Let’s focus our attention on the S today - I already upset the E crowd enough over the past years.

As the following chart from the fine folks at Morningstar shows, assets under management (AUMs) at passive funds were larger than those at active fund by the end of 2023:

Hence, if an investor takes $1,000 and invests that into the SPDR S&P 500 tracker fund (SPY), a passive US Large Cap equity fund, $35 will go to the 10 largest companies or, for example, $7 go to Microsoft alone.
Now compare this to the bottom ten stocks by market cap (and hence index weighting) in the S&P 500. They will receive a combined amount of $1.20. Delta Airlines, to pick a random example, gets 60 cents of the thousand dollars.
When you buy shares, you give a company working capital. Hence we are giving more and more capital to the already richest companies and giving less and less to the “poorest”, which might need that capital to implement either E, S or G strategies…
The problem gets further exacerbated, as active managers see their AUMs erode in favour of money flowing into passive strategies, forcing them to liquidate carefully built-up positions in grossly undervalued companies, making them “cheaper” yet.
So, is there a place for the S in a capitalist, market-cap-weight world? Should somebody stop to immoral folks at S&P? Should we look shamefully into the mirror each morning, before turning to our portfolios and investing yet some more money in the QQQ?
I am still not sure why I went on this rant and am coming off my soap box now.

P.S. Still, an interesting thought train though, I think …
P.P.S. Active fund managers on this list, waiting for your crates of champagne for x-mas ;-)
The good old Quotedian, now powered by NPB Neue Privat Bank AG

Contact us at ahuwiler@npb-bank.ch
Alright, with my shaking fist at clouds over,

let’s quickly remind ourselves of today’s “Quote of the Day” before diving into our market deliberations:
“Trade the market in front of you, not the one you want”
And off we go!

I am writing this section on Monday evening about three hours before US market close and whilst the S&P is slighty down (0.12%) on the day, it is probably safe to assume that it will not drop 2% until market close, making the follwing graph tick one notch higher yet:
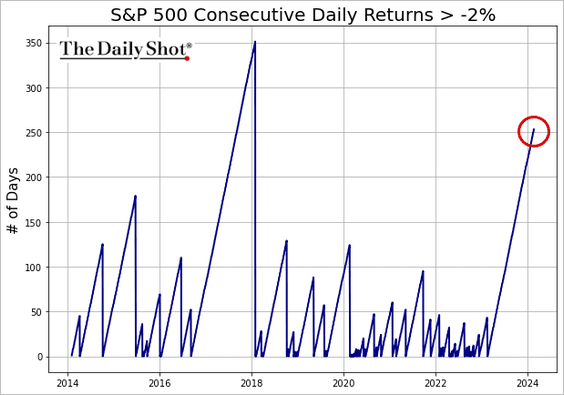
That’s quite impressive (and bullish).
Accordingly, it comes as no surprise that the VIX (CBOE S&P 500 Volatility Index) is trading below its long-term average (red dashed):

Staying with the VIX for a moment, and taking a look at the Futures curve of the contract table, we note that is upwards-sloping (which is normal) with a notable spike into the (US) election months of October/November:

Turning to the index (S&P 500) itself, and as we are speaking about inequality at the beginning of today’s letter, here’s the normal, capitalist version of the index (grey) compared to its more socially inclined, equal-weight version (fittingly red):

Both are up over the past 12 months, though the gap has become … uhh… notable …
The heatmap over the same period illustrates this gap further:

Here’s the chart of the S&P itself:

Looking slightly toppish here. And so it has a week ago, two weeks ago, three weeks ago …
Talking of toppish, last week this chart was making the (social media) rounds:

Well, guess what? I found the antidote this week (even avoiding the chart crime committed above):

Maybe last year’ ChatGPT launch is equivalent to 1994 launch of Netscape, the first web-browser? That triggered a huge wave of IT capex and productivity, which started a multi-year uptrend for the Nasdaq.
Let’s look at the Nasdaq itself then:
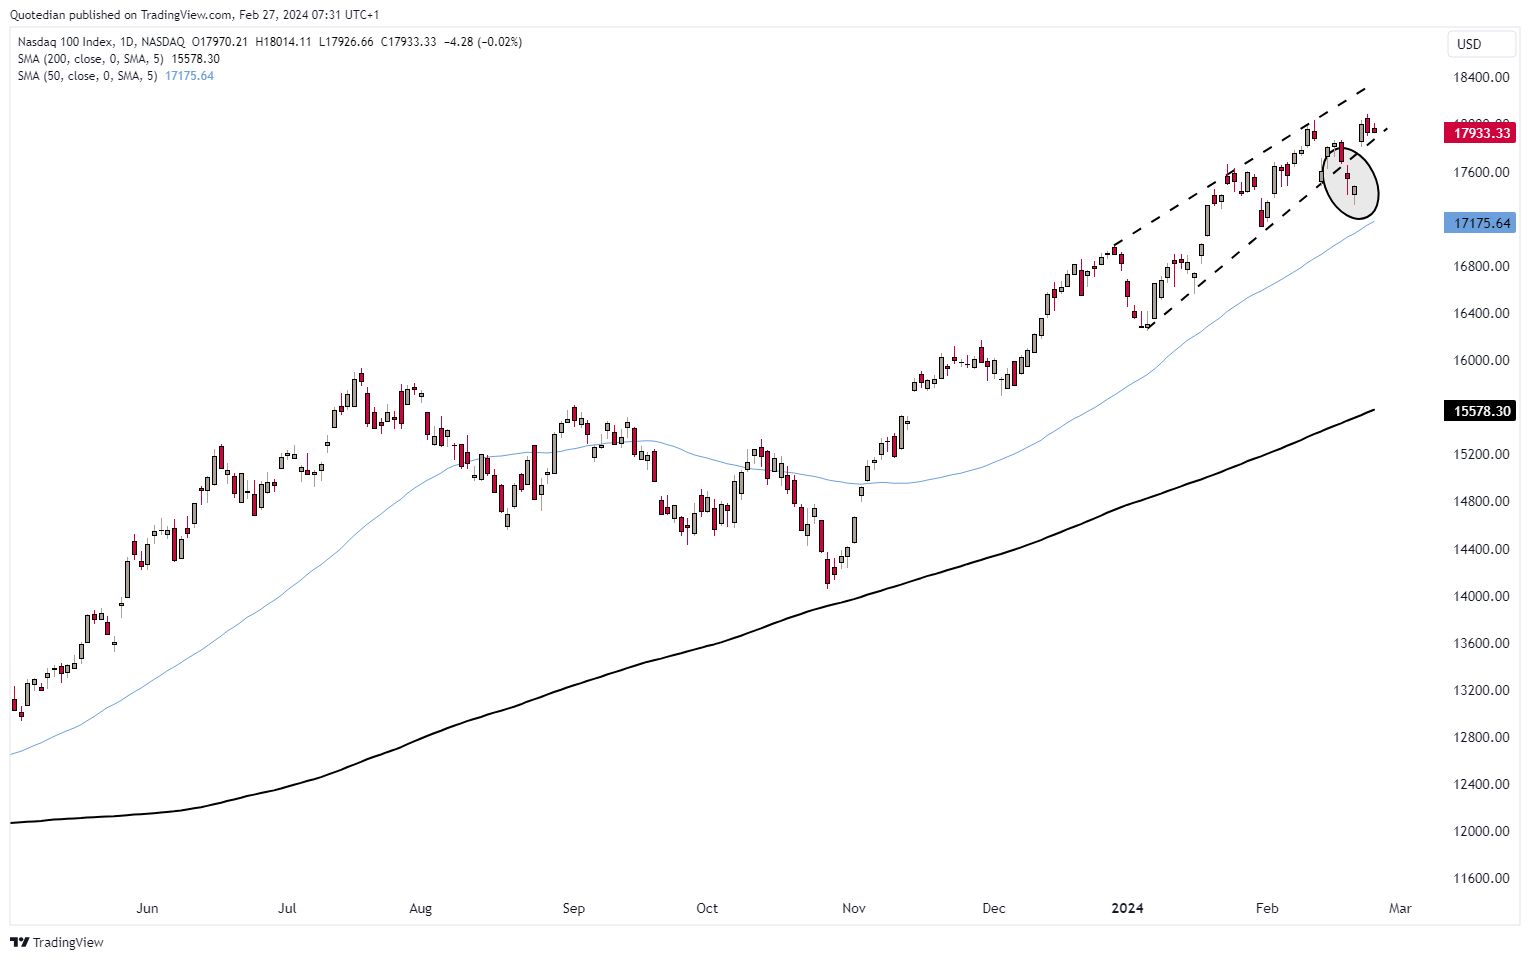
We take note that the breakout (circled) out of rising wedge (dashed liens) was nothing else than a bear trap.

A quick jump over the pond to Europe and a glance at the STOXX 600 Europe index shows that this broad index has now taken out any possible version of previous all-time highs:
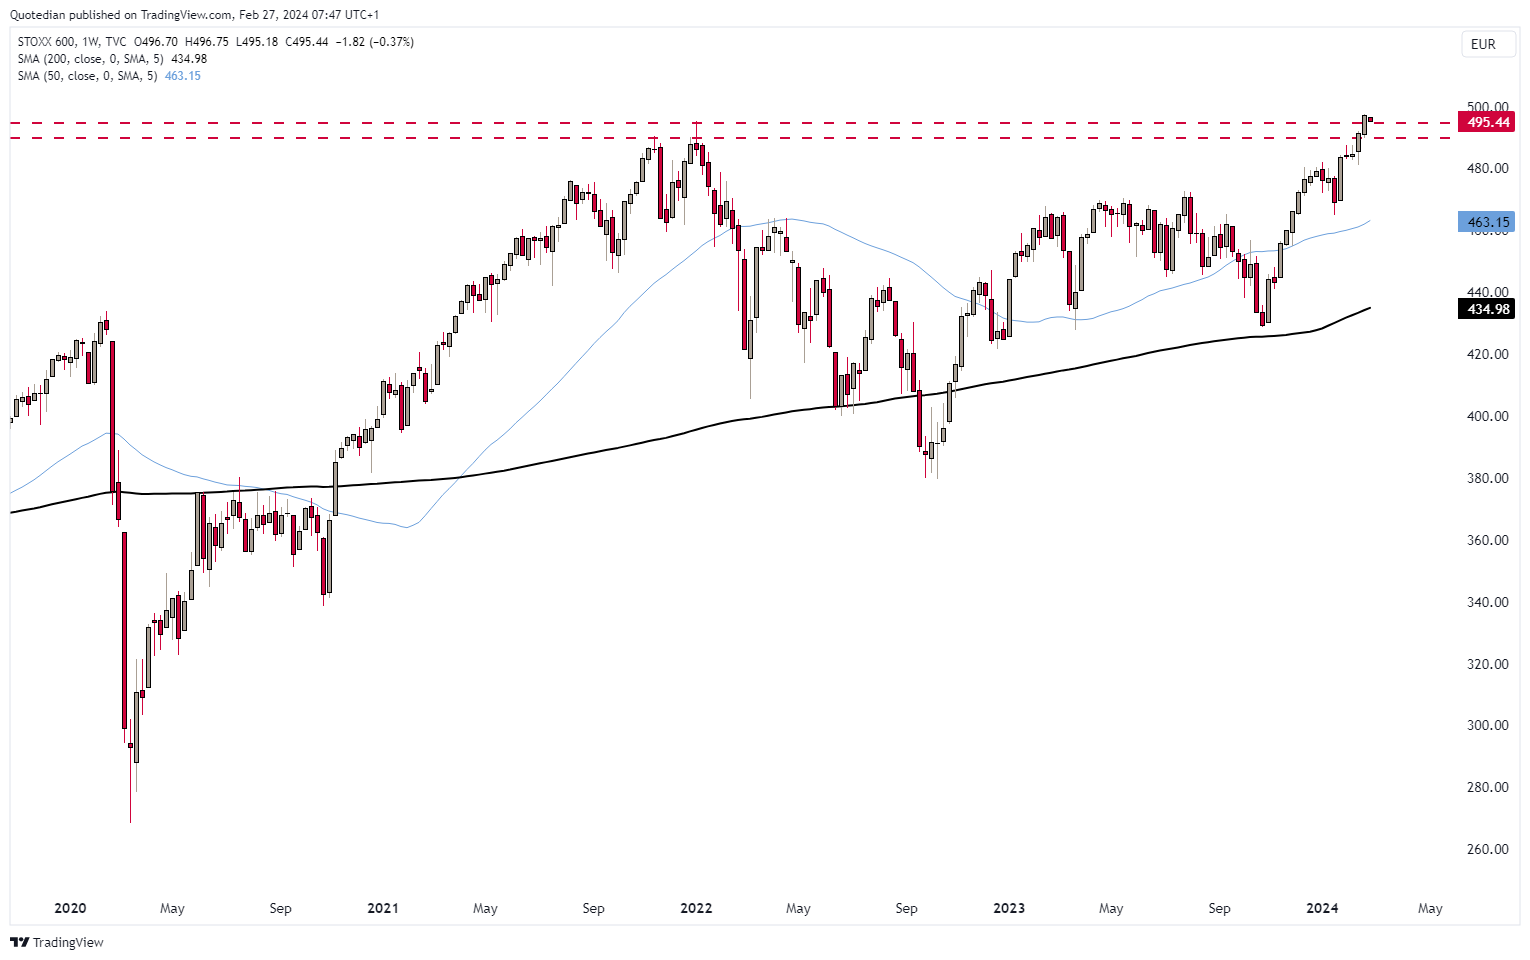
And guess what, participation (e.g. 68% stocks above 200-day moving average ) is broad:

Switzerland’s SMI continues to be one of the lagging indices, but is also in a well-defined uptrend now:

In other words, it has more catch-up potential ;-)
And finally, to finish up Europe ( not figurative speech), here’s the Dax - the index of a country which is in technical recession:
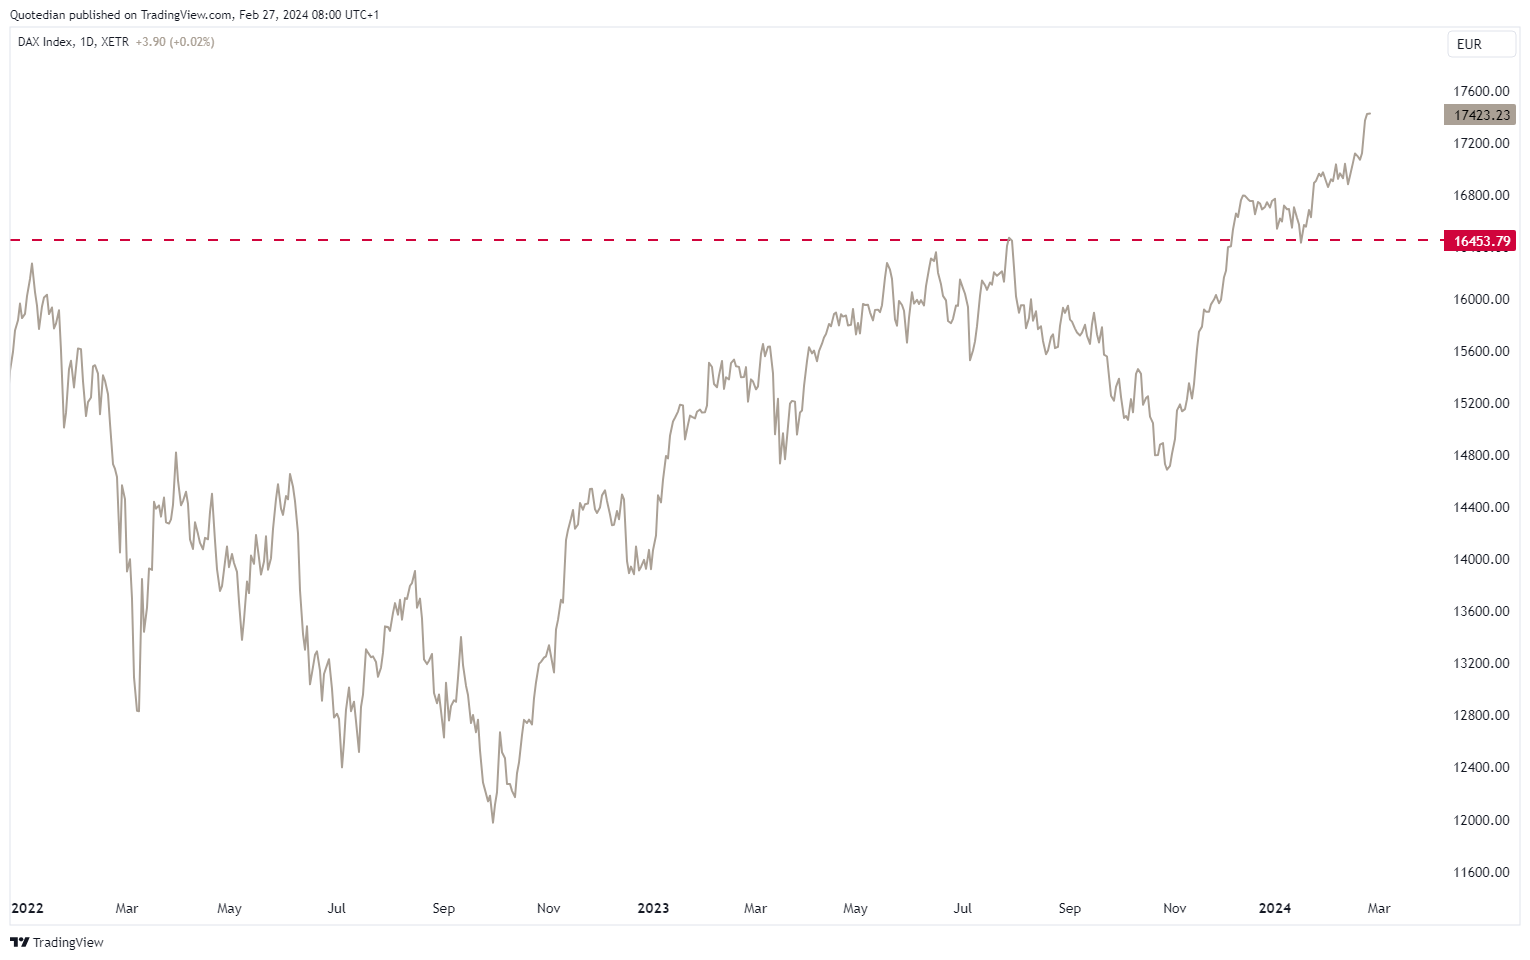
One all-time high chasing the other …
And talking about countries in technical recession with the main equity index at an all-time high, the feat is probably even bigger for Japanese stocks, which have reached uncharted territory for the first time in 35-year:


[Just for completeness purposes, the TOPIX is not quite there yet]
Ok, time to looks at rates.

Treasury yields are seemingly not heading anywhere specific just now, though the drift from price and 200-day moving average is admittedly still to the upside. Here’s the 10-year version of the US treasury yield:

And here is the German equivalent:

Similar chart with one important difference in that the latter is trading BELOW its 200-day moving average.
One country that continues to see falling yields (and hence a bull market in bond prices) is China:

In credit markets, spreads continue to tighten (upper liens are high yield; lower lines investment grade):


In currency markets, the Euro has strengthened a tad versus the US Dollar, as some noise out of the ECB has crushed Europeans’ hope that the region’s central bank may, for once, cut rates before the Fed does:

Taking the Dollar Index view, we see that the greenback is resting right on top of its 200-day moving average:

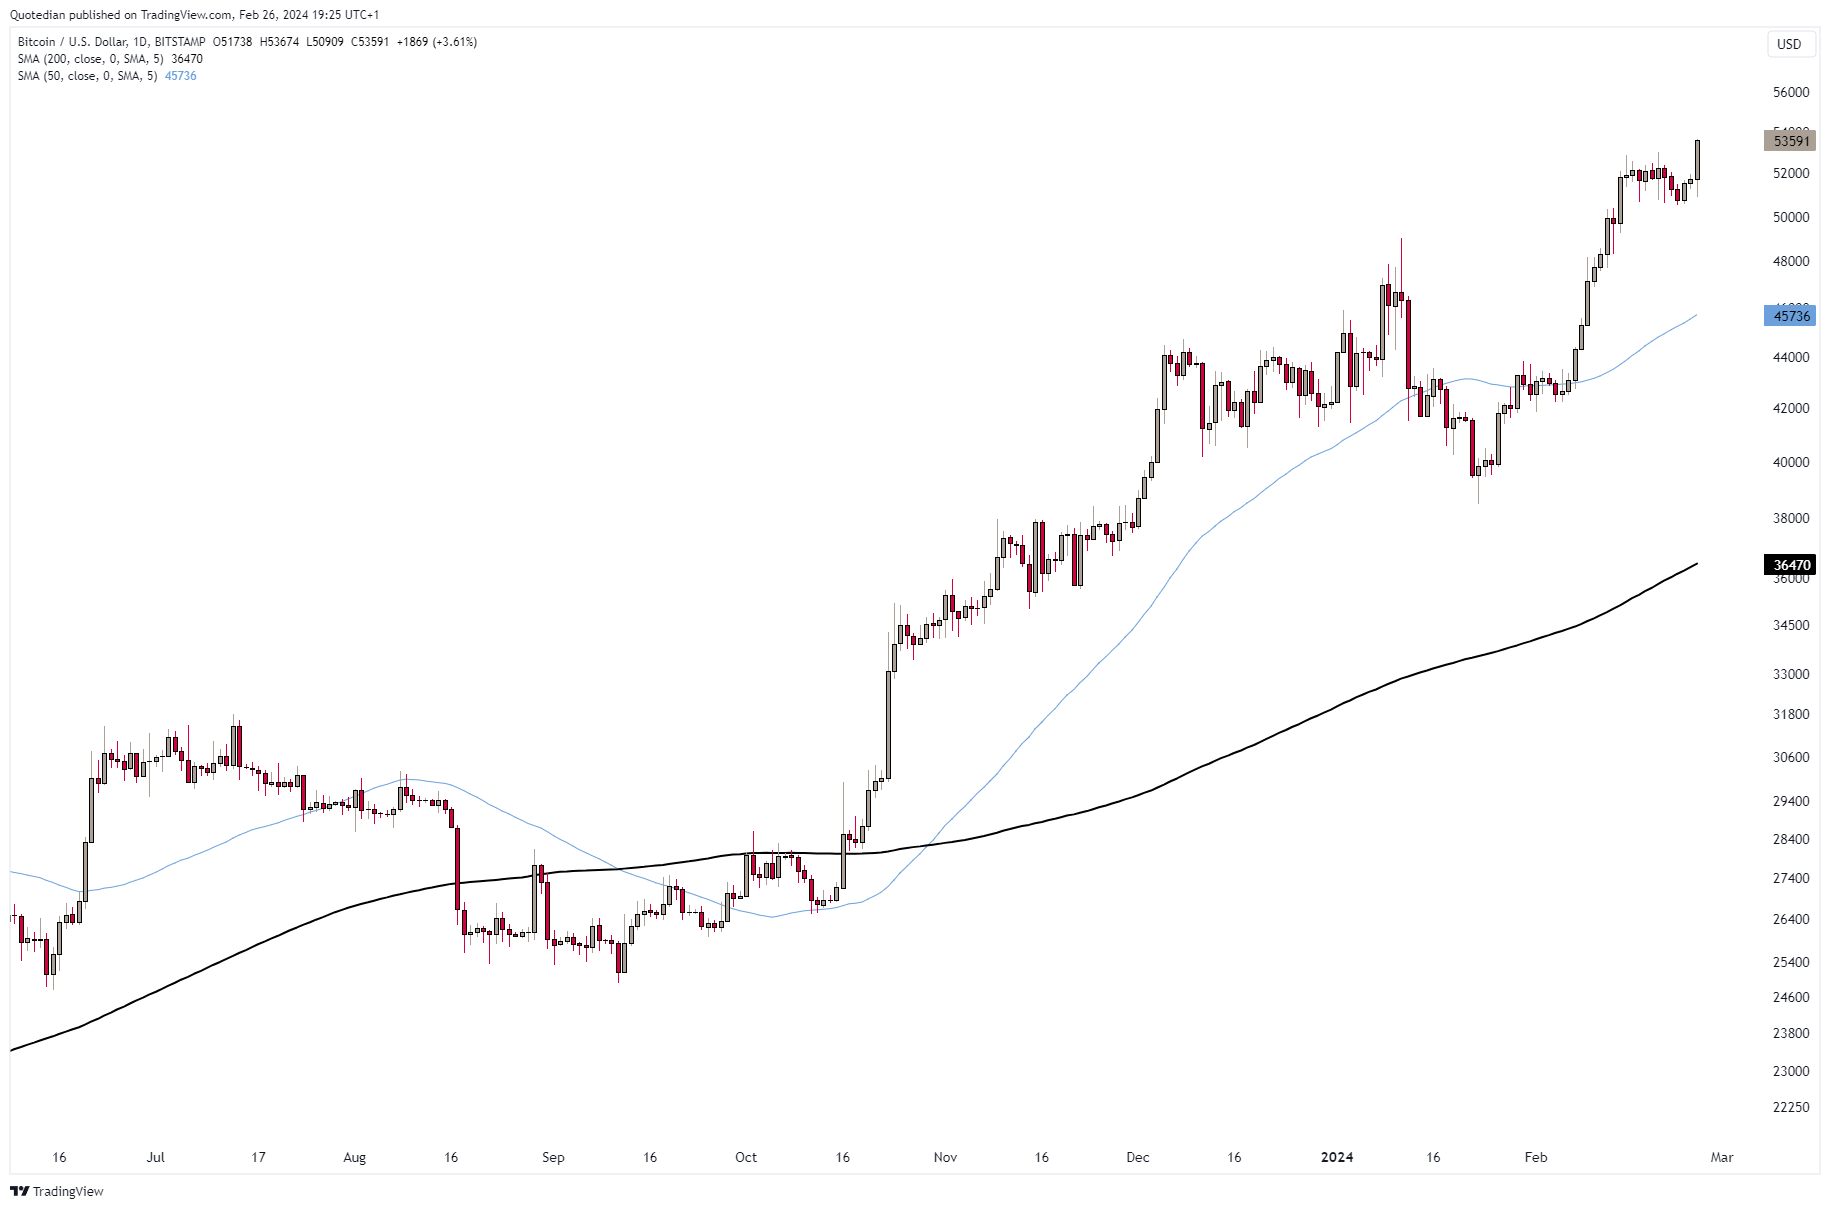
In the cryptocurrencies realm, Bitcoin is starting its next leg up:
FOMO seems to have fully gripped crypto-investors. Here are Bitcoin (red), Ethereum (grey), Solana (blue) and Ripple (dark grey) since the recent rally started just about a month ago:


In the commodity universe, popular commos such as Gold and Oil have been relatively quiet, so let’s look at some of the more ‘nichy’ stuff.
Uranium is seeing its first meaningful correction in a while:

A 13% slump in iron ore prices, questions the viability of any economic rebound in China:

One news item from Bloomberg this morning raised at least one of my eyebrows:
Starting Dec. 30, the EU will require companies to prove that every cocoa bean they import didn’t contribute to deforestation. That means tracing the crop from pod to port, a costly mandate. And no proof means no sale.
“There is a gun to our head to set up systems and get ready,” said Paul Davis, president of the European Cocoa Association. “We expect disruption for about one to two years.”
Would this explain the blow-off top we are seeing in Cocoa futures?


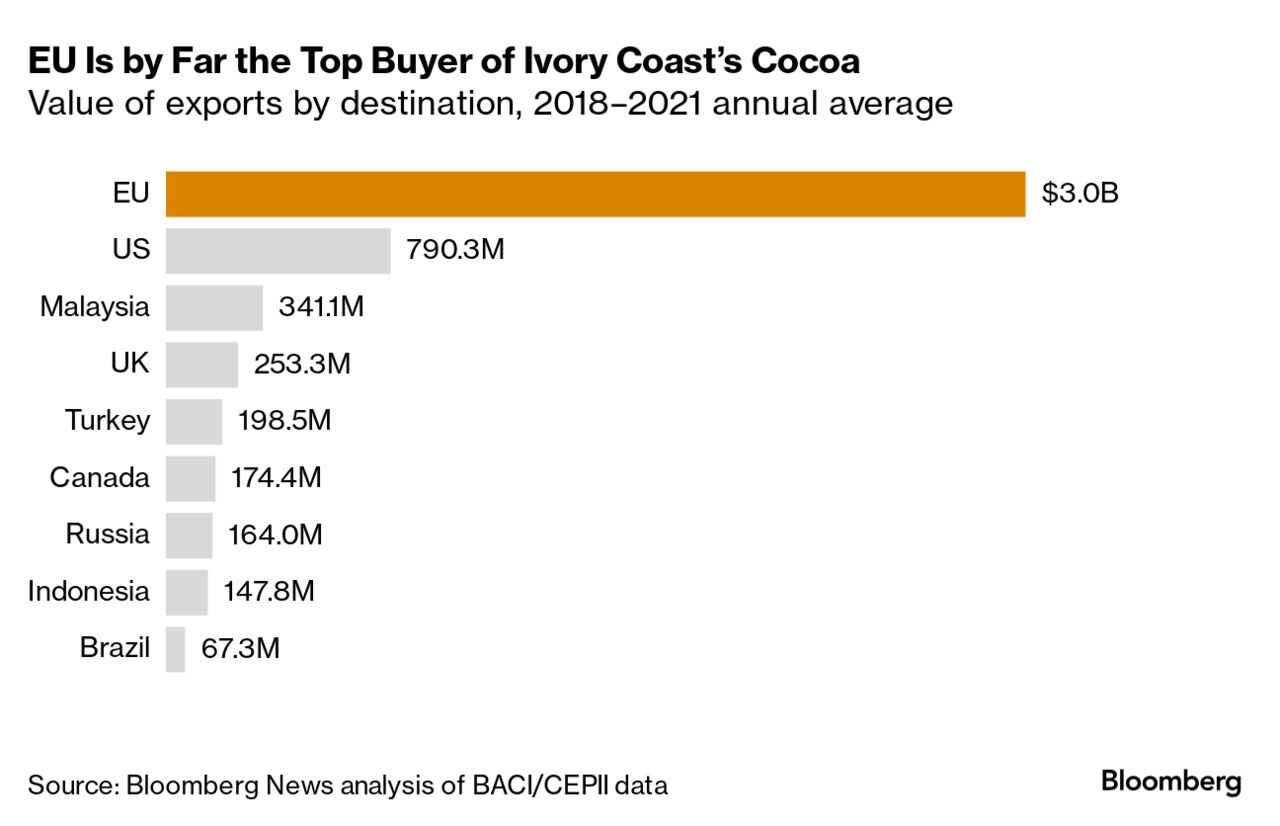
After all, the EU is by far the top buyer of for example ivory coast cocoa:
This may also explain stock price weakness in chocolate products such as Barry Callebaut:

Alright, enough for today. Especially given that the uusually gargantuan end-of-the-month version is only one Friday away. See you towards the end of the week for that!
André

Remember that crazy move in AI stock Super Micro Computer (SMCI) over the past few weeks?

If you think those crazy moves should give SMCI meme-stock status, think again. At least investors in SMCI have been in good central bank company. In Swiss National Bank company that is! And not just over the past few weeks or months, but years!


Everything in this document is for educational purposes only (FEPO)
Nothing in this document should be considered investment advice
The views expressed in this document may differ from the views published by Neue Private Bank AG
Past performance is hopefully no indication of future performance