

Ex-Ante
Volume VI, Issue 2


“It's tough to make predictions, especially about the future”
— Yogi Berra
There are no gurus, only cycles.
— Michael A. Gayed
“The only function of economic forecasting is to make astrology look respectable.”
— John Kenneth Galbraith
“Pundits forecast not because they know, but because they are asked”
— John Kenneth Galbraith
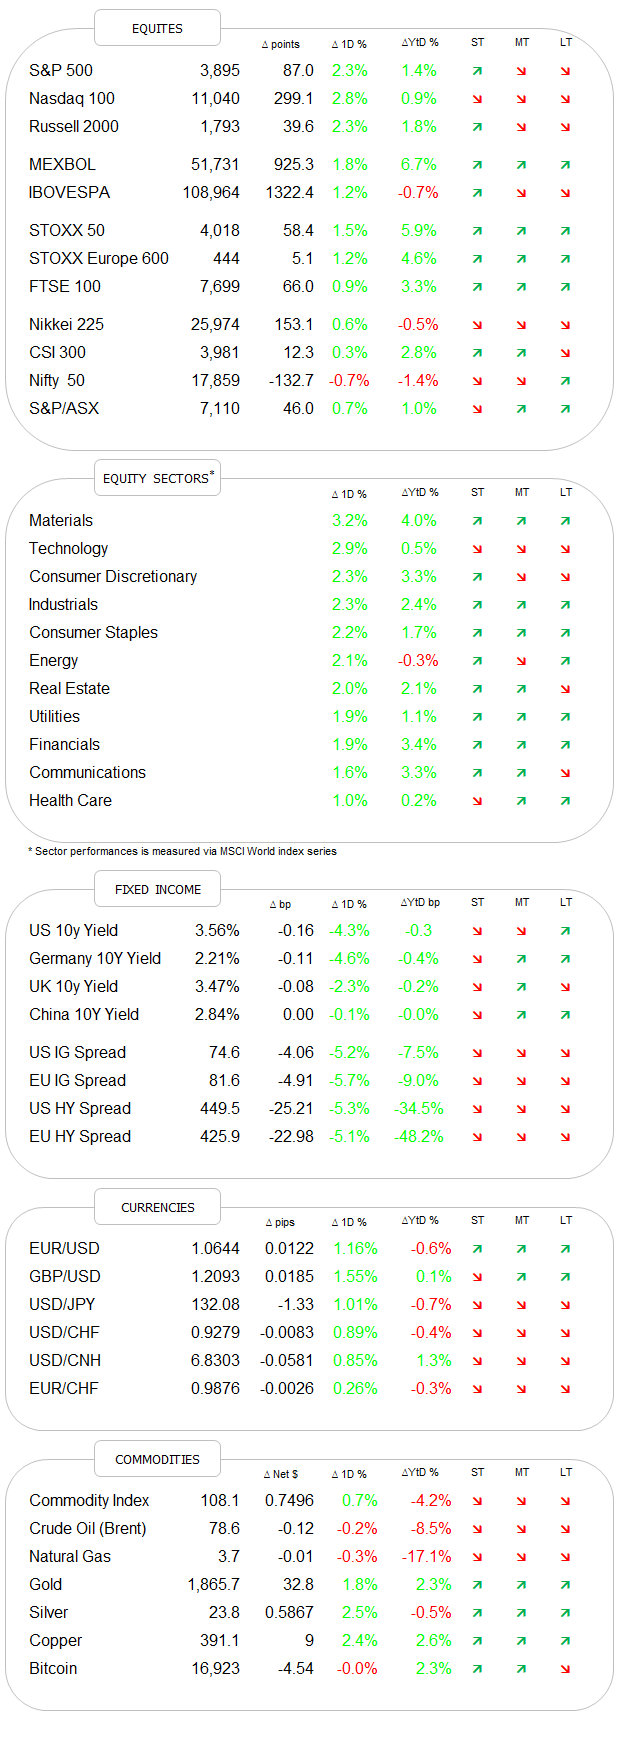
DASHBOARD
AGENDA
Only a hidden agenda in this issue.
CROSS-ASSET DELIBERATIONS
As promised in last Sunday’s Quotedian (that was quite the feat to launch the first Q on day one of the year - given hangover et al. …), in today’s issue we will have a more ‘qualitative’ look at what may lay ahead in the months to come.
The disclaimer to today’s Quotedian is as much in the introducing “Quotes of Day” part above, as they are in their usual place at the end of this document.
As we all know, overall, the success rate of forecasting is pretty low; just ask the IMF for their experience 😈.
Nevertheless, we do need a ‘framework’ or guiding principles when we want to extract alpha from survive markets with a positive outcome over the medium- to long-term.
As this is The Quotedian, let’s lay out our framework with the help of some well-known quotes:
First, we must learn to know that we know nothing:
“The only true wisdom is knowing that you know nothing”
— Socrates
Then, we believe that prices make news, which means we are trend followers:
"The best indicator I know is Trend. The other good ones are Trend and Trend."
— Ed Seykota
and
“To me, the 'tape' is the final arbiter of any investment decision. I have a cardinal rule: Never fight the tape!”
— Marty Zweig
Further, if it is not applicable, i.e. the view cannot be expressed via an investment, don’t spend time over it:
“Focus is more important than intelligence”
— Anonymous
Then, walk the talk and implement remembering that position size is more important than entry level:
"The key to risk management is never putting yourself in a position where you cannot live to fight another day."
— Dick Fuld (post mortem: forgot to heed his own savvy advice)
Finally, remember my friend Louis’ advice:
“Money Managers Aren't Paid to Forecast; They're Paid to Adapt”
— Louis Gave
And now we take all of the above and package into LDV’s timeless advice:
“Simplicity is the ultimate sophistication”
— Leonardo da Vinci
Ok, so before we get on with the tactical observations for the next few months, let me lay out what I consider the ‘bedrock’ scenario for the next five to ten years or so.
If I had an 84-paged pitchbook on my longer-term views and you’d twist my arm to pick only three slides out of it, I’d choose the following three:
The disinflationary environment of the past forty years is probably largely over:

This is my current template for the inflation roadmap:

If this turns out to be more or less correct, we need a much more proactive approach to asset allocation than over the past 40 years:

Alright, finally, finally on to some more tactical charts and views. First of all, we have what I call a three-body problem:
The consensus view is that the first half of 2023 will be difficult for (equity) investors, with a recovery in the second half
I agree with that view
I and the consensus are usually wrong
So, my best guess is that it will be a difficult year for most assets. Full stop.
EQUITIES
Remember this statistic I showed sometime in December?

This probably does not mean that they are wrong and we will have a positive year, but rather, as usual, they are too optimistic …
The expression ‘soft landing’ has made the rounds in the first week of this year, with voices becoming louder that the Fed might really manage to pull off a second soft landing in their 110-years of existence. But as the always excellent Peter Boockvar points out, what if a soft landing is followed by a soft recovery?
On the chart (S&P 500), our basic rule “nothing good ever happens below the 200-day moving average” continues to apply:

I think we can agree that we are currently in an at least cycle bear market for stocks and bear markets tend to have three phases:
Phase 1 - Valuation (downwards) adjustments - i.e. excesses of the previous bull are being corrected
Phase 2 - Economic impact (from Fed tightening) hits stock markets
Phase 3 - Panic selling and throwing in the towel. A generation of investors gets lost
With the S&P 500 at a P/E of 19x, it could be argued that we are still not completely done with phase 1 …

So, let’s go back to the chart of the S&P 500 and zoom in somewhat in order to draw a few ‘lines in the sand’.
A wide downside target area for me remains 3,300-2,900:

The worst-case, armageddon target is between 2,300 and 2,200:

Should we break decisively above 4,000 I would become tactically more bullish, but not before that:

A possible target zone in such a case could become 4,300 to 4,500:

But always keep in mind the third slide (nothingness) from our bedrock scenario above …
European stocks had a very good start into the new year, outperforming their US peers close to threefold in the first week of trading. Can the trend continue?

Pssst, don’t tell anyone, but European shares (SXXP) are trading above their 200-day moving average (MA)! A closing above 450 would put all lights (ST, MT & LT) on green:

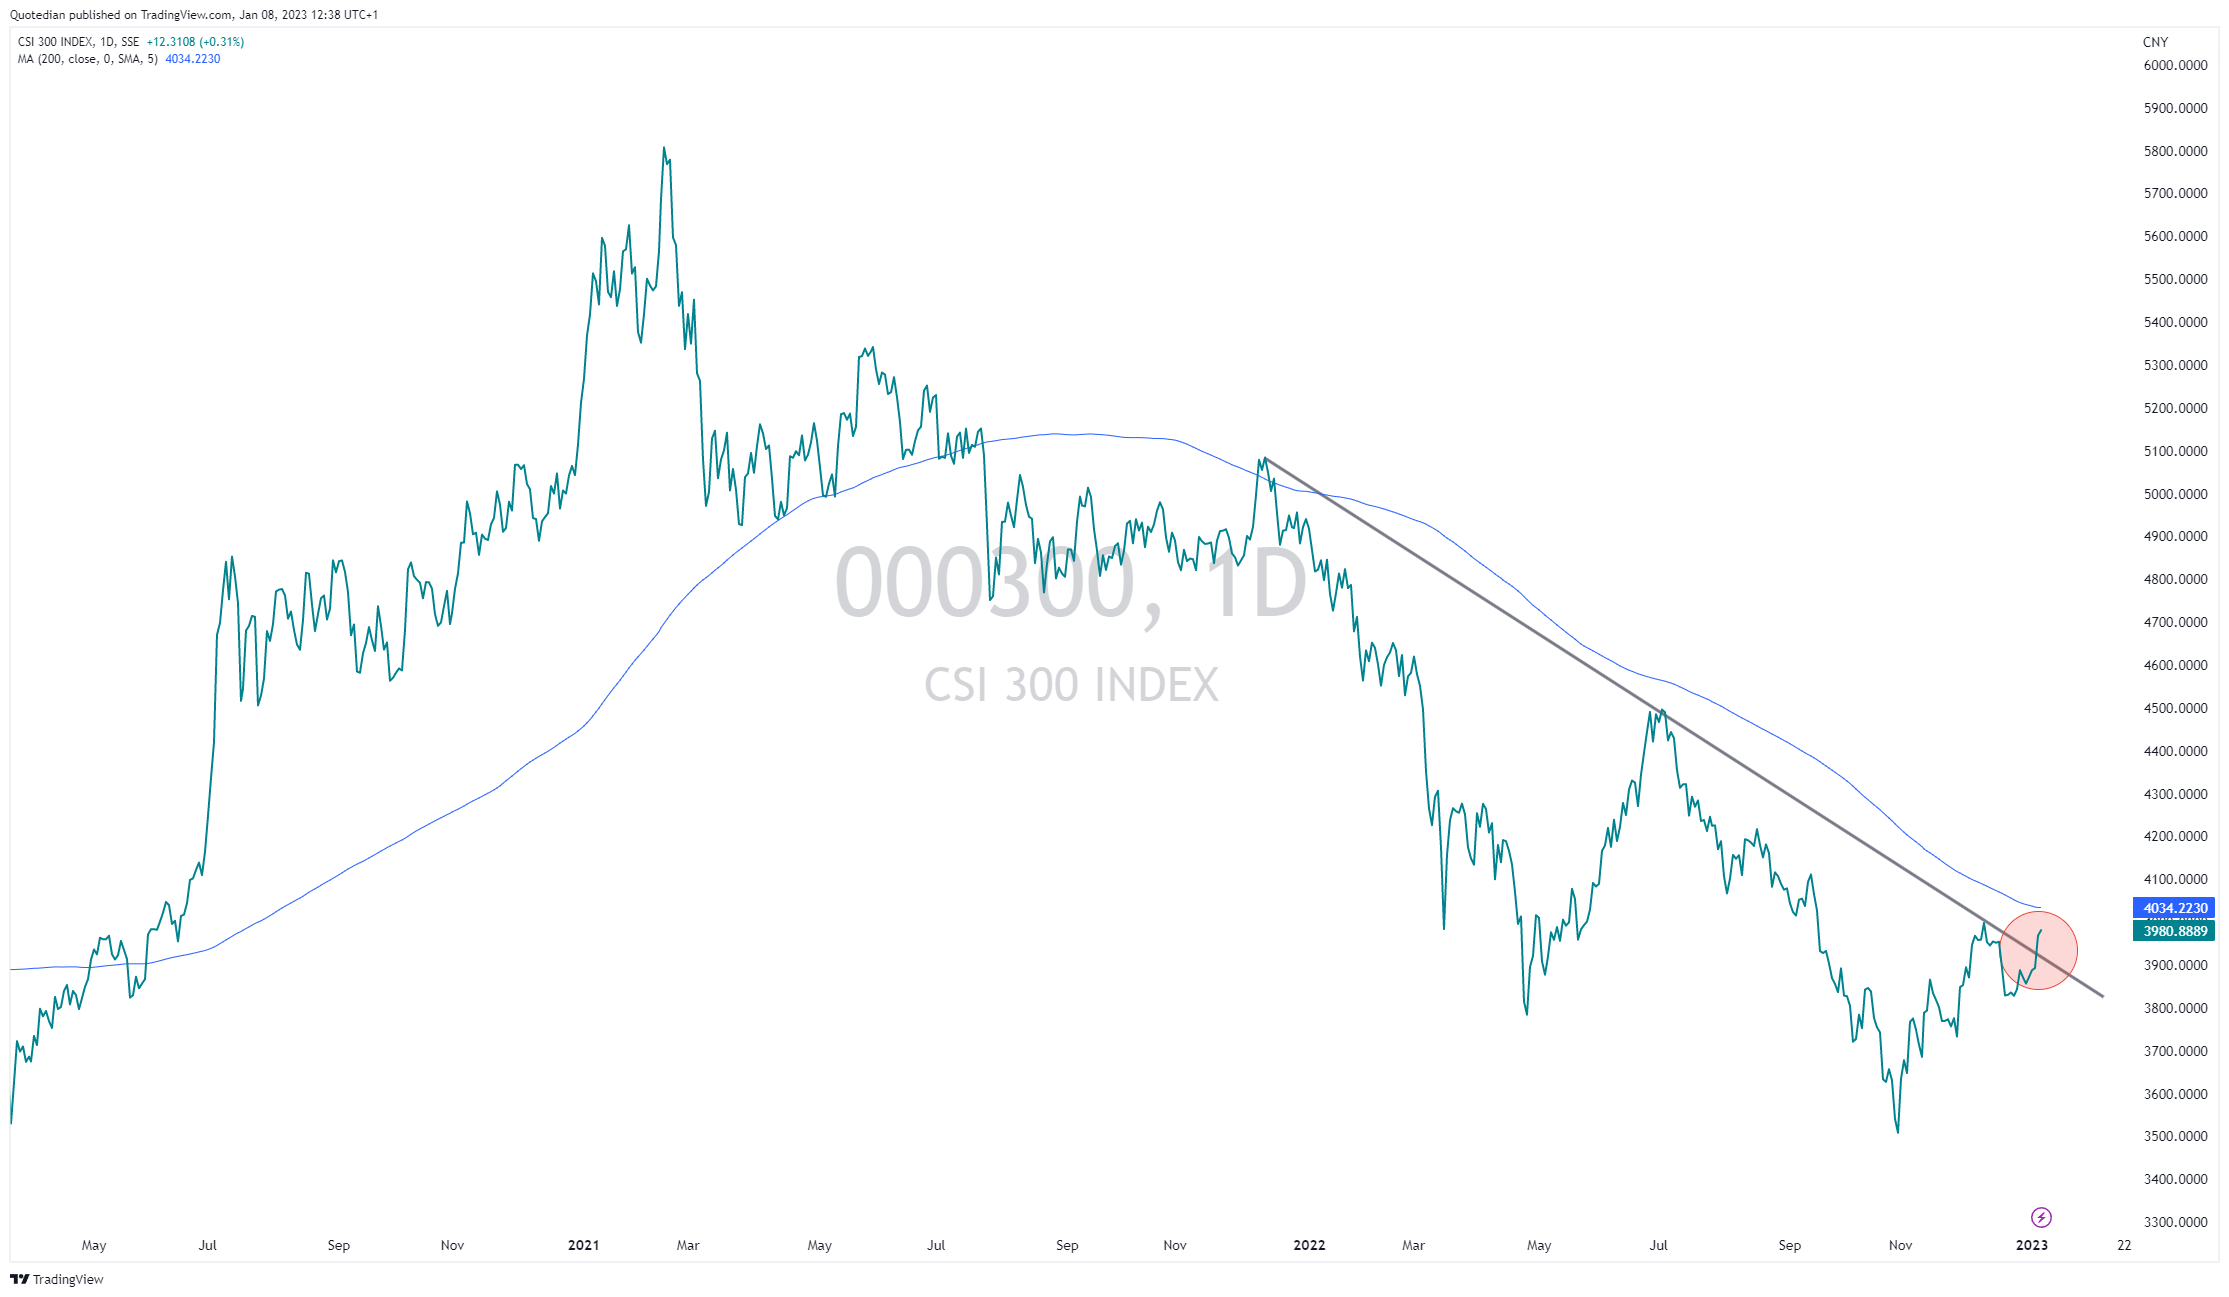
The chart on Chinese stocks post re-opening starts to look very constructive - breaking above the 200-day MA would be final confirmation for an overweight positioning:
The chart on the Nikkei 225 invites for a mean reversal trade here, with a tight stop just below the dashed black line. Should the index drop below 24,000 there would be substantial room to the downside:

FIXED INCOME
We discussed already last week how 2022 was the worst year for bonds since 1788:

Most of the downside came due to raising interest rates, whilst performance contribution from credit risk remained relatively contained, especially given the 20% downside (S&P 500) in stocks.
In my books, these two main factors of bond risk (rates & credit) will be the opposite in 2023. I.e., interest rate risk will be flat to positively contributing as the Fed stops raising rates in the coming months (but will not lower them either), but credit spreads will rise as stocks move into phase 2 (earnings recession - see above) of the cyclical (secular?) bear market.
But let’s take it in steps …
Looking at the US 10-year Treasury yield as global benchmark, we take note that a drop below 3.40% could be bullish for bonds (but probably not for stocks):

On the very long-term chart, a drop below 2% on the Tens would just be a natural retest of the previous resistance (black dashed line) now turned support:

Taking the Moody’s BAA minus AAA corporate bond indices as an indicator of credit spread wideness, we see that the current level has not quite reached previous peaks (red dashed line) yet:

Maybe worse, when zooming out on the same chart and remembering the structurally inflationary period from 1968 to 1982 as mentioned above, we realise we could be in for some … ehm … volatility:

European rates, using the German Bund as a proxy, spiked into year-end, as the ECB started sounding as hawkish as the Bundesbank did in its heydays:

As a result, the yield curve has inverted further, which takes some umpf out of the argument for further outperformance of European equities:

One more on the fixed income side before we move on to currencies … don’t you just hate when some smartie pants comes along and shows you what you should have invested in? Let me be those pants for you for a moment … Here’s the yield-to-worst of the Bloomberg China High Yield index at the end of October:
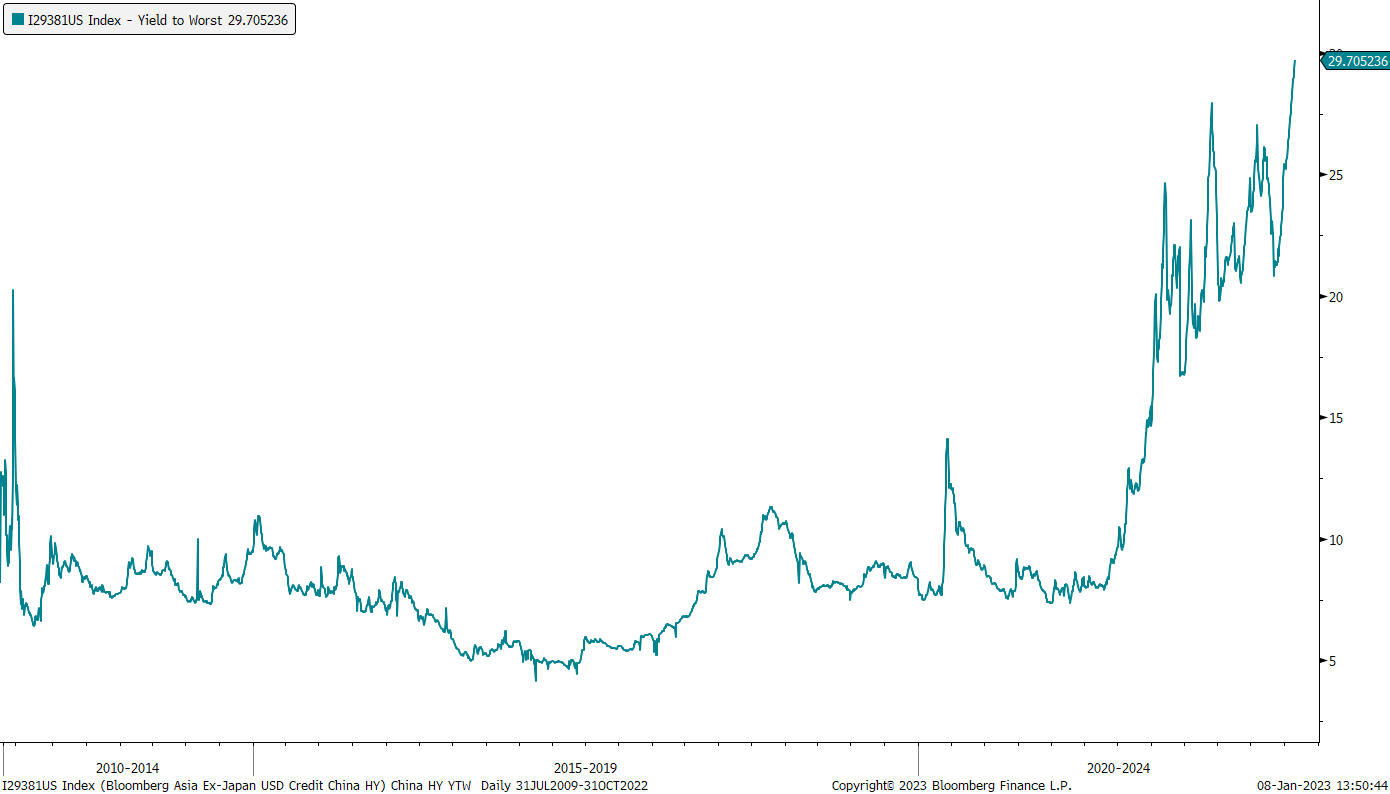
And here it is updated as per last Friday:

Proxying that trade via the KraneShares Asia Pacific High Income Bond ETF that would have 17% upside (before a 9% dividend yield!) over the past two months:

COMMODITIES
So, are commodities in a bullish supercycle or not? Using the S&P GSCI Commodity Spot Index (SPGSCI) as a barometer, we note that the run-up last year has not only been as impressive as it was back in 2005-2008,

but also that we are only 8% away from having corrected half of the entire up move:

If we change the denominator of the SPGSCI from USD to the stock market (SPX), we quickly realize that from a mean reversion point of view the overweight commos/underweight stocks trade may well still be alive:

This fits well with my view that commodities still have a place in a well-diversified portfolio over the coming years as a) ESG-related underinvestment over the past decade has created a chronic short-fall and b) geopolitical tensions are on the rise and with everybody looking more to himself than to the good of others, commodity hoarding will become fashionable.
Hence, the current weakness especially in energy commodities, should be used to continue to build exposure. Here’s an interesting Tweet from Hedge Fund Manager Pierre Andurand that literally just crossed my screen as I was typing this paragraph:

Of course, the most closely followed (and invested) commodity is Gold, which I think had a great year in 2022, given the headwind of rising interest rates and the rise in real rates:

Here’s the long-term chart of Gold in USD:

Zooming in on this, the chart actually looks very constructive with a $200 since we all have triggered our respective stop losses on the long position after the break below $1,680:

For EUR-based investors, which most of us are, the Gold chart is even more constructive:

The recent break out of the consolidation channel (grey shaded) gives a conservative price target of EUR2,050 - that’s a 15%+ rally from the current level…
And just to drive the case for gold in the asset allocation process home, here’s Gold (GLD) versus stocks (SPY)


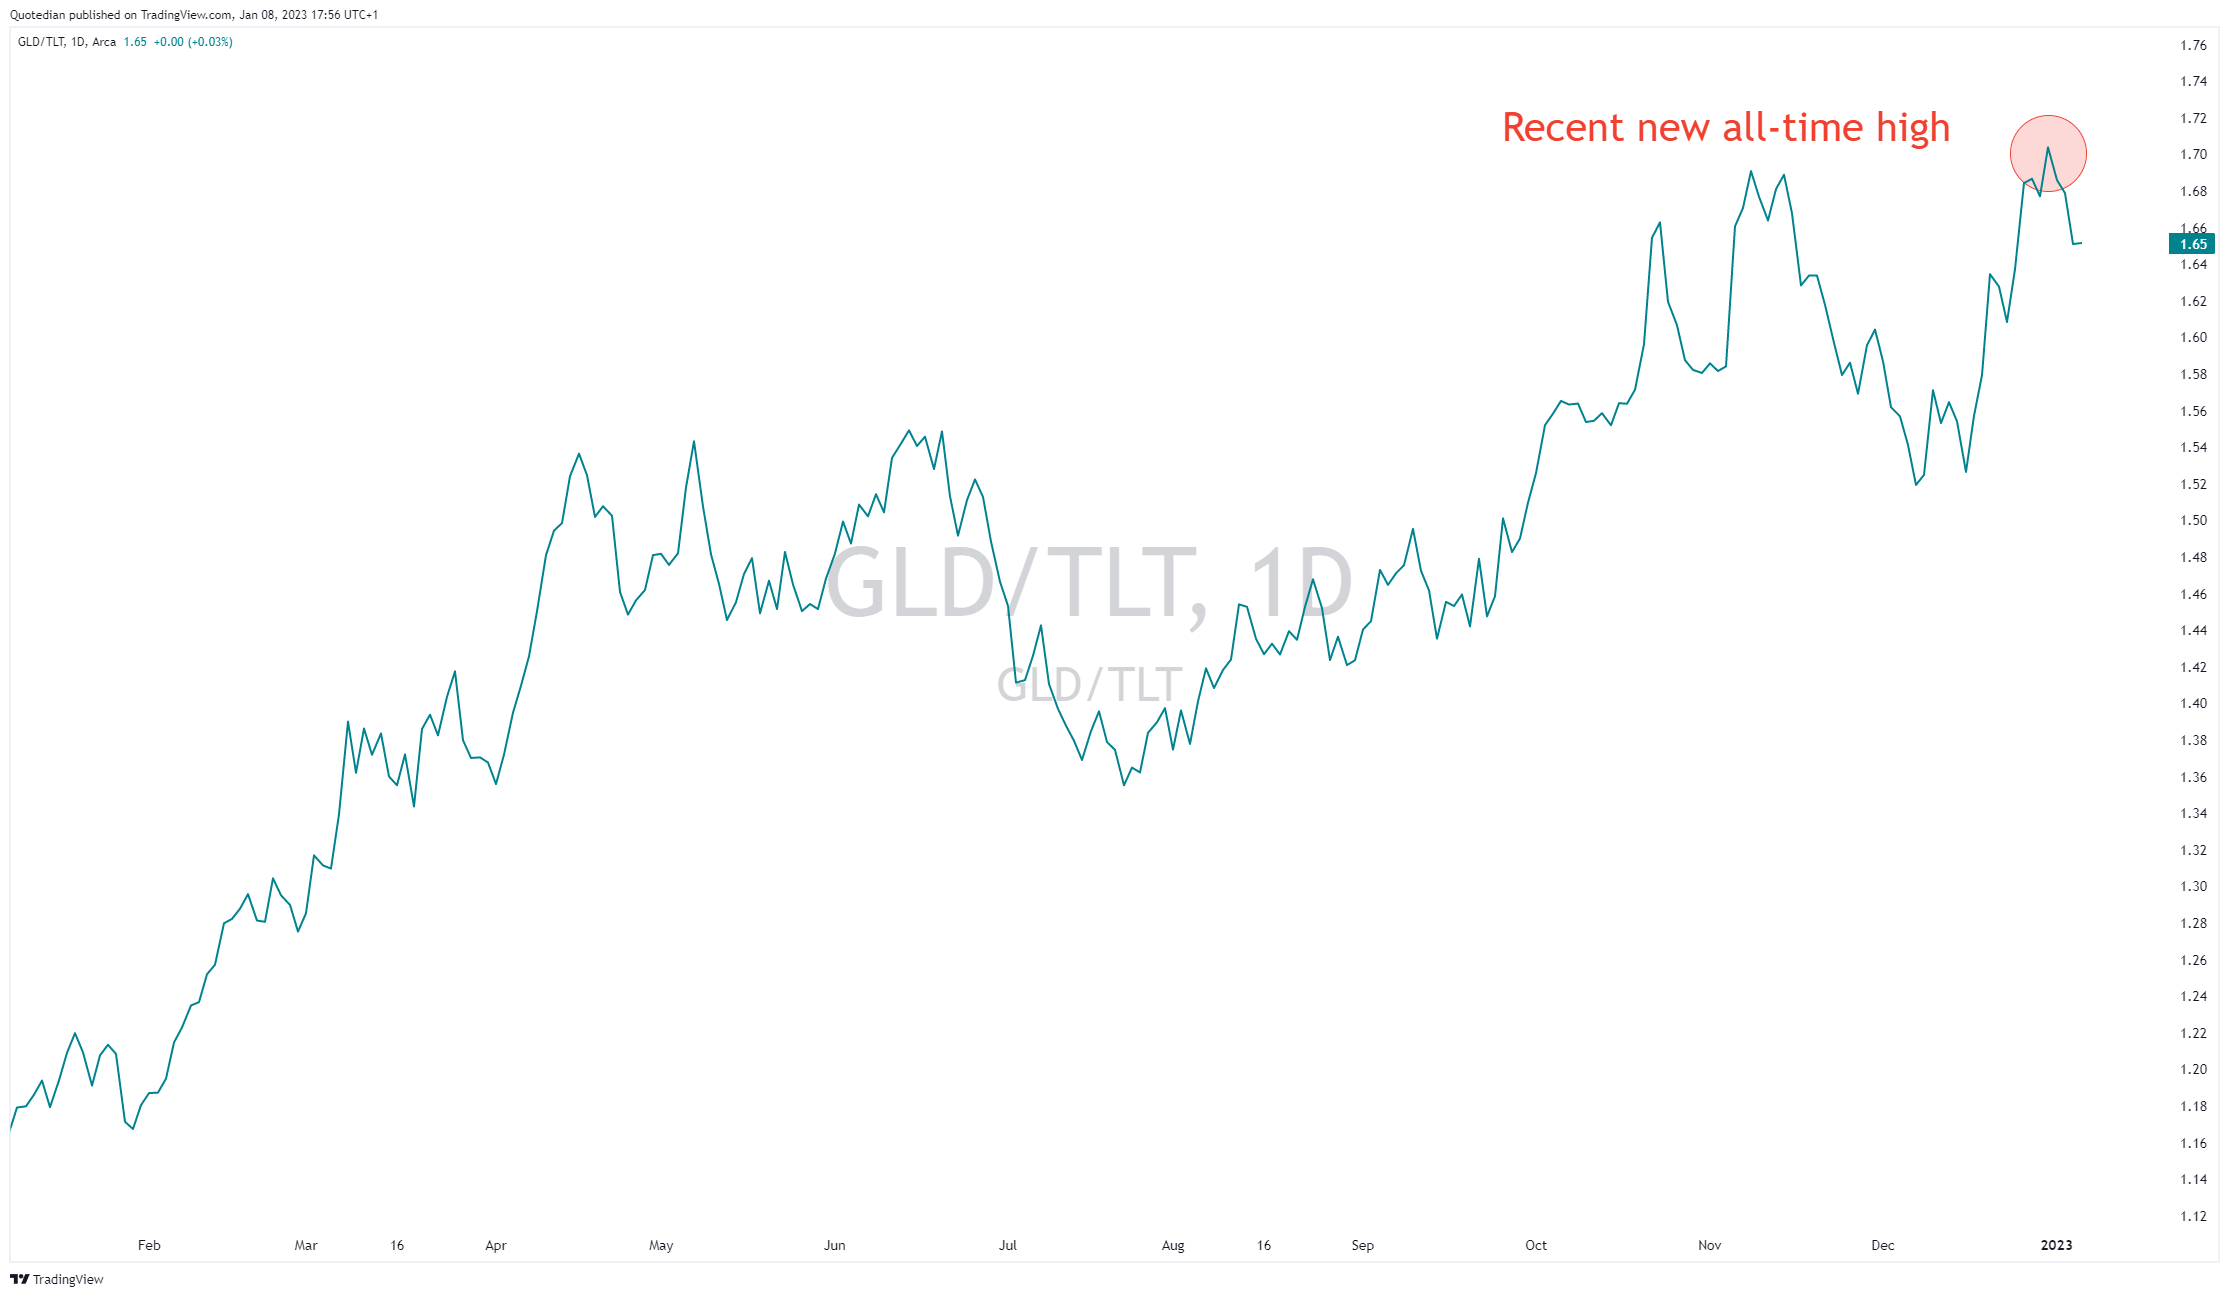
and here versus bonds (TLT)

As usual, I had planned to write much more (currencies, grain commodities, private debt & equity, etc.), but I have run out of time and you are probably out of patience to read any more. Hence, let me hit the send button with the promise to cover other assets over the coming issues.
Just two pretty pleases from my side:
Please #1: If you like The Quotedian, please share it with your network
Please #2: If you like The Quotedian, please express your love by hitting the ‘Like’ button at the bottom of this document.

André
CHART OF THE DAY
After all the scaremongering and by your favourite Cassandra, let’s put everything back into perspective:

Thanks for reading The Quotedian! Subscribe for free to receive new posts and support my work.
DISCLAIMER
Everything in this document is for educational purposes only (FEPO)
Nothing in this document should be considered investment advice
Past performance is hopefully no indication of future performance
Congrats André.
Excellent analysis very well presented and reasoned.