Ex-Post
Volume VI, Issue 1
“When you learn a little, you feel you know a lot. But when you learn a lot, you realize you know very little.”
— Jay Shetty
DASHBOARD
AGENDA
CROSS-ASSET DELIBERATIONS
Happy New Year to you all and welcome to the first issue of this year. Naturally, will we today focus on the statistical data from last year - on what worked (very little) and what did not (a lot).
So, depending on when you are opening this email, make sure to grab yourself an Alka-Seltzer, a coffee, a tea or even a drink (dry January anyone?), make yourself comfortable and enjoy the following few pages of quantitative tables and stats.
After this ex-post review, we will take out our broken crystal ball for a more qualitative ex-ante view either tomorrow or in the coming days and see what could lay ahead in this new year just started.
Finally, make sure not to miss the “housekeeping” note I have placed at the very end of today’s letter.
Starting with equities, no “spoiler alert” warning is necessary as we all know that it was for many markets the worst year since the GFC in 2008/09:
Unless you are heavily overweight Indian stocks it is very likely that your equity allocation has contributed at least high single-digit negative returns.
Of course, does the above stat only look at some of the best-known and most widely-followed benchmarks. Taking a look at what Bloomberg (BBG) defines as ‘Primary Equity Markets’, we take note that you could have done fantastically well in the Turkish or the Argentinan stock market:
Even when adjusting for currency (e.g. EUR):
At the other end of the performance spectrum are Russia (no surprise) and Vietnam (mild surprise).
At a stock picking level, our weekly updated tables of the top 25 performing names on a year-to-date basis show that most of the winners throughout the year continued to win right into year end:
In the US it was clearly the year of the fossil fuel companies, whilst in Europe defence stocks (Rheinmetall, Dassault, Thales) were to the place to be. None of this comes as a surprise given geopolitical events and none of these are themes likely to go away anytime soon …
But we never looked at the worst performers in the past, so let’s take the year-end opportunity to do just that:
A lot of previous ‘darlings’ are there on the losers list - especially in the US (TSLA, NVDA, META, NFLX, etc.)
This takes us to the equity sector performance section, where, ladies and gentlemen, the dispersion between the best (energy) and the worst (communications) sector is a baffling 59%!
Whoever said that sector picking may be more important than stock picking was no fool!
As we’re doing the year-end report, let’s take a slightly more granular look by also observing the performances at group level in the US and Europe.
Here’s the US group performance:
And then the same stat for European groups:
To conclude the equity section review, let’s have a quick look if there were any specific investment factors/styles where to hide in 2022:
Short answer: not really! Of course was it much better to overweight value and low vol and underweight growth, but for a long-only investor, there was no positive absolute return to be had.
This brings us to fixed income and a lot of pain:
After close to 40 years of disinflation the first real pick-up in (transitory - ha ha) inflation killed not only pure bond investors but any asset allocator really who carried a bond allocation in order to counterbalance losses on the equity allocation (ha ha again).
Here’s how bad the year was for a USD-based global fixed-income portfolio full of treasury and corporate bonds:
And if you are not convinced yet of the ‘Ursus Magnus’ cycle bonds are in, the following chart from BofA is helpful. I only have the version last updated end of October, but you get the idea that it has been the worst year for bonds since 1788:
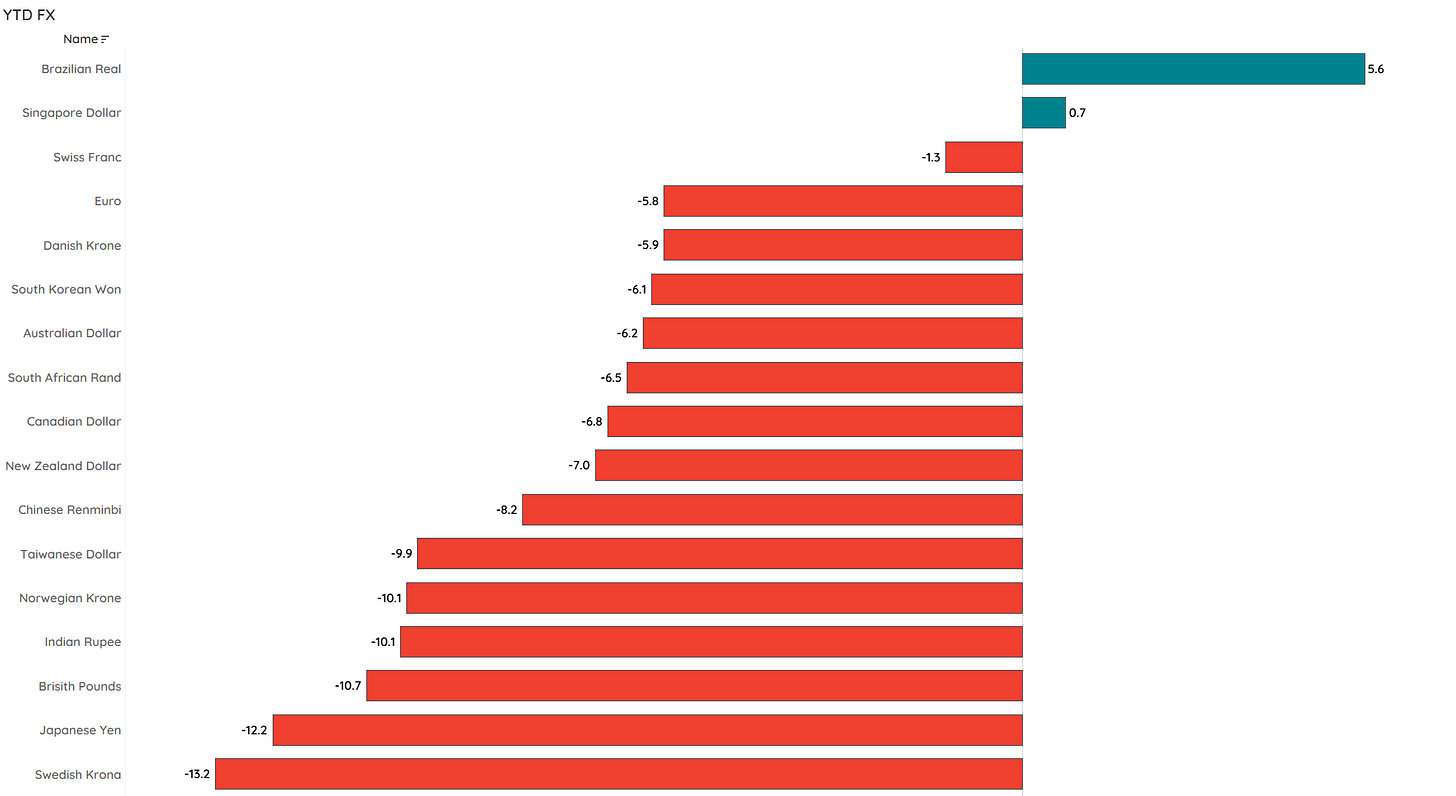
Ok, on to currency markets, where a Q4 sell-off in the US Dollar clearly helped to fend off even more damage to international capital markets. Still, it was a year of Dollar strength as investors rushed to load up on the ‘safe’ greenback:
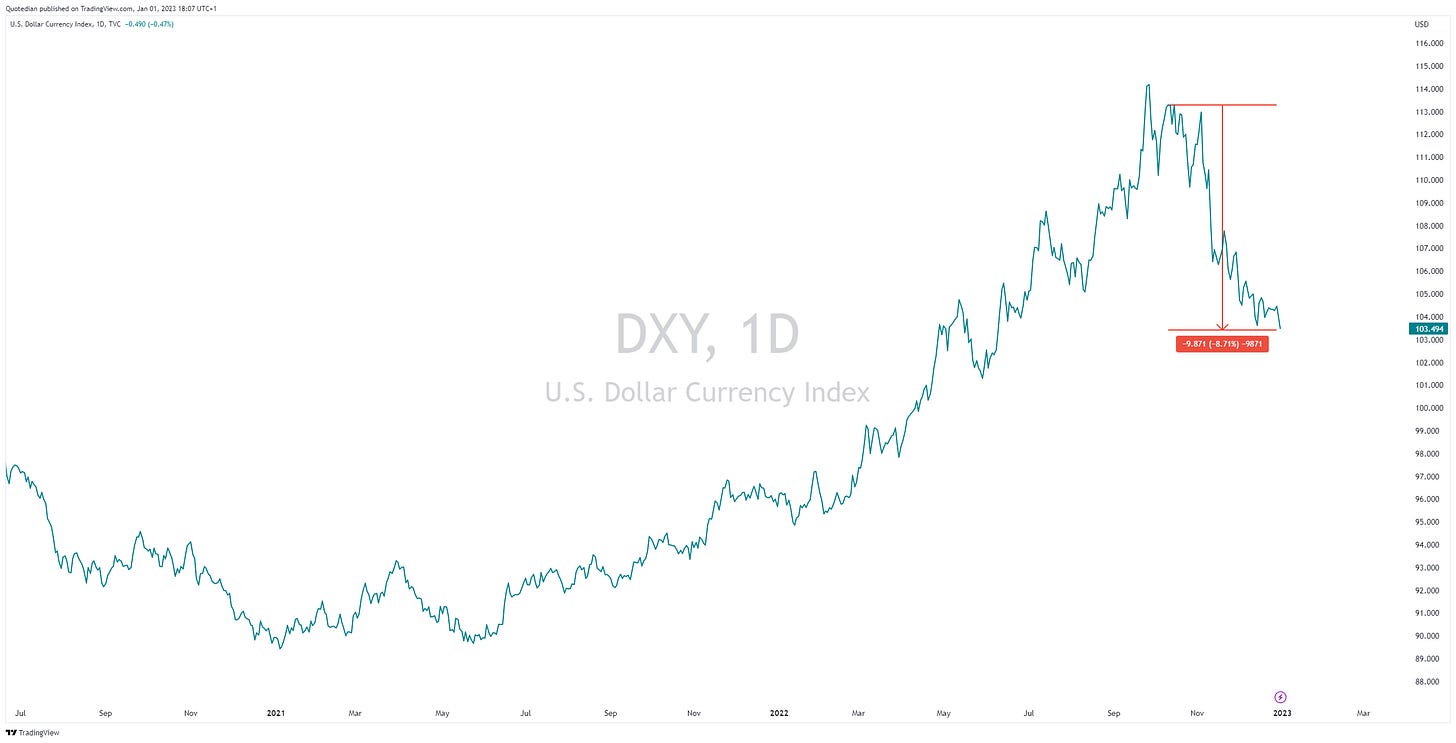
Let us take just one small victory lap here quickly, as we really nailed the top in the Dollar via observing the magazine front cover story indicator. This is the chart we looked at on October 11th after our initial observation around September 30th:
This is what happened thereafter:
Last but not least, let’s take a look at commodities, which surely had a fantastic year as the new commodity supercycle just started according to many. Right?
Well, turns out it was slightly more nuanced than that. The main commodity group where we might have some allocation, precious metals, was actually flat on the year. Industrials slightly negative. If your not an ESG freak there’s a chance you had some exposure to energy stocks (low PE, high DY - why wouldn’t you…), but you probably did not have exposure to barrels of black gold or natural gas and the likes. Neither are you likely to have a lot of grains as part of your global asset allocation. Bummer!
Here’s a more granular view of how some of the commodities futures have done:
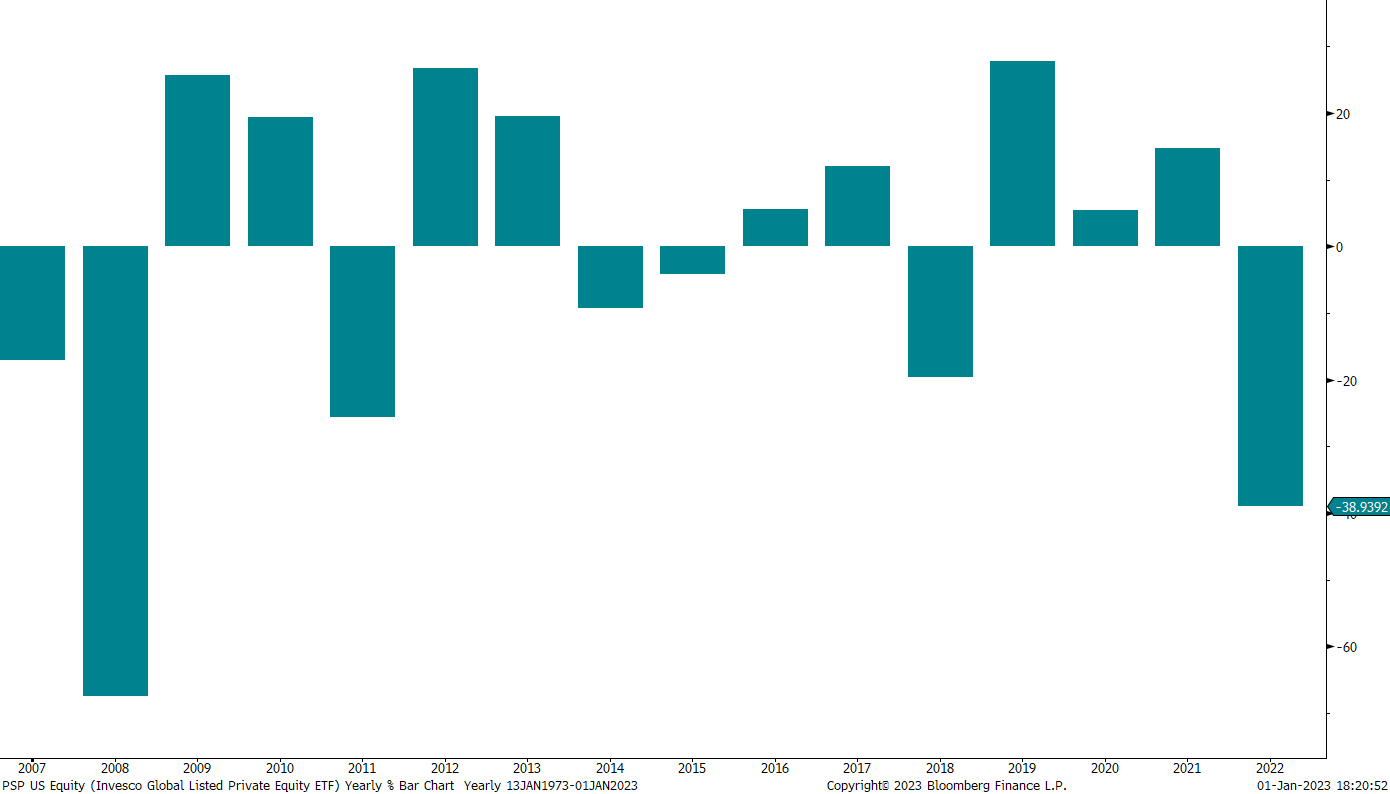
This brings us already to the end of our 2022 ex-post analysis. As always, there was so much to be observed and written about, like for example that private equity did not have a great year either - putting it mildly. Taking this ETF of listed private equity firms (an oxymoron?) as a proxy:
Or if you consider out-of-the-box asset classes such as Uranium, you could have had a major positive contributor to your overall performance (this year and the past three):
Anyway, these are a few of the themes I want to explore in The Quotedian over the next few issues as we are starting into the new year. So, stay tuned…
And … that’s all folks! At least for today. Well, one final one - here’s the promised housekeeping note:
The Quotedian will due to a heavy-lift private project and pending an important announcement not yet go back to full, daily production. I promise to post at least once a week, but probably substantially more than that bare minimum. Thank you for staying a loyal reader of The Quotedian in the upcoming transition phase.
Have a great start to your investment year!
André
CHART OF THE DAY
So, to summarize all of the above, if you are like most investors, you had too much allocated to stock and bonds and not enough to alternatives such as commodities (and then probably the wrong ones). So, chances are high it has been your worst investment year since 2008:
But, for what it is worth, other people have probably lost much more money than you and are now much poorer:
Does it hurt less now?
Thanks for reading The Quotedian! Subscribe for free to receive new posts and support my work.
DISCLAIMER
Everything in this document is for educational purposes only (FEPO)
Nothing in this document should be considered investment advice
Past performance is hopefully no indication of future performance


