

exodUS
Vol VIII, Issue 13 | Powered by NPB Neue Privat Bank AG

“How did you go bankrupt?”
“Two ways. Gradually, then suddenly.”— Ernest Hemingway (The Sun Also Rises)
Enjoying The Quotedian but not yet signed up for The QuiCQ? What are you waiting for?!!
Juuuust before we start, here’s the poll from a week ago where I asked you whether the porridge Quotedian was too long, too short or just goldilocks:

Ok, quite a clear result and even with a higher than usual participation (nearly 10% of readership). To express my gratitude, I will NOT slap tariffs on you for another twelve months …
Now, here’s the bad news… today’s letter will be looooooooooonger

To be completely honest, the title of this week’s Quotedian should have been:
Once Upon A Time
With reference to the Mag 7 stocks having entered officially a bear market a bit over a week ago:

And this was the accompanying title picture:

And to be even more honest, it was already the title of last week’s Quotedian, which unfortunately due to an overly busy marketing schedule never saw the day of light.
Hence, whilst running along the fabulous Zurich lakeside over lunch, today’s title “exodUS” sprang, completely unsolicited as they usually do, to mind.
And of course it refers to exit of non-US investors out of the US market. Initiated by the USA electorate, this exodUS has been becoming more apparent and pushed for at an increasing rate, with the final confirmation coming on “Liberation Day” aka “Obliteration Day” aka “Trump’s Tariff Tantrum”.
In (kind of) biblical terms:
“The great Exodus was not just a departure, but a reckoning — a moment when staying became more dangerous than moving. This week, we’re witnessing a different kind of exodus, as capital begins to flow out of US assets, repelled by increasingly protectionist policies and in search of more attractive valuations — or simply shelter from the storm…”
Let’s have a look at some of the moving parts over the past weeks - there’s a lot to cover!

Last week I was going to show you how bad the first quarter had been for stock market investors:

Worst quarterly returns since the pandemic sell-off in early 2020 and third worst quarter this millennia.
HOWEVER
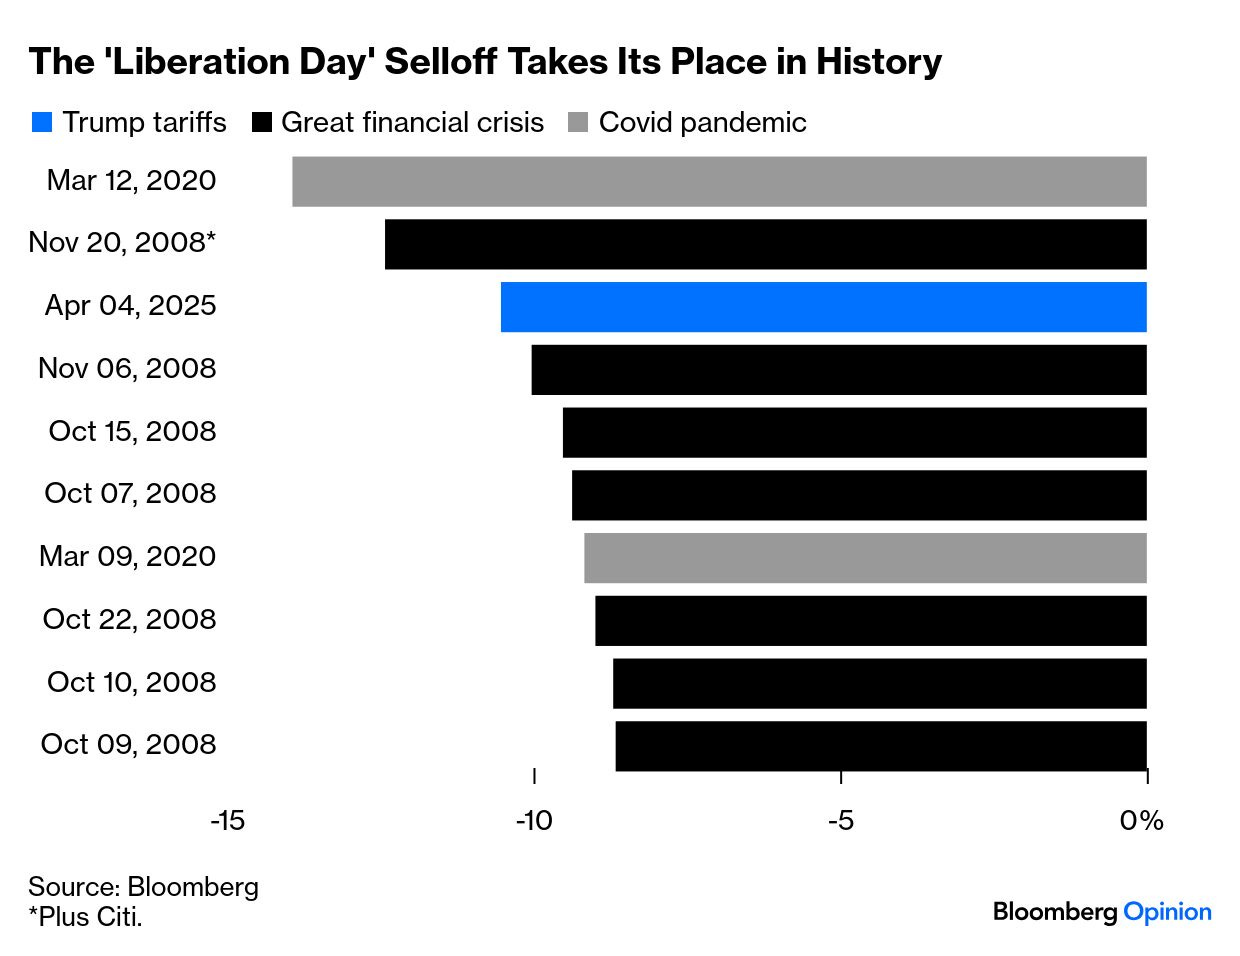
a week onward, we got the third worst two-day return, only behind a COVID and a GFC-incident:
In Friday’s QuiCQ (click here), I showed the chart below, highlighting the 5,160ish (-5%) to 4,860ish (-10%) levels as possible target zone:

Here’s the updated chart:

Well, that was … eheem … QuiCQ!
Here’s the S&P 500 futures (ES1) daily candle chart, including the continued sell-off this Monday morning:

The word “Waterfall” comes to mind.
While the S&P 500 (via futures) is only about to fall ‘officially’ into correction territory, defined as a drop in excess of 20%,

the Nasdaq-100 (NQ1) already proudly carries that badge:

The Nasdaq has now retraced 50% of its 2022 to 2025 cyclical bull run:

A drop below 15,500ish would challenge the 2009 to 2025 secular uptrend on the same index:

That 2000/2024 relative top of tech stocks to the broader market is definitely holding now:

I think I have written in the past, or at least it was my intention to, the wealth effect via the stock exchange, especially in the US. After a one and a half decade-long rally in US stocks, with only minor hiccups in between, not least thanks to a massive shift from active to passive managers, further dangers lure to the downside, should this snowball continue to slide down the slope:

Once the top 20% start noticing that they cannot buy QQQs for few days to then sell and go buy the newest LVMH handbag for their spouses, acceleration through liquidation may set in.
Staying in the US a short (but very short only) moment longer, small cap stocks (Russell 2000) have been hit

at least as hard as tech stocks, but without all the previous upside:

Turning to European markets, those held up relatively well - until they didn’t…

On the daily chart, the STOXX 600 Europe index (SXXP) looks absolutely brutal this Monday (7.4.) morning:

In Asia, the HSI was particularly hard hit this Monday morning, down in excess of 13% during regular trading hours:
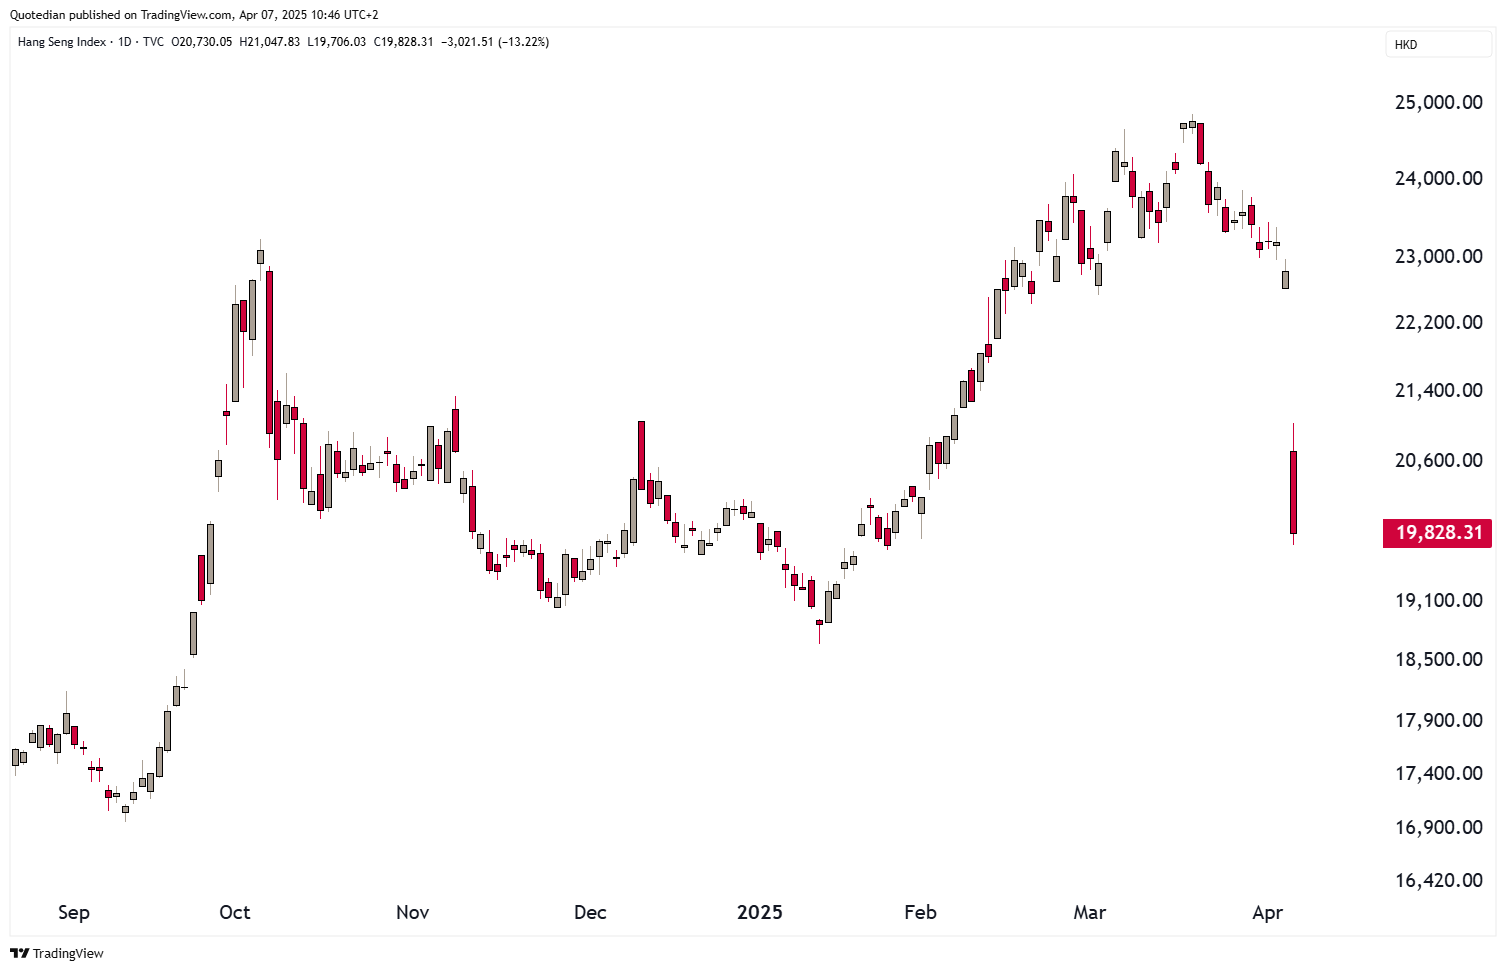
Is this relative weakness because of the Chinese government retaliating on the US tariffs?
Let’s spend a few moments on sector analysis, starting with a look at US sector performance over the past five days:

Probably not surprising to see NOT ONE sector able to print green over the past five trading session and definitely not surprising to see the most defensive sectors at the top of the table.
However, to see energy stocks at the bottom, did raise one my eyebrows for a nanosecond. Though, of course, with the oil price (WTI) now below $60 as the recession narrative is getting louder, the poor performance is easily explained. Interestingly though, this relative chart (Energy Sector versus Overall Market) continue to offer a bullish resolution:

European sector performance looks similar to the US table above, with the main difference of financials the second weakest sector and real estate eking out a small advance on the week:

Let’s have a quick look at the best performing stocks year-to-date (YTD) on both sides of the Atlantic and find out how they have weathered the storm since the beginning of April.
Starting with the US:

And here’s the performance of European names, including the moves of Monday (7.4.) morning:

Overall, the European YTD winners have taken the bigger hit, which is no wonder given a monstrous momentum rally was stopped dead in its tracks.
And, by the way, in case you thought that the sell-off in the leaders may lead to a rally in the laggards …. no way José!

What was weak already got even weaker!
With markets going through a kind of a Black Monday as I type, I will curtail here regarding the equity section, with the promise to be back with follow ups in the Quotedian (and the QuiCQ of course), once the dust settles a little and stuff makes starting at least some sense again. But not before asking the following question: “In which of the five stages below are we?”


There’s simply too much to cover, so let me apologies for a Potpourri of stuff I find interesting.
Starting with US yields, market participant are asking themselves whether the US adiministration is crashing its economy on purpose in order to achieve a lower refinancing rate. The 10-US treasury yield chart shows that so far this is working:

However, I could imagine they would prefer them even lower yet:

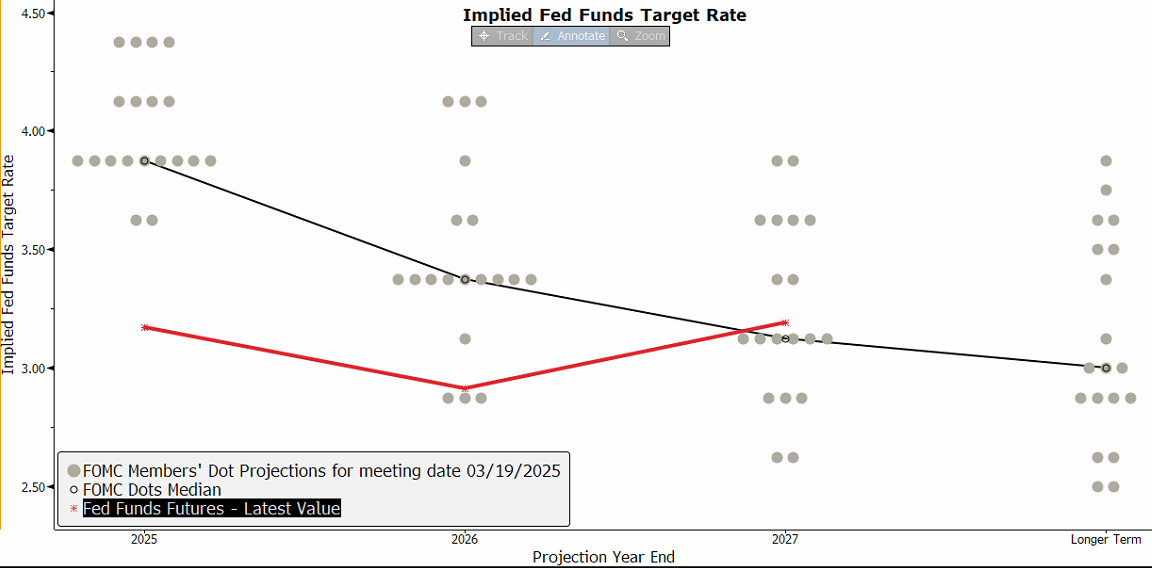
The three-way showdown between Government, the US central bank and markets is a nail-biter, with the later now expectation five rate cuts into year-end again (red line):
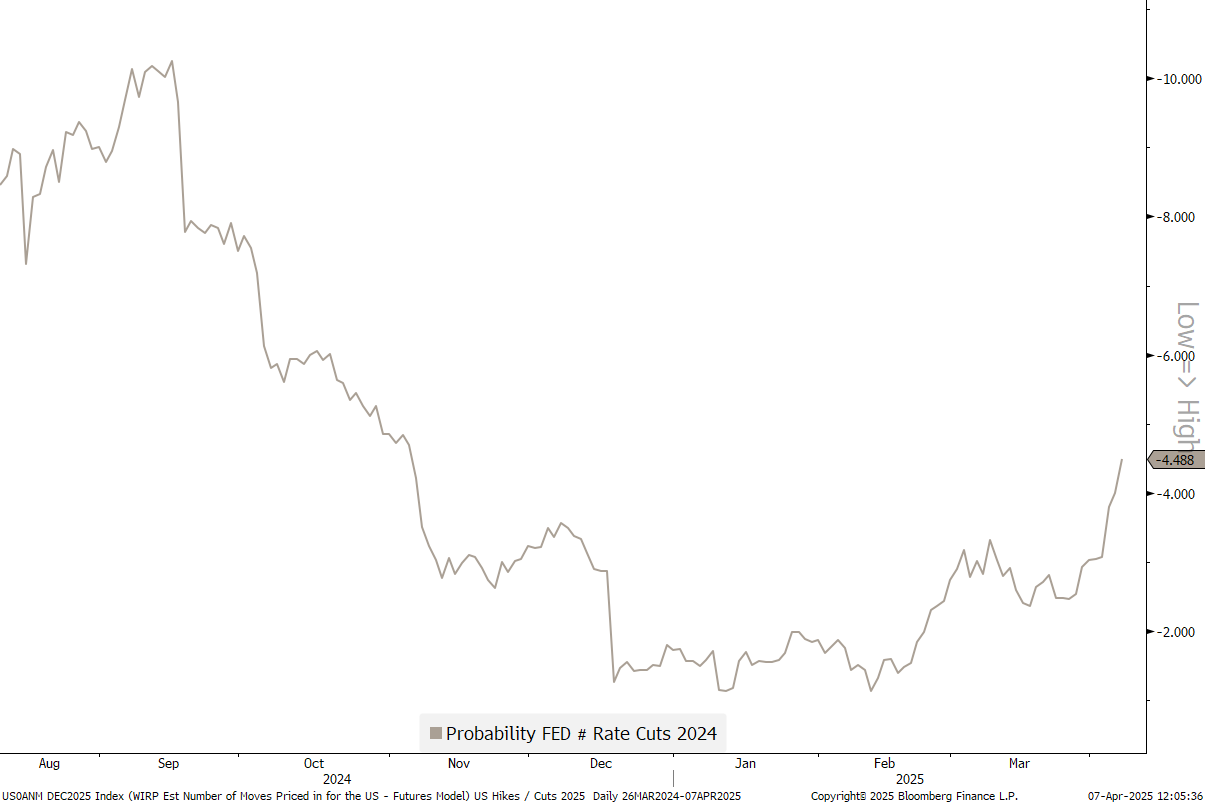
Rate cut expectations in the US are sharply up:
But so they are in Europe again:

Meanwhile, some segments of the Swiss swaps curve is ‘offering’ negative yields again:

Even 2-year Swiss Government bonds were trading briefly in negative territory on Friday and this morning (7.4.):

Before we look at one of the most astonishing moves in the bond market, let’s have a look at credit spreads for a moment, where spreads continue their widening path as recession risks increase:

Here is what the iShares US Corporate High Yield chart looks like:

But to truly appreciate the flight to quality, it is probably worth looking at a relative graph between Treasury (IEI) and High Yield (HYG):

And now that chart that had my chin hit the table top end of last week:

Top-to-bottom, the 10-JGB yield lost 60 basis points (or 33%) in less than two weeks. Massive! And even more massive if you then go and have a look at the currency chart of the US Dollar / Japanese Yen at the top of the currency section below.

And here it is:
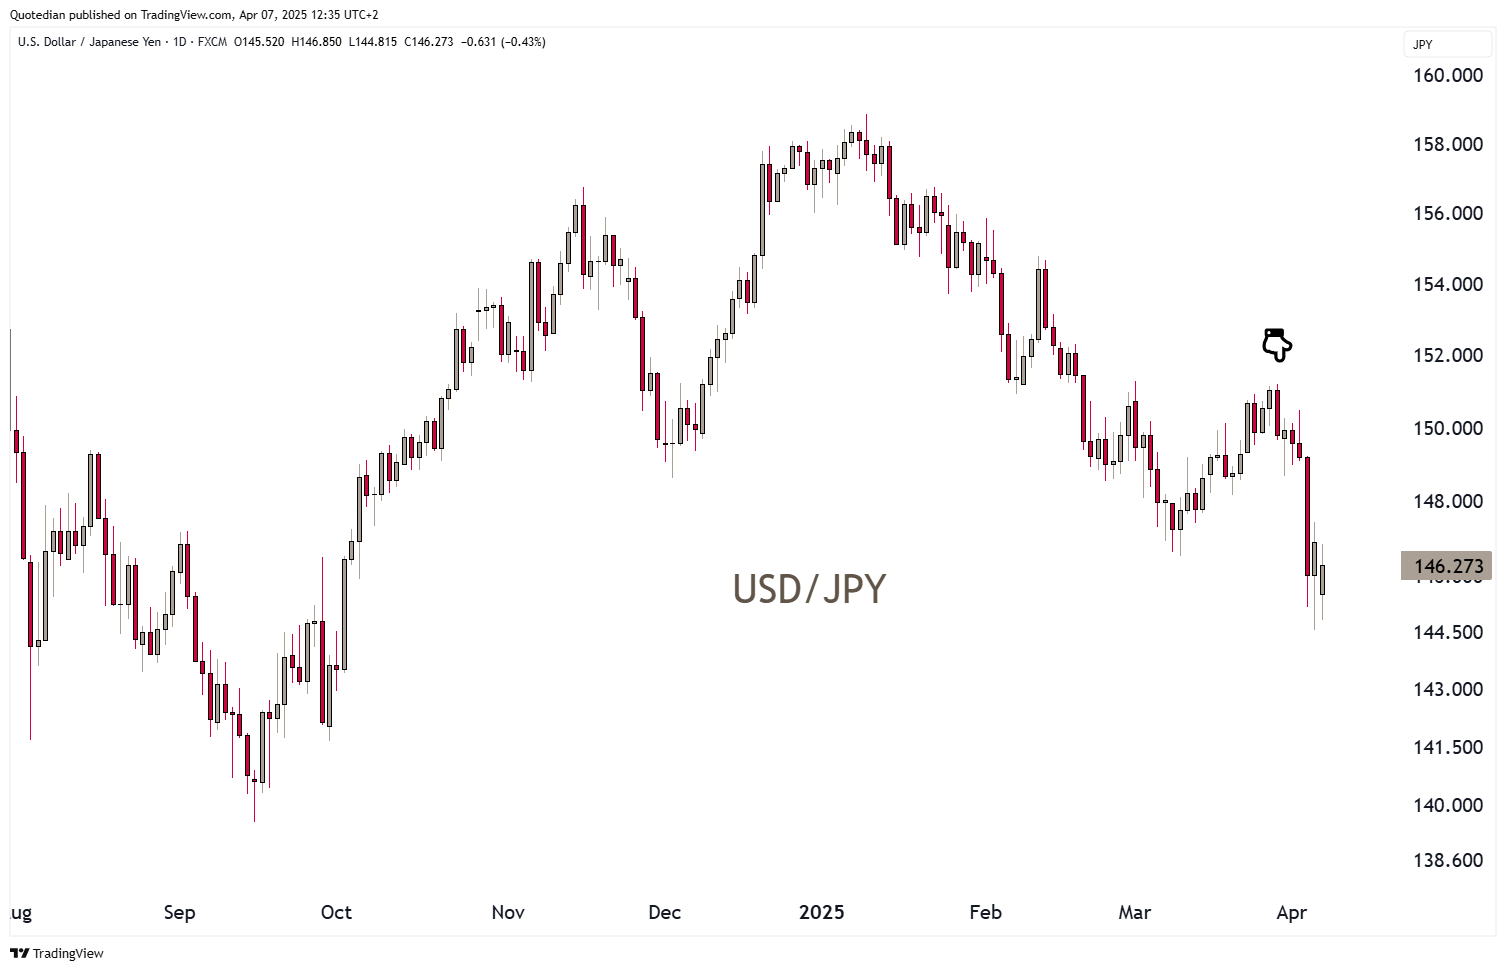
That’s another four percent of currency ‘gain’ for Yen investors over the past week or so (pointed hand) and nearly 10% from the January USD-highs.
And here’s my exodUS pudding prove - there was a clear flight from Japanese investors out of the overpriced stock market and the overprice US Dollar - a trend that could continue … and spread!
Especially as the US Dollar remains the second most expensive G10 currency (PPP OECD) and the Japanese Yen the cheapest:

Versus the Euro, the USD is off its peak panic lows (or highs, depends …) of last week:

Over the past five days, the safe haven flight (CHF, JPY) is clearly visible:

On a year-to-date basis, the only the ZAR and some other Dollar currencies are weaker than the Greenback:

Anyone daring to look at performances of cryptocurrencies over the past week?

Damn! We shouldn’t have!


In the commodity space, nothing really worked over the past five days:

I think three things are happening here:
Panic liquidation of high volatile assets
Undiscriminated selling in expectation of a global recession
A wonderful investment opportunity opening itself up to investors
Re 3) - think! Yes, the chances of a global recession have increased substantially over the past week, but how much is already priced in? Point in case, the oil price (Brent):

Already at its lowest since the COVID recovery rally.
Or Copper, losing a quarter of its value in only a few trading sessions:
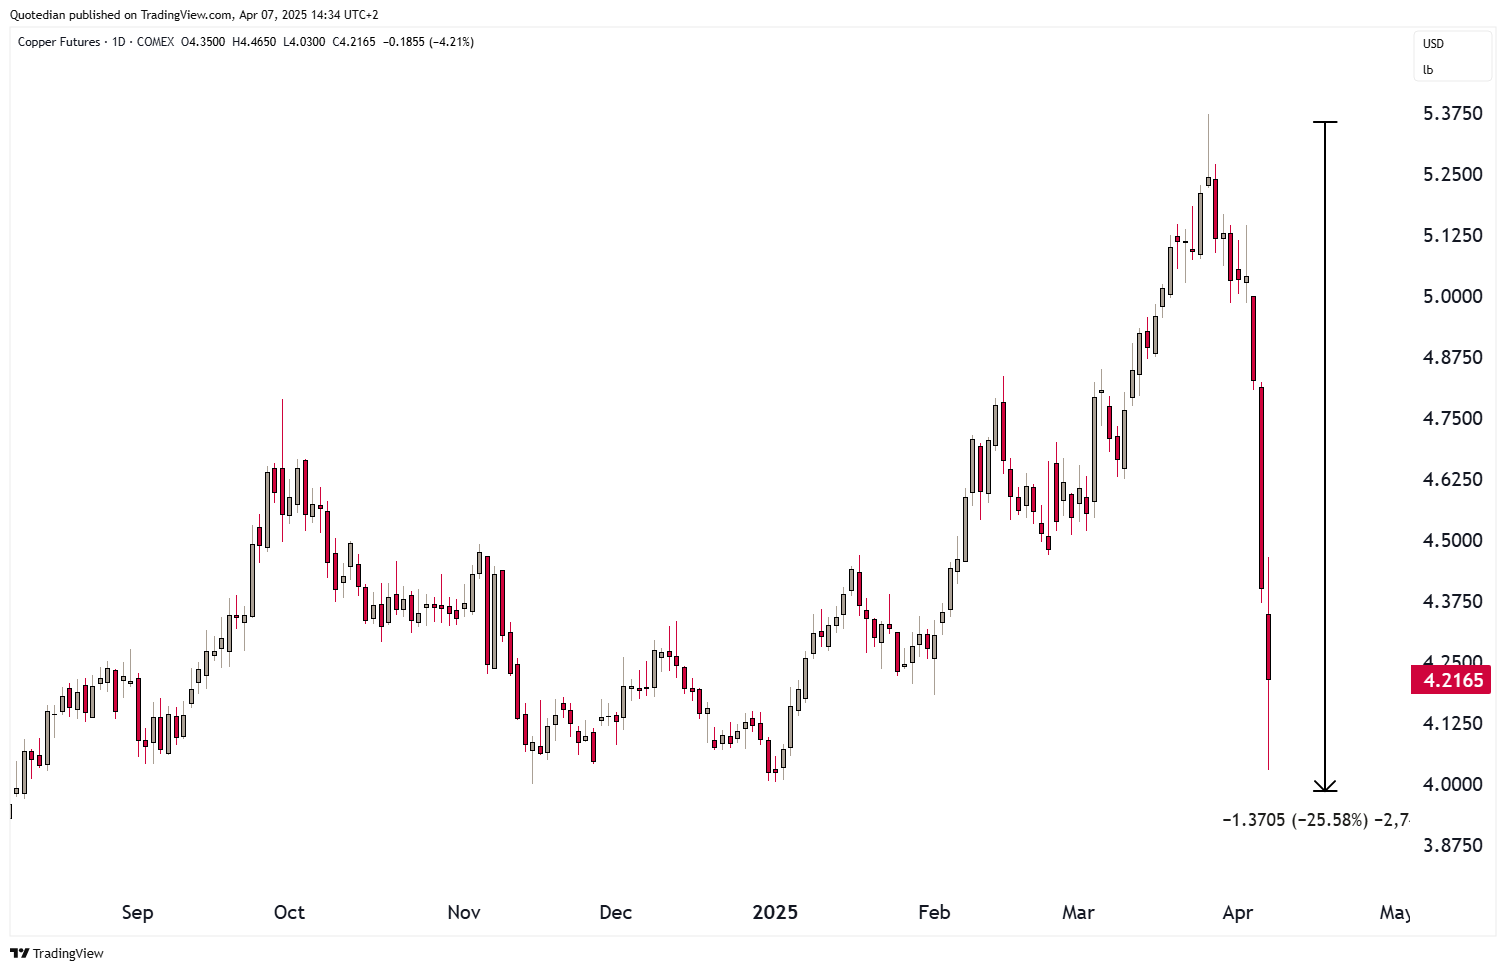
If the US get its way of reshoring the manufacturing sector it will a) need a lot of oil and copper and stuff to build that and b) the World ex-US will need to do more or less the same.
Now, if I want to play the New World (Dis)Order, what a perfect title for our Q2 outlook released in the early hours of Obliteration Liberation Day, what’s not to like about the energy sector valued at 11.1x price/earnings and a dividend yield of 4.8% (iShares Global Energy ETF - IXC). Or global copper mining (iShares MSCI Global Metals & Mining - PICK), trading at its lowest in five years:

And by the way, if you did not yet get a copy of our Q2/2025 outlook, here’s a complimentary softcopy for you from yours truly:
Ok, to finish, here’s the chart of Gold, which also fell victim to at least some cash raising in order to fill margin calls:

You will not be surprised to hear me say (or read my write) that I would add on further weakness.
Time to hit the send button - this is an as chaotic Quotedian as ever, and I do apologise. I hope the extreme market movements of the past few day serve as at least a partial excuse for the volatility in my writing this week.
Now, go on out there, and make sure to be safe. And remember, it is time to be a risk manager, not a portfolio manager.


In reality, you need no other Disclaimer than the one above, but just in case:
Everything in this document is for educational purposes only (FEPO)
Nothing in this document should be considered investment advice
Investing real money can be costly; don’t do stupid shit
Leave politics at the door—markets don’t care.
Past performance is hopefully no indication of future performance
The views expressed in this document may differ from the views published by Neue Private Bank AG