Face-Off
The Quotedian - Vol VI, Issue 82 | Powered by NPB Neue Privat Bank AG
“A bull market is a bull. It tries to throw off its riders.”
— Richard Russell
Ripped off. That’s what happened to the faces of short/underweight investors in bonds and equities over the past two days. They got their faces completely ripped off.
Missed the recent rally in bonds and equities? Don’t know what to do now?
Contact us at ahuwiler@npb-bank.ch
Let’s have a look.
Ok, admittedly an a bit dramatic introduction, especially as yesterday’s (see S&P intraday chart below) rally fizzled out towards the end of the session:
Nevertheless, Tuesday’s advance was worth several sessions and has catapulted the bears into oblivion. Here’s the daily candle chart of the S&P 500:
It took only 11 sessions (approximately two weeks) to
Recover back above the broken key support line (dashed line)
Regain the 200-day moving average (continues line)
Break above key support (shaded zone and dotted line)
Create a runaway gap (circled)
And produced a nearly 10% rally from bottom to top.
Not bad, not bad indeed. But, hey André, you will be shouting, for sure it was the magnificent seven proving all the gains once again! Nope.
Check out for example following statistic from Tuesday:
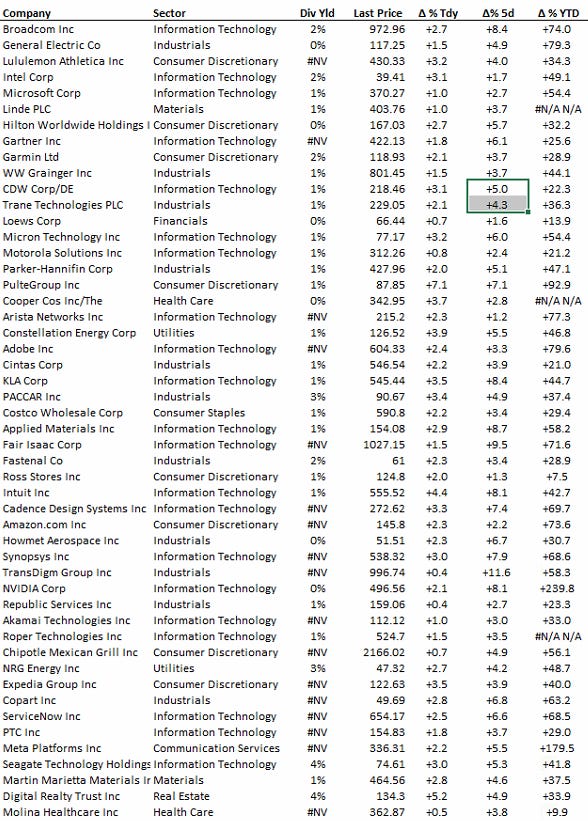
Fifty stocks hit a new 52-week high on the S&P 500, zero a new 52-Week low. Now that’s what I would call (positive) breadth…
Wondering which stocks hit a new 52-week high? Here you go:
Even hopeless Europe (hopeless only in investment terms, of course), the STOXX 600 produced 34 new highs and only two new 52-week lows:
But before we turn to the European equity market, let’s have a quick look at one of the top-performing markets this year - the Nasdaq 100:
Not only has this index closed for two consecutive sessions at the July highs, but it is also less than five percent away from a new ALL-TIME HIGH!
I already showed yesterday on another platform that even small-cap stocks are seeing a revival, with the Russell 2000 having its fourth largest relative outperformance day (>3.5%) over the S&P 500 this century:
Ok, over the our markets here for a moment.
The STOXX 50 is up close to 8% from the October bottom and less than four percent away from reaching a new recovery high, but the best news is that the index has now closed for two days above the 200-day moving average:
The broader STOXX 600 Europe index (SXXP) is up “only” about six percent since the recent low and for now has been rejected at the 200-day moving average:
Work in progress, I’d say.
Before we turn to fixed-income markets, we need to talk Japan. Here’s the Nikkei 225:
Ladies and Gentlemen, we are less than one percent away from a recovery high and only 15% from a new-all time high:
But let’s leave that hurdle for next year, shall we?
Short-bond speculators is another breed that got their face ripped off on Tuesday. Instead of starting with yield charts, let’s look at a price chart first.
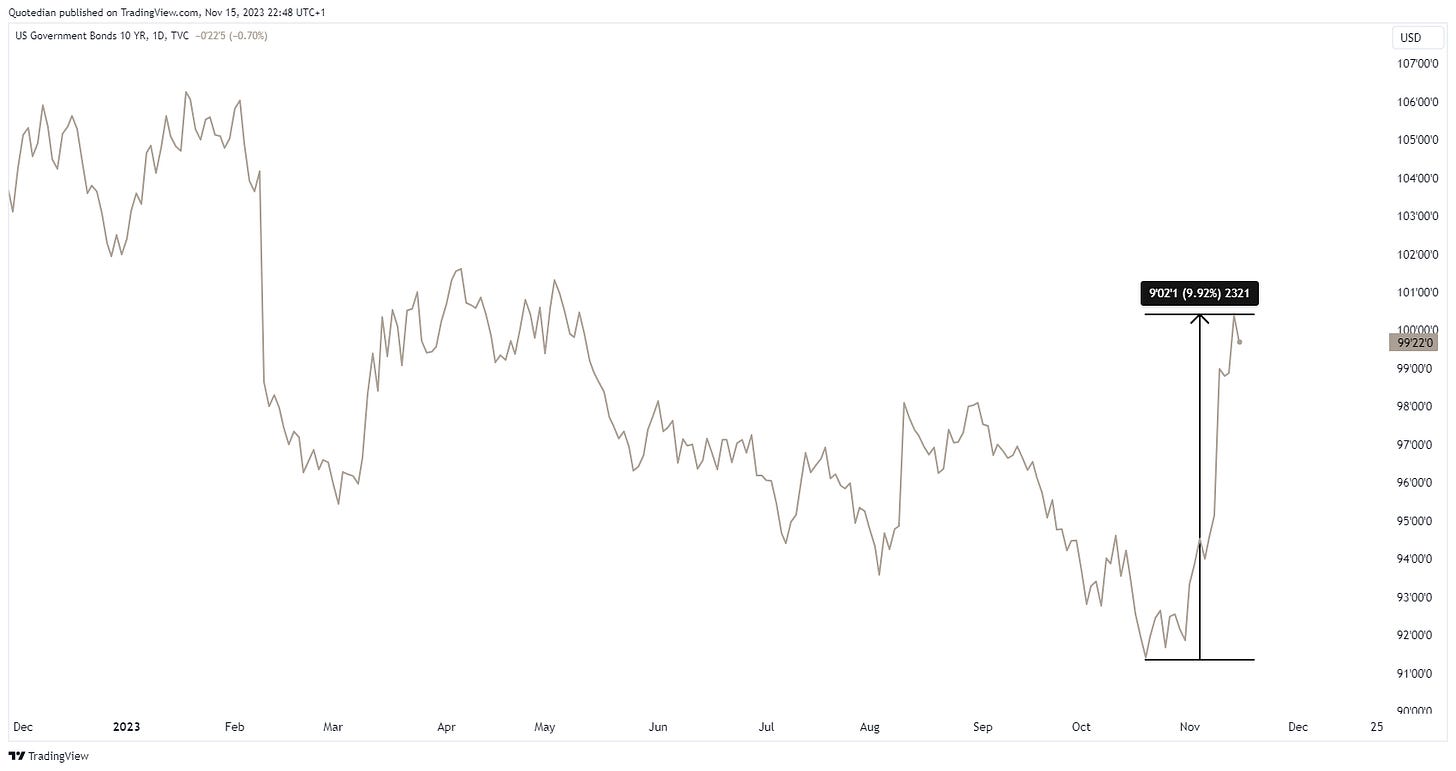
E.g., here’s the US 10-year government bond price:
Ten percent in less than a month is massive for bonds. Of course, are many who went long a few months ago still bleeding, but the rapid rise over the past weeks suggests quite some short-covering has been going on.
Looking at the 10-year Treasury yield now, we have seen three sessions with a ~20 basis points range in November:
Something’s going on.
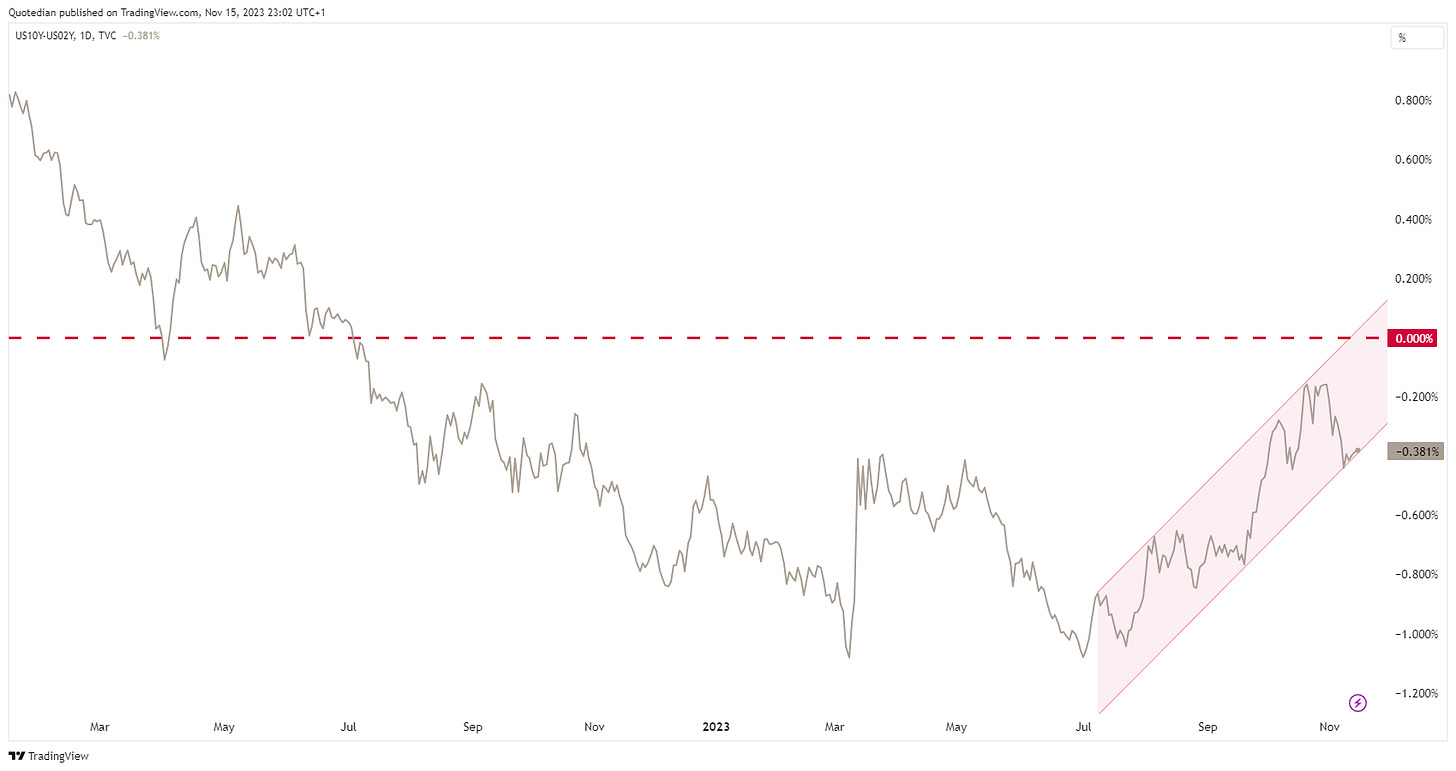
The curve steepening has stalled somewhat, but continues within the defined uptrend (red shaded):
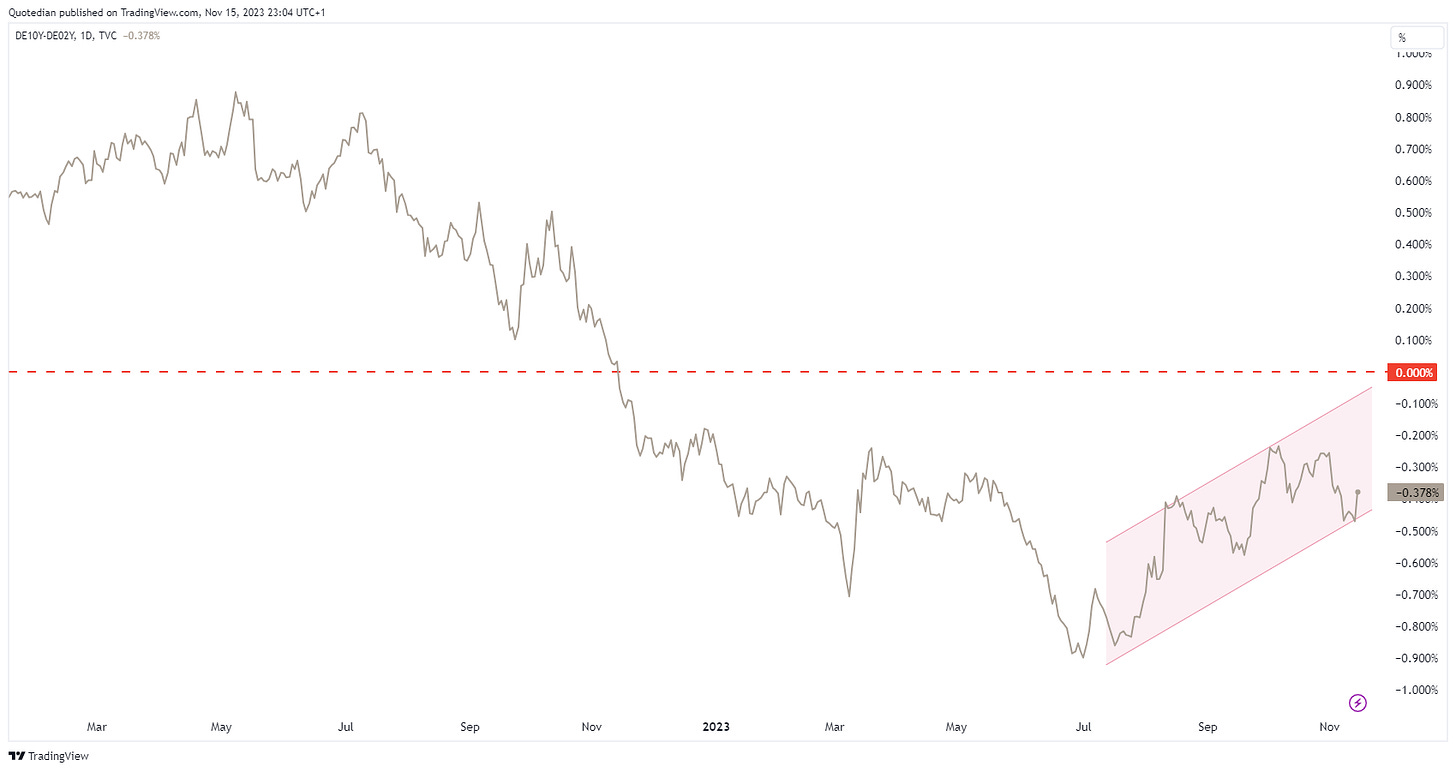
Let’s check that same “shape of the curve” chart, but in Europe, using German Bunds as proxy:
Similar.
The German Bund (yield) has also been softening, and stands at an interesting junction today, where several key support levels seem to come together:
2.52% is the final “must hold” level.
Over to credit markets for a moment, where we observe an important narrowing of credit spreads over the past few sessions (i.e. credit positive):
Translated onto the chart of the $16bn AuM iShares iBoxx High Yield Corporate Bond ETF, this looks as follows:
This is starting to look constructive … but we prefer to add risk on the equity side, to play this tactical risk-on rally over the coming months. Continue to beware of the credit side going into 2024.
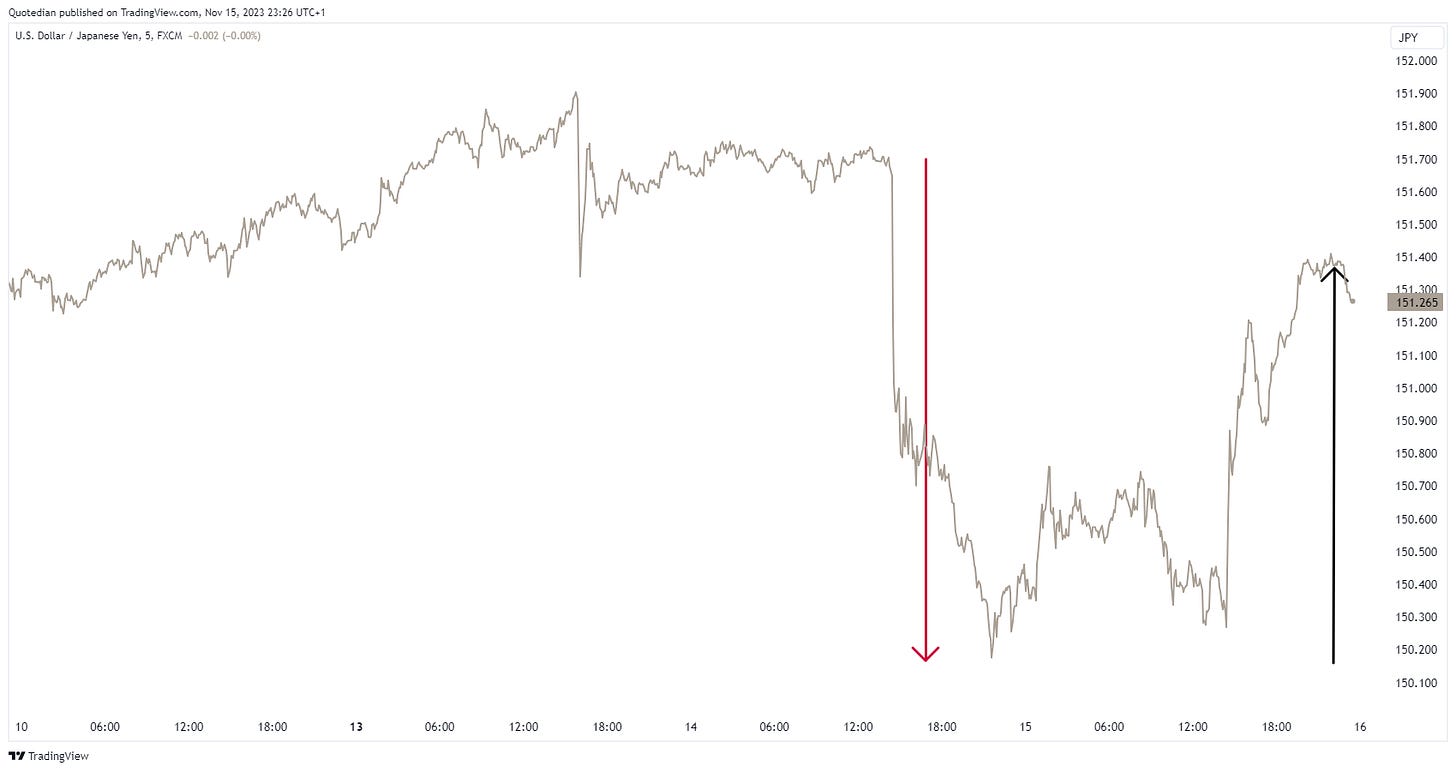
The third face-rip early this week was for US longs, where all major currencies, yes, even including the miserable Japanese Yen, gained versus the greenback:
Even though the joy of the 150 pibs rally (red arrow) was short-lived, as a mediocre GDP report in Japan the following unwound (black arrow) most of the previous day’s rally:
Other currencies, such as the Euro for example, held better on to their Tuesday gains:
The Swiss Franc is strengthening also noticeably again:
Finally, putting it all into one chart, the US Dollar Index (DXY) seems poised to at a minimum test its 200-day moving average about another big figure away:
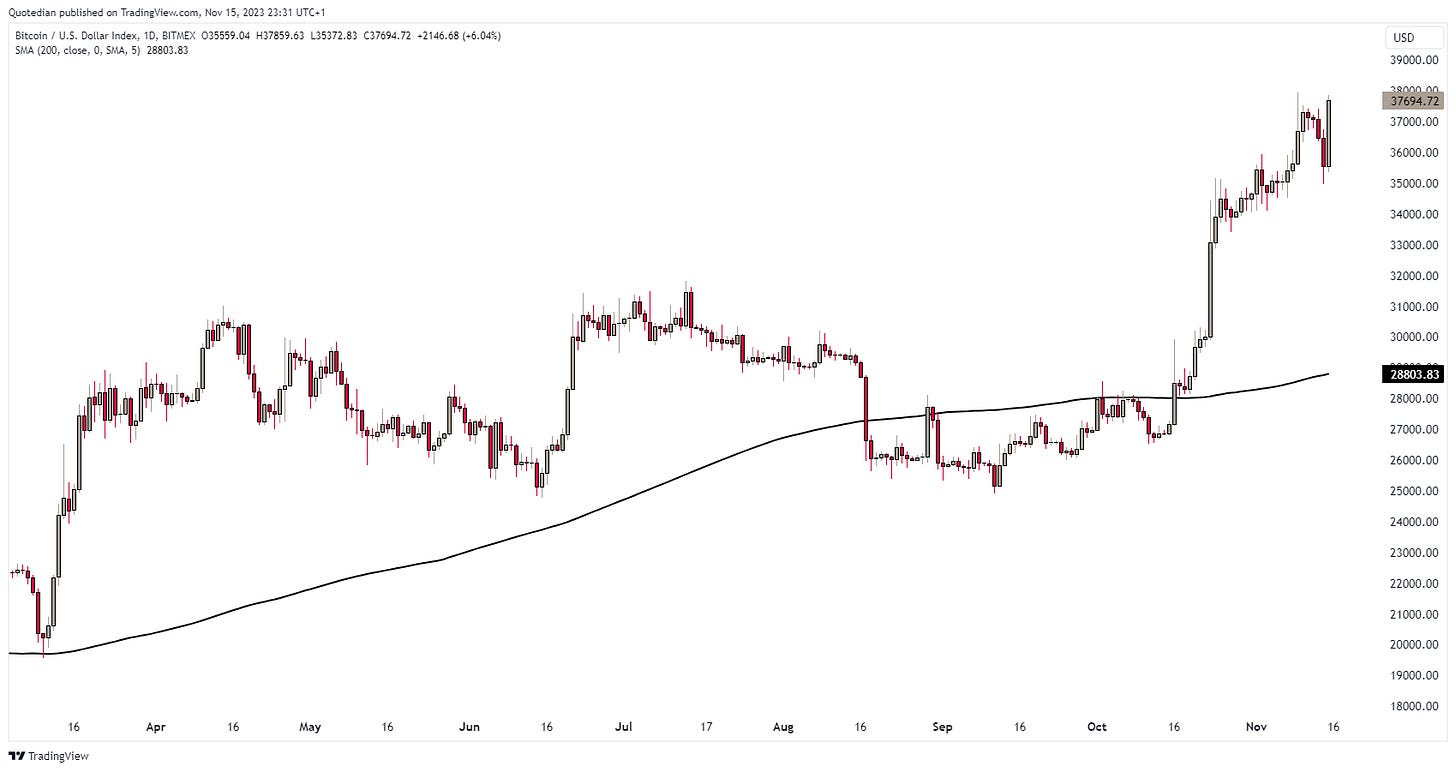
One more … Bitcoin:
After two very weak days on Monday and Tuesday, Wednesday provided one candle to unwind all losses and then some. Hard to tell what happened there, but the trend is clear.
Ok, then. UP!
Hoping over to commodities, Gold seems to have found a short-term bottom at an important pivot point plus at the 200-day moving average:
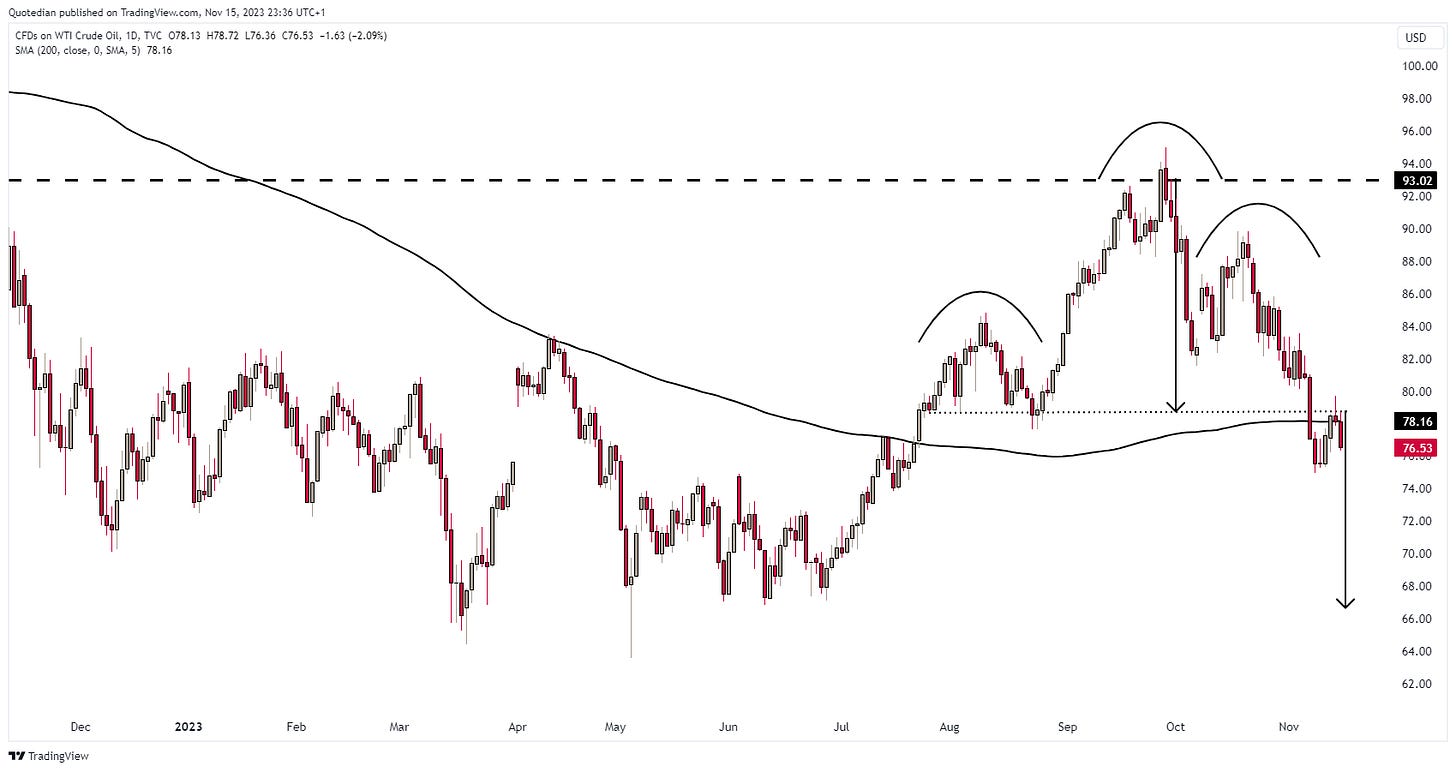
Not so oil, which quite to the contrary is unfolding the textbook shoulder-head-shoulder pattern we discussed a few issues ago:
Neckline (dotted line) broken, revisited from the downside (aka “the kiss of death”) and now heading lower again. Watch those stops on oil stocks …
This oil weakness in theory would spell out recession, which we still think is a possibility for Q1/Q2 2024, but sifting through equity screens over the past few days I noticed that some of the Australian mining stocks were up meaningfully in the past few months - despite the ‘obvious’ weakness of the Chinese economy.
Fortescue Metals, a major iron ore mining company and part of our recommended ‘Focus List’ universe was such an example:
This made me look at the chart of Iron Ore itself:
That is quite a bullish chart and stands at direct odds with the message from crude oil. Let’s see…
BTW, looking for stock recommendations? Become a client and enjoy the Focus Lists put together by our specialists.
Contact us at ahuwiler@npb-bank.ch
Ok, time to hit the send button.
With little economic data out for the rest of the week and earnings season slowing down strongly, we may be in for a breather. I at least will do that on Friday, taking off a day to head up to Luxembourg. Next Quotedian probably out Monday evening, Tuesday morning next week.
Stay safe,
André
It’s already Thursday, so it is ok to talk about the weekend. And it is especially ok if we talk about an exciting upcoming Formula 1 night-race talking place for a first time in Las Vegas! What could a couch-potato whish more for?!
The current standings for the constructor championship are as follows:
Ferrari is at a third place ‘only’ and if my Googling is correct hasn’t won one since 2008.
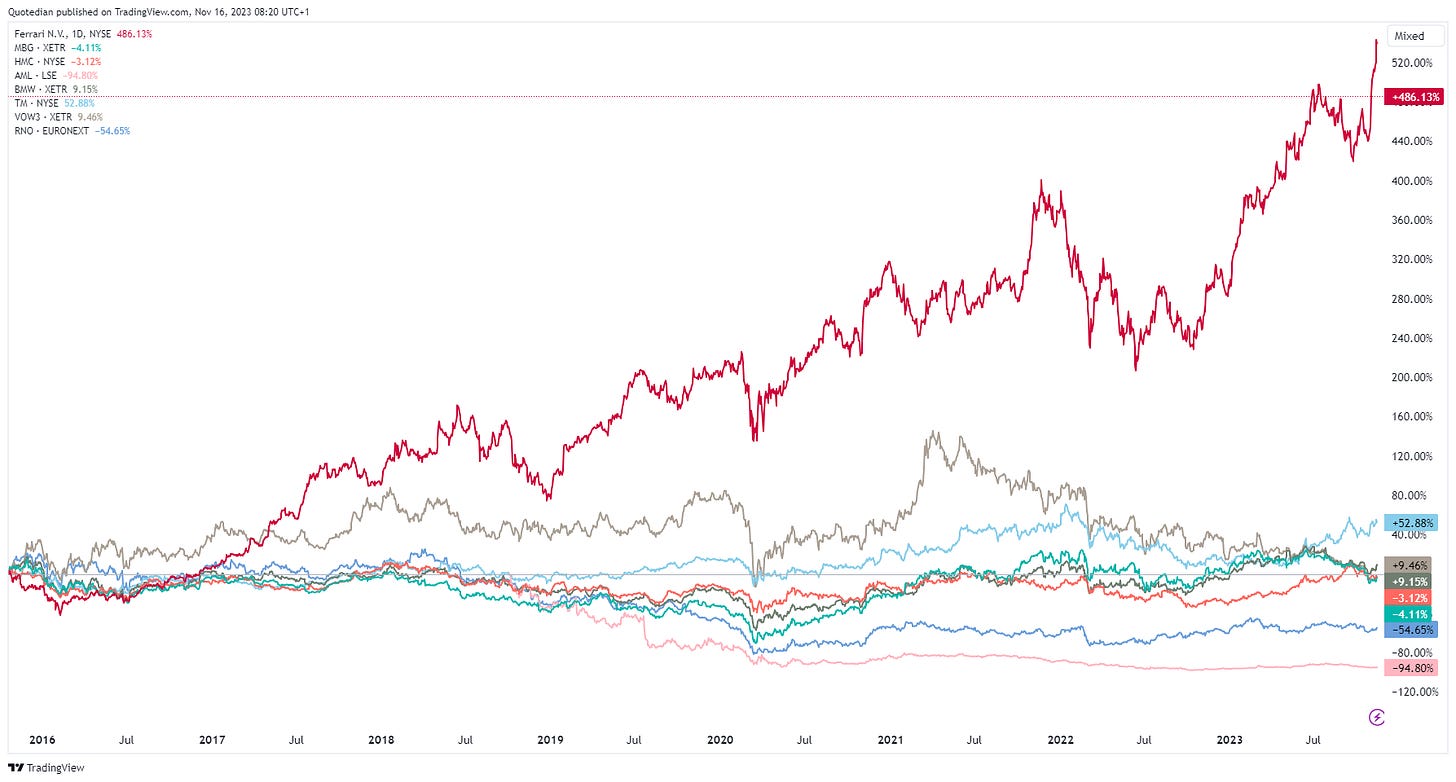
However, the race that Ferrari clearly has won since listing their shares back in 2015, is the performance race:
This is more than impressive and would suggest a Richcession is still far off…
Everything in this document is for educational purposes only (FEPO)
Nothing in this document should be considered investment advice
The views expressed in this document may differ from the views published by Neue Private Bank AG
Past performance is hopefully no indication of future performance


