Fed up!
The Quotedian - Volume V, Issue 102
“When I did my research on this topic, I came to the startling conclusion that the Federal Reserve System does not need to be audited - it needs to be abolished.”
— G. Edward Griffin
DASHBOARD
AGENDA
CROSS-ASSET DELIBERATIONS
Today is FOMC day and that means we should be in for some fun volatility. And indeed, central bank activity, albeit heavy handed as usual, is getting more exiting again as most CB’s seem to have dropped their forward guidance model of the past decade or so. Though in the case of the Fed rather than having dropped guidance altogether, they rather have it outsourced to Nick Timiraos at the Wall Street Journal.
But let’s analyse tomorrows hike (spoiler alert: 75bp IMHO) step by step…
In preparation for a pitch about a month ago I created following chart, with the argument that the Fed has been signaling since the beginning of the year what they will do:
In the meantime, US CPI has of course climbed above 9% and with unemployment still in checkers (although we ALL know that it will increase substantially over the coming months) and no official recession yet (although we ALL know that the US economy is likely in recession already), the Fed will likely hike rates by 75 basis points tomorrow, i.e. at the upper end of the 50-75 bp mentioned by Powell during his press conference after the most recent hike. 100 bp anyone? I don’t think so. A hike of 1.5% in two consecutive session will be considered by the Fed hawkish enough to make their point, without breaking their “guidance” again.
Today’s release of the S&P CoreLogic Case-Shiller U.S. National Home Price Index, showing that housing affordability is continuing to deteriorate, is probably just the final confirmation the FOMC needs for the 75 bp hike:
And one more thing - today’s hike of 75 bp will take Fed fund rates to 2.50%, still a far cry away from the 9.43 suggested by the traditional Taylor Rule model:
Ok, let’s have a look at the market action as of recent:
The earnings shoe (or Boot) we spoke about two weeks ago is continuing to drop. Here are two headlines from CNBC today:
And then there was this, just to fuel a bit more the inflation angst:
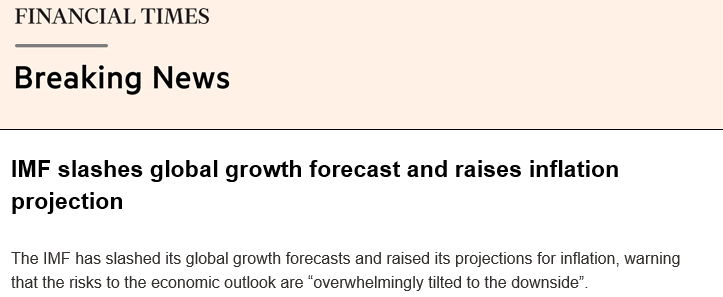
Thanks god we have got the IMF to inject some healthy and timely contrarian headlines to the mix:
Anyway, stocks saw some further profit taking after Friday’s downturn, though volumes continue to below average. The S&P is for now continuing with the pattern of lower lows and lower highs I allured to in the latest “Sunday Brunch” edition:
Whilst 4k is the immediate resistance level, a break of 4,175 is needed to break that pattern to the upside. Simultaneously, 3,666 remains the obvious observation point. A break of that support would open up the downside to our target of <3,000.
Sector rotation tilted to the defensive side yesterday:
Bond yields had a relatively quiet day, with the US 10-year yield holding above key support levels:
It’s German equivalent meanwhile has dropped right into our defined support zone. Let’s watch closely from here:
Currencies continue to trade very much according to the risk-on/risk-off beat of other asset classes, i.e. equities down today, Dollar up today. The US Dollar is rebounding at all the right levels in terms of a correction of an uptrend:
Finally, and moving into the commodity space, the price of (European) natural gas is in focus again, with the Dutch TTF Nat Gas price touching €203 again:
I will not dare to read the tea-leaves on this one to find out the level final price peak, but when (not if) Russia cuts off Nordstream 1 completely in a few months time, I would suggest substantially higher than now.
Time to hit the send button - see you on the other side of the FOMC decision!
CHART OF THE DAY
On of the favorite spreads to measure the slope of the yield curve is subtracting 2 year treasury yields from the 10 year treasury yield. An alternative would be replace the 2-year yield with the 3 month Treasury bill yield, even more sensitive to Fed interest rate manipulation activity. As the chart below shows, the track record as recession indicator of this spread is pretty impressive:
LIKES N’ DISLIKES
Likes and Dislikes are not investment recommendations!
Long China equity (FXI) / short India equity (PIN)
Energy stocks (XLE)
Long some Gold (direct or via short puts)
DISCLAIMER
Everything in this document is for educational purposes only (FEPO)
Nothing in this document should be considered investment advice
Past performance is hopefully no indication of future performance


