Fed up!
The Quotedian - Vol V, Issue 133
"Objects in motion stay in motion in the same direction unless acted upon by an unbalanced force."
— Isaac Newton
DASHBOARD
AGENDA
CROSS-ASSET DELIBERATIONS
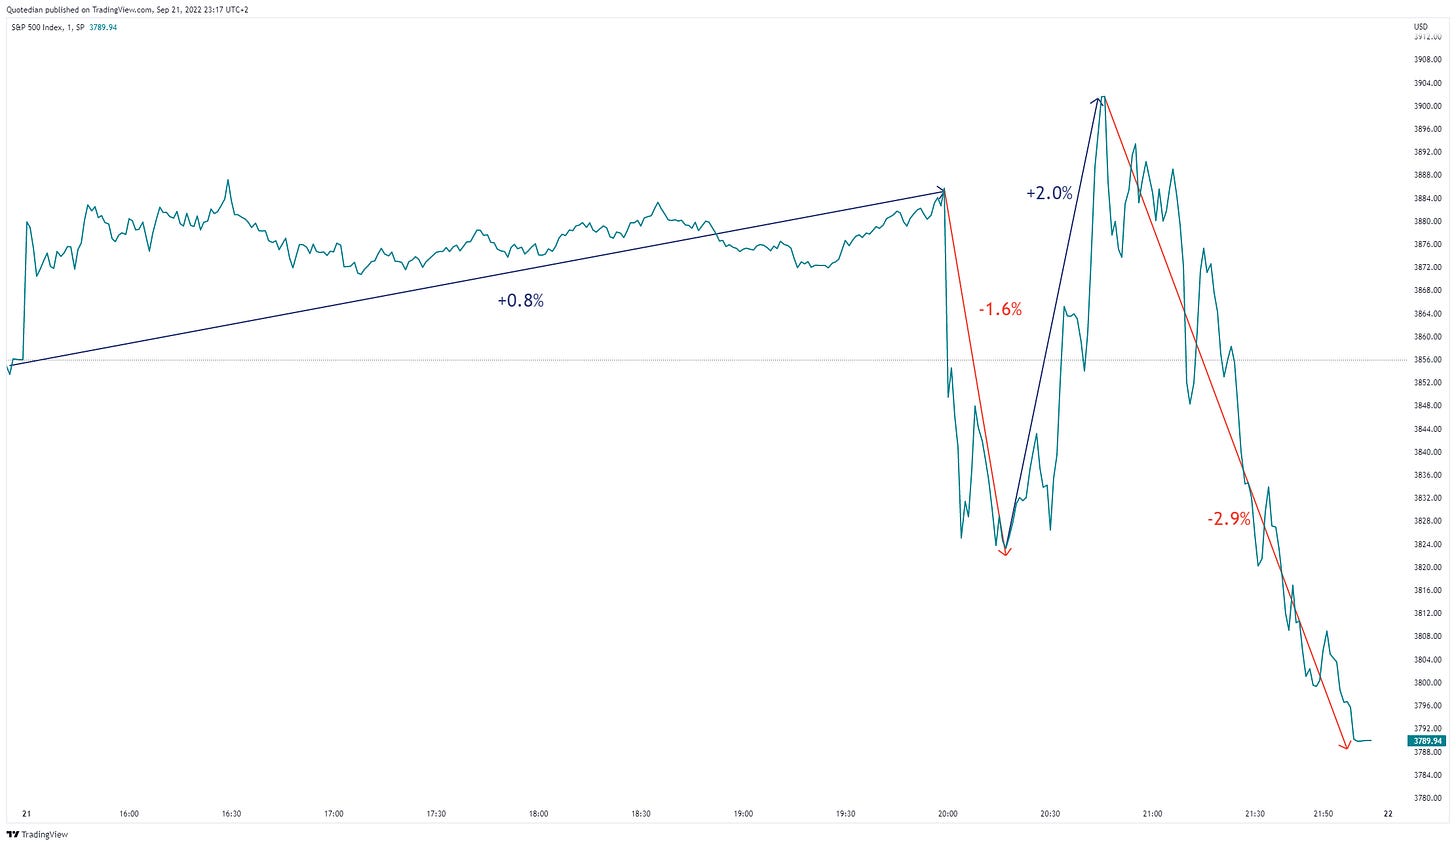
What an intraday chart for the S&P 500! Flat with some sunny spells right up until the FOMC conclusion and statement and then all hell broke loose! Whilst the S&P closed down a remarkable 1.7% (there were just too many stats going around about how the market closed up after all of the recent hikes …), the distance covered was much larger:
The Fed had, as we had polled, hiked by 0.75%, but the Dot-Plot was a tad more hawkish than expected by market participants:
In short, the Fed Fund rate implied by the Dot Plot by the end of the year is at 4.4%. This would imply another 125 basis points hike from current levels (75bp in November & 50bp in December), which is 25 basis points more than was discounted by the market via the Fed Fund futures. It is only 0.25% more, but it shows the commitment of committee members. And just in case some last idiot had not got the message yet and was still hoping for a Fed-Pivot, the Dot Plot also shows no rate cut in 2023. Fed projections also showed an expected increase in unemployment from 3.7% to 4.4%, which is 2) more than a million jobs lost, b) absolutely recessionary and c) probably hopelessly optimistic given the foreseen path of interest rates.
Anyway, let’s take a look under the hood of the US session, as European markets were long closed by the time the FOMC meeting concluded. And arguably, interest rates were ‘only’ problem number two today for Europe, with the top spot taken by a certain Mr. P.
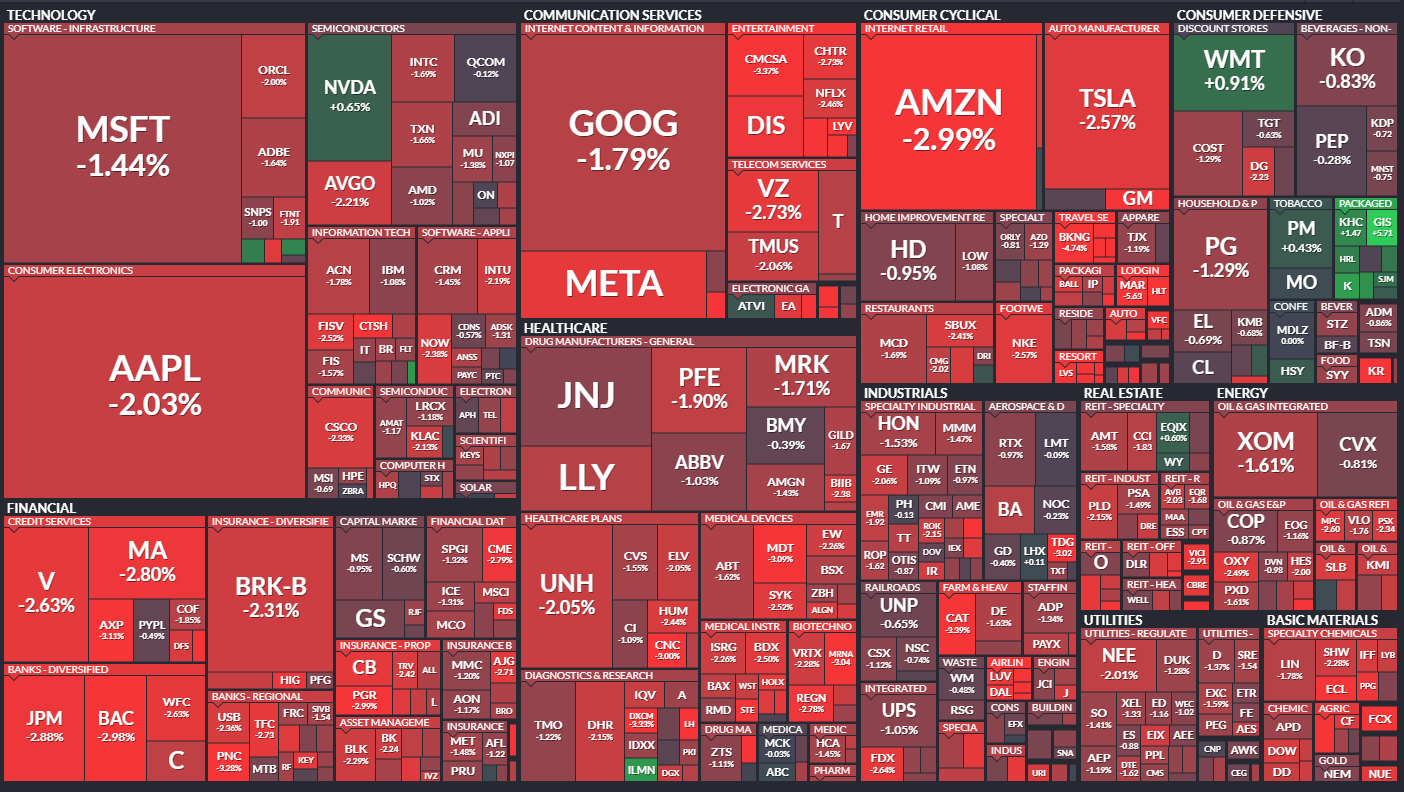
As usual, the market heatmap already gives a clear picture of what a difficult day it was:
Not one of the eleven economic sectors was able to eke out a gain, with the smallest loser being the defensive consumer staples segment:
Strangely enough, looking at the biggest losers of the day in the S&P, it felt like the COVID-hell broke loose again:
Must be a coincidence.
Looking at the daily chart, a retest of the June lows looks ever more likely (also check today’s COTD in that context):
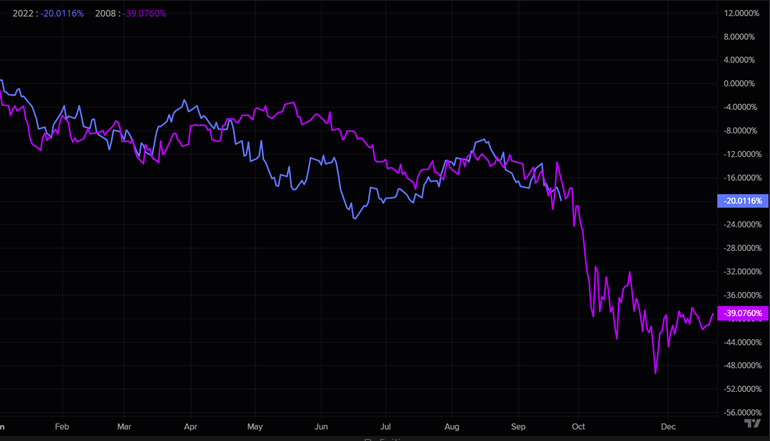
This chart of the current bear cycle compared to the 2008-2009 sell-off continues to make the rounds:
Asian markets are a sea of red this morning too (last column on table below is daily %- variation), though given the template from US markets I guess it could have been worse:
Whilst index futures on US markets are ‘small’ red, their European counterparts are deep red, given they still have to catch up with the post-FOMC nastiness.
Alright, bonds! No real need to show that rates continued to move higher, given the Fed’s rate decision and dot plot. However, it is worth confirming that the slope (10y - 2y) is now at its most inverted level since the Volcker hay-days of the late 1970ies:
Now and then, this is what a manufactured recession looks like [FULL STOP].
Today we expect rate decisions from the Bank of England (BoE) and the Swiss National Bank (SNB). The BoE is expected to rate hikes by 0.50%, though the whisper number is at 0.75%, whilst the SNB should hike by 0.75%.
And then there’s the Bank of Japan (BoJ) … Remaining as stubborn (blindfolded?) as possible, the BoJ said Īe! to a rate hike. A decision that was immediately acknowledged by Yen FX traders:
On the long-term chart, the 1998 Asian Crisis lows are in the process of being undercut and we are heading towards 1990 levels:
The EUR/USD cross-rate, already under pressure from a record German PPI, a record European current account deficit and a record naughty Vladimir Putin, sold off to its lowest levels since 2002:
Unless the ECB picks up its rate hiking pace substantially (it won’t), the Euro is likely to retest all-time lows over the coming months. Or in other words, the Euro is being taken to the holy altar of sacrifice.
Ok, and finally having short cut the commodity session over the past few reports, let’s have a closer look at some commos…
Gold continues to trade below long-term key support
and higher real rates (inverted on the graph below) are not helping in finding a bottom to the downtrend:
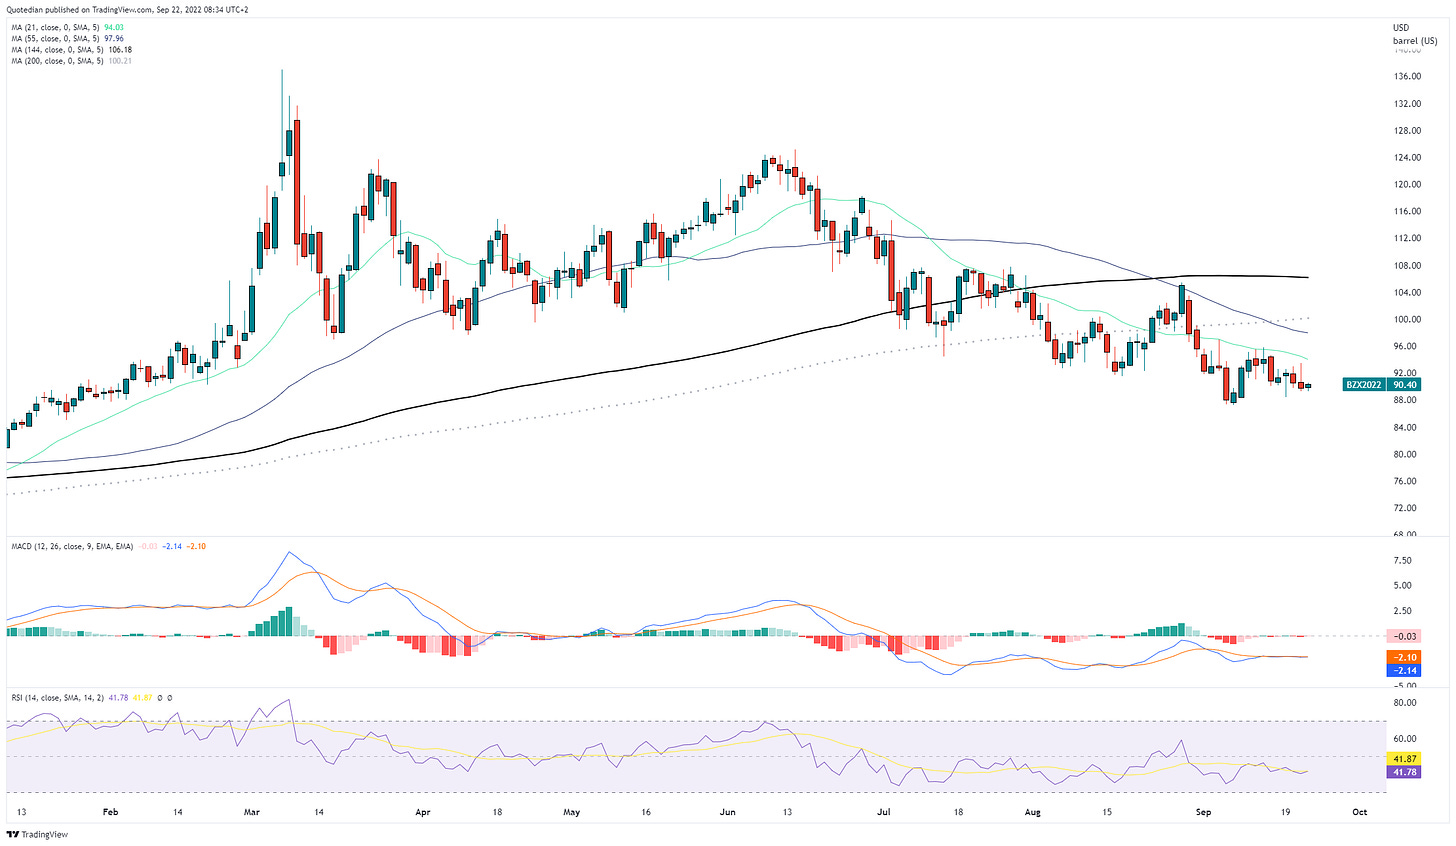
Newfound support in the oil price after the Russia mobilization news yesterday vaned pretty quickly and black gold continues to consolidate sideways, with technical indicators becoming “uninterpretable”:
Staying with energy for a moment, whilst oil and natural gas prices seem to have found some equilibrium (famous last words), coal prices are stampeding higher:
At the same time, European carbon credit futures are trading well below their highs and also well below their theoretical price of somewhere around €115:
Let’s have a dip dive on this subject in one of the upcoming Quotedians.
Alright, time to hit the send button. Take care out there!
André
CHART OF THE DAY
Chinese large-cap stocks have for some reason been leading US large caps during this cyclical (secular?) bear market. As the chart below shows, the FXI turned down at (1) well before the SPY turned lower too. Then, in April of this year, the FXI started rising at (2), two months before the SPY entered its epic bear market rally. However, shortly after, the FXI started dropping again at (3), with the SPY following about a month later. Chinese large caps are now about to break below their cycle lows (4), and if the pattern of US large caps following at ever decreasing time lags continues to hold up, the SPY should do so over the coming days to maximum weeks. Stay tuned …
Thanks for reading The Quotedian! Subscribe for free to receive new posts and support my work.
DISCLAIMER
Everything in this document is for educational purposes only (FEPO)
Nothing in this document should be considered investment advice
Past performance is hopefully no indication of future performance


