

Fission Chips
Vol VII, Issue 38 | Powered by NPB Neue Privat Bank AG
 - Firewalls Don't Stop Dragons")
“Only liars manage to always be out during bad times and in during good times.”
— Bernard Baruch

Unfortunately, the brilliant title (Fission Chips) of this week’s newsletter is not quite a Quotedian Original, but rather was already used in a article by the excellent Doomberg Substack over a year ago. Having given kudos to that fine publication here and having been a long-term subscriber to their newsletter, I am sure the green chicken will not mind me recycling the title for this weeks writings.

But before we get to the subject at hand, let’s start with our usual review of asset classes …

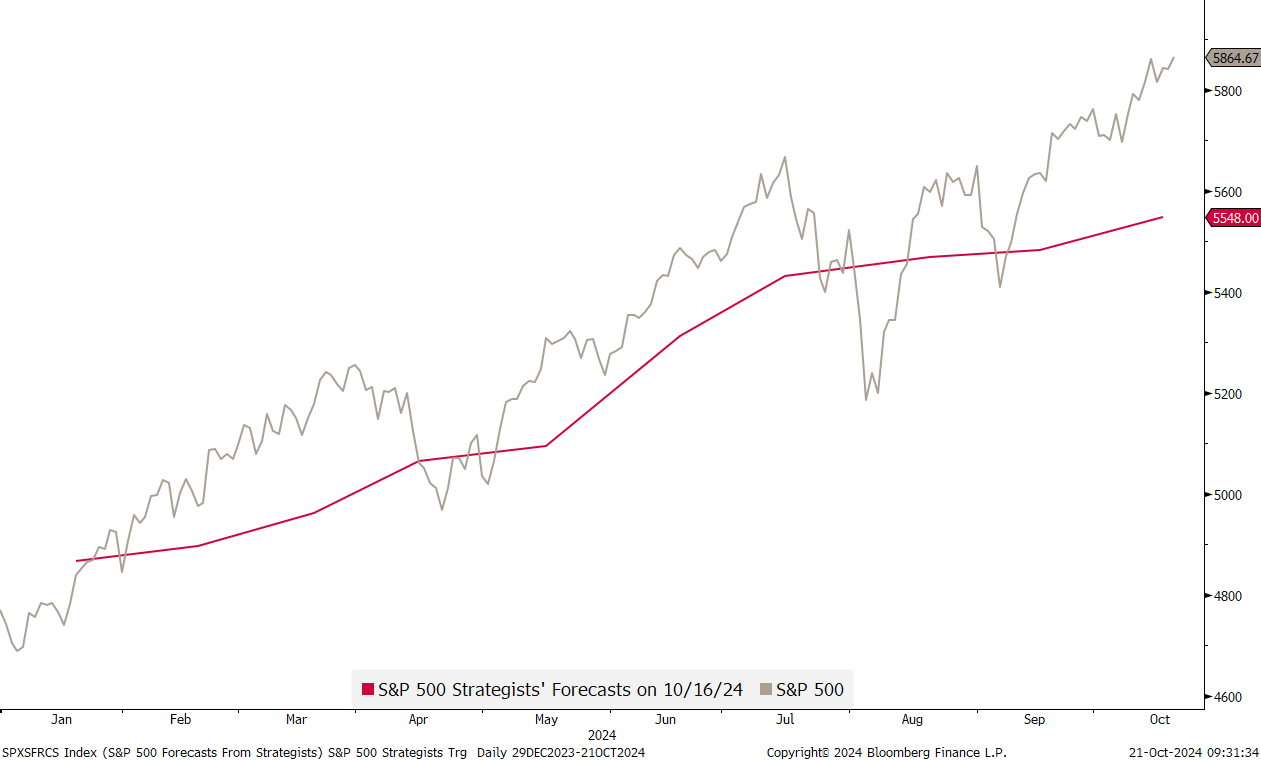
Equity markets continue to fly, especially in the US, as even most bullish strategist are being outpaced by the returns in the S&P 500. Our first chart compares that index’s bull-run to Wall Street strategists’ year-end target:
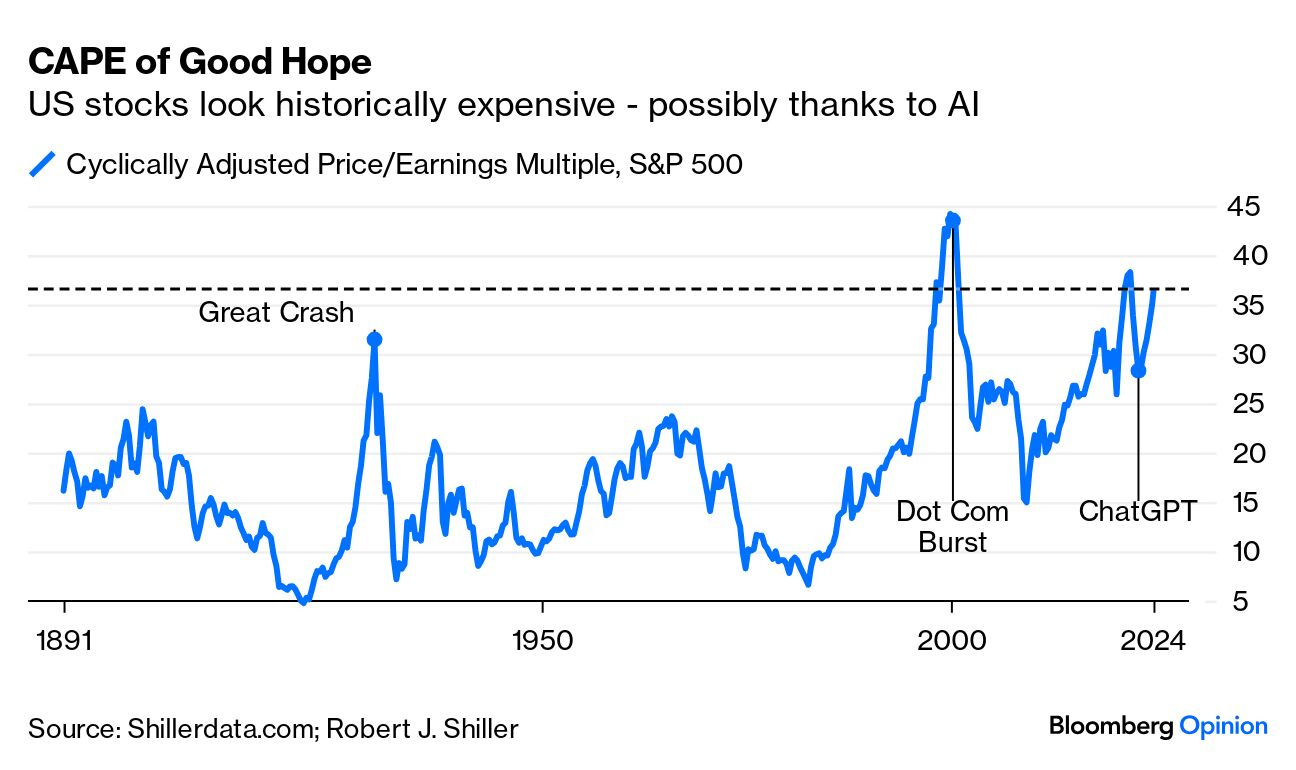
No doubt stocks are expensive from a long-term perspective, using Shiller’s Cyclically Adjusted Price/Earnings multiple:
Indeed, analysing the 60% rally of the S&P 500 (top clip) over the past two years, we note that it has been accompanies by EPS expansion (middle clip), but not THAT much really. Which of course means a massive multiple expansion (bottom clip) has taken place:

Another way to look at this via the very elegant Bloomberg function (BECO DRIVERS), is to see the expansion of Risk Sentiment during this rally:

Now, let’s use this a segue to check in on investors’ sentiment via the AAII (American Association of Individual Investors) weekly bull/bear poll:

Actually, not at an extreme reading!
Now, before we head over to look at some daily candlestick charts, a stark warning! Valuation DO influence future returns of equities, at individual and index level, HOWEVER, they ARE NOT a timing tool.
Just think back to December 1996, when then Fed-Boss Alan Greenspan held his “irrational exuberance” speech:
“But how do we know when irrational exuberance has unduly escalated asset values, which then become subject to unexpected and prolonged contractions as they have in Japan over the past decade?”
Greenspan did not specifically mention that he was referring to the stock market,. but after six years of unabated upside on the Nasdaq,
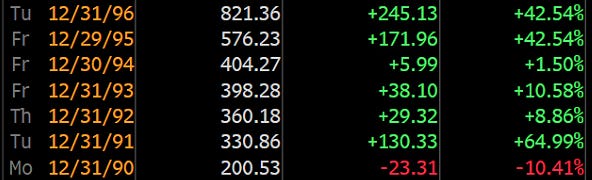
everybody assumed he was referring to equities. And promptly did stocks fall 5%, only to then rise for another three years:

So, careful on using valuations as the only input into your investment timing process.
Now to those charts! Here’s the S&P 500:

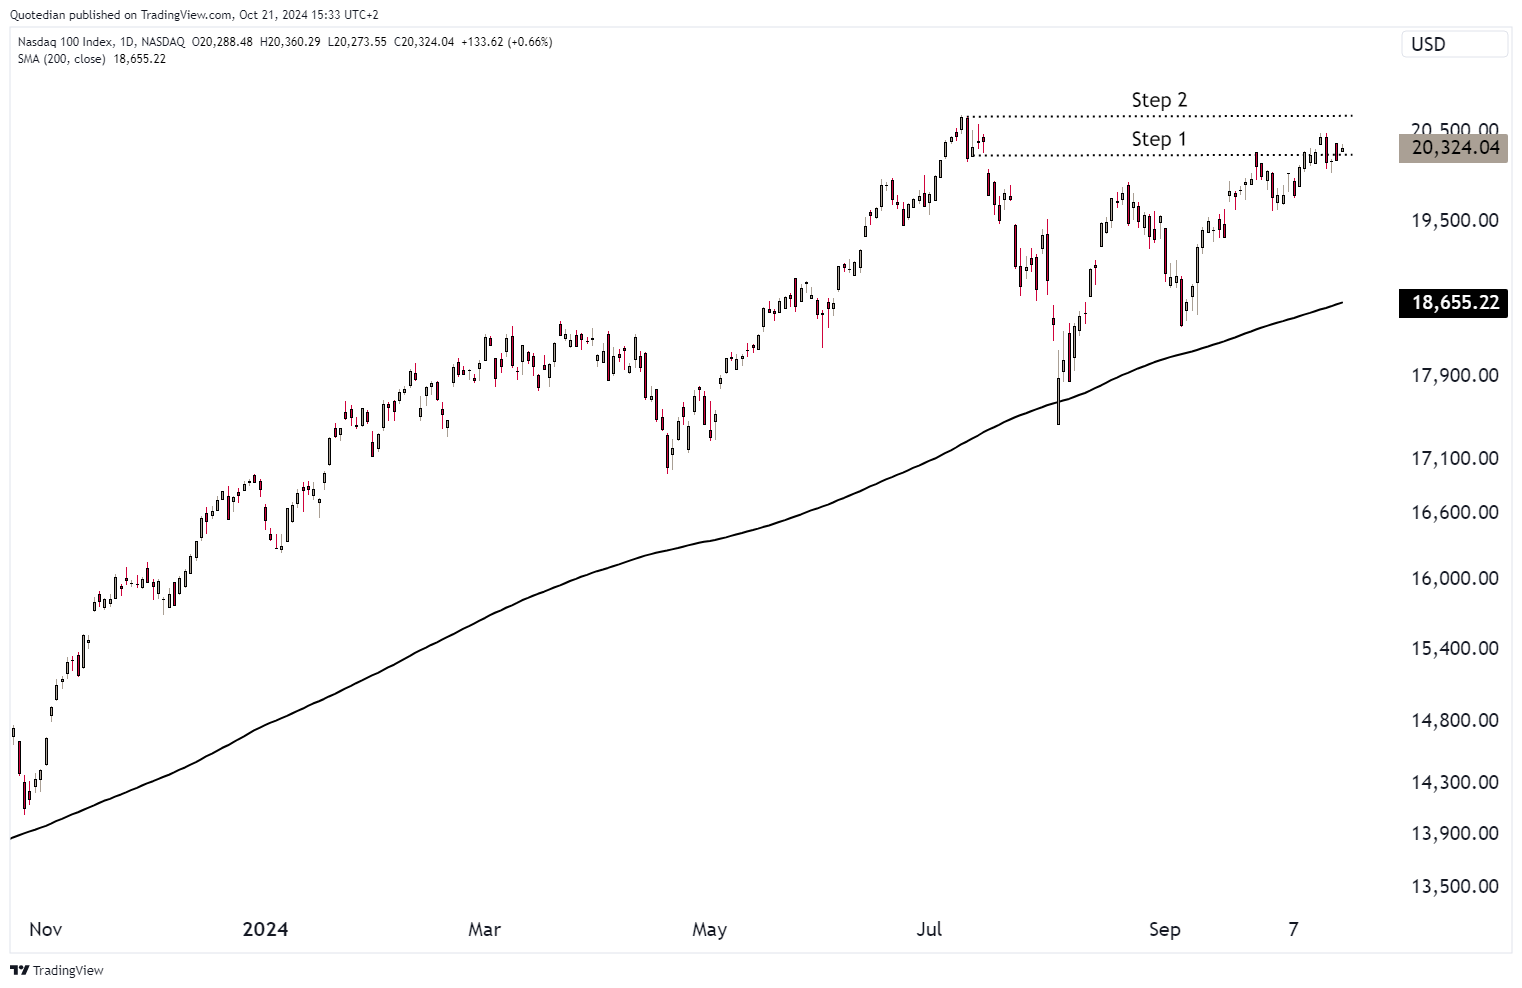
Still nothing bearish there. The Nasdaq 100 still needs to confirm uptrend continuation by reaching a new ATH, but to be honest, it seems more a question of WHEN than IF:
Dow Theorists (click here) must be happy geezers these days, as the DJ Transport index (lower clip) finally gave a bull trend confirmation on the Industrials (upper clip) by reaching a new cycle high last week (circled):

But probably more importantly, small cap stocks via the S&P 600 small cap index (lower clip) finally rejoined the bull market too, after its midcap cousins (middle clip) had done so already a few weeks ago:

Aaaaand, the lift was also enough to finally push the Russell 2000 to a new cycle high!


Over in Europe, we are on attempt number seven or so (depends on how you count) to break to a new ATH on the STOXX 600 Europe index:

An index focus on the Eurozone only, such as the EuroNext 150 for example, shows there is still more lag in common economic zone’s stock market:

In Asia, Japan’s Nikkei 225 continues to consolidate within a wide trading range:

And talking of volatility, the Chinese equity market is working hard on giving that word a whole new meaning:

For example is the 10-day historical volatility (white line) still above the level that used to be the TOP (red dashed):

Let’s end our equity index review with a look at India’s BSE500, which, and please do not shoot the messenger, be forming a short-term shoulder-head-shoulder topping formation:

Now, let’s check on the best performing stocks year-to-date in the US and Europe and how they have fared over the past week, starting for once with the latter:

And here’s the US list:

There are three utilities stocks in the top 25, which is probably unusual during a raging bull market, where these traditionally more defensive stocks tend to underperform.
But that brings us exactly back to our snazzy title of today’s letter. After Amazon already bought into a nuclear powerplant company (Talen Energy - TLN) in spring of this year and Microsoft announced they’d finance Constellation Energy (CEG) heavily to get their Three Mile Island nuclear plant up and running again, it was Google’s turn last week to announce that they will get 500 megawatts of power from a series of small reactors built by Kairos known as small modular reactors (SMRs). The first one is expected to go online in 2030, with the rest up and running by 2035.
This is of course a theme we have been pounding since Q1 of this year and which is now accelerating as electricity providers (Fission) are bought up by the AI pretenders (Chips).
Here are some of the tastiest in town:


 - S14E05 | Video gifs by quotes | be229c70 | 紗")

Something’s going on in bond markets, where especially the US bond yield curve is shifting higher yet again (green = today / brown = 1 month ago):
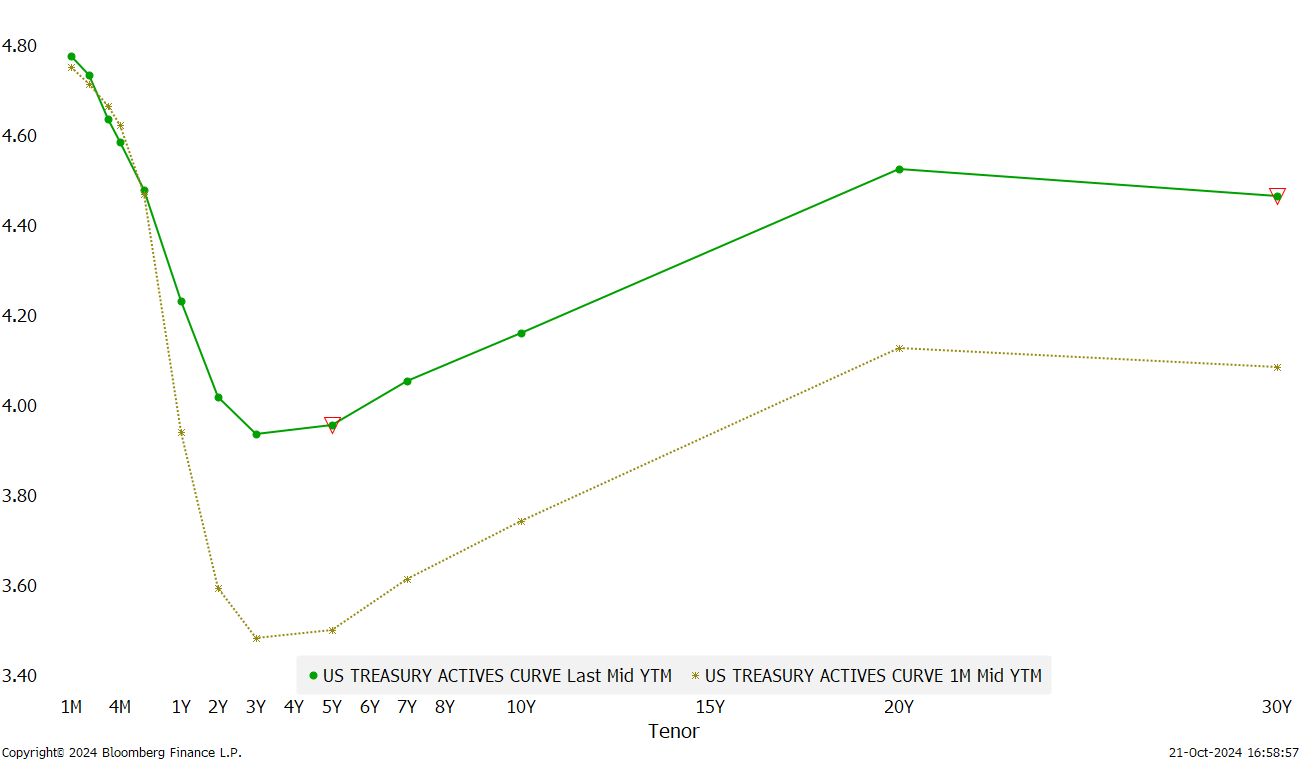
It can be easily seen from the graph above that yields are especially moving higher at the longer end of the curve, which is provoking a bear steepener of the curve:

Could this be the Trump Trade already unfolding?

Perhaps.
What argues partially against that is that European yields are rising too at the long end. Here’s the German 10-Year Bund yield chart:

The ECB cut their key policy rate last Thursday (pointing hand) upon which nothing at all happened for two sessions. However, that last candle is today and reflects a huge 10 basis points move, which by the time I have to hit the send button on this mail I had not been quite able to pinpoint the reason.
In any case, prepare for the discussion returning on how high is too high in yields for the stock market …
Back to the US bond market for a final observation, where the iShares 20+ Year Treasury Bond ETF (TLT) is quickly giving back most of its May to October gains and actually trades negative again on a year-to-date basis:


In currency markets, we got quite some egg on our face at the launch of our Q4 outlook (click here), where we downgraded the US Dollar and cited that the greenback was on the verge of breaking key support:

A stark reminder to always stay humble, or Mr Market will humble you very, very quickly!
Anyhow, maybe have been saved by the bell now, or, better said, saved by the Economist cover-page contrarian indicator. This was last week’s cover, after the US Dollar had rally nearly four percent since the end of September:
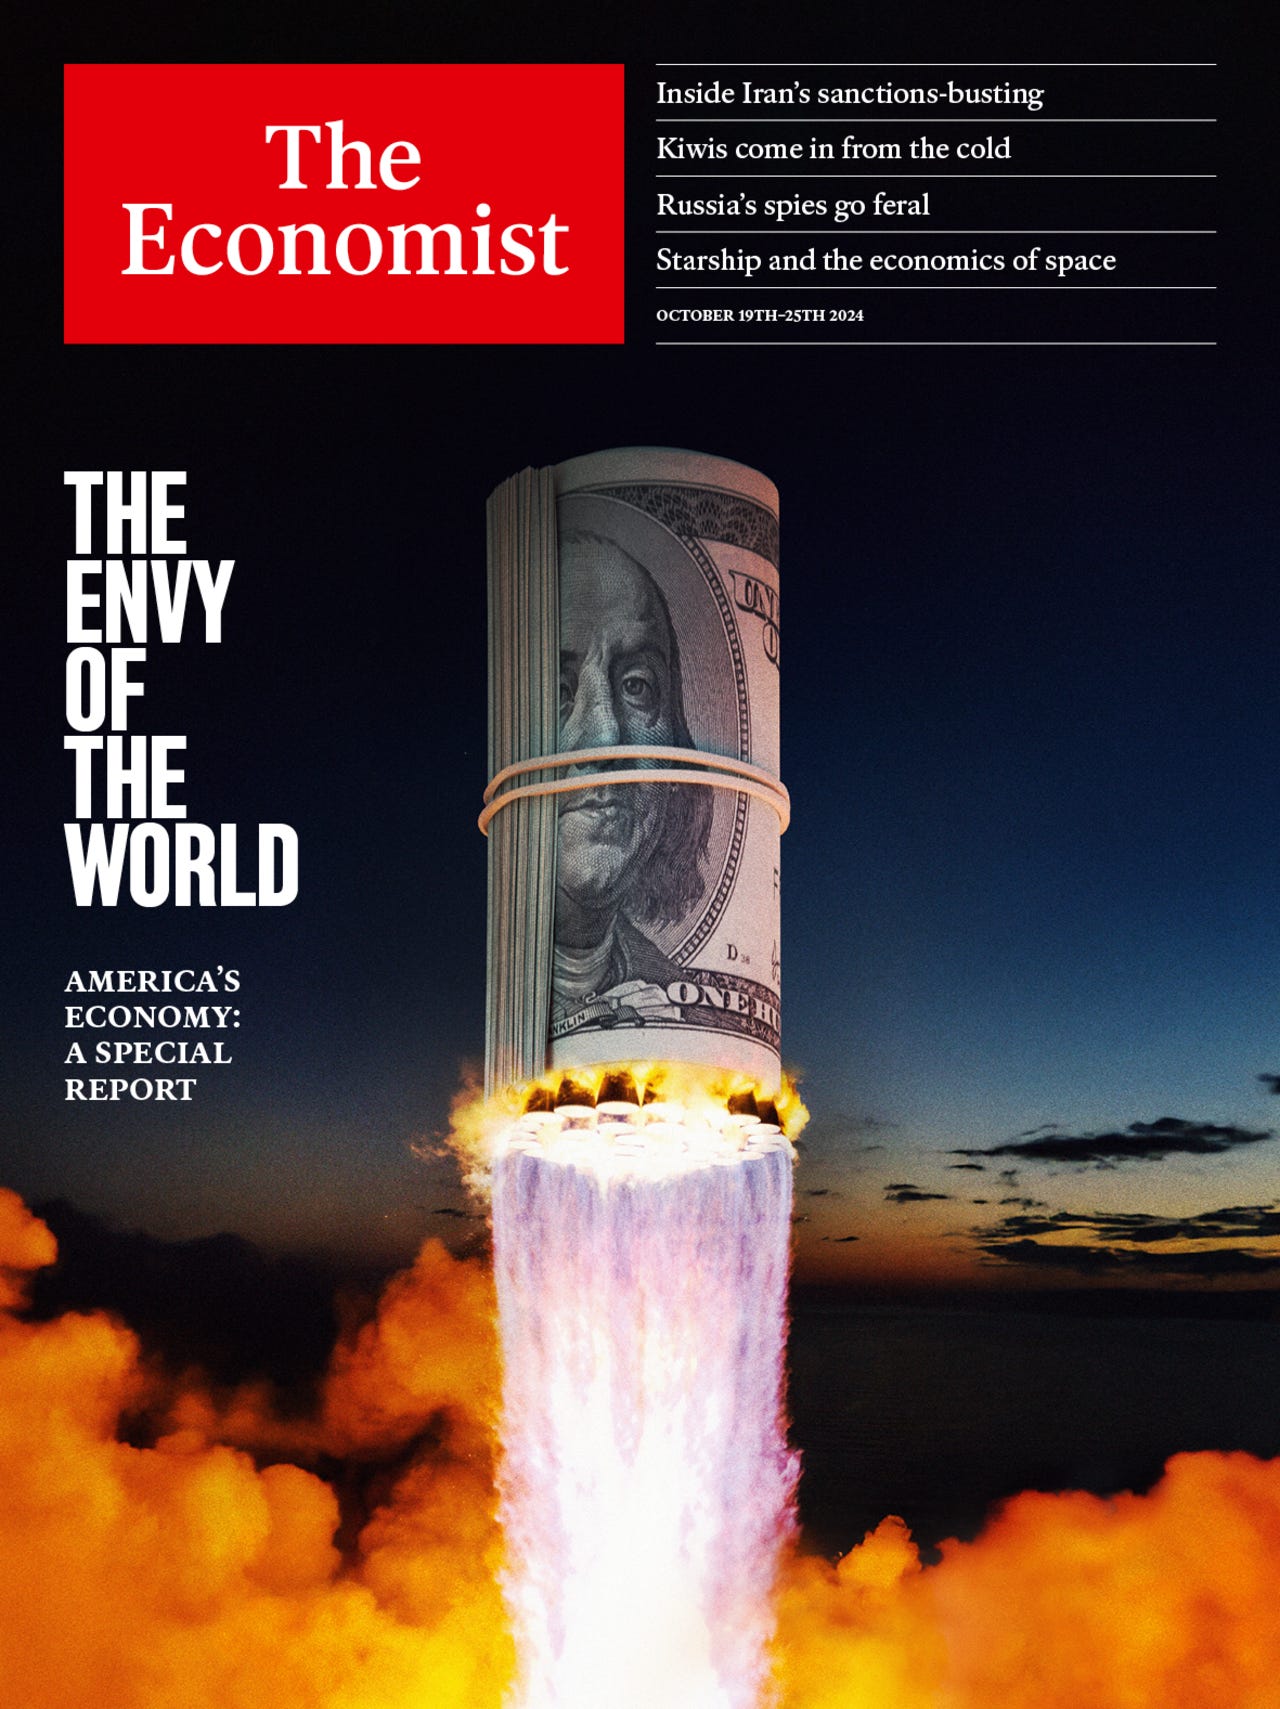
However, to be precise, the cover does not refer to the US Dollar itself, but rather to the US economy. But still …. hope dies last!
The EUR/USD has fallen back into its trading range,

whilst the USD/JPY probably got one or the other central banker scratching his head at the BoJ:

And finally, the whole Bitcoin community was holding its collective breath on Sunday, as it seemed that finally Bitcoin would break out of its large sideways consolidation. Today’s sell-off must have been particularly frustrating in that context:


No disappointment for Gold holders though, as the yellow metal continues its own melt-up (yes, pun intended):

The following meme came to me via X just about at the time I was writing about Gold:

Divine intervention? Again, perhaps. But the 15% distance of price to 200-day moving average should become an issue eventually - probably not time to jump after prices now.
But, and isn’t there just always a but or a however in investing, when looking at the price of Silver, we could argue that this precious metal has just broken out last Friday, confirming Gold’s move:

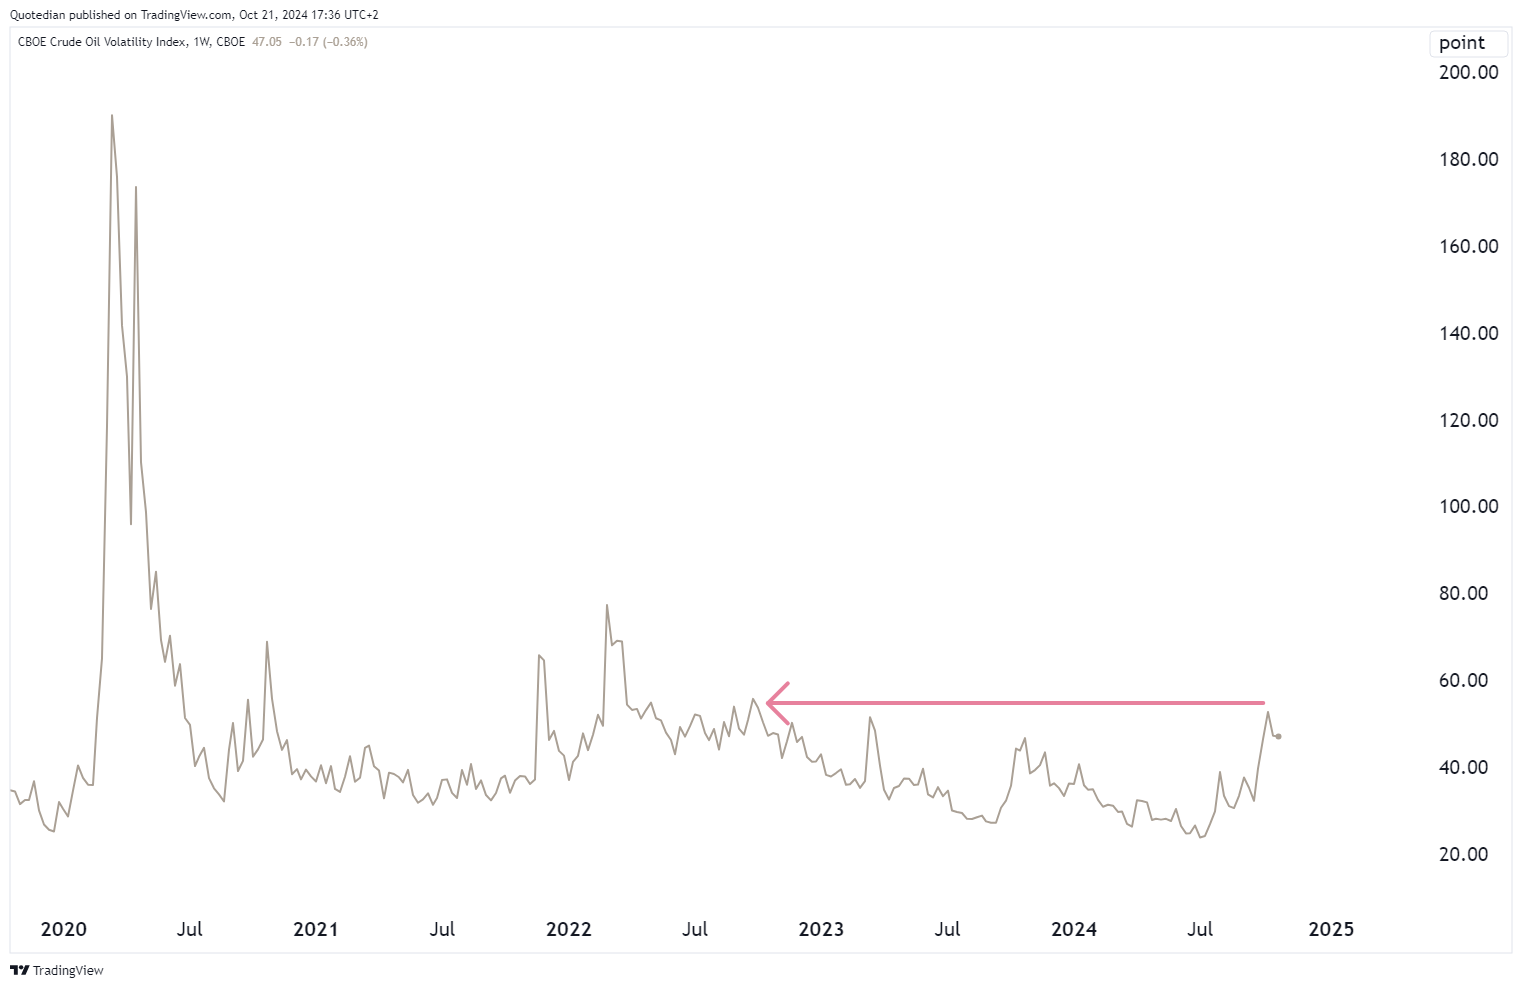
The Middle-East related risk premium in the price of oil has completely depleted:
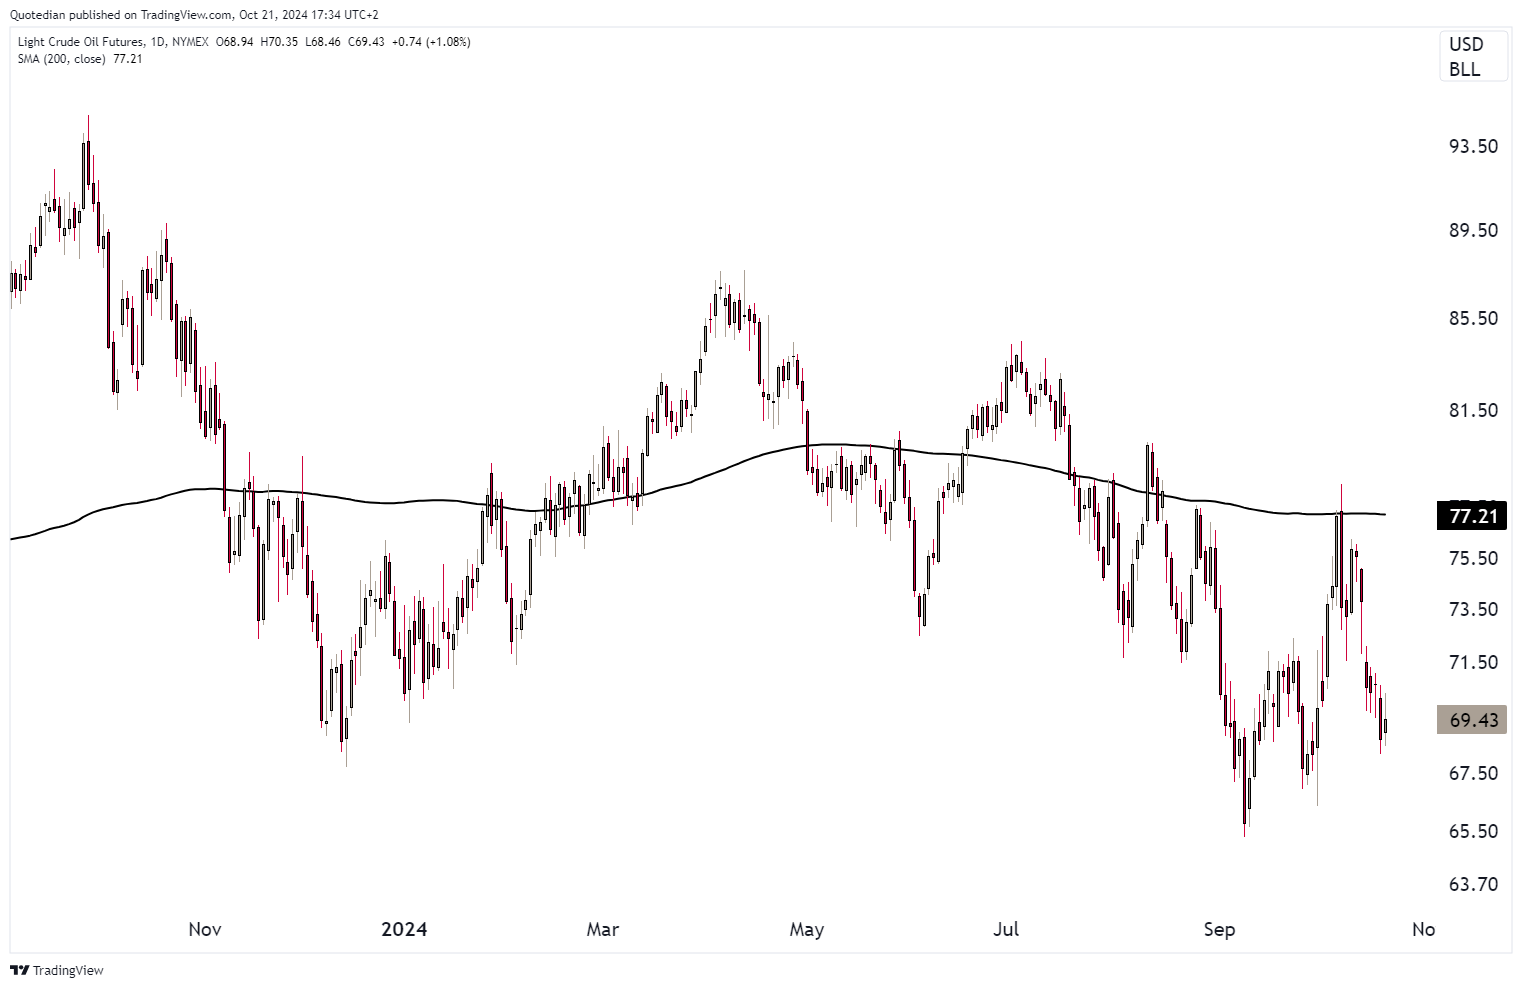
Of course, it (the risk premium) could very quickly reignite, but its a hard asset to trade as price volatility remains so high:

But lower oil prices also has its advantages, and not only for filling up your ICE car cheaper. Olive oil prices are excellent news too for your salad dressings, and we just had a 25% price reduction in Andalusian extra virgin olive oil:

Still expensive, but hey, we take a 25% discount any day!

Everything in this document is for educational purposes only (FEPO)
Nothing in this document should be considered investment advice
Investing real money can be costly; don’t do stupid shit
The views expressed in this document may differ from the views published by Neue Private Bank AG
Past performance is hopefully no indication of future performance