

(F)Oiled
Volume V, Issue 180


“If you have nothing to say, say nothing.”
— Mark Twain
DASHBOARD
AGENDA

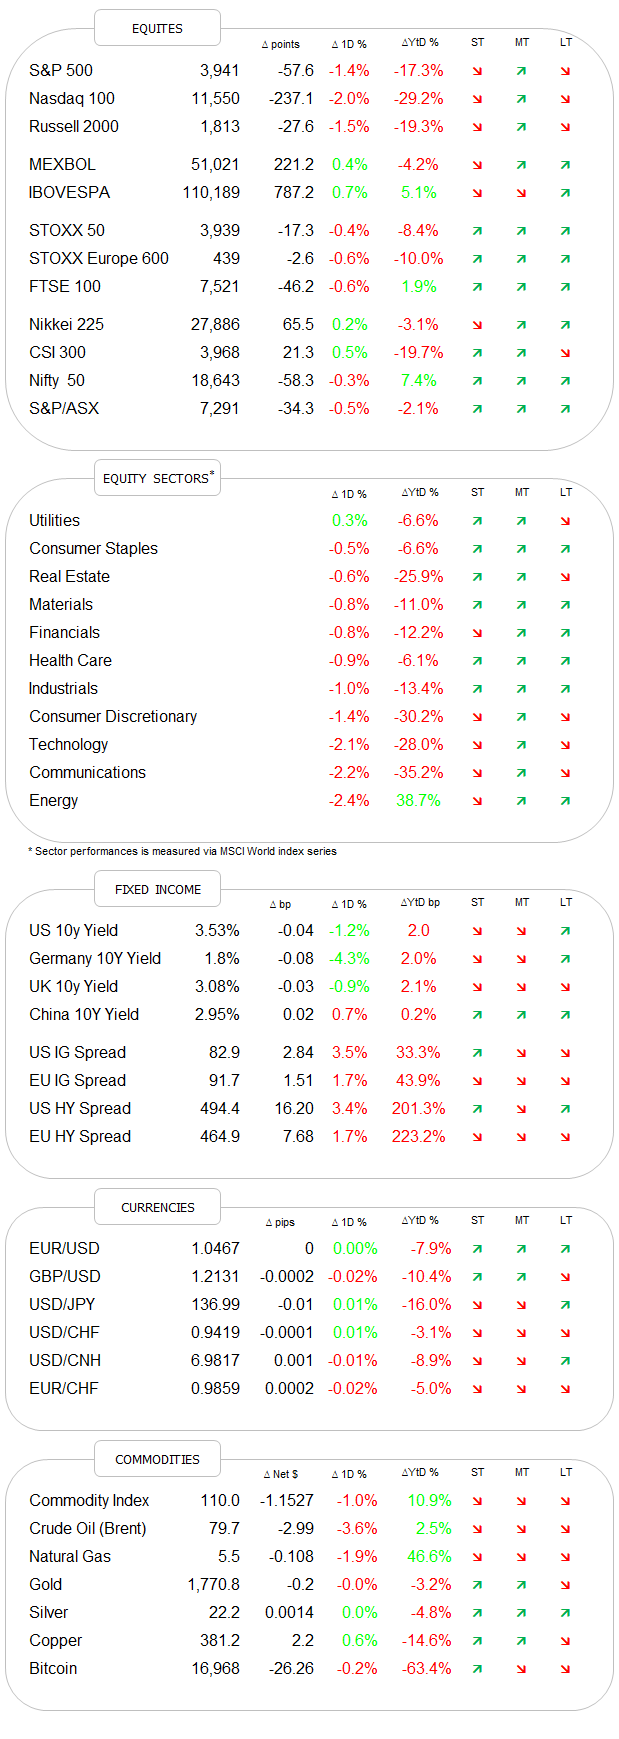
CROSS-ASSET DELIBERATIONS
Stocks declined for a fourth consecutive day in the US yesterday (third in Europe), undoing all of the most recent Powell Pivot last Wednesday:

On a more positive note, the index respected our first warning light level at 3,900 (blue dotted line) - for now:

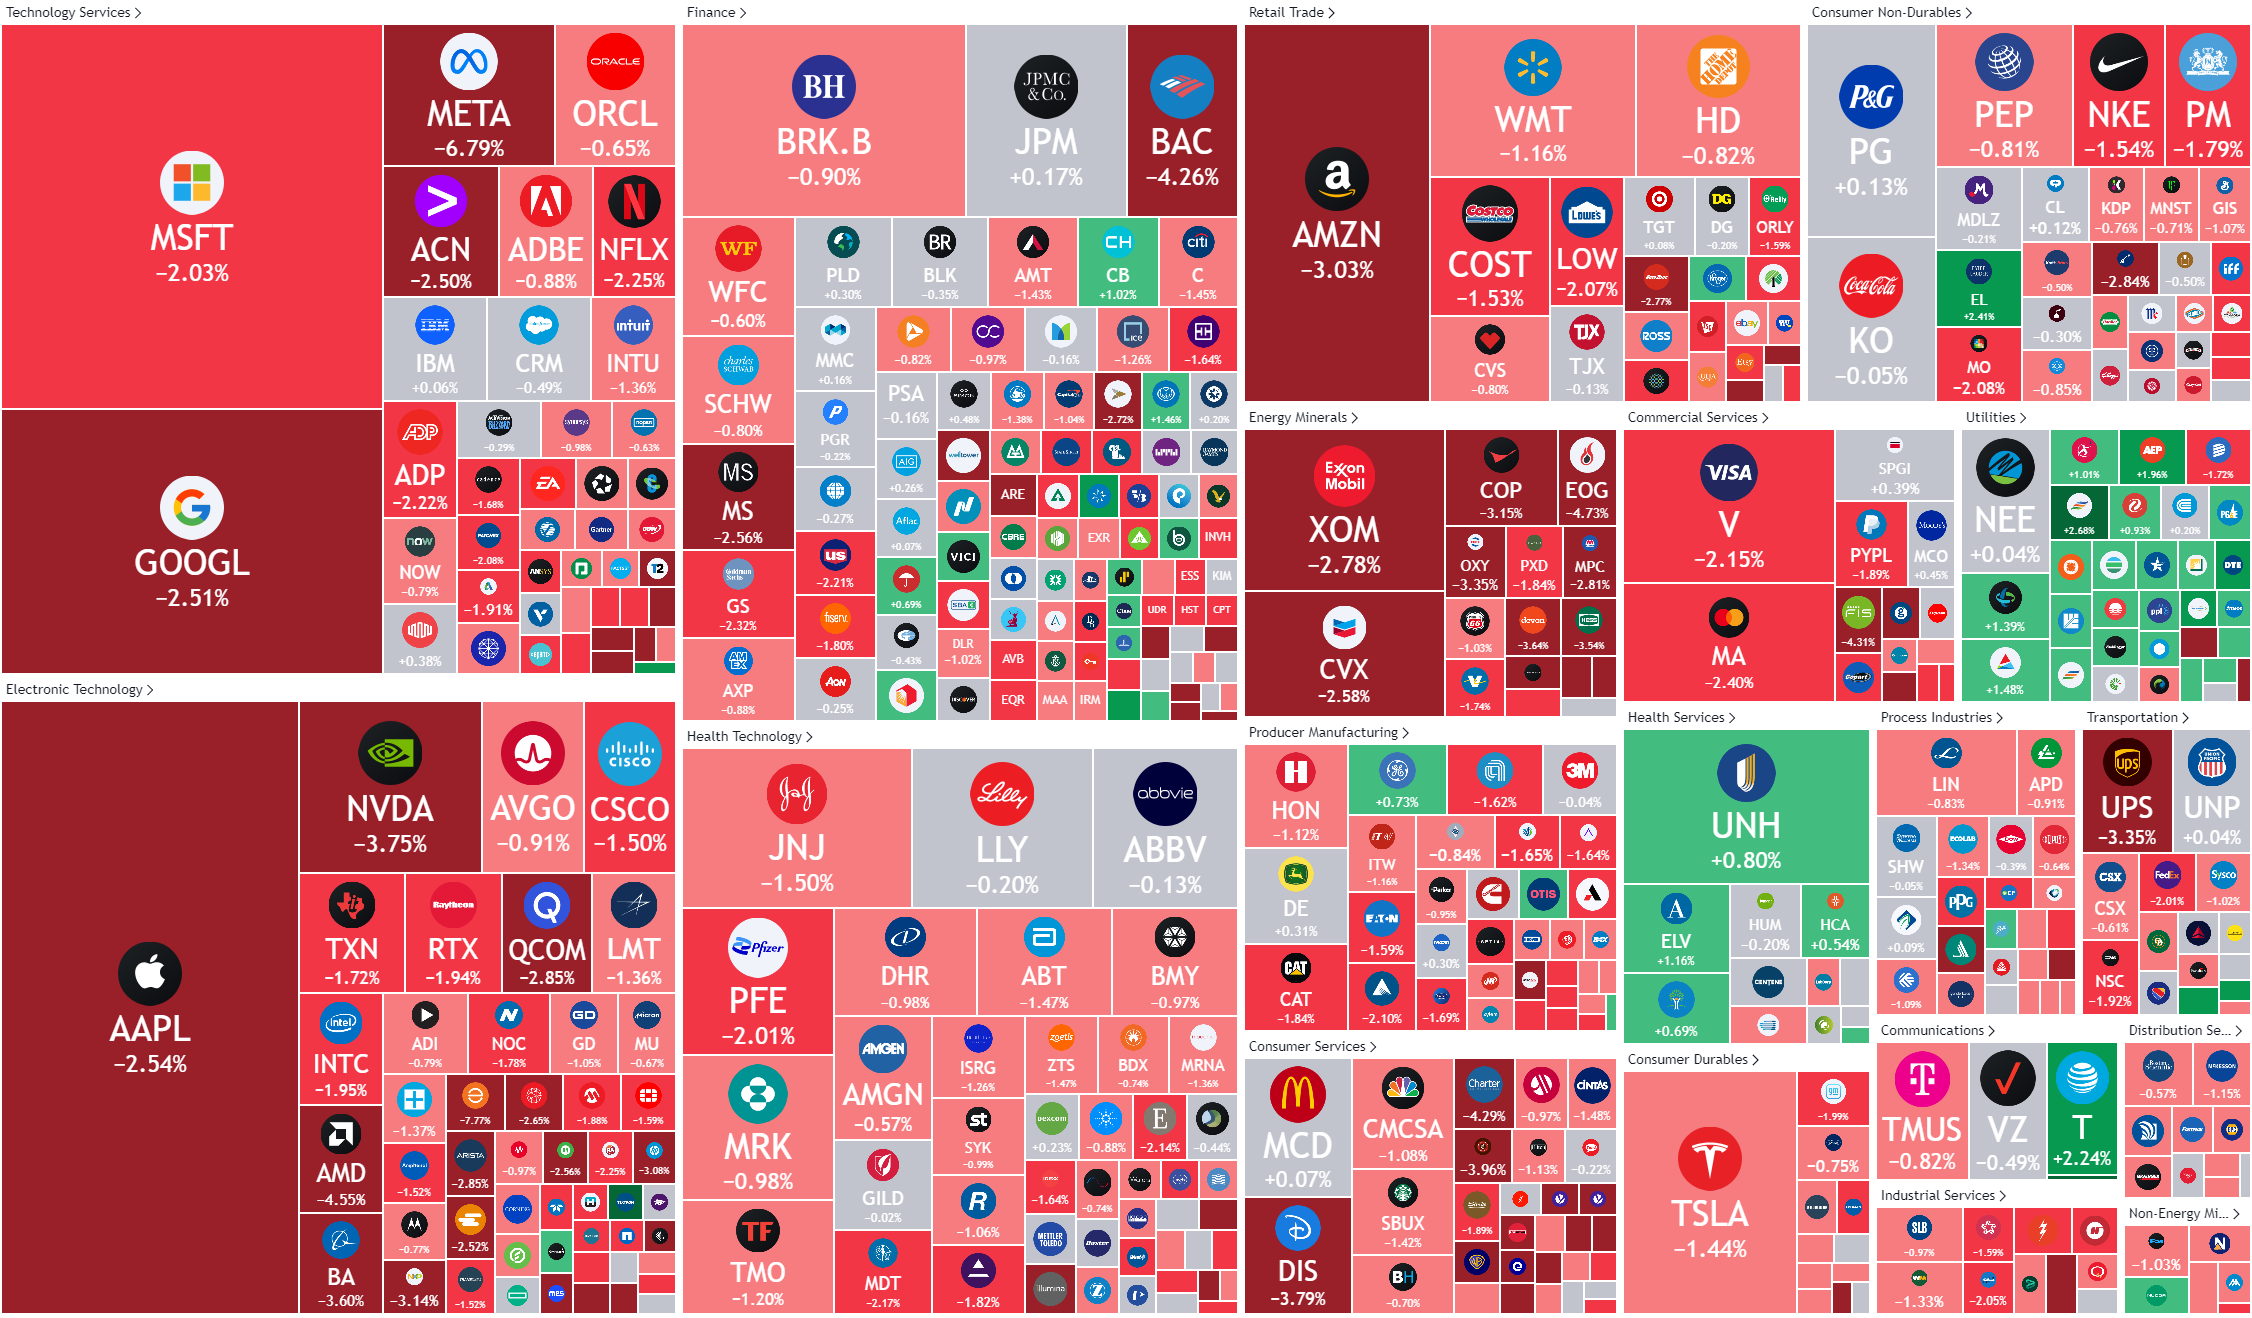
As in Monday’s session, was the selling pretty broad (S&P 500 advance/decline ratio 1:4), but also on comparatively low volumes. Only one sector (Utilities) managed to close in the green:

Energy stocks got the most stick, as the oil price continued to soften, followed by longer duration sectors such as Tech or Consumer, which was mildly surprising given the late rally in bonds (sell-off in yields).
Here’s the final heatmap for the day:
The rally in small-cap stocks is also faltering, with the Russell 2000 closing below its 200-day moving average (blue line) and breaking the most recent uptrend line (green dashed):

Maybe also to highlight the weakness in the banking sector, which is not necessarily a positive sign for the overall market, though for now the sector (proxied by SPDDR Financial Sector ETF - XLF) is holding above its 200-day moving average. Also, an interesting pivot line (green dashed) on the chart as indicated by the red circles:

Asian markets are printing red nearly throughout this morning, though European and US index futures are flat to slightly positive.
US yields (10y) got under pressure towards the end of yesterday’s session and again this morning (shaded areas) for no very apparent reason other than expected global economic slowdown:

But the yield curve continues to fail to steepen:

Credit spreads finally also widened a bit on the back of a weaker equity market, though the iShares iBoxx High Yield ETF as proxy for HY credit remains in the short-term uptrend:

In the commodity space, focus over the past few hours has been on oil (see COTD section below), with little else happening.
Maybe of interest, Wheat prices are plunging
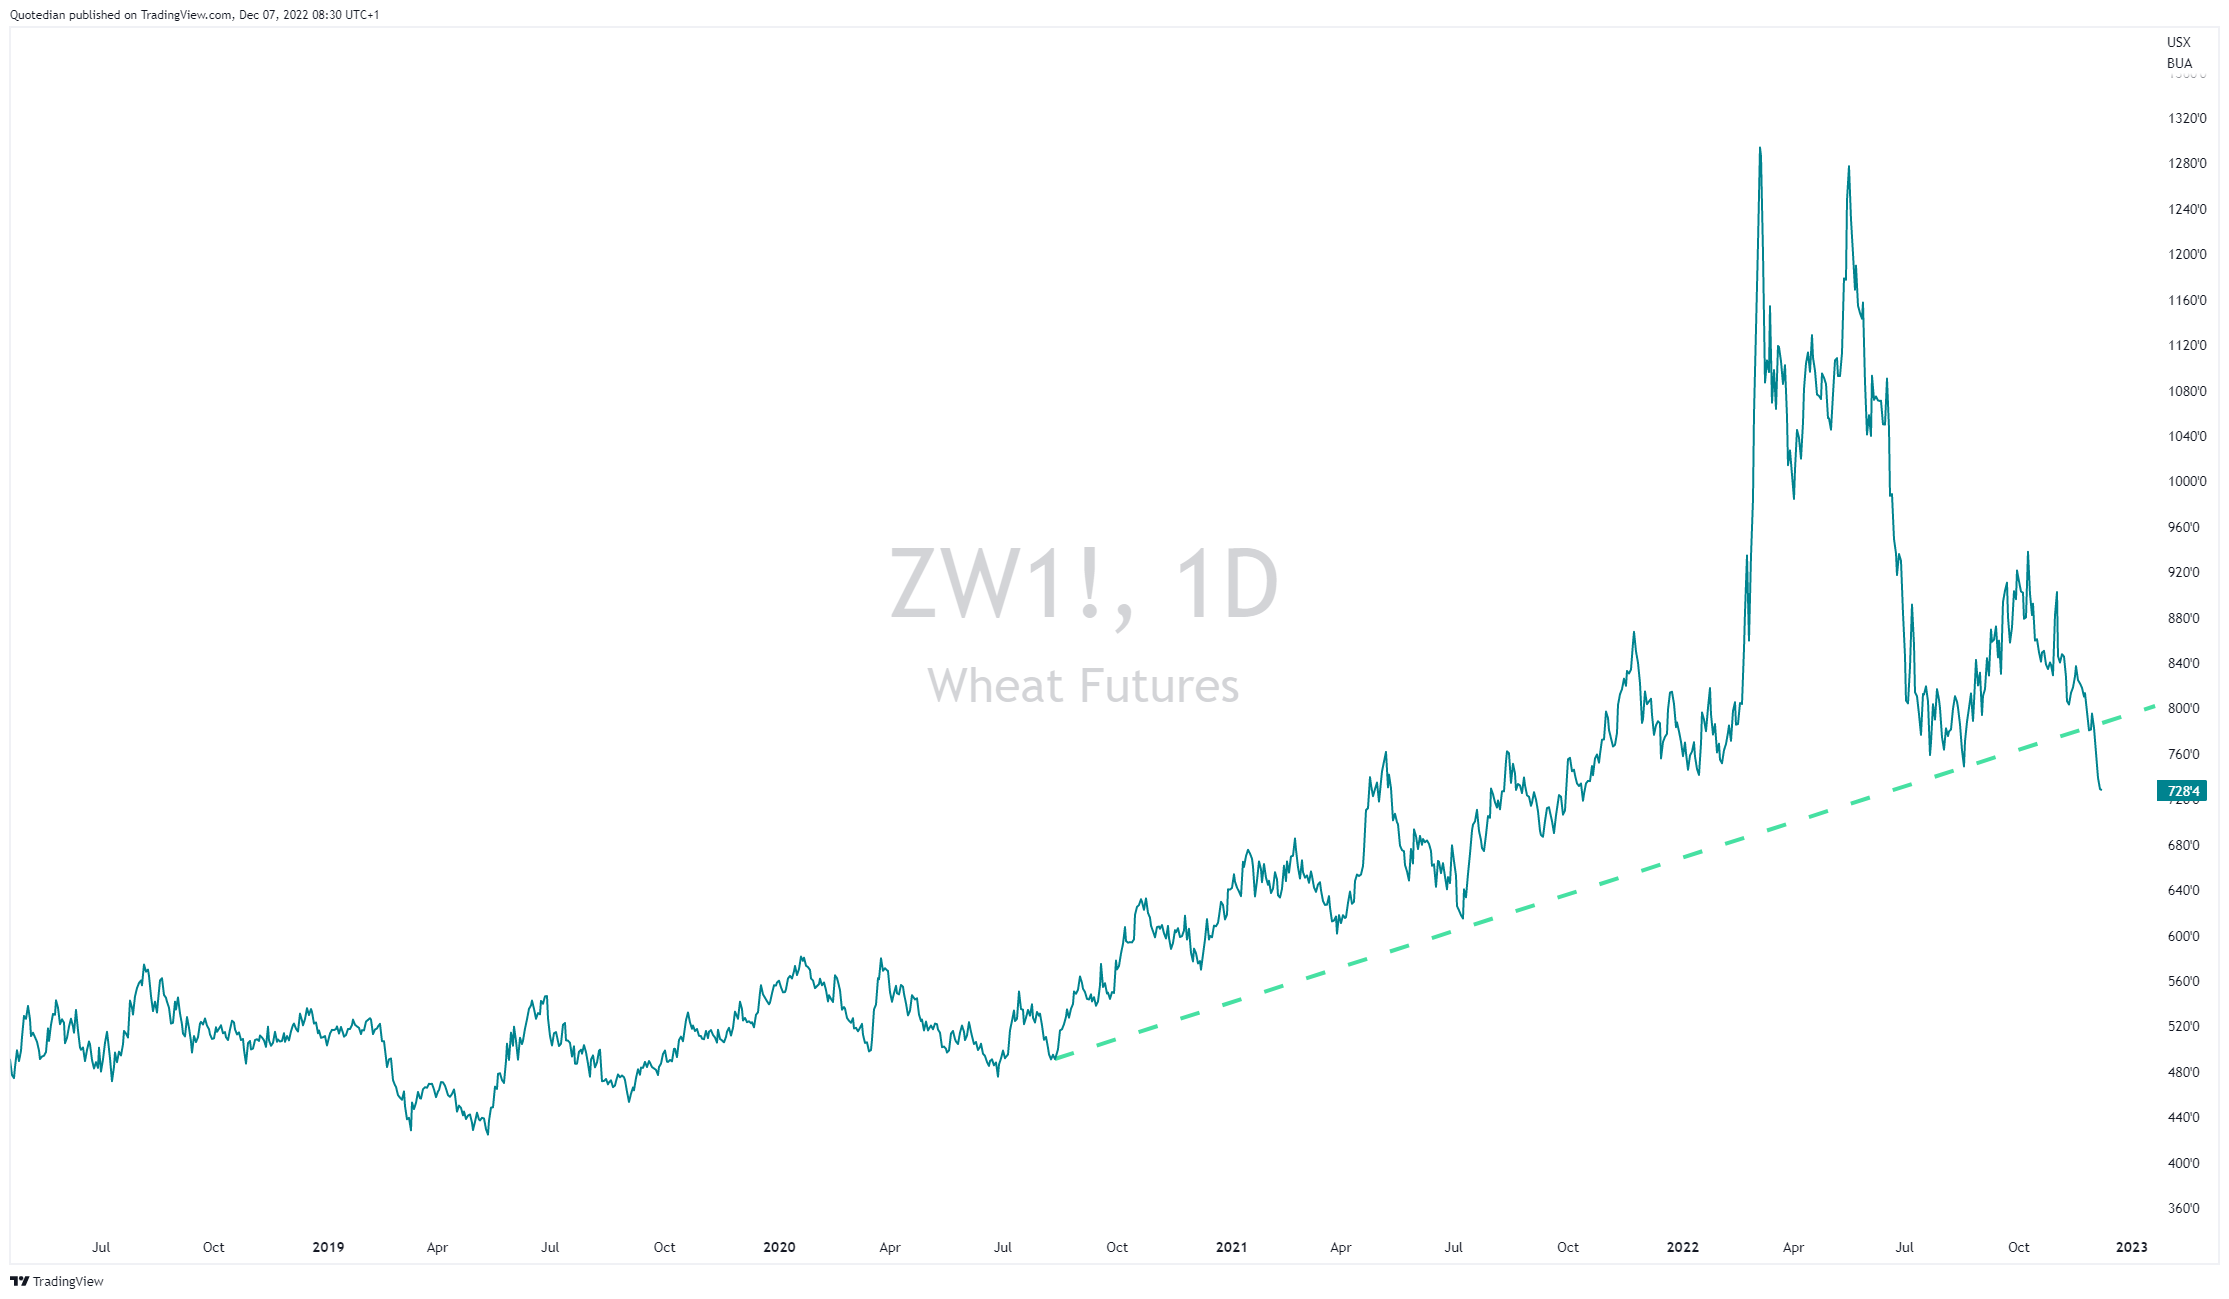
just as inventories hit their lowest in 15 years:

Opportunity?
That’s all for today folks - have a great Wednesday!
André
CHART OF THE DAY
The secular rally in oil is foiling, erstwhile most strategists are still forecasting >$100 prices:

As the chart on WTI above shows:
Prices remain in a downtrend (shaded line)
the 200d MA is sloping downwards now (blue line)
and our defined key support is breaking (red dashed line)
AND all this, whilst the sell-off in the USD (inverted below) should actually have been supportive:

What if the US Dollar suddenly turns higher again?
Stay tuned …
Thanks for reading The Quotedian! Subscribe for free to receive new posts and support my work.
DISCLAIMER
Everything in this document is for educational purposes only (FEPO)
Nothing in this document should be considered investment advice
Past performance is hopefully no indication of future performance