FOMO
The Quotedian - Vol VI, Issue 37 | Powered by NPB Neue Privat Bank AG
"Logic Is The Beginning Of Wisdom...Not The End."
Mr Spock
DASHBOARD
AGENDA
CROSS-ASSET DELIBERATIONS
As we have a deep-dive, end-of-month update on Thursday, today’s weekend edition may end up being a bit shorter than usual. We’ll see by the end ;-)
Animal spirits, aka FOMO, are flying high again, and what is the most narrow I have ever witnessed, it is clear there is an accident waiting to happen.
HOWEVER,
“Markets can stay irrational longer than you can stay solvent.”
— John Maynard Keynes
Let’s get the show started…
The good old Quotedian, now powered by Neue Privat Bank AG
NPB Neue Privat Bank AG is a reliable partner for all aspects of asset management and investment advice, be it in our dealings with discerning private clients, independent asset managers or institutional investors.
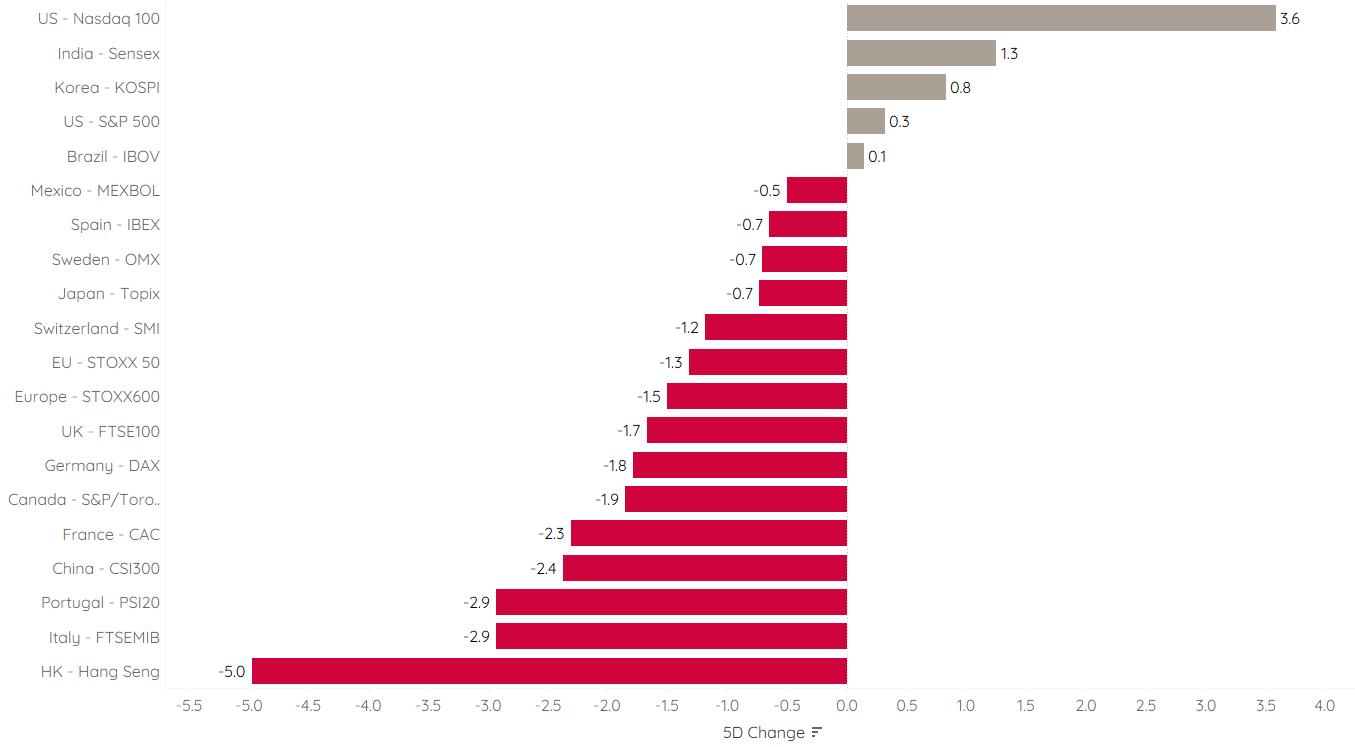
Starting our usual tour with the performance of popular equity bencmarks around the word, we observe that it was a good week … if you concentrate your equity risk in the Nasdaq that is:
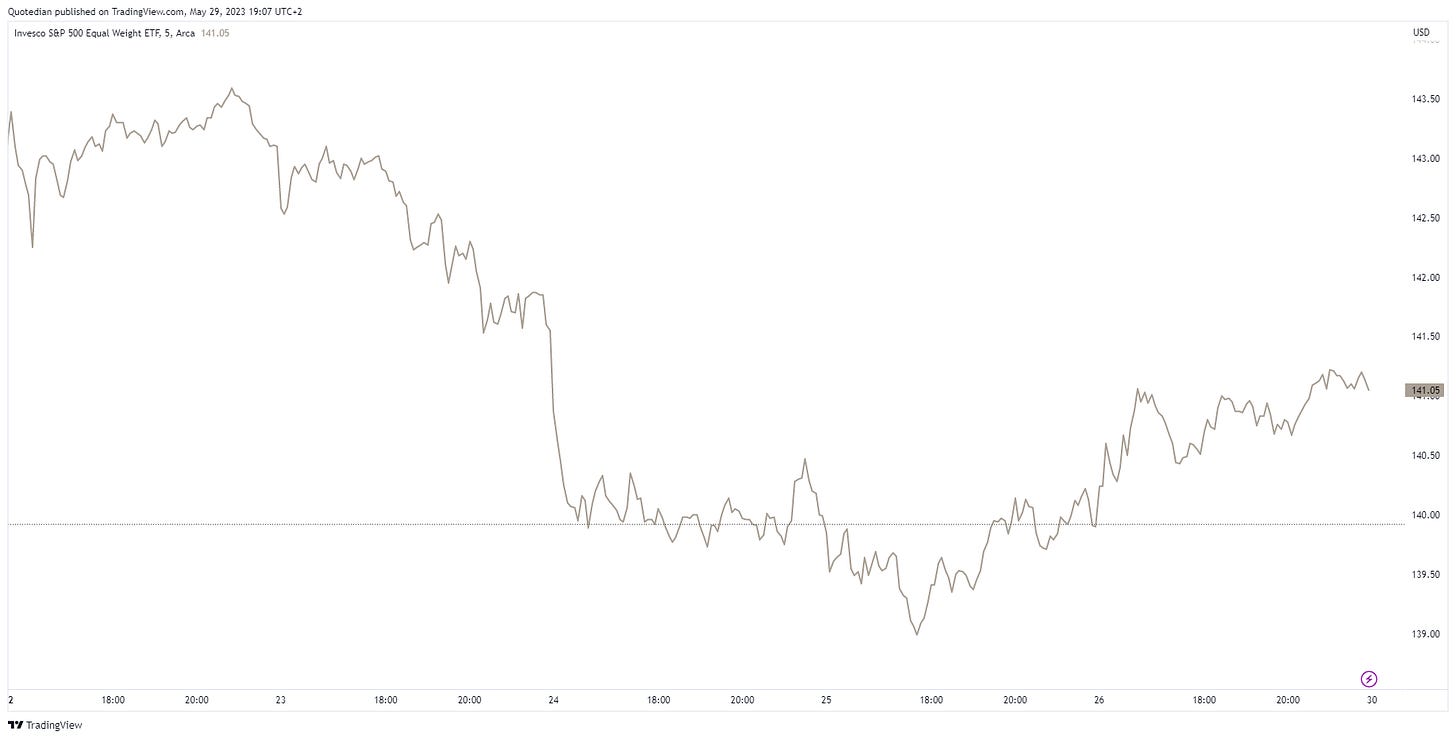
For everybody else, the week was, well… uh … a bit more challenging. Even if you were investing in the S&P 500, you had to be picking the right (highest market cap) stocks, otherwise, you probably had to write a red number by Friday’s close. Here’s the S&P 500 equal-weight index (proxied via the Invesco ETF):
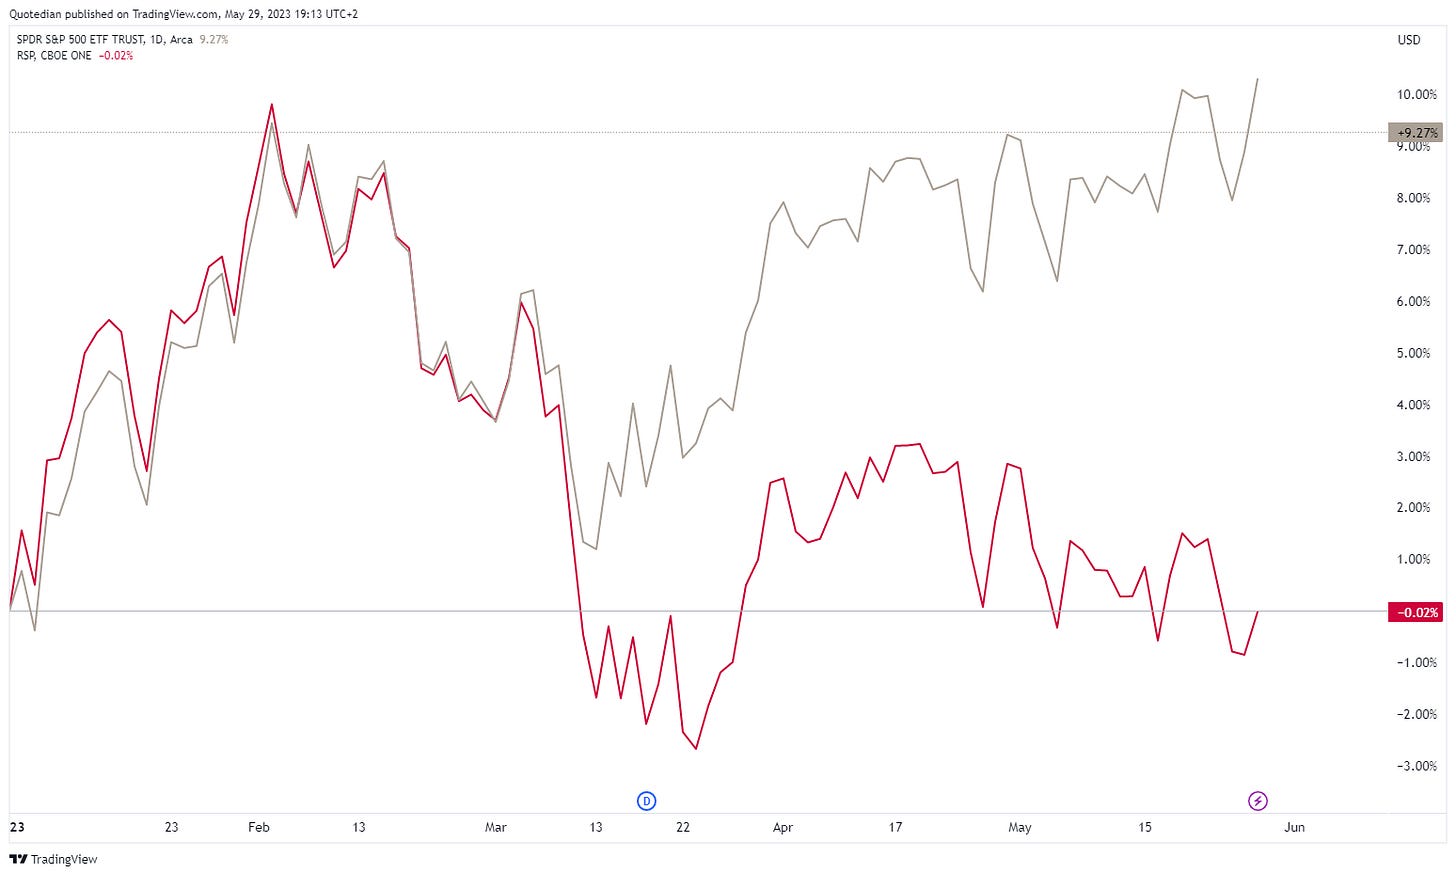
As a matter of fact, let’s deepen that observation a bit further. Here’s the chart of the S&P 500 in its normal, market-cap (grey)and its equal-weight (red) version since the beginning of the year:
Grey is up 10%, red is … negative YTD!!!!
Continuing with that train of thought, let’s make it worse by adding the NYSE FANG+ index (black):
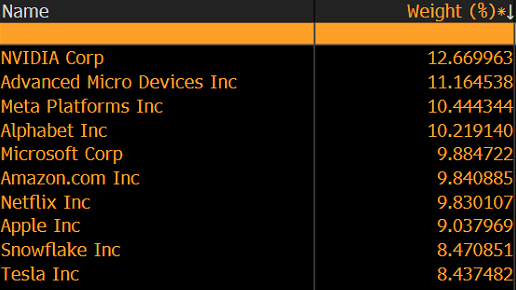
So, what’s in that NYSE FANG thingy index anyway? This:
Now go and check what you actually hold in your portfolio. Exactly!
As we’re on the subject of stocks we do not hold, let’s have a quick review of the best performers on both sides of the pond on a year-to-date basis and the change over the past 5-days. Here’s the US (S&P 500) list:
And here is its European (STOXX 600 Europe) equivalent:
Time to have a look at global sector performance, though I already have a hunch about what will come out on top of the performance gamma:
Bingo!
In the US we now have 44% performance difference between best (tech) and worst (energy):
In Europe that difference (best: consumer discretionary; worst: real estate) is ‘only’ 35%:
Are you paying enough attention to this?
Moving into fixed-income, the tentative debt-ceiling agreement between President Biden and House Speaker McCarthy is likely to dominate over the coming days. If accepted by Congress, the US treasury will issue a boatload of mainly 3- and 10-year bonds in order to re-stock the TGA (Treasury General Account). This, in theory, is a drag on market liquidity and should push yields and the Dollar higher and possibly stocks lower.
As so often, both the US Dollar (see FX section) and yields had already been expecting the outcome of the debt-ceiling debate. Here’s the US 10-year yield:
As somebody I highly respect recently said, we can make here the argument for 3% (unemployment and inflation) and 4.5% (heavy debt-issuance) yields. For active investors, I would propose to buy some bonds here, with a thight stop above 4%, in order to ‘play’ the range.
Its European (German) equivalent, had also adverted breaking the neckline of the shoulder-head-shoulder pattern we had discussed previously, but saw a strong (downside) reversal in today’s session:
Of course, has this yield upside momentum wreaked havoc on bond prices over the past five sessions:
Going long (US) bonds here, as suggested above, would look like this on the chart of an ETF that tracks return of longer-dated bonds (TLT):
Again, low conviction, but as a trading buy with a tight stop loss…. why not.
Turning to FX markets, we already discovered above that the Greenback has had a good tailwind recently, most likely due to tightening liquidity conditions:
As usual, it seems that the US Dollar found a (temporary) bottom just as the noise about its end as the world’s reserve currency got the loudest:
Versus the Euro, 1.05 seems to be a natural target zone:
The demise of the Turkish Lira has accelerated again with the re-election of Erdogan:
In the commodity space, a stronger US Dollar would suggest a headwind for basic materials:
Actually, quite a mixed picture. It seems that grains have been doing pretty well, but everything else not too much so:
Gold is rebounding from an important support zone, and I continue to be bullish,
… BUT …
a break of $1,930ish would put the next buying opportunity to $1,800.
I also continue to be very (long-term) bullish on oil:
… BUT …
do not a) buy before $85 break to the upside or b) start accumulating below $60.
Consumer preferences are changing rapidly… Orange juice is flying:
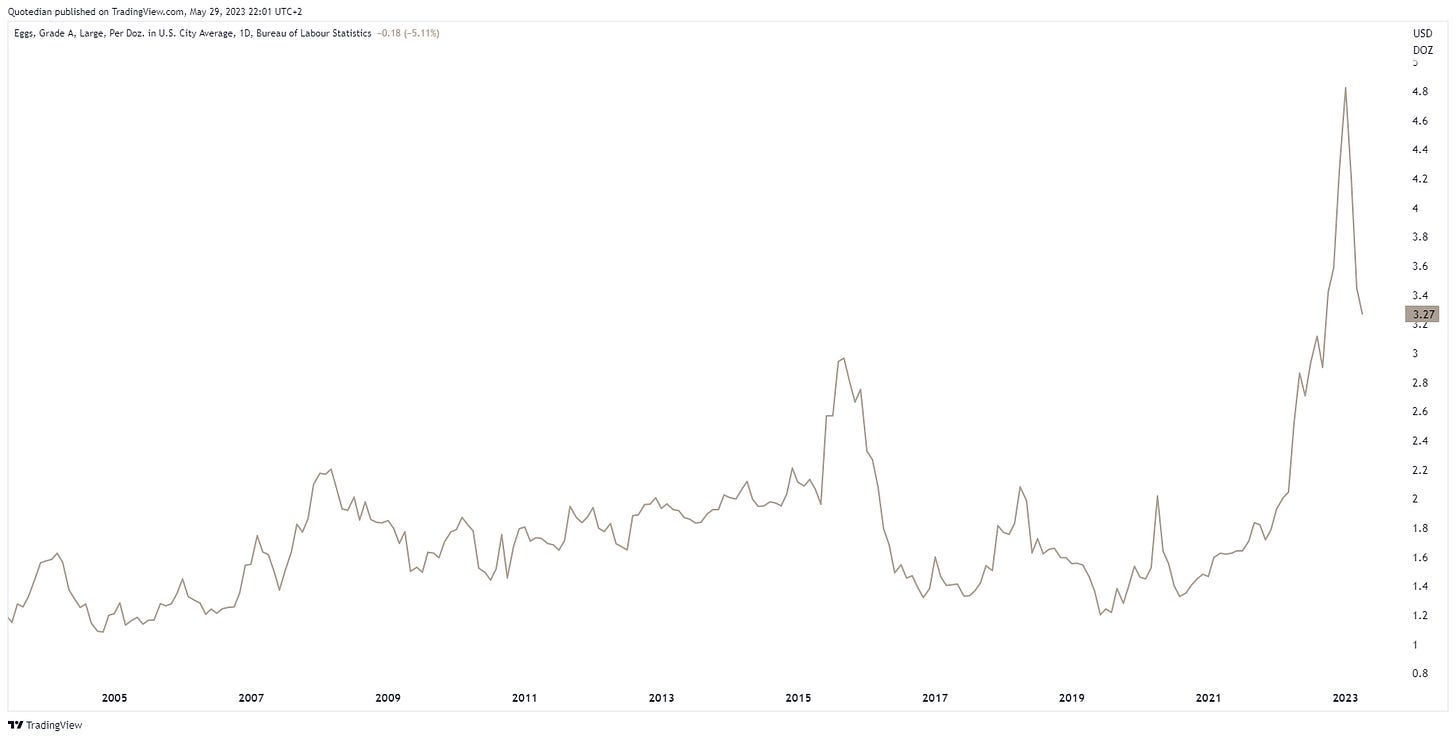
Whilst egg prices are trying to normalize:
Ok, time to hit the send button. The Quotedian should be back on Wednesday with its new and shiny intra-week look and Thursday is review-the-month time. Make sure to stay tuned and please share with your network;
Behave,
André
CHART OF THE DAY
The first chart shows the Free Cash Flow Yield of the US energy (green) and technology (white) sectors:
The second chart shows the YTD performance of tech (grey) and energy (red) stocks:
I see a clear divergence between logic and emotions…
Thanks for reading The Quotedian! Subscribe for free to receive new posts the moment they are published.
DISCLAIMER
Everything in this document is for educational purposes only (FEPO)
Nothing in this document should be considered investment advice
The views expressed in this document may differ from the views published by Neue Private Bank AG
Past performance is hopefully no indication of future performance


