Gargantuan
Volume V, Issue 176
“I’ve had a bad month.”
Sam Bankman Fried, 30/11/2022
DASHBOARD
AGENDA
CROSS-ASSET DELIBERATIONS
Gargantuan was not only the market reaction to Powell’s speech yesterday, but gargantuan will also be this letter. Not only do we have the usual month-end/year-to-date performances and monthly charts to go through, but also need to discuss at least partially yesterday’s violent moves on financial markets.
Luckily, most of it will be fancy pictures and charts, so let’s dive right in, working our usual way through the major asset classes.
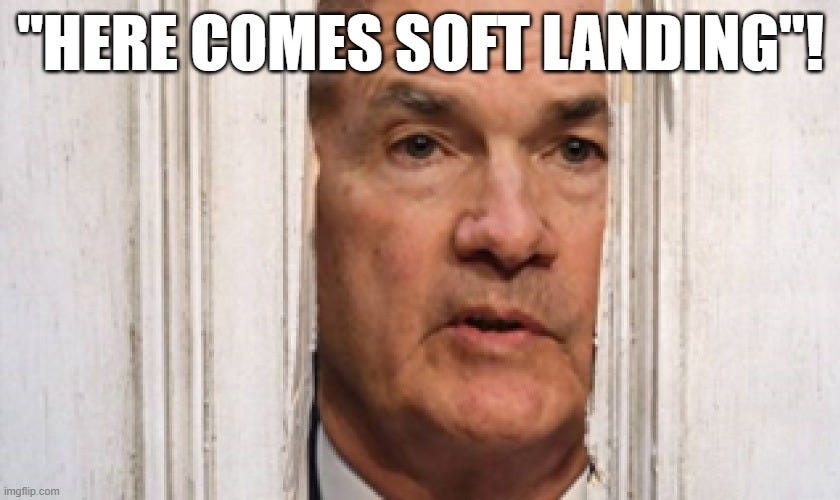
Actually … no. Just before we start, let’s quickly look at what triggered the massive gargantuan rally in equity and bond markets yesterday. So, here’s basically what Mr Powell, who is a lawyer and not an economist, said:
The terminal rate will be higher than expected
Rates will stay higher for longer
A slowdown in pace of hikes may lie ahead.
For some reason, investors decided to ignore 1. and 2. and focus disproportionally on 3. only (even though all three actually say recession ahead). Analysing all this, I somehow can’t get a specific scene from the 1994 movie “Dumb & Dumber” out of my head. In that scene, Lloyd Christmas (played by Jim Carrey) asks the lady he is pretending to go out with (abbreviated for context purposes):
Lloyd Christmas : I want to ask you a question, straight out, flat out, and I want you to give me the honest answer. What do you think the chances are of a guy like you and a girl like me ending up together?
Mary Swanson : I'd say more like one out of a million.
Lloyd Christmas : [long pause while he processes what he's heard] So you're telling me there's a chance. YEAH!
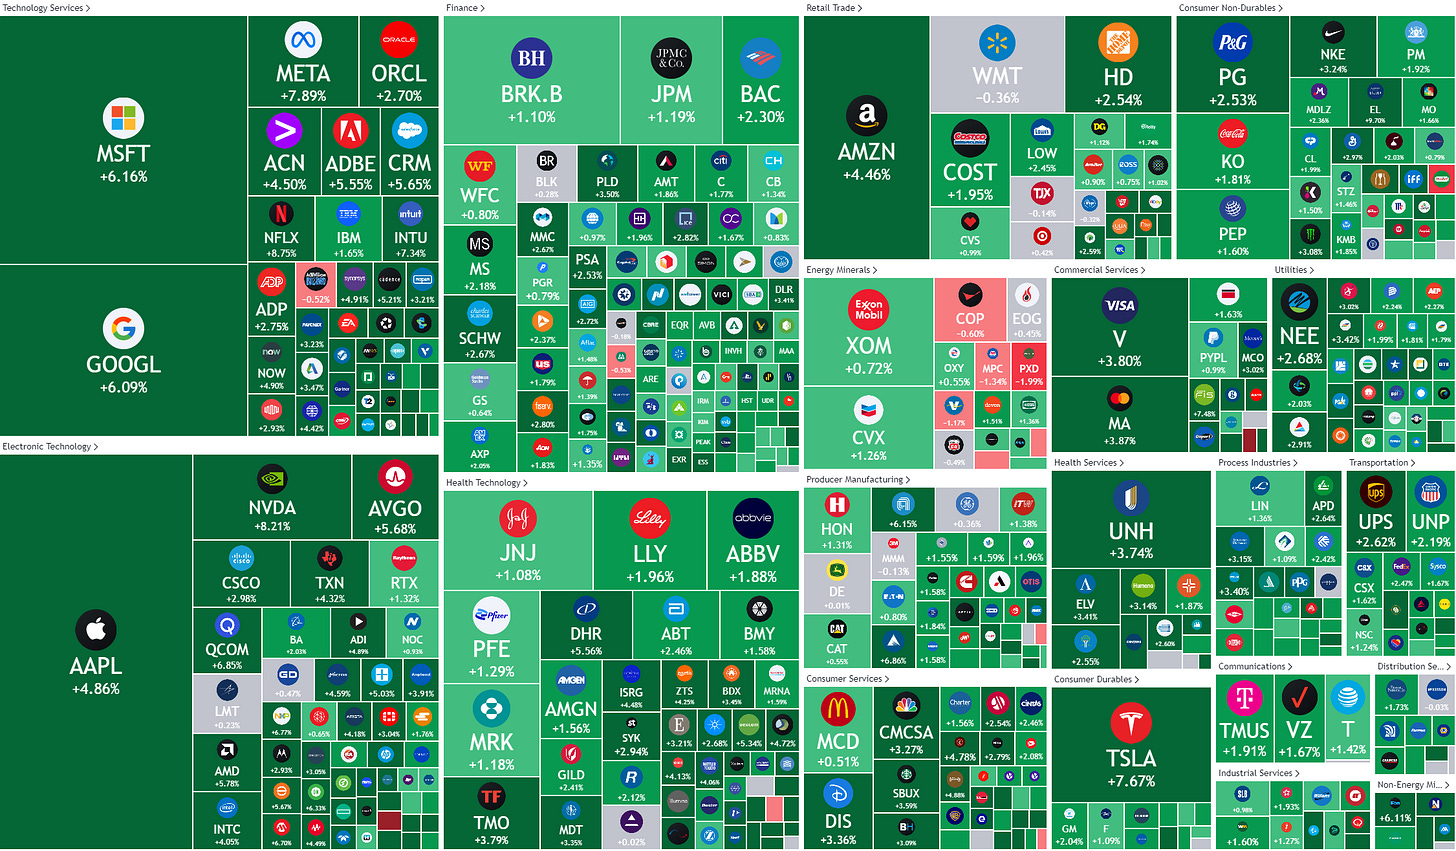
Ok, starting with equities, the S&P jumped over three percent post the Powell statements,
with close to 95% of the index’ members advancing on the day and eleven out of eleven sectors higher, with the typical “long-duration” sectors in the lead:
“Green day” just got competition:
The move has catapulted the S&P 500 right into our first target zone, established several weeks ago:
Hence, the pattern of higher highs and higher lows prevails, which is also the definition of a bull trend. Let’s see if the Jerome Powell Father Christmas can get us into target zone two.
But maybe the most important observation on the chart, is that the S&P 500 closed ABOVE its 200-day moving average for the first time since April!
The Nasdaq and the Russell 2000 were up four-and-a-half and nearly three percent respectively, but we will spend some more time on those markets in one of the next letters.
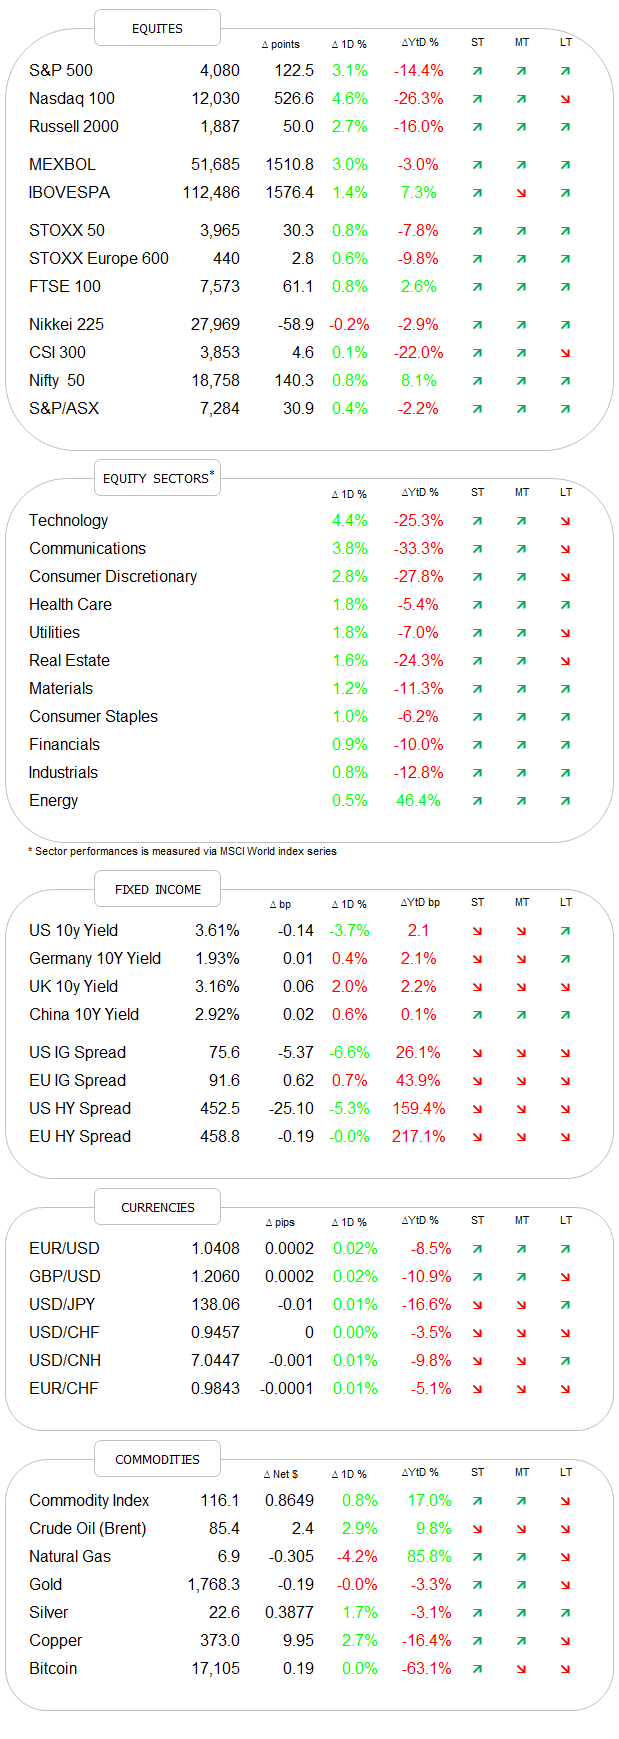
Looking at this from a monthly and year-to-date perspective, we are left with the following picture for major global equity benchmarks (as a reminder, the ‘full, fat’ bars are the November performance, the ‘semi-transparent, thinner’ bars are YTD):
On the monthly chart, we observe that 1) the momentum indicator (MACD) has turned upwards, but is still a far cry from crossing into positive territory and 2) the index has closed above the 10-month moving average (proxy for 200-day MA on daily chart):
Also, this was the second consecutive month of positive returns for equities - it had been a while:
Here’s the monthly update for equity sector performance (MSCI World):
The only positive sector YTD remains to be Energy and the spread to most other sectors remains gargantuan (😉), but at least some improvement on non-energy is taking place.
Other observations:
The Hang Seng Index (HSI) just had its best month since 1998, which is of course when it rose out of the ashes of the Asian Crisis:
European shares are continuing their outperformance versus their US peers, in possibly the craziest year possible to do so:
Briefly back to today: it comes as no surprise that all Asian equity indices are printing green this morning and European equity futures indicate an at least one percent jump as cash markets open.
In fixed-income markets, rates dropped right to the upper end of our wide support zone (US 10-year Treasury), pushing bond prices higher:
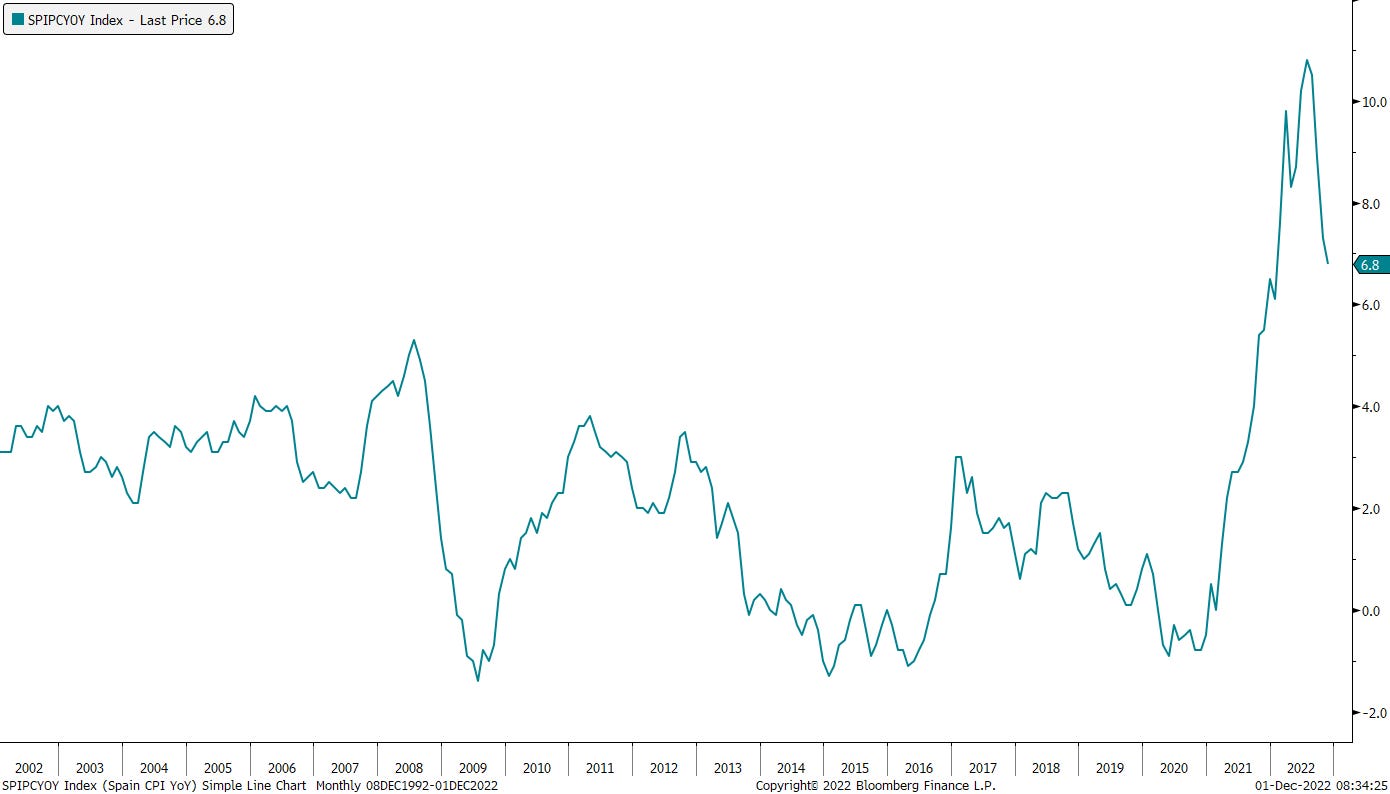
Their German equivalent had already dropped previous to the Powell speech, as inflation data in Europe recently came in softer than expected. Here is Spain’s CPI for example:
Or Germany’s:
I know, barely visible on Germany’s chart and still very elevated in both examples, but rate-of-change (aka direction) is more important for markets than absolute levels!
Here’s the chart of the Bund (10y) then, where our shoulder-head-shoulder topping pattern is still very valid:
Break of 1.79 would be ‘confirmation’ of yield target at 1.40%.
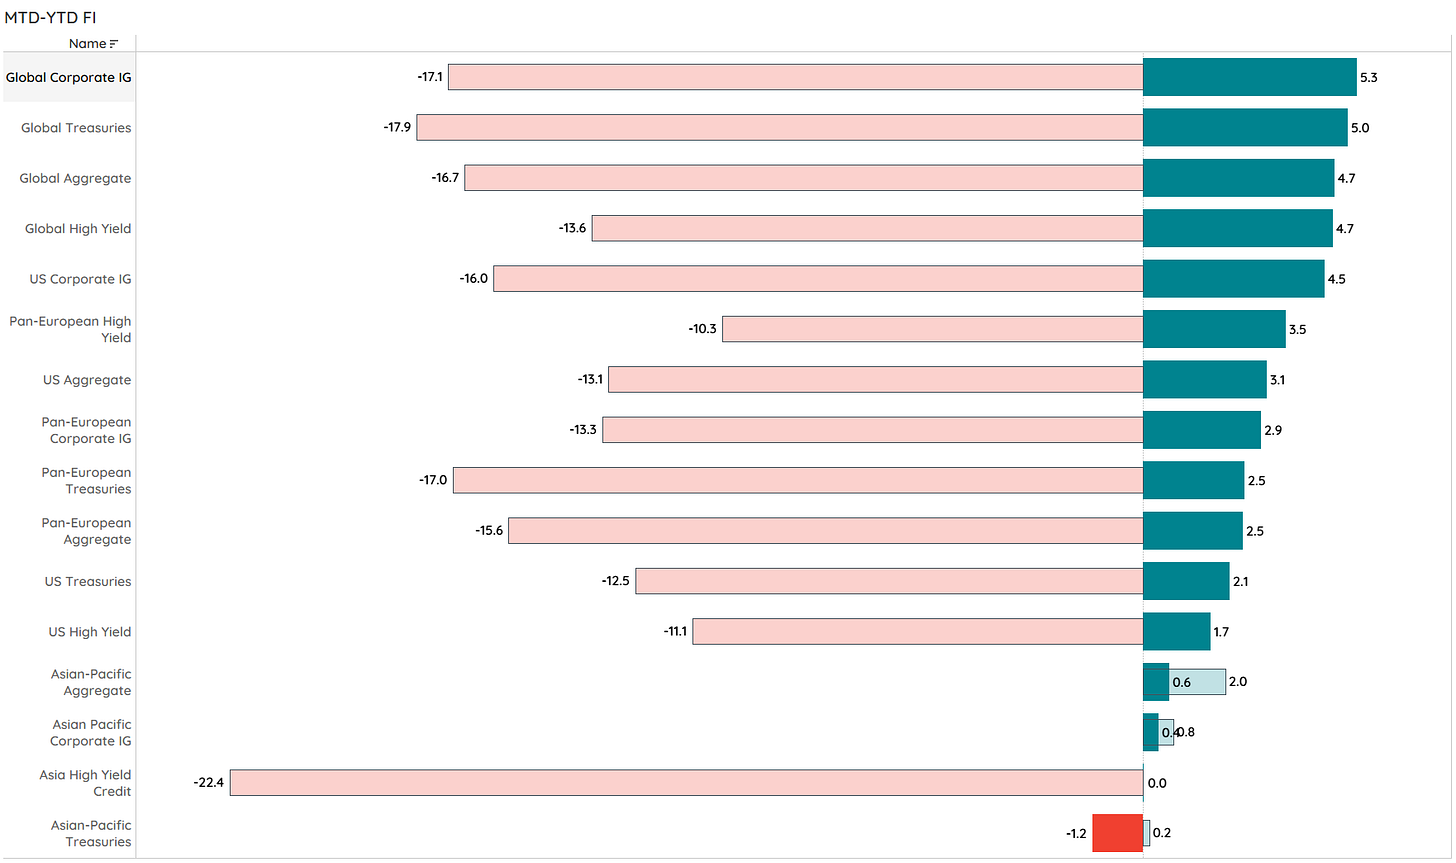
What do the monthly and YTD performance statistic look like then for major fixed-income benchmarks? Eh, voila:
Still nasty YTD, but an improvement is an improvement.
The monthly chart on the US10 year treasury suggest that there could be substantial more downside for yields (upside for prices) and we still would be comfortable in the new secular uptrend:
2023 the year of the yield?
In FX markets, the US Dollar got ‘hammered’ PP (Post-Powell):
Similar as for the S&P 500, the move yesterday has pushed the EUR/USD rate firmly above the 200-day moving average again and the higher highs, higher lows pattern is also confirmed:
Unfortunately I had some technical issues with the download of the monthly FX data, so let me use Bloomberg’s format for monthly and yearly performance data (separately):
Clearly, November has been the month of reversal for currencies too!
According to the monthly EUR/USD chart, this currency pair is at an interesting pivot junction (green dashed) right now:
Finally, wrapping up with commodities, let’s look at commodity ‘sector’ performance first:
Also a bit of a story of reversal here, where metals (industrial & precious) and softs had a good month, but remain negative year-to-date, whilst livestock, energy and grains gave back some of their gains this year.
For completeness purposes, here’s the performance table of some of the most important commodity futures:
As a more shorter-term observation, the weakness in the greenback yesterday, has pushed the price of Gold out of its consolidation pattern and our defined pole n’ flag formation is back in full swing, with a price target just below 1,900 for the yellow metal:
As “promised”, today’s letter was rather long, so let me cut off here now. However, I would invite you to leave your comments and/or suggestions in the comment section - a good place to continue the dialogue:
Have a great Thursday!
André
CHART OF THE DAY
Not only were yesterday’s market moves and today’s letter gargantuan, but also the BS that came out SBF’s mouth yesterday, during a panel hosted by the New York Times (what is this guy doing on a $2,500 panel and not in prison anyway??):
“I’ve had a bad month.”
and
“I didn't ever try to commit fraud on anyone”
Right. Below a picture of the major Bank that SBF and his cohort used to execute some of their shenanigans:
I kid you not.
Thanks for reading The Quotedian! Subscribe for free to receive new posts and support my work.
DISCLAIMER
Everything in this document is for educational purposes only (FEPO)
Nothing in this document should be considered investment advice
Past performance is hopefully no indication of future performance










Great piece today and ending on a picture of SBF's bank was so funny it made me cry out with laughter! Lol
And thanks for highlighting that Mr Powell is a qualified lawyer and not an economist(FFS how did he get the job in the first place?) No wonder the US economy is in such turmoil this year if the FED is run by a lawyer and not an economist? Go figure!
Hi all!
Have we already started the descent of the mountain? (inflation of course)
with all the ups and downs that may come later