

Golden Age
Vol VIII, Issue 6 | Powered by NPB Neue Privat Bank AG

“Money often costs too much.”
— Ralph Waldo Emerson
Enjoying The Quotedian but not yet signed up for The QuiCQ? What are you waiting for?!!

We all have seen the following “meme” over the past few months:

Doomberg, a little green chicken that writes an excellent newsletter on this very same platform (Substack) had an excellent article out last week, where he (it?) referred to a recent Podcast by the equally brilliant Grant Williams. Instead of devilishly plagiarizing the column, let me replicate it in full for you (emphasize mine):
During a recent appearance on the excellent Grant Williams Podcast, Simon Mikhailovich concluded with an illuminating story: Upon leaving the Metropolitan Museum of Art in New York with his granddaughter recently, he casually walked up to the array of hot dog vendors in front of the entrance, curious about the going rate. At $4 each, the price was much higher than the days of his youth, at least in nominal terms. With gold trading at approximately $2,700 an ounce, he made a mental note that one American Eagle would fetch about 675 hot dogs.
Mikhailovich has been tracking the price of New York hot dogs for many years, even finding pictures from other eras to flesh out the trend over time. In one picture found from 1906, hot dogs were three cents each, or two for a nickel. With the US dollar convertible to gold at a fixed price of $20.67, an ounce of gold would have bought 690 hot dogs.

In April of 2024, Jamie Kennedy, director of digital content for Golf Digest, posted a fascinating analysis of Tiger Woods’ historic 2000 season on the PGA Tour. Universally considered the greatest individual performance in golf history, the season garnered Woods $10.7 million in prize money for his accomplishments, an incredible sum for that period. According to Kennedy, those same results would have won him $92.3 million in 2024. The average price of gold in 2000 was approximately $270 per ounce. In 2024 it was closer to $2,400, also about nine times higher.
This, of course reminds us of J.P. Morgan’s testimony to the US congress in 1912:
“Gold is money. Everything else is credit.”
As Mikhailovich’s hot dog story and Woods’ prize bounty so vividly demonstrate, gold is the true center of the world’s financial universe and has been for thousands of years, no matter how unfashionable it might be to say so at any given time.
With that out of the way, let’s dive into our weekly deliberations about major asset classes, with, yes you guessed right, some focus on the Golds recent ascent too.
 | Video gifs by quotes | ebf0fe62 | 紗")

Equities and equity volatility are starting to show a certain weekly pattern since the inauguration of Mr. Trump as POTUS three weeks ago (has it really only been three weeks 😱 ??!!).
The pattern is for a sell-off in equities (pick up in Vola - VIX) on Friday afternoon, panic on Monday morning and then a recovery the rest of the week. Here’s the S&P 500 version of this conspiracy theory:
Here’s the VIX version of the very same:
Here’s another “anomaly” we have been observing over the past few weeks:

Yes, indeed, European stock are outperforming their US counterparts since the beginning of the year, even in currency adjusted terms (far right column above).
As a matter of fact, the outperformance has been going on since right after x-mas day and in currency adjusted terms even since early November (not shown), as witness on the ratio chart of the STOXX 600 Europe (SXXP) to S&P 500 (SPX) Index:
Why?
I think famed investor Howard Marks sums it up to perfection in a quote of his some years ago (and of which I was reminded by the none-less brilliant Vincent Deluard at StoneX):
"The most money is made when things go from terrible to just bad, rather than from good to excellent.”
— Howard Marks
The only question then remains is whether this is now a new, multi-year thing or just another tradable, but false start. Here’s the same SXXP/SPX chart as above, but longer term:
Finally, not all European stocks are treated equally … Here’s a comparison chart of the STOXX 600 (red) to the GS EU USA Exposure basket (grey), which is composed of companies based in Europe with high sales exposure to the United States and the UBS EU Trump Tariff Losers (blue):

Let’s look at some country charts now, starting with the almighty S&P 500:
The last daily all-time high was on January 23, but is less than two percentage points away from the current level. A new ATH soon remains our preferred scenario.
US small cap stocks as measured by the Russell 2000 continue to disappoint:
In Europe, as seen on the chart of the STOXX 600 Europe index and as discussed further up in this letter, stocks are really flying now:
The narrower EuroSTOXX 50 index is only 2% away from a new ATH:
Which doesn’t sound like a big achievement, given the 40-plus new ATHs we observed on the S&P 500 last year. However, for the SX5E this would be a first new ATH since … February 2000 (no typo!):
In Asia, we note that the Nikkei 225 is still moving frustratingly sideways:
Pssst, don’t tell anyone, but the Hang Seng Index in Hong Kong is up more than 15% in less than a month:

Finally, India’s BSE500 index continues in its intermediate-term downtrend:
Remember, you heard it first here: 30,000 remains the price objective for this cycle …
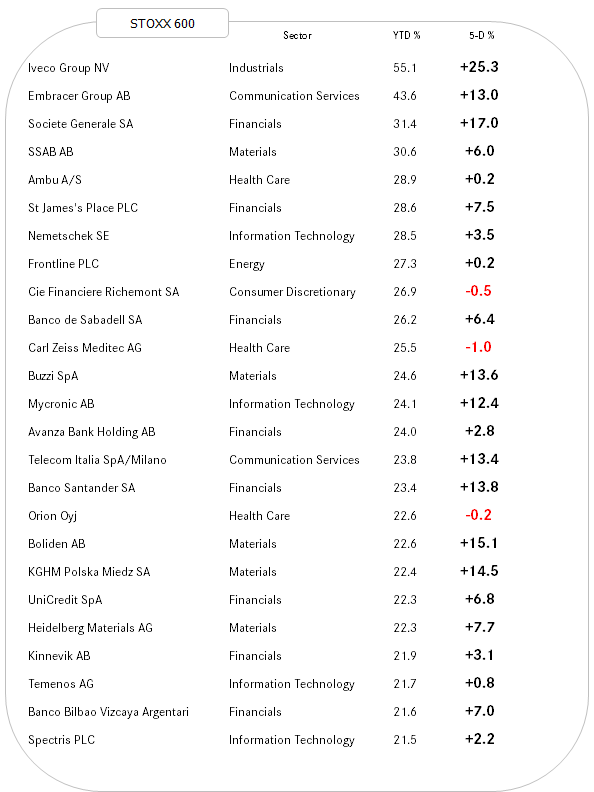
No finish off the equity section, here are the usual two tables showing the best performing 25 stocks in the US and in Europe since beginning of the year and how they have behave over the past five days. Here are the USA’s top 25 names:

And here is the European list:

Unfortunately, since starting working on this issue of the Quotedian on Saturday, I have come down with a nasty stomach bug, obliging me to curtail the rest of the letter somewhat.

In interest rate markets it has been relatively quiet the past few sessions.
The US 10-year yield has rebounded a tad over the past three sessions, but continues in short-term downtrend of an intermediate term uptrend:
European rates (proxied via Bund) have been under pressure since the last ECB rate cut:
The German general election in less than two weeks time will likely set a new trend for this asset.
One of the probably more important yield charts to look at is the one of JGB (Japanese Government Bonds). Whilst still at relatively low levels compared to US rates, the 10-year JGB hit 1.30 last week, which is a new 14-year high:
As Japan remains the largest holder of US treasuries and the spread between the countries interest rate shrinking, it is probably well worth while to be looking for any shifts in investors’ behaviour. Let’s check such behaviour in the currency section below.

As mentioned above, the diminishing spread between Japanese and US bond yields (red line) is putting upside pressure on the Yen (USDJPY - grey line):
No wonder then, that the JPY is the second best performing currencies versus the US Dollar so far this year:

Of Note: The BRL is only strongest after having a big rebound after a tremendous slump versus the greenback last year.

Coming back to Gold following the intro of this letter, here’s an additional attempt to explain the strength over the past months of the shiny metal:

The chart shows China’s total holdings of US Treasury securities (red) and the price of Gold (grey). I do not think that negative correlation is spurious … and I also do not think that the US clerk sitting somewhere in a sub-Washington broom closet had his best day when he switched of Russia’s access to their own USD-reserves…
Investors are waking more and more up to steep price rally underway:
Another commodity raising attention is European natural gas (red), especially in comparison to the price of US natural gas:
Surprised? You shouldn’t be.
In answering question to the media following the Supreme Eurasian Economic Council Meeting Vladimir Putin said the following (highlight mine):

Read the whole thing here if you feel like it (click here).
Time to hit the send button and pay the bathroom yet another visit.
André

Everything in this document is for educational purposes only (FEPO)
Nothing in this document should be considered investment advice
Investing real money can be costly; don’t do stupid shit
The views expressed in this document may differ from the views published by Neue Private Bank AG
Past performance is hopefully no indication of future performance