Goldilocks 2.0
Vol VII, Issue 28 | Powered by NPB Neue Privat Bank AG
"The older I get, the better I used to be”
— John McEnroe
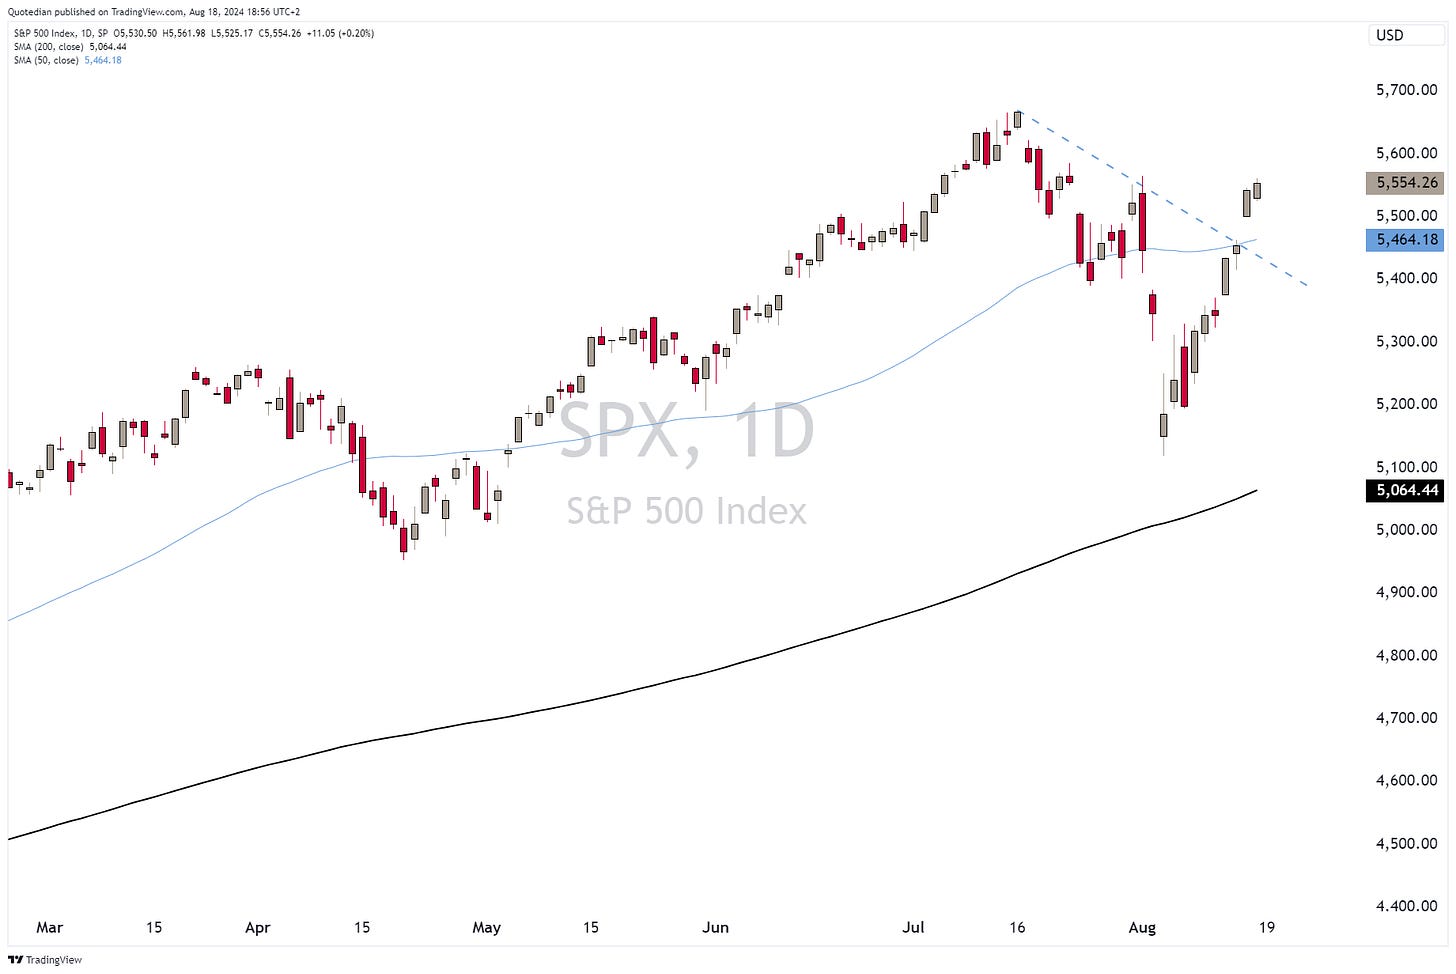
Soooo, what was that fuss all about a few weeks ago? After seven consecutive up candles on the S&P 500,
one starts to wonder whether the collective us, once again, missed to aggressively add equity risk to our portfolios during the “carry crash”. And not only are equity markets continuing to reclimb lost territory, economic data released gave it all the reason to do so.
This week we learnt that inflation is still cooling,
and economic growth is sound as shown by,
jobless claims falling,
strong restaurant bookings and air travel,
high hotel occupancy rates, and
accelerating bank credit growth.
At the same time, and as usual, the US consumer is alive and kicking as shown in the retail sales number pick-up:
And last, but definitely not least, corporate America is doing better than just well:
Given all of the above, it is somewhat better understandable why equity markets are in panic mode. UPSIDE panic mode that is!
As mentioned at the outset, the S&P 500 (and the Nasdaq 100 for that) had seven consecutive positive closes, including breaking of resistance, downward sloping trendlines, exceeding any feasible Fibonacci retracement level and showing several (bullish) breakaway gaps:
The only remaining ‘bastion’ for the bears is a hypothetical double-top forming in case the July 16th all-time high (ATH) is not exceeded. Though, admittedly, this seems highly unlikely with the cumulative advance-decline ratio (lower clip) already at new ATHs:
This, of course, is a sign of broad(er) participation in the rally, one of the main themes in our Q3 outlook (click this link for Global Asset Allocation and this link for the accompanying chartbook), and has resulted in the S&P 500 equal-weight index now being less than a percentage point away from reaching a new ATH:
The Nasdaq just filled the July 24th gap lower, which could act as a short-term resistance point, but I am assigning that a relatively low probability:
Probably one of the most punished market segments during the “carry crash” was semiconductors. The Philadelphia Semiconductor index was down nearly 30% top-to-bottom, but has now already recovered half thereof:
Talking of recoveries, here is how some of the most popular US stocks have performed since the market bottom on August 5th:
And then there is this … just before we head over to look at some European and Asian markets, please take note that the Dow Jones Industrial index (aka Papa Dow) closed at a weekly new all-time high!!!!!!!!!!!!!!!!!!!!!!!!!!!!!!!!!
Over in Europe, the broad STOXX 600 Europe index is also less than three percent away from reaching a new ATH:
A clear laggard continues to be France’s CAC 40, though the technical pictures is improving:
A move above the 50-day moving average (blue line) would be a further arrow in the quiver for the bulls …
Our overweight call on Swiss stocks (SMI below) is working again and we think recovering the last six percent to the previous ATH still this year is in the realm of possibilities:
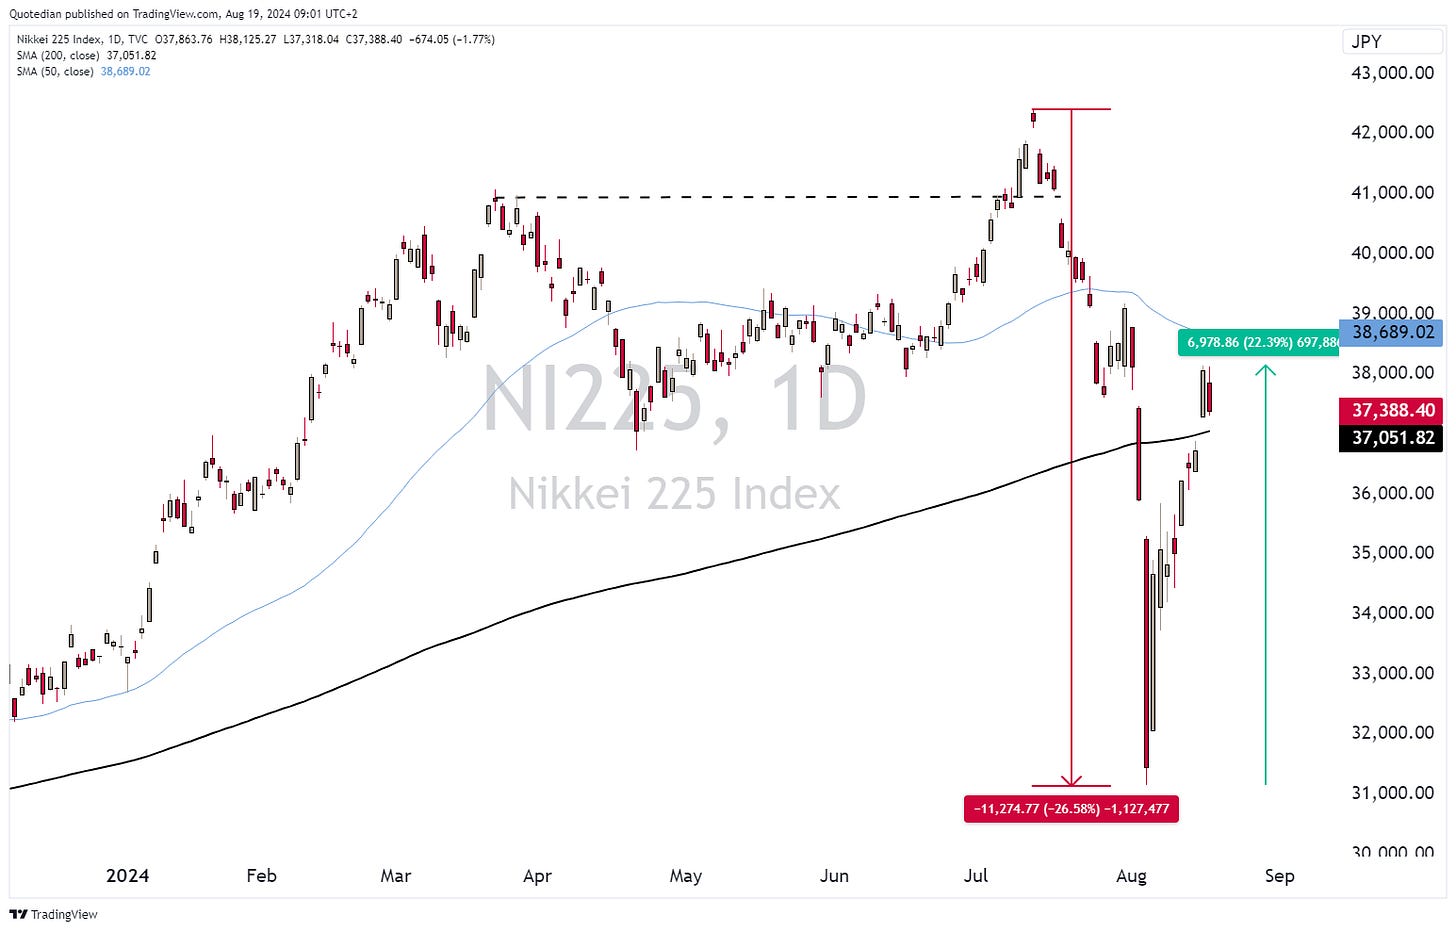
In Asia, the Nikkei’s death and resurrection continues to be simply stunning:
An important waypoint was conquered by the bulls over the past two session, as on Friday (16.8.) the market closed above its 200-day MA (black line) and today (19.8.) held above it.
Hong Kong stocks, via the Hang Send Index, are showing an improving technical picture:
Maybe some hunting ground for the not-faint-at-heart amongst some individual stocks?
India is recovering slowly but steadily from its massive five percent early August sell-off (and yes, I am being sarcastic):
As a matter of fact, the BSE 500 index never dropped below its 50-day moving average.
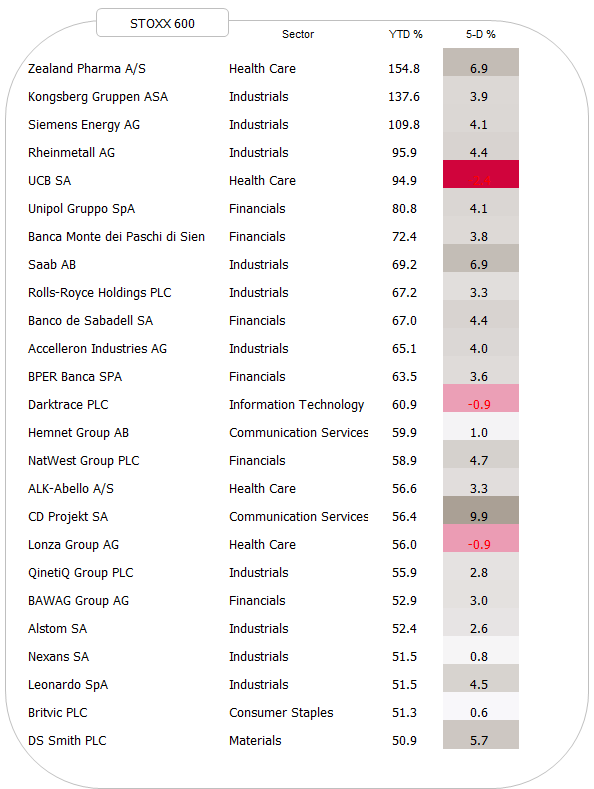
Let’s finish the equity section here with our usual look at the top performing stock on a year-to-date basis and how they have fared over last week.
Starting with the US:
With the exception of two stocks, all names have continued to add to their already hefty YTD gains. Ditto in Europe:
Strength begets strength, aka buy high, sell higher …
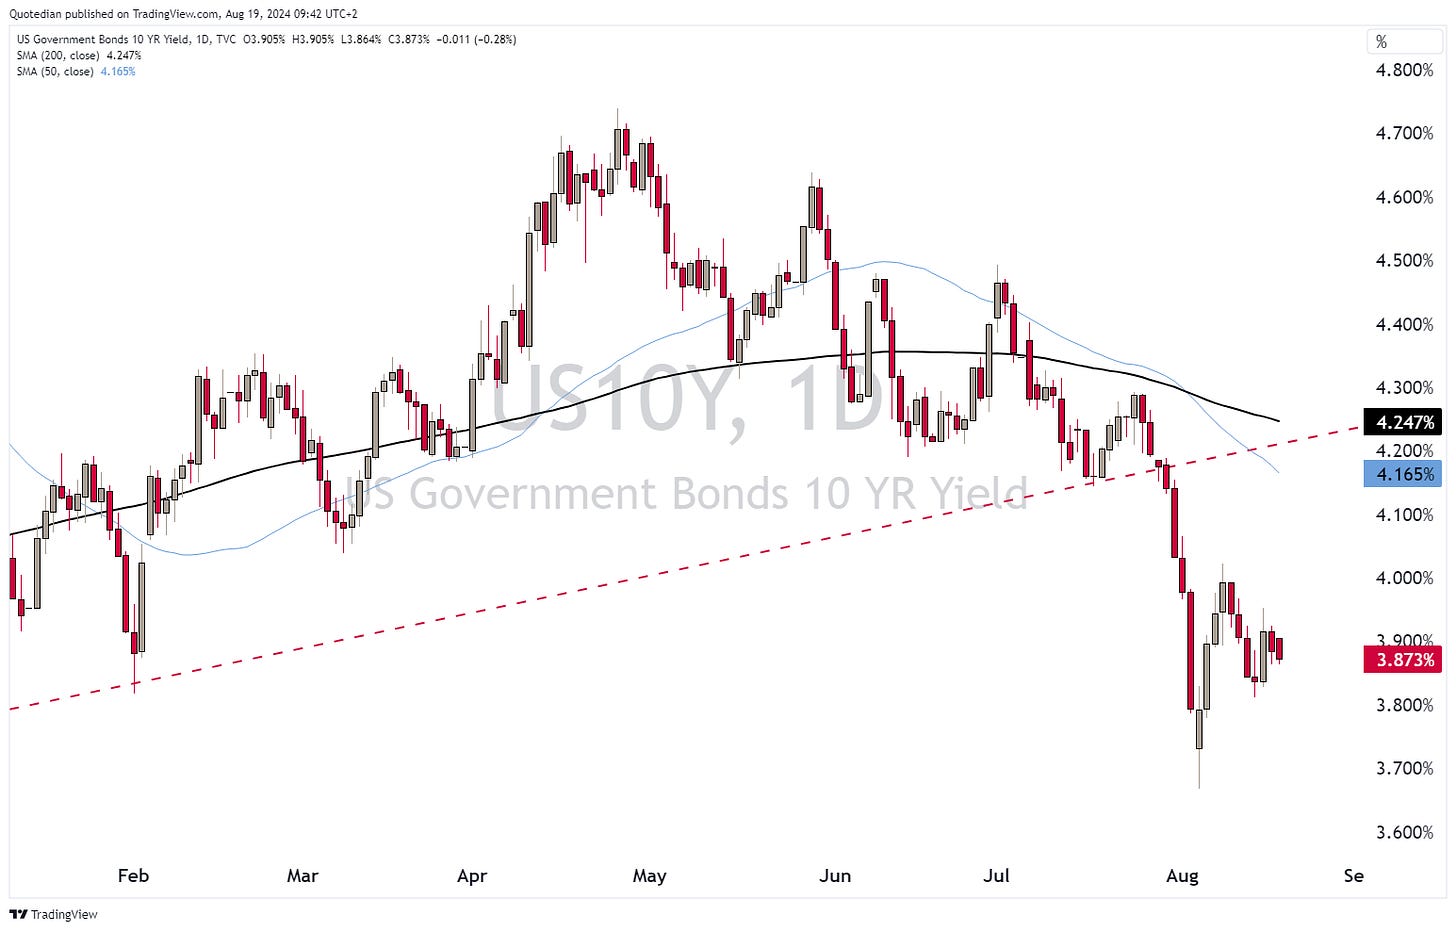
On the fixed income/rate side of things, the US10-year yield seems to have looked itself into a 3.80%-4.00% trading range:
As we are heading into the central bankers’ (paid) retreat at Jackson Hole this week, I would not take a major bet in either direction, but rather stay put and observe. In comparison to other years, there is little excitement expected from that gathering, which makes it all the more dangerous that an unfortunate comment gets misinterpreted and starts a market mayhem.
Let’s have a quick look at some bond markets (in price terms) via some popular ETFs, starting with the iShares Treasury Bond ETF (TLT) as representative of (US) treasury bonds:
As I noted last week, $100 (black dotted) needs to be surpassed to give bonds the next lift to $110 where the long-term downtrend line (blue dashed) comes in.
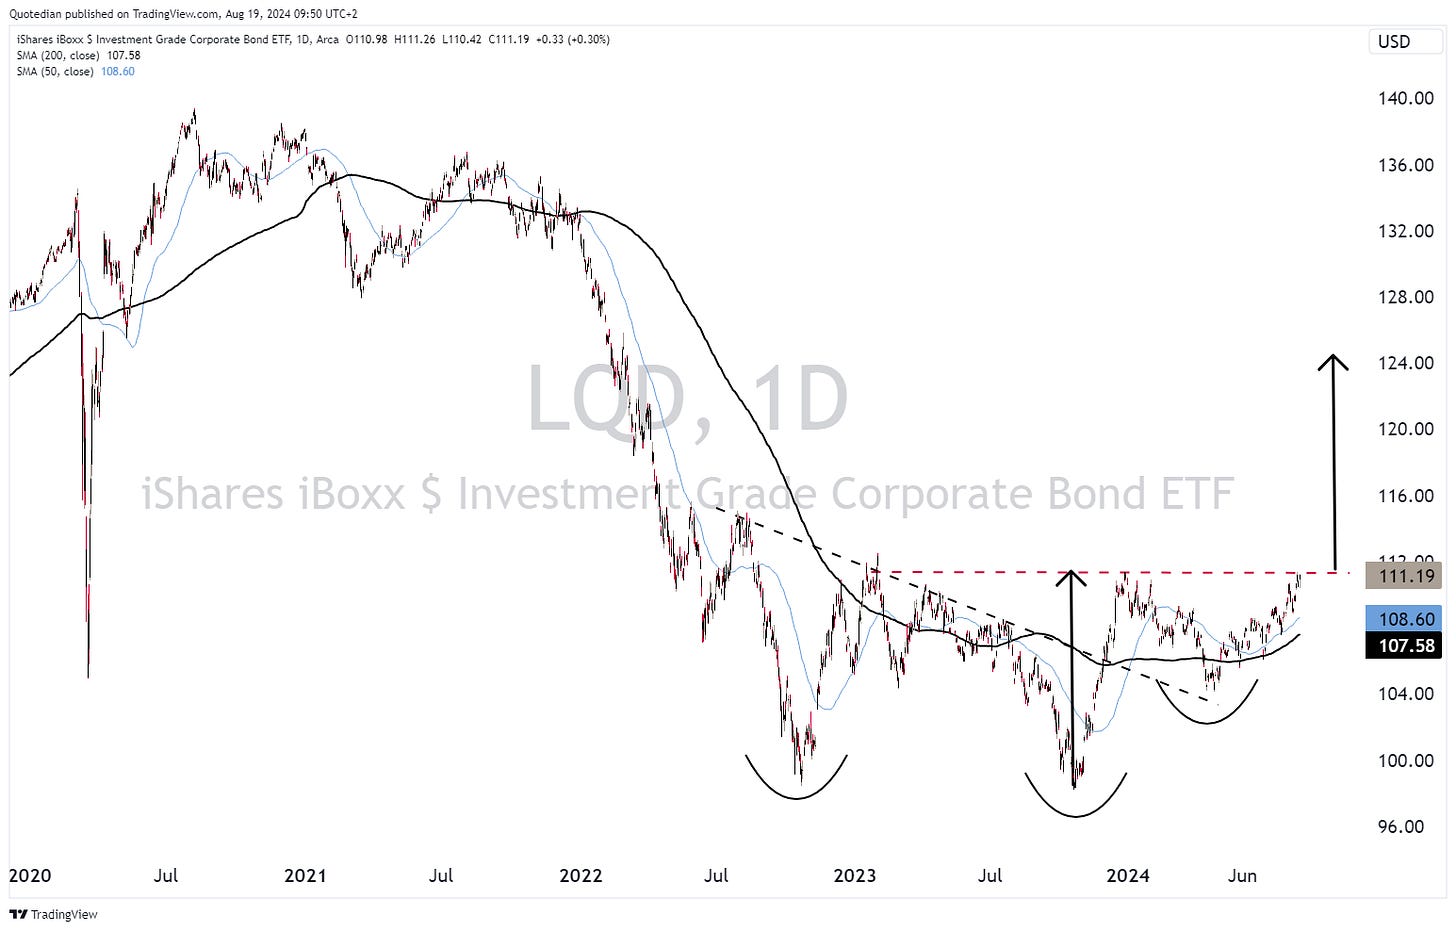
Not unsimilar does the iShares iBoxx Investment Grade Bond ETF (LQD) rest just below an important resistance point (red dashed). A break thereof could even be considered the break of the neckline of an inverted shoulder-head-shoulder pattern (arcs), with a price target some 10-12% higher (black arrows):
This seems like a very likely scenario, given interest rates not messing up the credit risk rally, as the iShares iBoxx High Yield Corporate Bond ETF (HYG) has already broken higher:
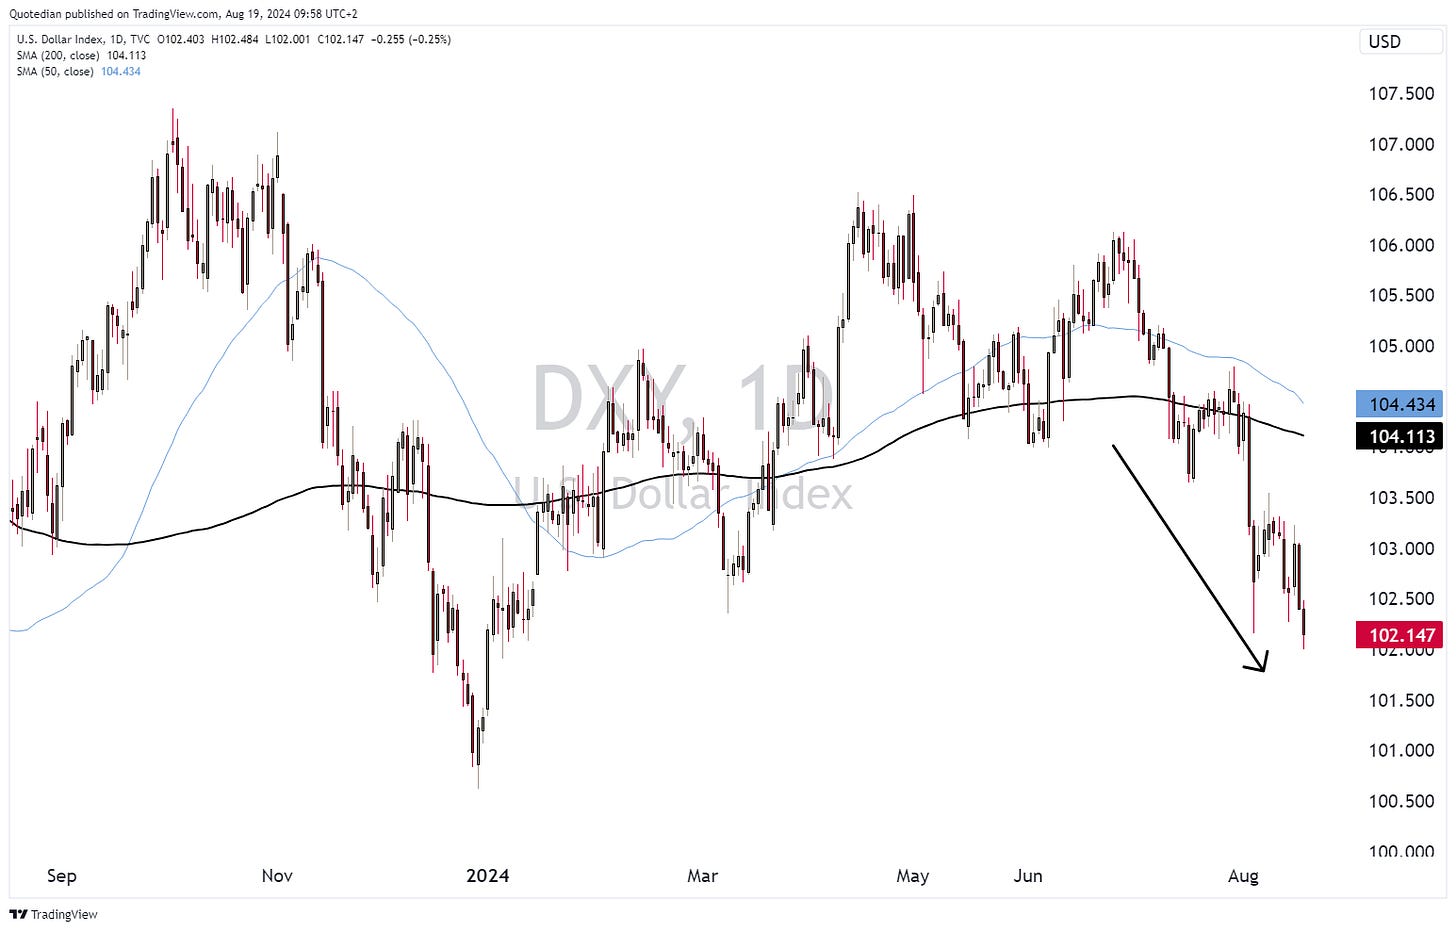
In forex markets, the US Dollar continues to soften (to avoid the expression breaking down), which is good news (for now) for risky assets. Here’s the Dollar Index (DXY):
As I think I mentioned over the past two weeks, the absence of the US Dollar rising sharply during the equity market turmoil was a very positive sign for the larger risk picture. If investors rush into the greenback during a risk-off period, it is normally a sign of bigger trouble ahead…
Translating the current weakness of the US currency onto the EUR/USD chart, we see that the currency pair has now clearly broken out of its year-old wedge formation:
Next points of resistance are just around 1.11 and then 1.1250ish.
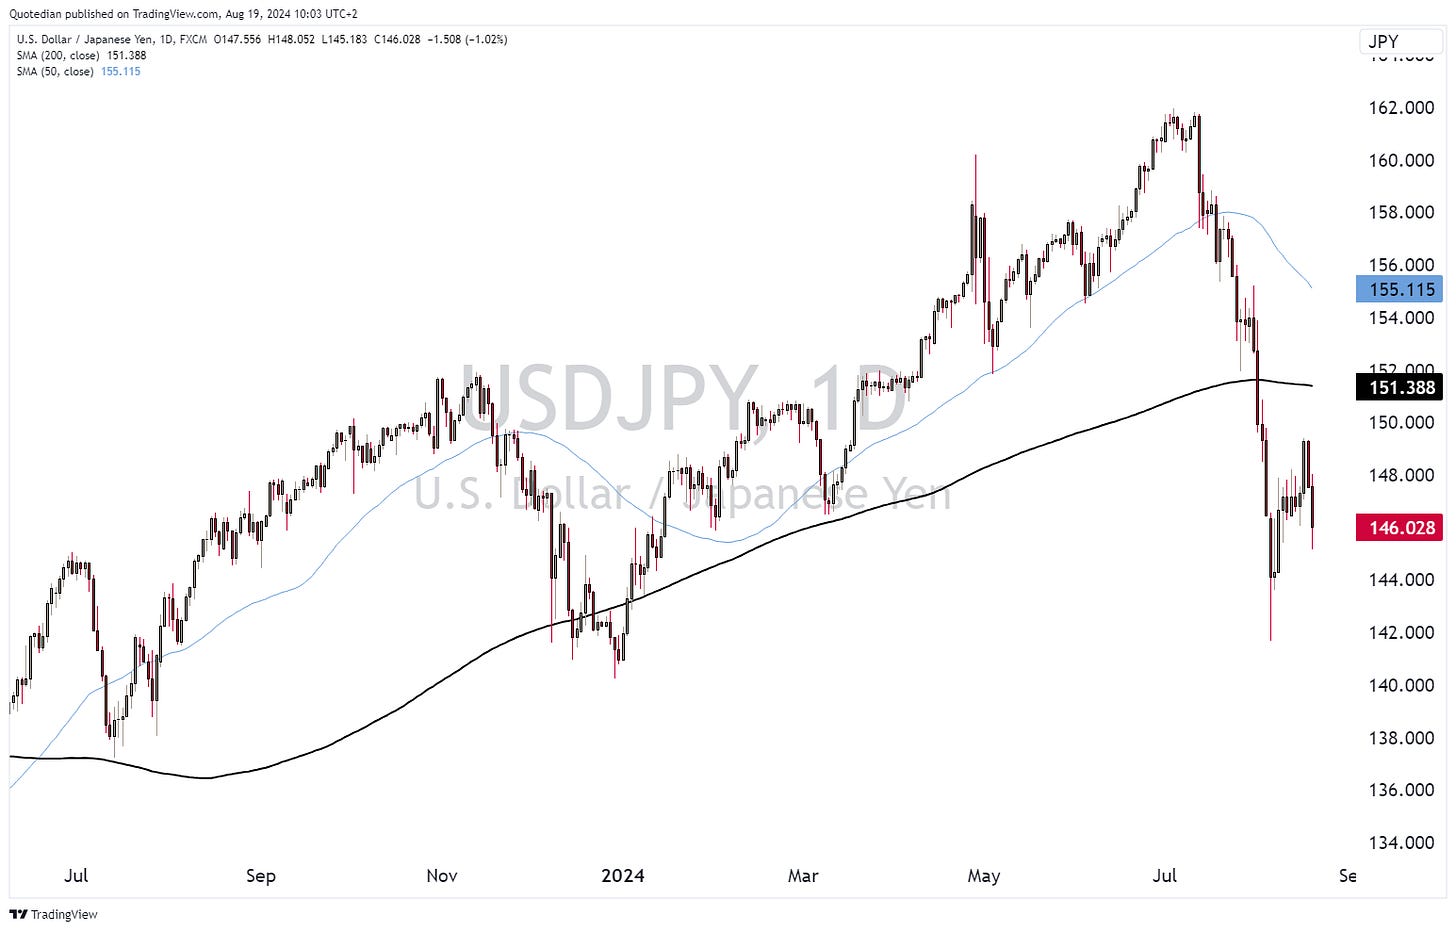
The USD/JPY may have started its downward trajectory again too, which needs to be closely followed:
The Nikkei already showed some nervousness about that this morning (19.8.), expressed via 1.6% “drop”. But cross-checking with the EUR/JPY rate (not shown), we note that it is not all just Yen strength, but also USD weakness, which is a small “de-warning” sign… for now …
Another little raised finger comes from Gold, which is once again trading at a new all-time high with a price above $2,500:
Let me highlight the ongoing Gold strength via a Renko chart:
You can find an explanation of a Renko Chart by clicking here, but basically it is drawn without a fixed time series (e.g. daily, weekly, etc) on the x-axis and hence, focuses on price trend. Fascinating, no?
Missed Gold?
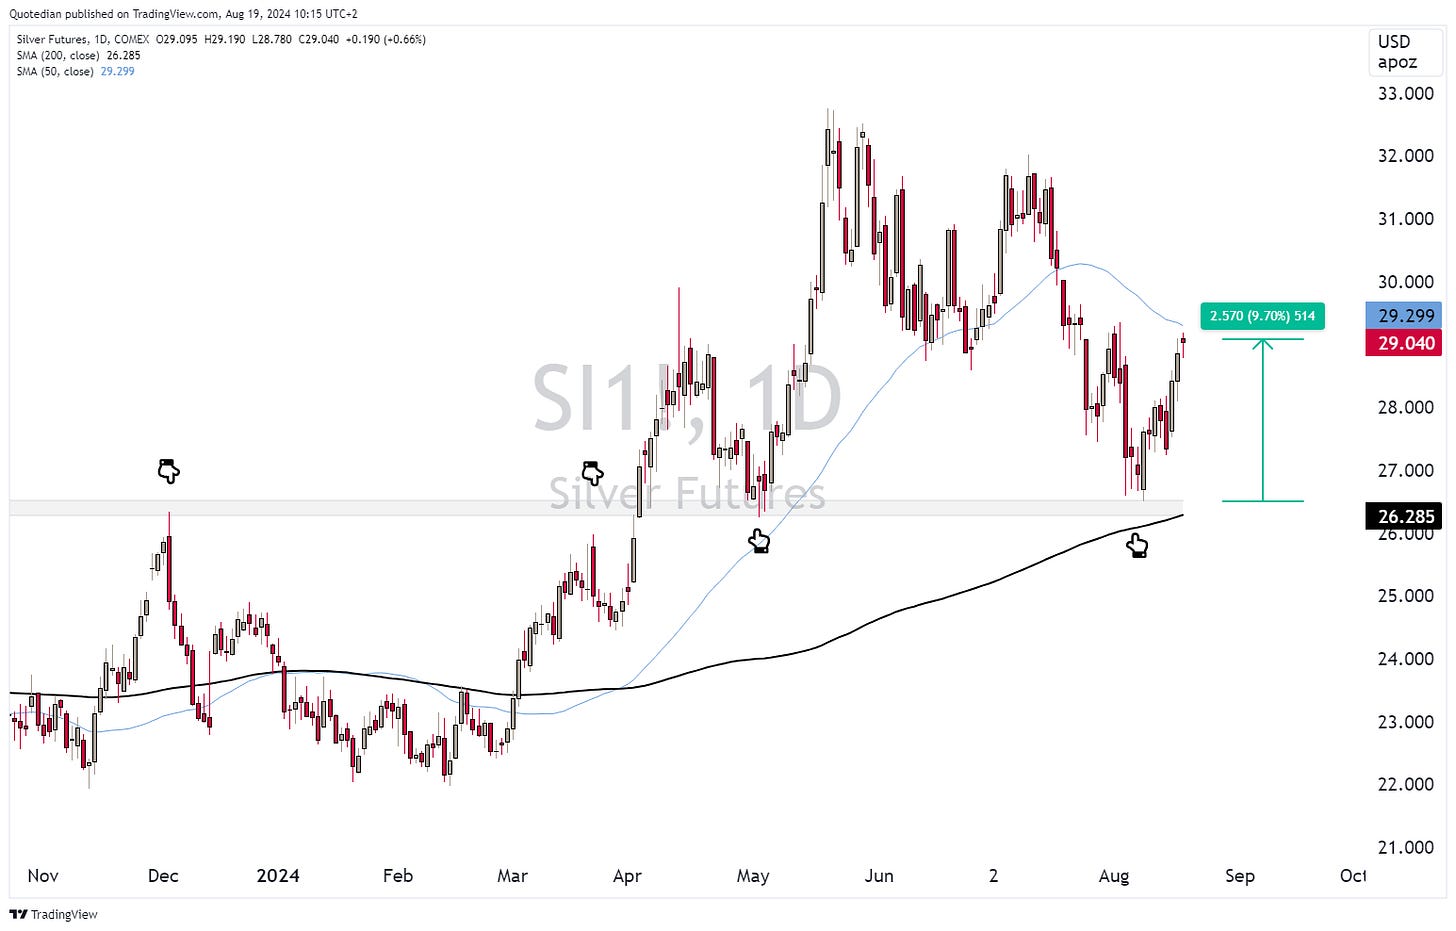
That Silver catch-up play we recommended on 9.8. (click here) is coming along nicely and probably has still more upside:
Or, we give does bloody gold miners one more chance, believing that the current nth breakout is the real one:
OR:
Looking for a better way to invest into the gold miner rally than via an ETF? We have the solution!
Contact us at info@npb-bank.ch
Finally, oil is drifting lower again, given back most of the “Iran will retaliate” rally in absence of such:
A couple of charts here, all of them under the subtitle:
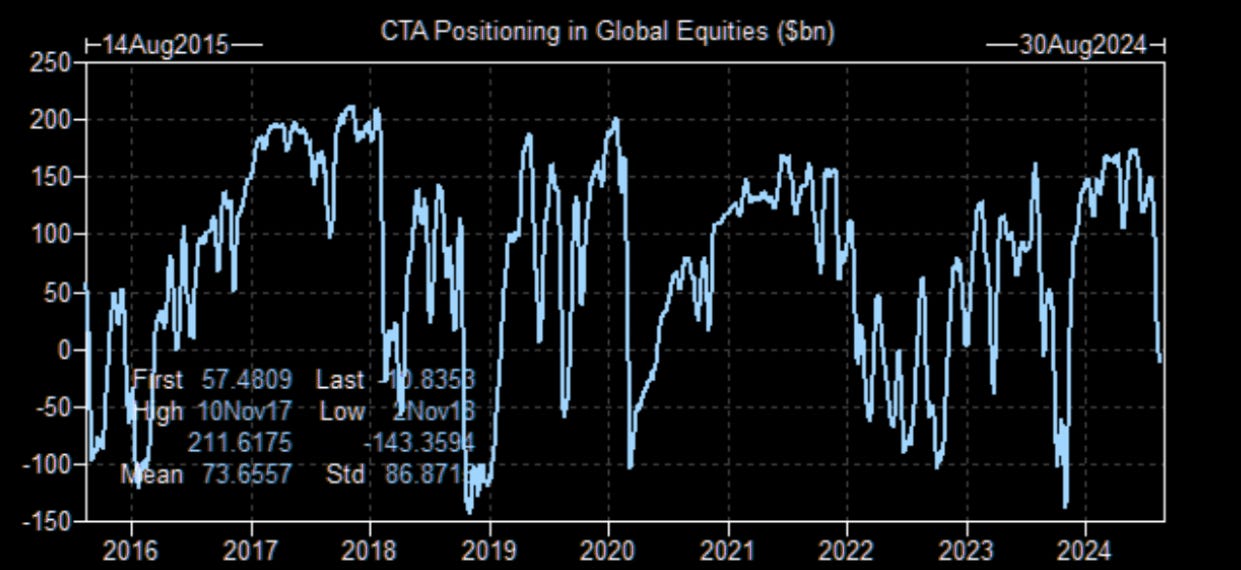
After the “carry crash” sell-off systemic-traders (computers) long-positioning is lagging the market rebound:
Net leverage is relatively low (33%-tile) on a 12-month view:
CTAs have been forced out of positions during the sell-off, which according to GS could provoke an additional £60bn+ of CTA systemic demand over the coming 5 days:
And this is in addition the corporate buybacks we highlighted last week.
Everything in this document is for educational purposes only (FEPO)
Nothing in this document should be considered investment advice
Investing real money can be costly; don’t do stupid shit
The views expressed in this document may differ from the views published by Neue Private Bank AG
Past performance is hopefully no indication of future performance


