

Half Full or Half Empty?
The Quotedian - Vol VII, Issue 7 | Powered by NPB Neue Privat Bank AG


“The pessimist complains about the wind; the optimist expects it to change; the realist adjusts the sails.”
— William Arthur Ward


A very inconvenient, feverish cold coupled with a chronically overloaded “To Do”-list has kept me from posting early this week. But, as they say, never let a good crisis go to waist, hence we are now half-way into February, which allows us to review what has been going on so far this month and to put it in context of year-to-date movements.
Let’s dive right in …
Think the S&P 500 is high at 5,000? Remember it was at 500 thirty years ago. And at 50 thirty years before that. Be an optimist, invest with optimism.

Contact us at ahuwiler@npb-bank.ch
Today’s theme of half full, half empty comes on the back of the constant “complaints” I hear from investors about how narrow the current rally is, how it is only the Mag 7 (or 6 or 5) stocks pulling everything up, how horrible breadth is, etc. etc. etc., nag nag nag, whine whine whine …
Well, perhaps all of this is true, and we will check on that in today’s letter, but let’s put our optimist’s rosy glasses on and see where opportunities could lay…


So, the Mag 7 (grey) are pulling the S&P 500 (red) up all by itself? Let’s see that on a YTD basis:

Yes, ok, the Mag 7 add about 1.5% to the 5% YTD performance of the S&P 500.
Over a 1-year lookback period, that must look even more impressive, no?

Indeed.
This then should also be reflected when comparing the S&P 500 ‘normal’ market-cap weighted index to its equal-weighted version. Here’s that comparison since the market bottom in October of 2022:

Again, indeed!
So, here’s my (optimist) point now … do you want to bet that the entire upmove over the past 16 months or so was only due to the Mag 7 and is about to correct all the way down again?
OR
Could it be that the remaining 493 stocks have a tremendous catch-up potential over the coming months?
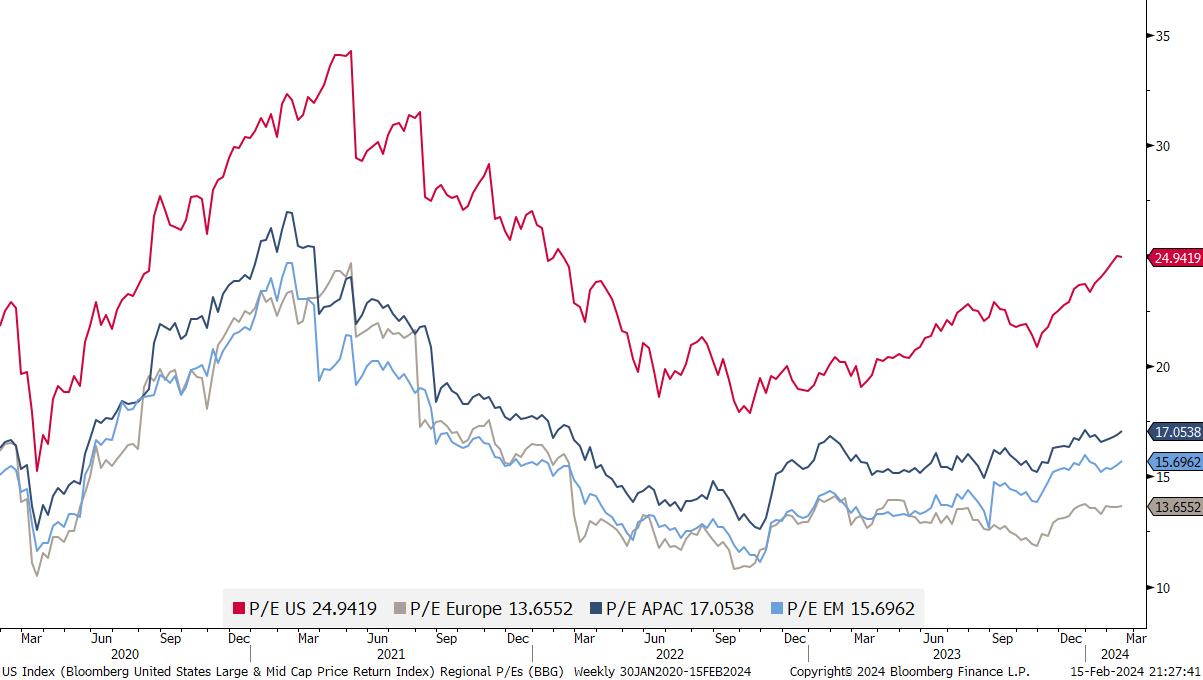
After all, reverse-engineering the ‘only Mag 7’ argument, we note that the valuation of the overall market ex-Mag 7 (grey line) is only every so slightly above the historic norm:

And if we consider that in terms of international market valuations …
Last Tuesday, after the CPI print in the US was a tad less lower than expected, equity bears had their day in the sun, but with about half an hour to go on Thursday’s trading session as I type this, it seems to have been “a one day wonder”:

Friday morning update: The S&P 500 did indeed close at a new ATH for the 11th time this year last night, and remarkably so, without the help of the mega large-cap tech stocks:

Markets may crash tomorrow, but I struggle to get bearish here, looking at the tape behavior. Take today’s session as an example. Just two days after that fore-mentioned nasty CPI sell-off, today 80 stocks of the S&P are hitting a new 52-week high. Guess, how many stocks hit a new 52-week low during the same session. Correct. Zero.

For European stocks (SXXP), we get a similar, albeit less pronounced picture:

But contrary to SPX, the SXXP has already reached a new ATH today:

As I said, difficult to see that glass half empty here …

And, taking the risk of making my point ad nauseum, even small cap stocks, which saw a 4%+ drop on Tuesday, have fully recovered that drop and the some:

Staying with the small cap theme for a moment, the Russell 2000 Industrial index is reaching new ATHs one after another:

This indicates an growing economy, not a shrinking one, IMHO.
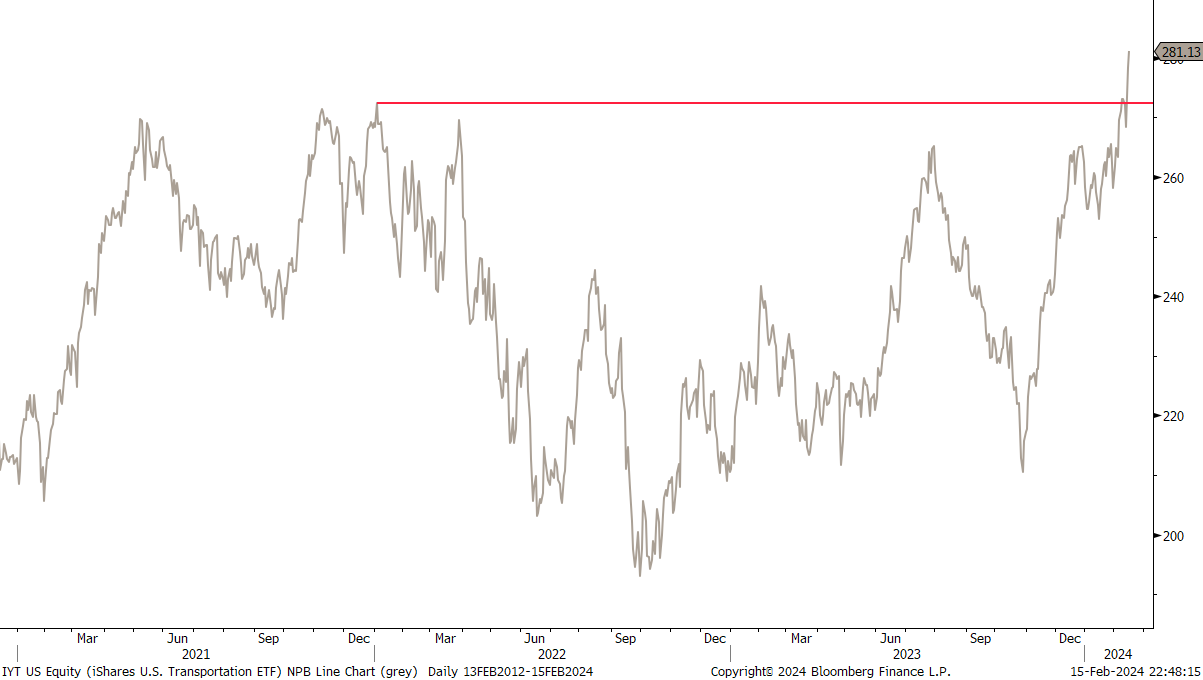
Or, ditto for the overall US transportation index, hereby proxied by the IYT ETF, which just reached a new ATH after a 2-year pause:
And did we already talk about the NYSE Composite, which has more than 2000 members, including all common stock listed on the New York Stock Exchange, including ADRs, REITs, tracking stocks, and foreign listings, for combined market cap of >$34 Trillion, just brought out to a new ATH?

I shall torture you no more.
Or hardly anymore.
One last comment.
If even me, as an equity Uber-Bull since over six months now is disappointed about the foreseen mid-February to mid-March seasonal weakness not arriving, imagine how those Uber-Bears, or even just the “i-ll-wait-and-see” and the “on-the-next-dip-I’ll-buy” crowds feels:

I rest my equity case, may the markets crash now.


On the interest rate risk side of things in the fixed income asset class my confidence about the immediate future path is a tad … much reduced … a lot less … close to zero.

The recent spike in yields after Tuesday’s CPI, yesterday temporarily completely unwound, has shown the vulnarability of (leveraged) companies to interest rates (see Russell 2000 4% sell-off):

But the truth is that yields have not gone anywhere for well over a year now (slight exacerbation, but still…):

And this “impasse” on rates is very fertile ground for equity gains, which are mainly allergic to rapid changes up or down in yields.
One clear result from this week’s CPI print, even if equities have already shrugged it off again, is the expectation of FOMC rate cuts for this year, which was further strongly reduced:

On the credit risk side of fixed income matters, there are still no signs of increasing stress, quite to the contrary as spreads are continuing to contract and we should take that as another market positive, without reading much more into it.


Over in FX-Land, the US Dollar had also a few days in the sun after Tuesday’s inflation print and as the market reduced its expectations for rate cuts, however, for now, the Dixy index (DXY) has been rejected at the donward-sloping trendline (circle):

Talk of the town has also been the Yen this week, wich softened back above 150 versus the greenback after Japan was officially declared in recession (did you see what the Nikkei 225 thinks of that?), only to be pushed below that level again as rumours about BoJ/MoF currency market interventions started getting more frequent:

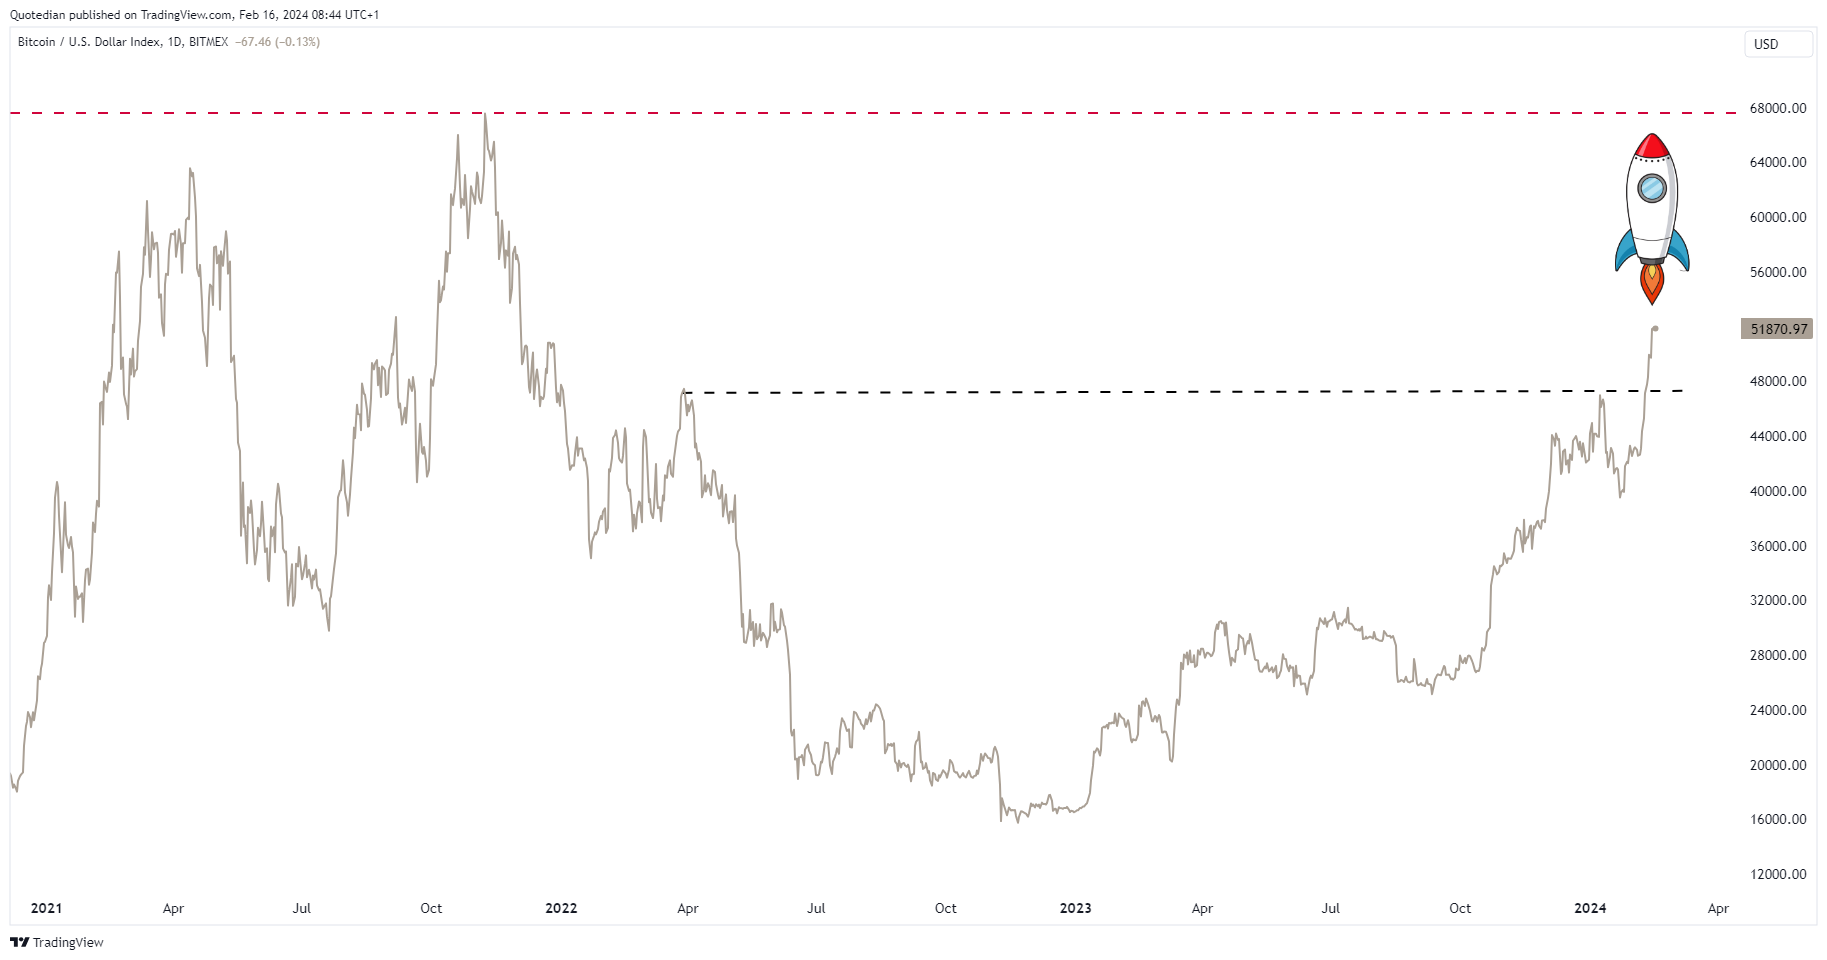
And then in other news, a fine, new currency, not attached to any specific government (or so we hope), took out an important resistance level and is looking like it is marching towards new ATH…
Of course, we’re talking Bitcoin:

In the commodity complex, Gold got pushed below the $2,000-handle after the CPI number pushed real rates higher, but has managed to reclaim that level again over the past two session:
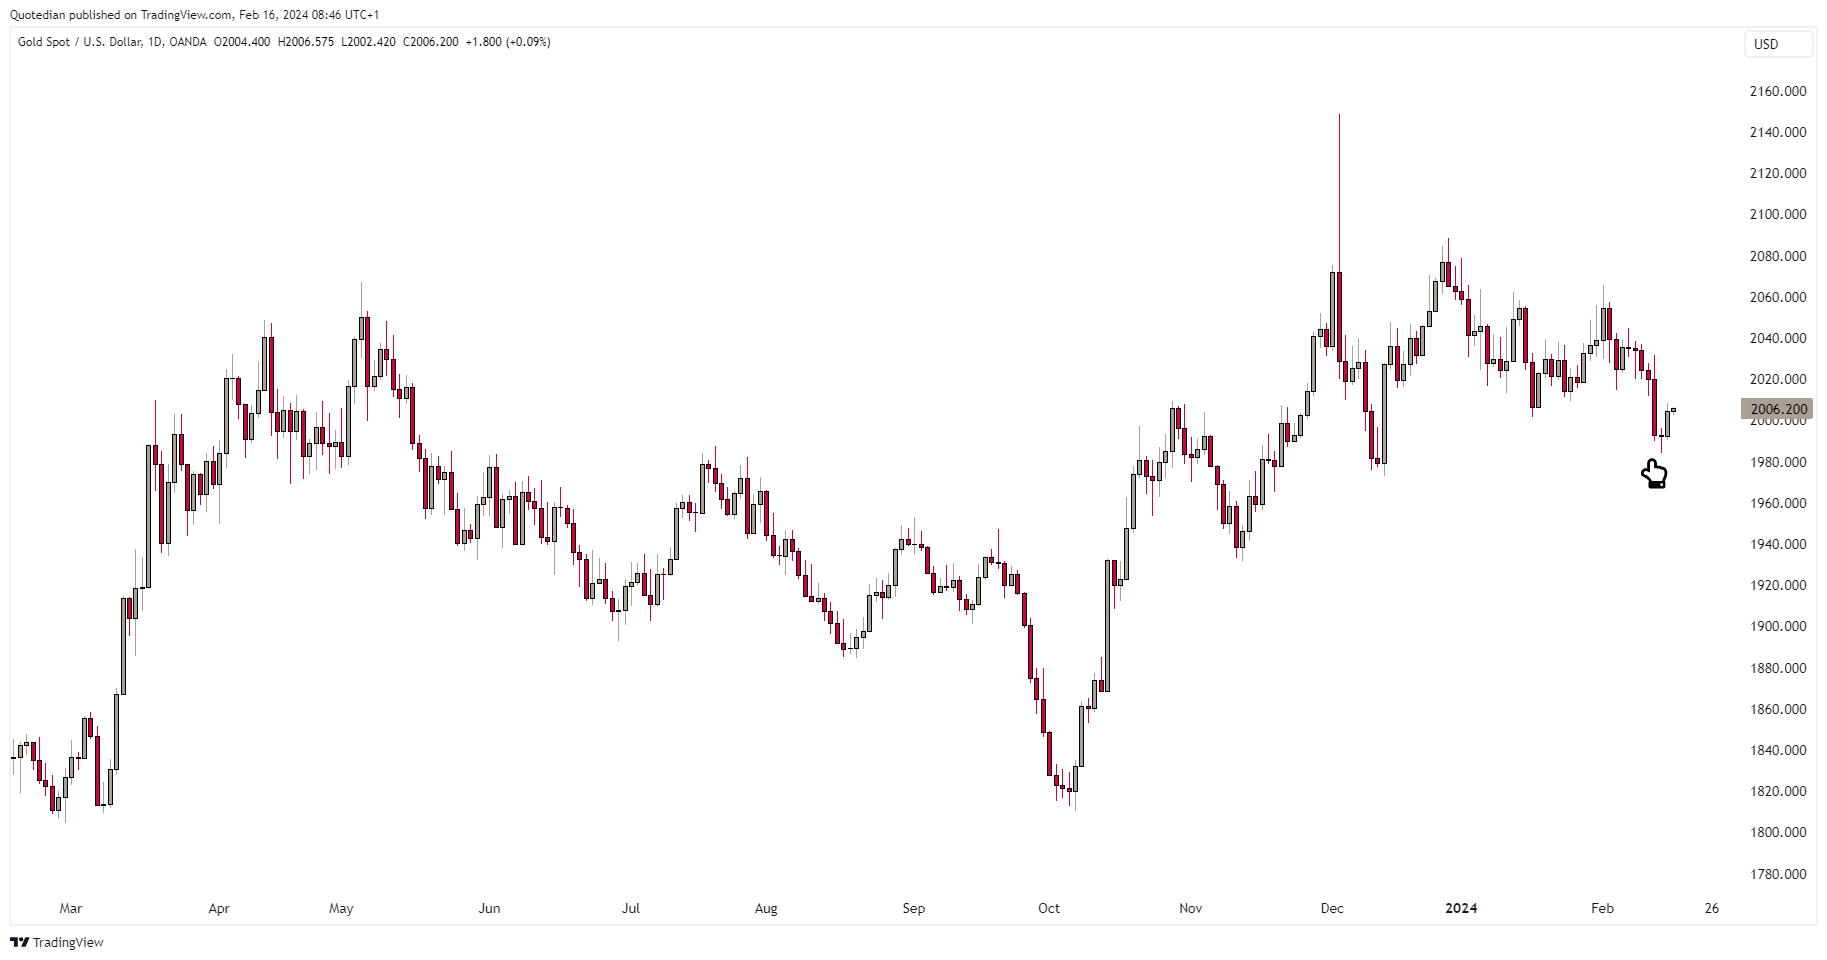
To me the chart above looks as clear as mud, but if you’d twisted my arm for an opinion, I’d guess a bit more work on the downside to be done.
One commodity that has been creeping higher is crude oil, with Brent prices (see below) about to break above a new multi-month resistance:

And then there is natural gas:

Zooming out would confirm that these are levels one should consider direct (Nat Gas futures) or indirect (UNG ETF, Gas E&P stocks, others) exposure, or, we will have buy a bigger screen to be able to draw a further drop in on the chart:

Well, this is all for this week then, but I will not let you go before sharing my personal conclusion on the glass half full, half empty question:

In that sense, TGIF and cheers!
André

Everything in this document is for educational purposes only (FEPO)
Nothing in this document should be considered investment advice
The views expressed in this document may differ from the views published by Neue Private Bank AG
Past performance is hopefully no indication of future performance
How hard is it to be a gold investor? Harder than the metal itself?