Hawk & Dove
Volume V, Issue 186
“I know you think you understand what you thought I said but I'm not sure you realize that what you heard is not what I meant”
— Alan Greenspan
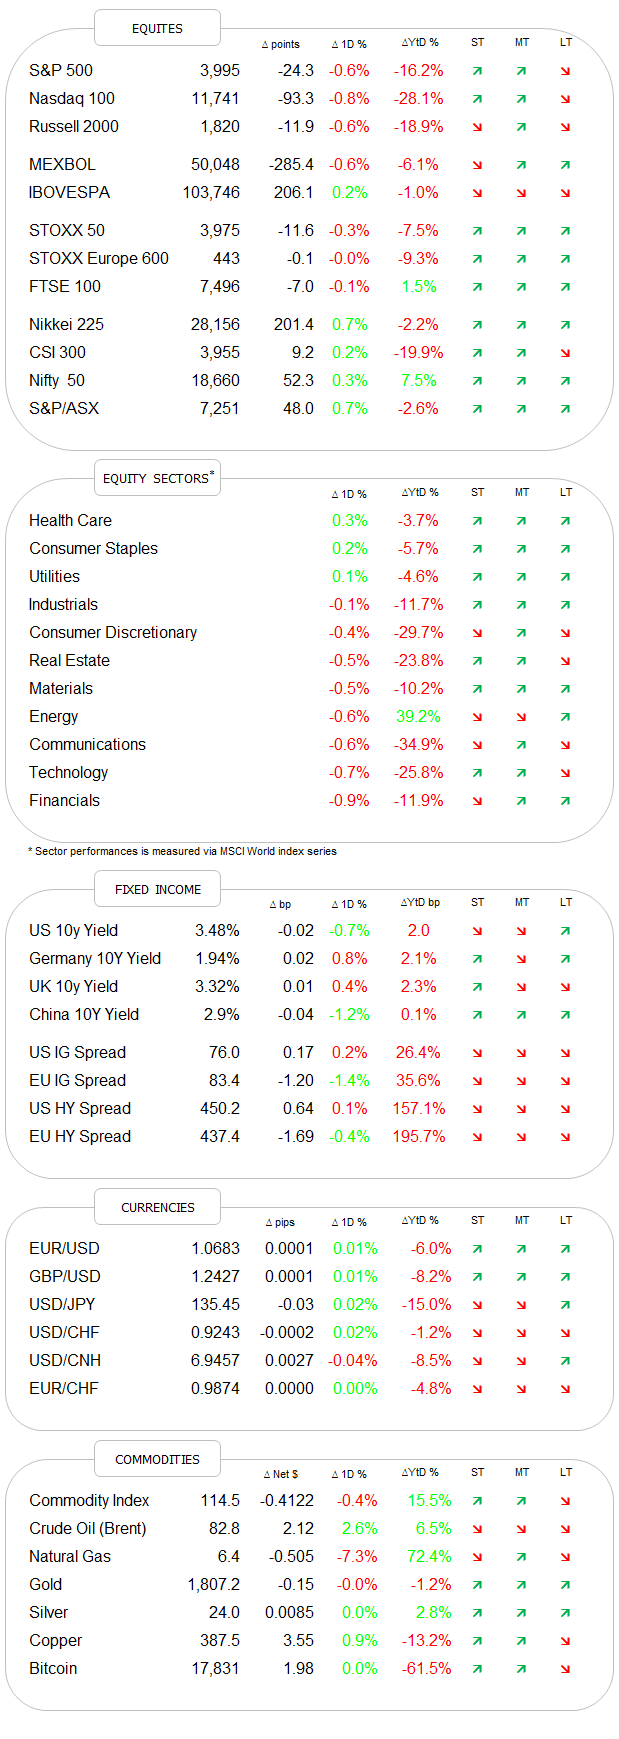
DASHBOARD
AGENDA
CROSS-ASSET DELIBERATIONS
So, we’ve got CPI and FOMC fed fund decisions out of the way and the market has resolved by … going nowhere!
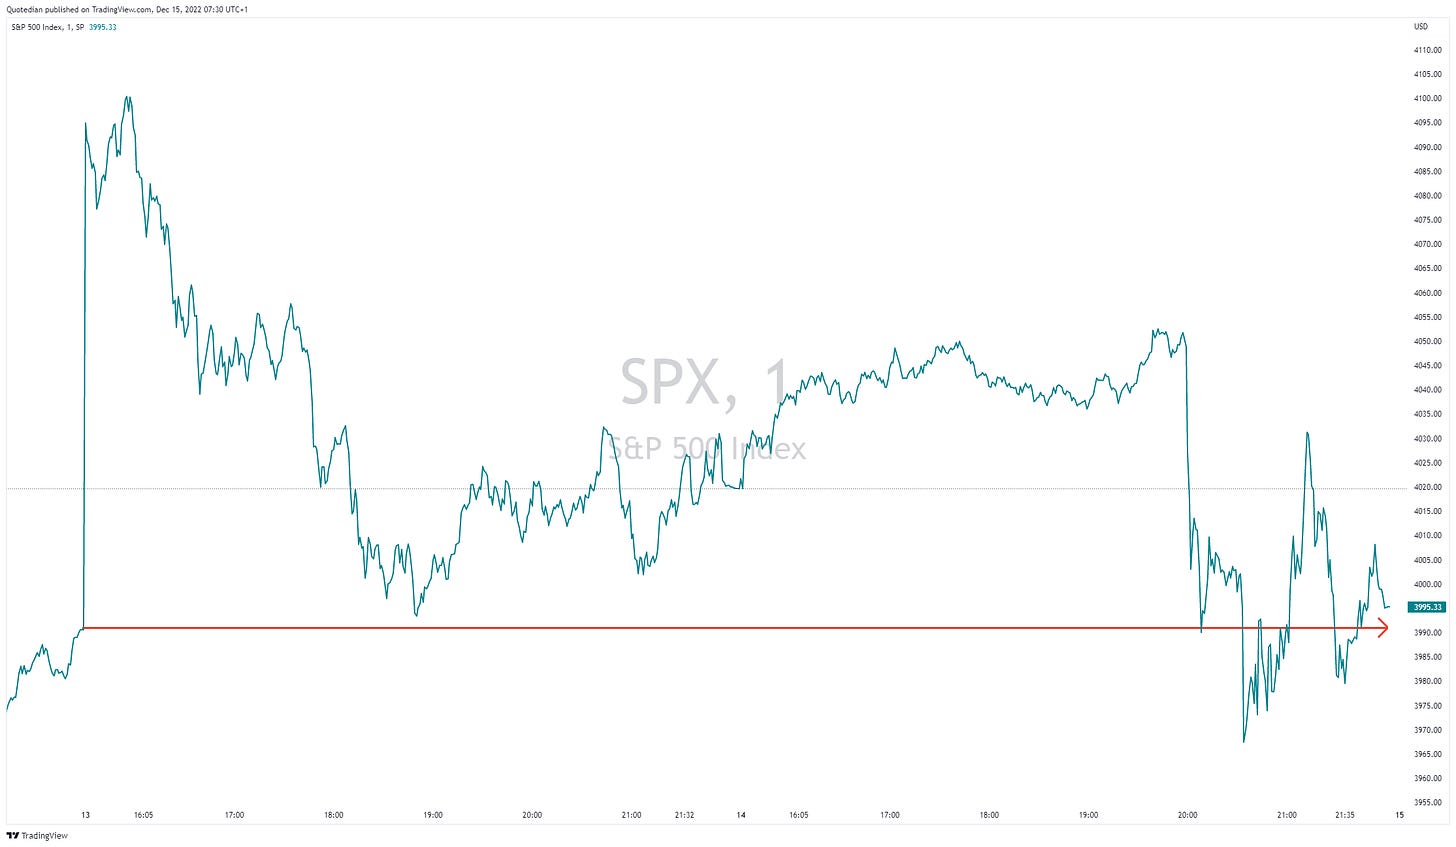
The market (S&P 500) is quite precisely where we left it at last Friday’s close:
However, arguably the move has been on the rates side. Here’s the path of the 10-year Treasury yield since Friday:
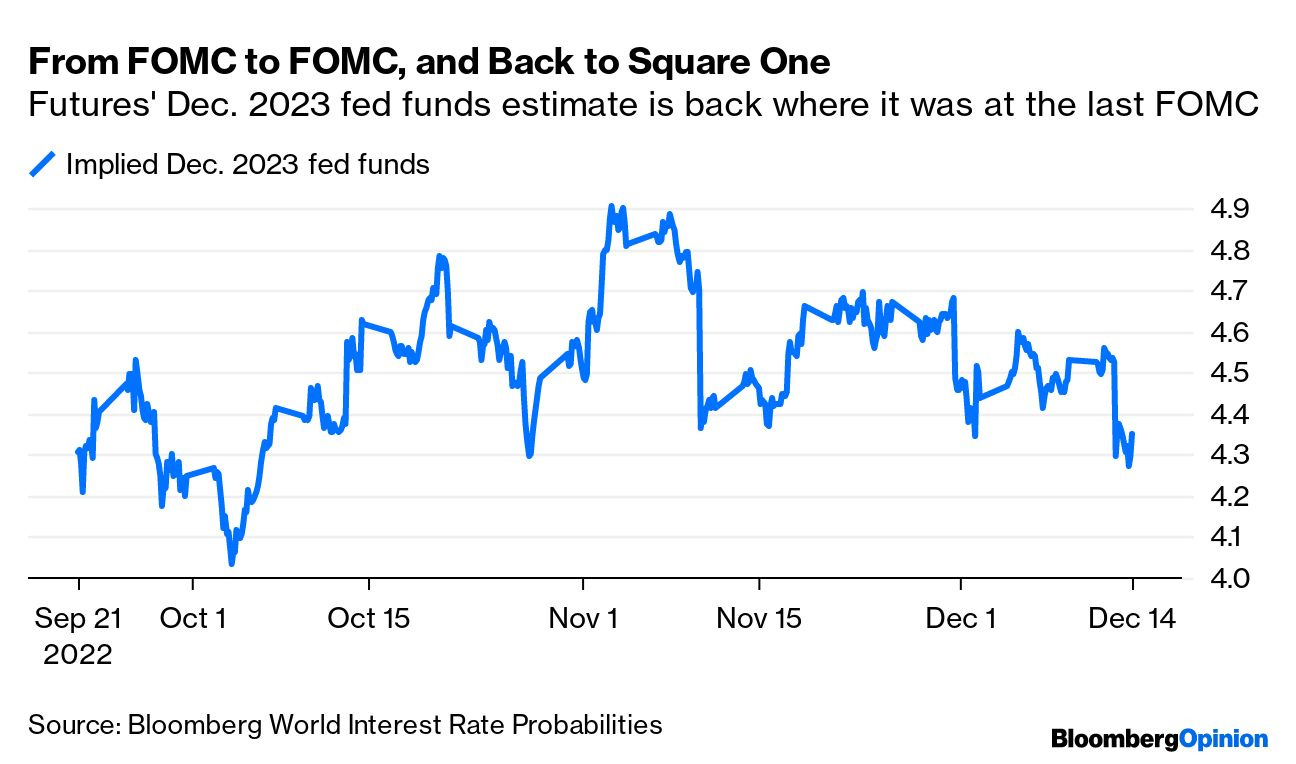
Of course, observing the 10-year yield may be the wrong direction to look, as its longer-term nature will also take next year’s assumed recession into account. But even Fed Fund rates derived from short-term (futures) rates, are back to square one, despite all the hawkish guidance given by Powell & Co.
And again, all the more surprising giving the major shift in the Dot Plot from the previous meeting. The thick, red line on the chart below is the 5% mark. The dots to the left represent the Fed Fund rate forecast for the end of 2023 by the different FOMC members back in September - the ones to the right their forecast yesterday:
From none seeing the ‘terminal’ rate above 5%, only two see it below now.
In conclusion, the Fed is playing Mr Tough guy and the bond market is calling its bluff. Interesting times ahead!
But back to yesterday’s equity session for a moment … where stock traders were as confused as they normally are during recent FOMC meetings. Here’s a great chart:
The winners-to-losers ratio was about one-to-three and only one sector (Health Care) managed to barely close in the green:
Let’s look at the two extremes of the performance scala for a moment.
Starting with Health Care, if we measure the sector via the SPDR Health Care ETF (XLV), we are about two percent from a new all-time high (ATH):
Its financial equivalent, XLF, would need a 20% up move to achieve the same feat and currently is rather heading lower from a seemingly important pivot point we had looked at in the past:
The level of $30-$31 could be a possible target if the downside dynamic continues to feed on itself:
The decisively less constructive Invesco KBW Bank ETF would suggest that this could be a possibility:
Anyway, in today’s equity trading so far, Asian markets are down across the board, with the cross-regional benchmark down about one percent as I type. Index futures in Europe and the US are also trading in the red about an hour before cash markets open.
We already discussed the yield weakness in fixed-income markets at the outset of today’s Quotedian. In terms of price action, here some updated charts of popular ETFs.
The iShares 20+ Year Treasury Bond ETF continues to look constructive, but got a bit stuck at the ~$110 level:
Similarly, the junk bond-focused iShares iBoxx High Yield Corp Bond ETF is looking bid, but seems to have run into overhead resistance at the 200-day moving average (blue line):
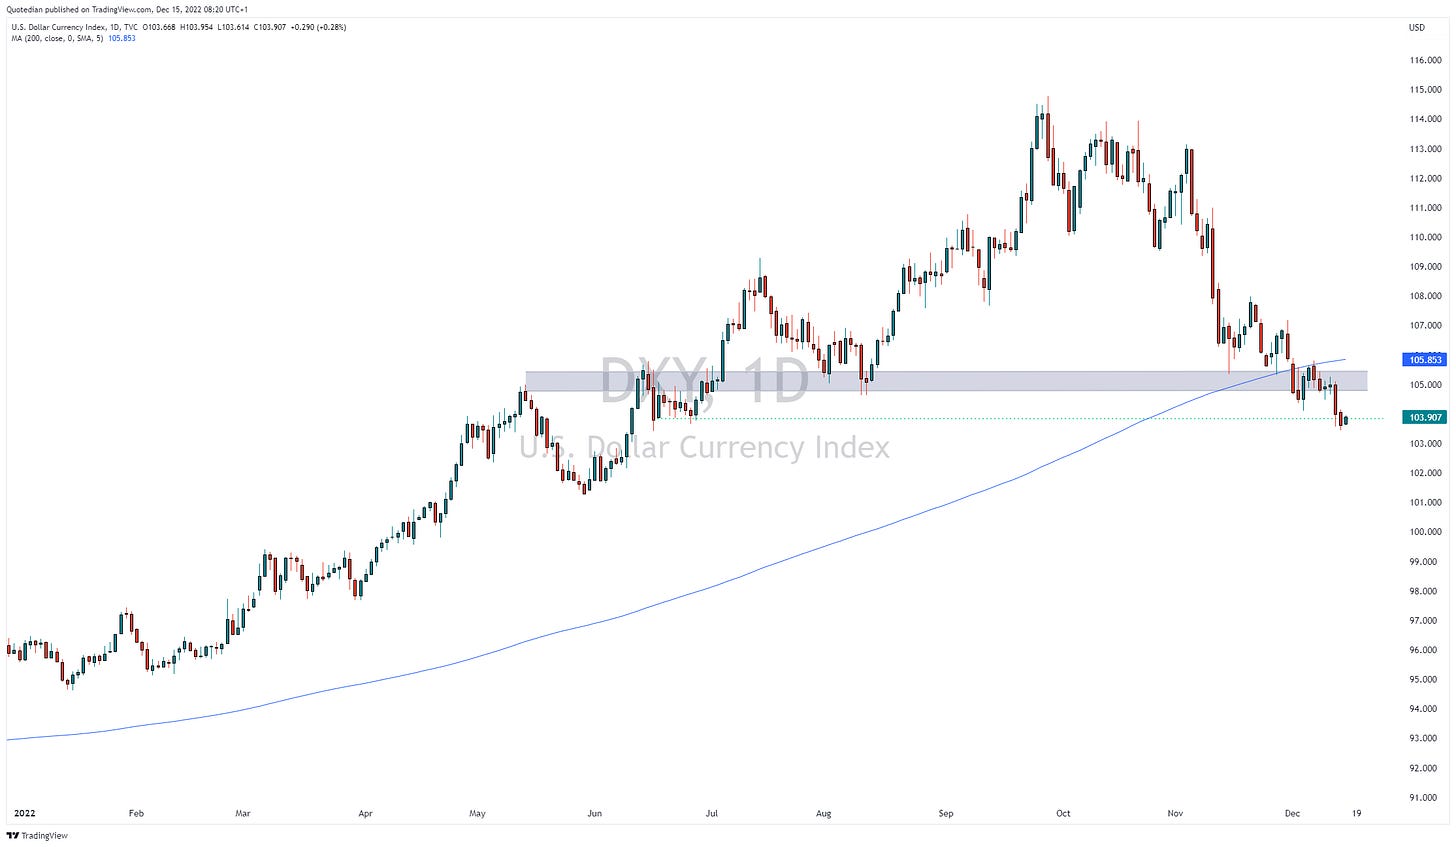
Similar to the bond market, the currency market is also calling the Fed ‘bluff’ by negating to push the greenback higher, despite the hawkish rhetoric. Here’s the Dollar index:
But of course, does a currency not live in isolation, and is always measured against another currency and here we may not forget that the Bank of England, the European Central Bank, the Swiss National Bank and Norges Bank are all expected to hike by 50 basis points today and may sound similarly or even more hawkish as the Fed yesterday.
Here’s the updated chart of the EUR/USD - next stop 1.0790:
Time to hit the SEND button.
If all goes well, there will be NO Quotediant tomorrow, but your favourite daily cross-asset newsletter wil be back over the weekend with a lengthy update!
CHART OF THE DAY
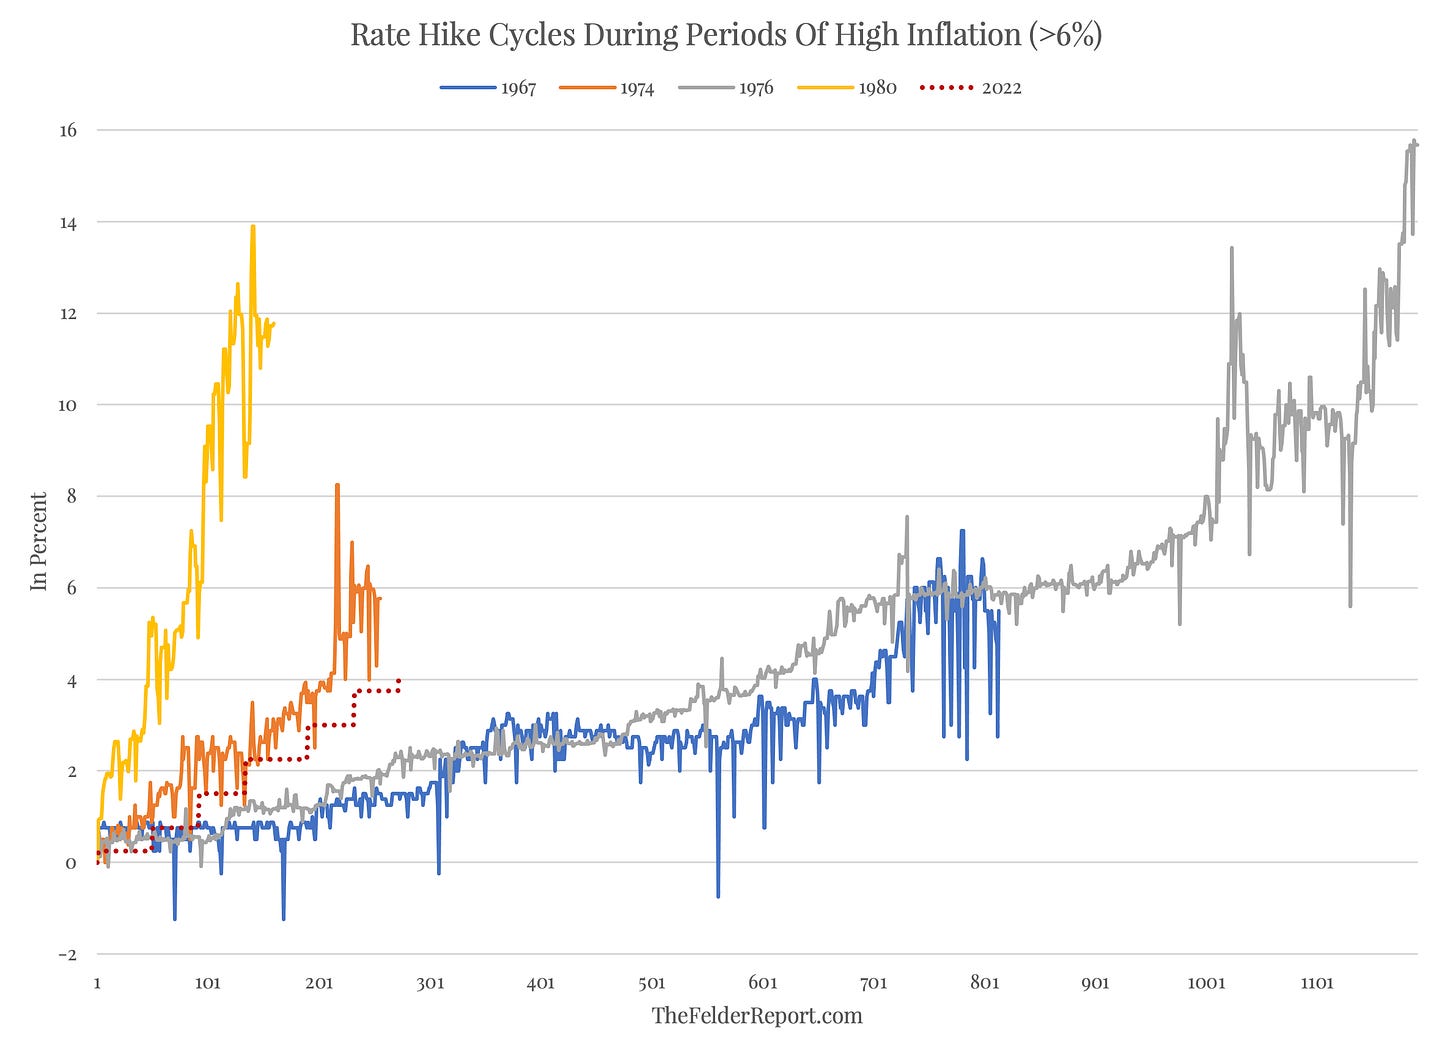
The Fed came, saw and hiked. And the market interprets that as a dovish hike, as it is 50 bp only (compared to the 75 bp on previous occasions). But the rhetoric remained rightfully hawkish. Why rightfully? Well, consider the following two charts:
The top chart shows the Fed hiking cycling during previous periods of high inflation (>6%). Neither is the current Fed the fastest hiker nor the most insistent (so far). This is confirmed by the second chart above, which shows that even after all the hiking done and inflation on a (transitory?) retreat, real rates (Fed Funds Rate minus CPI) remain firmly negative.
Stay tuned …
Thanks for reading The Quotedian! Subscribe for free to receive new posts and support my work.
DISCLAIMER
Everything in this document is for educational purposes only (FEPO)
Nothing in this document should be considered investment advice
Past performance is hopefully no indication of future performance


