IF ... THEN ... ELSE
The Quotedian - Vol V, Issue 145
“Just about every time you go against panic, you will be right if you can stick it out.”
— Jim Rogers
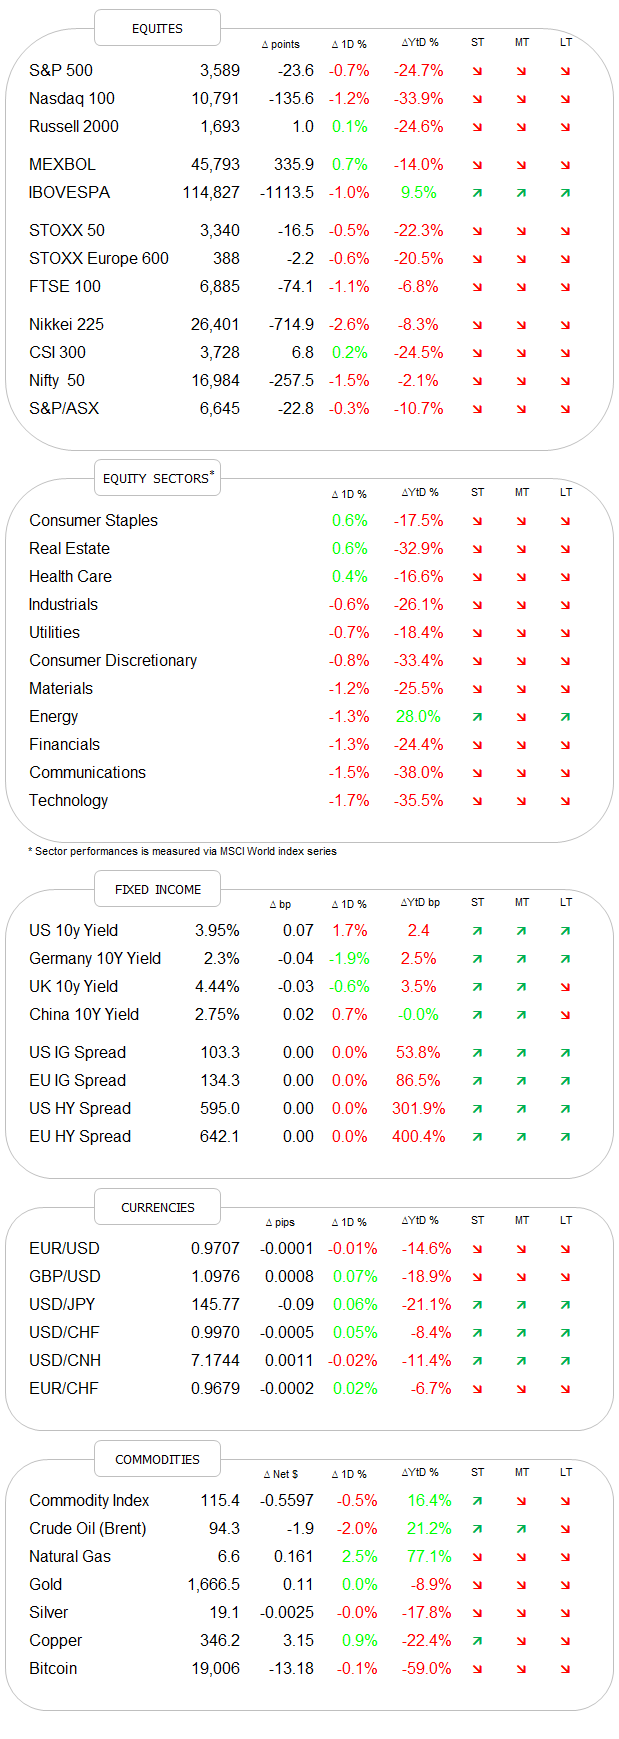
DASHBOARD
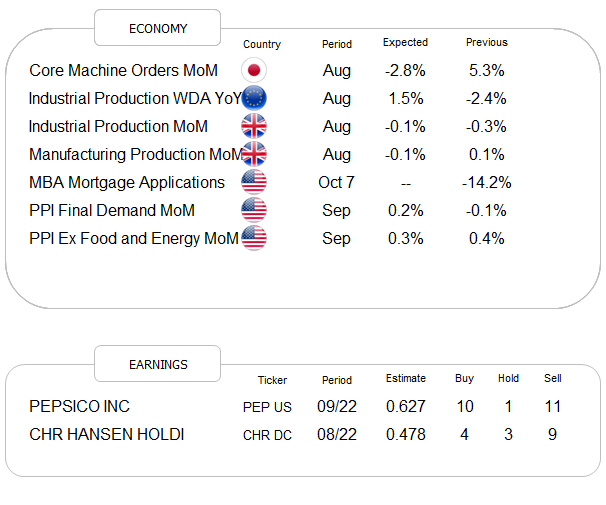
AGENDA
CROSS-ASSET DELIBERATIONS
Hate to do so, but let’s start with an Erratum. Whilst talking about the market cap reduction for META (a company formerly known as Facebook), a little typo happened in the word ‘millions’, which should have read ‘billions’. But hey, what is an ‘m’ or a ‘b’ or even a ‘tr’ amongst friends, c’mon! And in case you wondered, the exact number is -734872862720 and, yes, I put no ‘000 separators there on purpose just to highlight the problem! 🤣
I spent most of the day on the road yesterday, which always makes me feel a bit more disconnected from immediate market action, but this is actually exactly one of the main reasons I fell into a habit of writing your favourite daily newsletter many years ago now. On the surface, it does not seem I missed too much in terms of market action. But let’s have a closer look …
Starting with equities, indeed the intraday graph of the S&P 500 shows that stocks where on a road to nowhere yesterday:
Stocks did close lower on the day, however, and they did so for a sixth consecutive day, but except for the large three percent drop last Friday, everything seems pretty orderly for now. Looking briefly under the hood, downside participation was a tad (but just a tad) higher than during the previous two sessions, with the advance-decline ratio at about one-to-two. Only three out of eleven sectors managed to eke out a gain on the day:
The sell-off in utilities, supposedly a ‘defensive’ sector raises an eyebrow but is largely an extension of what it has been going on for over a month now. Here’s the SPDR Select Utilities ETF (XLU) as a proxy for the sector:
This is somewhat surprising. Not that utilities dropped by over 20% in a month time, but that it took them so long to do so. As I learnt it, utilities are in kind of competition to bonds, thanks to their higher dividend payout than other sectors. But utilities are usually also highly indebted due to capital intensity of their business. Hence, higher borrowing costs usually equal lower margins. Maybe, and just maybe, the rally from mid-June until the top towards the end of September was then only based on a “Fed Pivot” hope, with that hope recently being crushed? Any views? Leave your take in the comment section:
But back to more immediate market action, here’s the intraday market carpet for completeness purposes:
Let me wrap up the equity section with two charts giving a (very) small bullish argument, just because it’s Thursday and because I like you and know you can do with some positiveness.
The first one shows an ever-so-tiny positive divergence between the price of stocks (S&P) and a momentum indicator (RSI):
Sometimes, and just sometimes, these kinds of divergences can indicate a short-term pivot (hate the word) ahead.
The second chart is on the Russell 2000, as a proxy for US small-cap stocks, with that market segment unlike their large-cap cousins not having hit a new-52 week low over recent sessions and kind of holding above some key support levels:
Maybe even a better way of showing this relative strength is taking the ratio of small versus large cap stocks (RTY/SPX), which shows intents of a bottoming process:
Before turning to bonds, Asian equity markets are by and large a sea of red this morning, with the largest declines registered in Taiwan and Korea. No green to be had, unless you invest in some more exotic places such as the Philippines or Laos. Index futures in Europe point to a weaker opening of cash markets at 9:00 CET whilst their US counterparts are flat to slightly higher.
The fixed income asset class, similar to equities, were quite the snore yesterday, despite all the excitement surrounding the UK Gilt market. As a matter of fact, even the Gilt market itself seems to be more talk than walk, with three days of no net progress in either direction, despite a lot of intraday volatility:
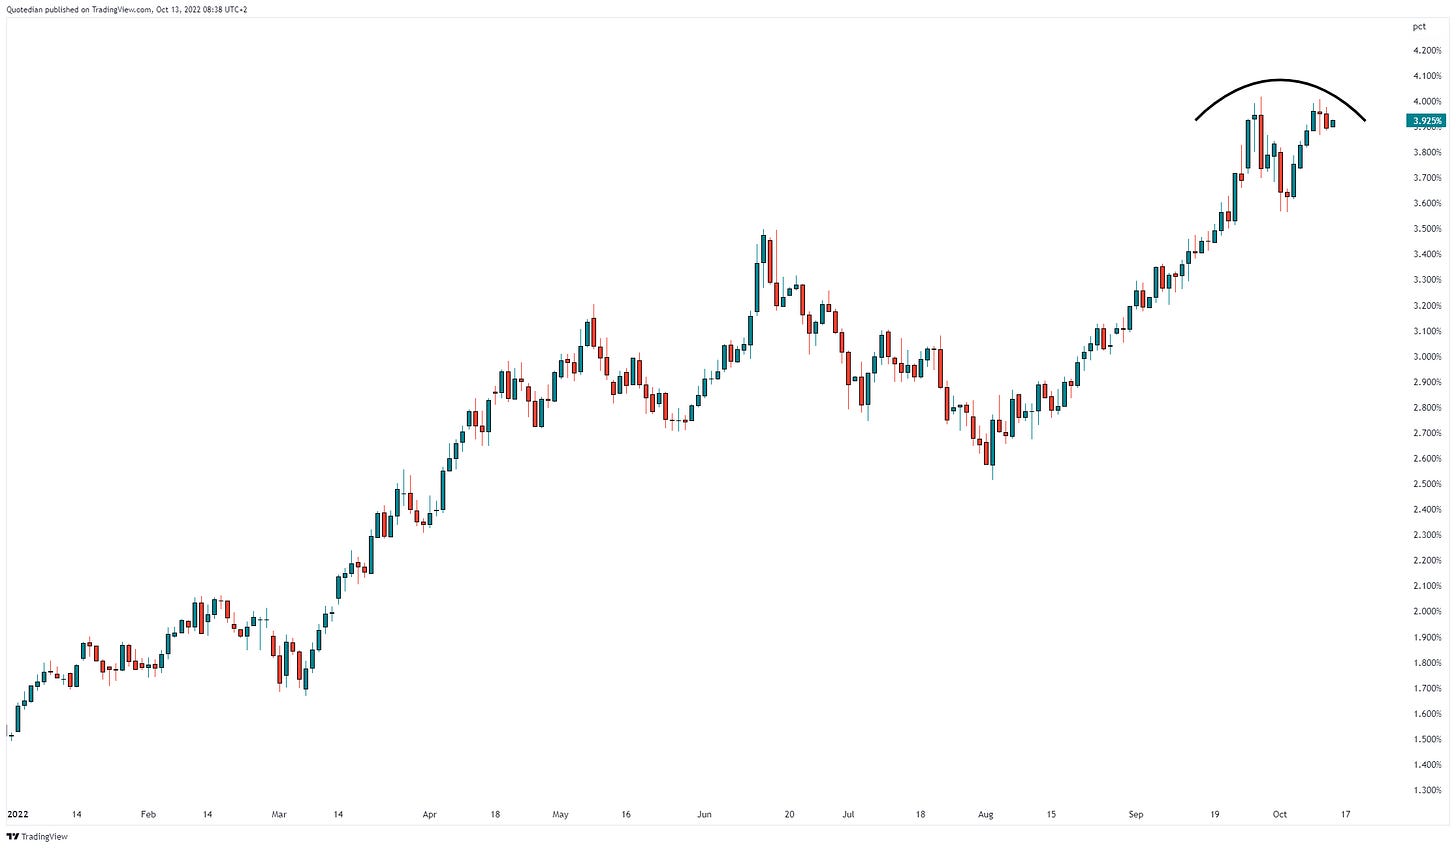
Similarly, the US 10-year Treasury yields, continue to stall at their previous highs just below four percent (for now):
Yields have of course also been marching higher in Europe, and some investors are pointing to sovereign debt stress (usual suspects Italy, Greece et al.), but the BTP to Bund spread chart shows, that while spreads are elevated, there has been no sharp increase over the past month or so:
In any case, to be kept on the radar….
Turning to FX markets, the Japanese Yen is where most action is happening right now, with the JPY hitting new multi-decade lows on a daily basis:
As mentioned, I was out-of-office (ha ha) most of the day yesterday, so am running a bit short on fancy charts today. Hence, let’s wrap up here, with the slight suspicion that there will be plenty to talk about tomorrow, after this afternoon’s US CPI number. As mentioned before, this strongly lagging number, representing a strange basket anyway, should not get too much attention, but courtesy of the Fed, it does.
I wish it would be as easy as “IF…THEN…ELSE” to put together a trading strategy, but with all the market chatter going on with everybody “selling” is own book, it is hard to know what true sentiment and positioning are. Hence, I recommend going into the number as flat (or benchmark neutral) as possible and then learn and conclude from the market reaction to decide on your weightings.
Have fun!
André
CHART OF THE DAY
Let me show you the following chart “as is”, and then elaborate on it a bit more in one of the upcoming Quotedians. But in principle, the chart shows the performance of borrowing money in Japanese Yen, converting it to Brazilian Real and reinvesting it in the bond market of that currency (blue line) and compares it to the performance of having invested on a total return basis (i.e. including dividends) in the S&P 500 (white line). Given that the S&P 500 is probably THE most successful equity benchmark of the past 20 years, that is pretty impressive!
Thanks for reading The Quotedian! Subscribe for free to receive new posts and support my work.
DISCLAIMER
Everything in this document is for educational purposes only (FEPO)
Nothing in this document should be considered investment advice
Past performance is hopefully no indication of future performance


