

In Breadth We Thrust
Vol VIII, Issue 15 | Powered by NPB Neue Privat Bank AG
 The value of a thrust signal is proportionate to its rarity; 2) The best thrust signals follow breadth wipeouts, a.k.a. panic selling; 3)")
"To expect the unexpected shows a thoroughly modern intellect."
— Oscar Wilde
Enjoying The Quotedian but not yet signed up for The QuiCQ? What are you waiting for?!!

Being a stock market investor has recently not been a lot of fun.
First this:

And then this:

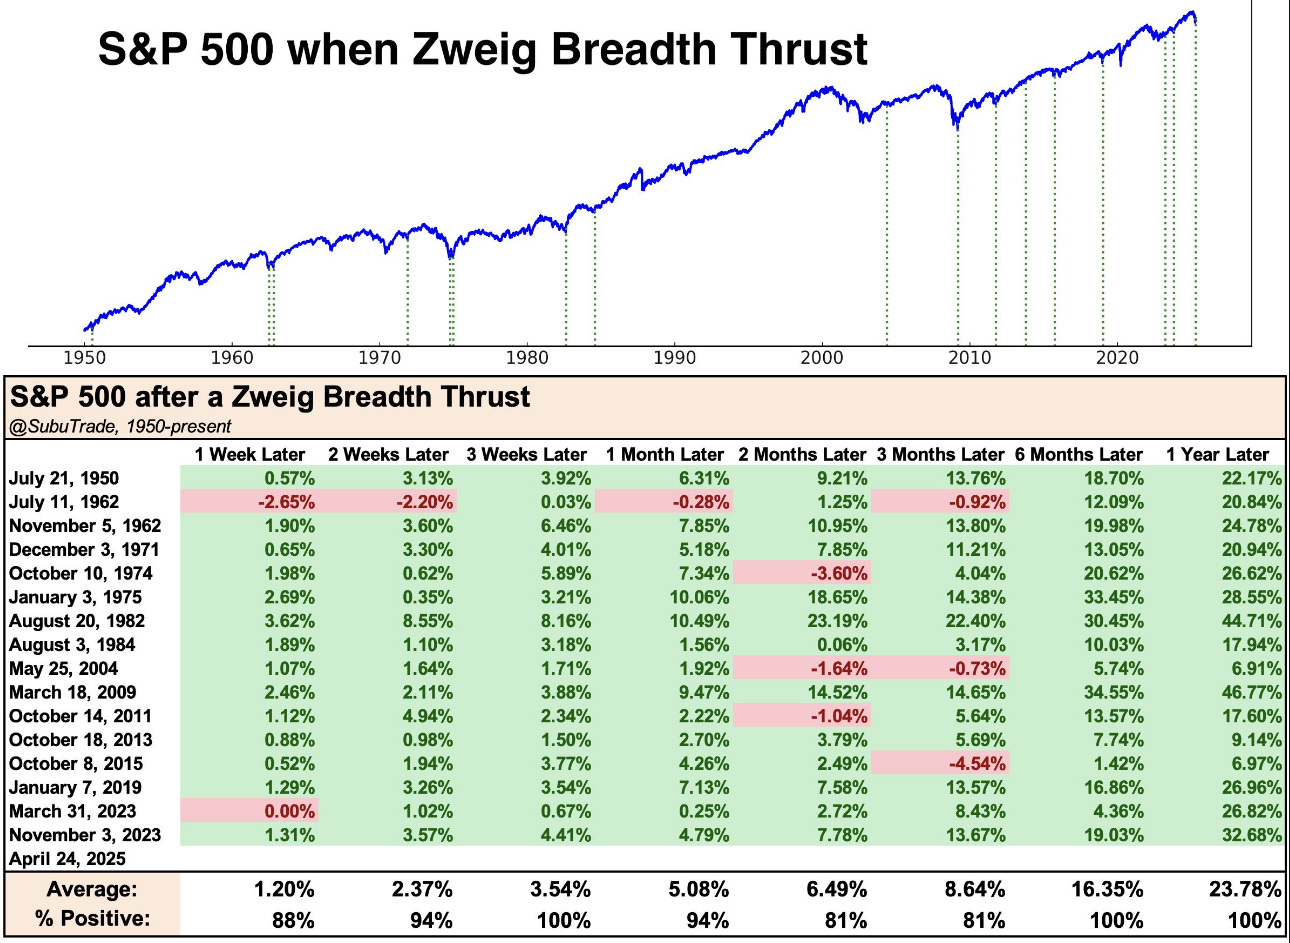
But now comes the good news. On Thursday last week, we got the famous Zweig Breadth Thrust buy signal!
However unlikely or impossible or unimaginable it seems in the current environment, this buy signal should be adhered to nearly blindly. After all, the average return one year on after such a signal, is nearly 24% for the S&P 500:
Hence, can it really be that …

Let’s go on a journey of discovery!

As a matter of fact, not only did we get a S&P 500 Zweig Breadth Thrust, but actually even a SuperZweig! According to the creator of the chart below:
"Forget the Zweig breadth thrust - the NYSE just triggered a SuperZweig. Both extremes were significantly further than the thresholds of the original signal. The S&P 500 returned more than +20% the year following every prior thrust."
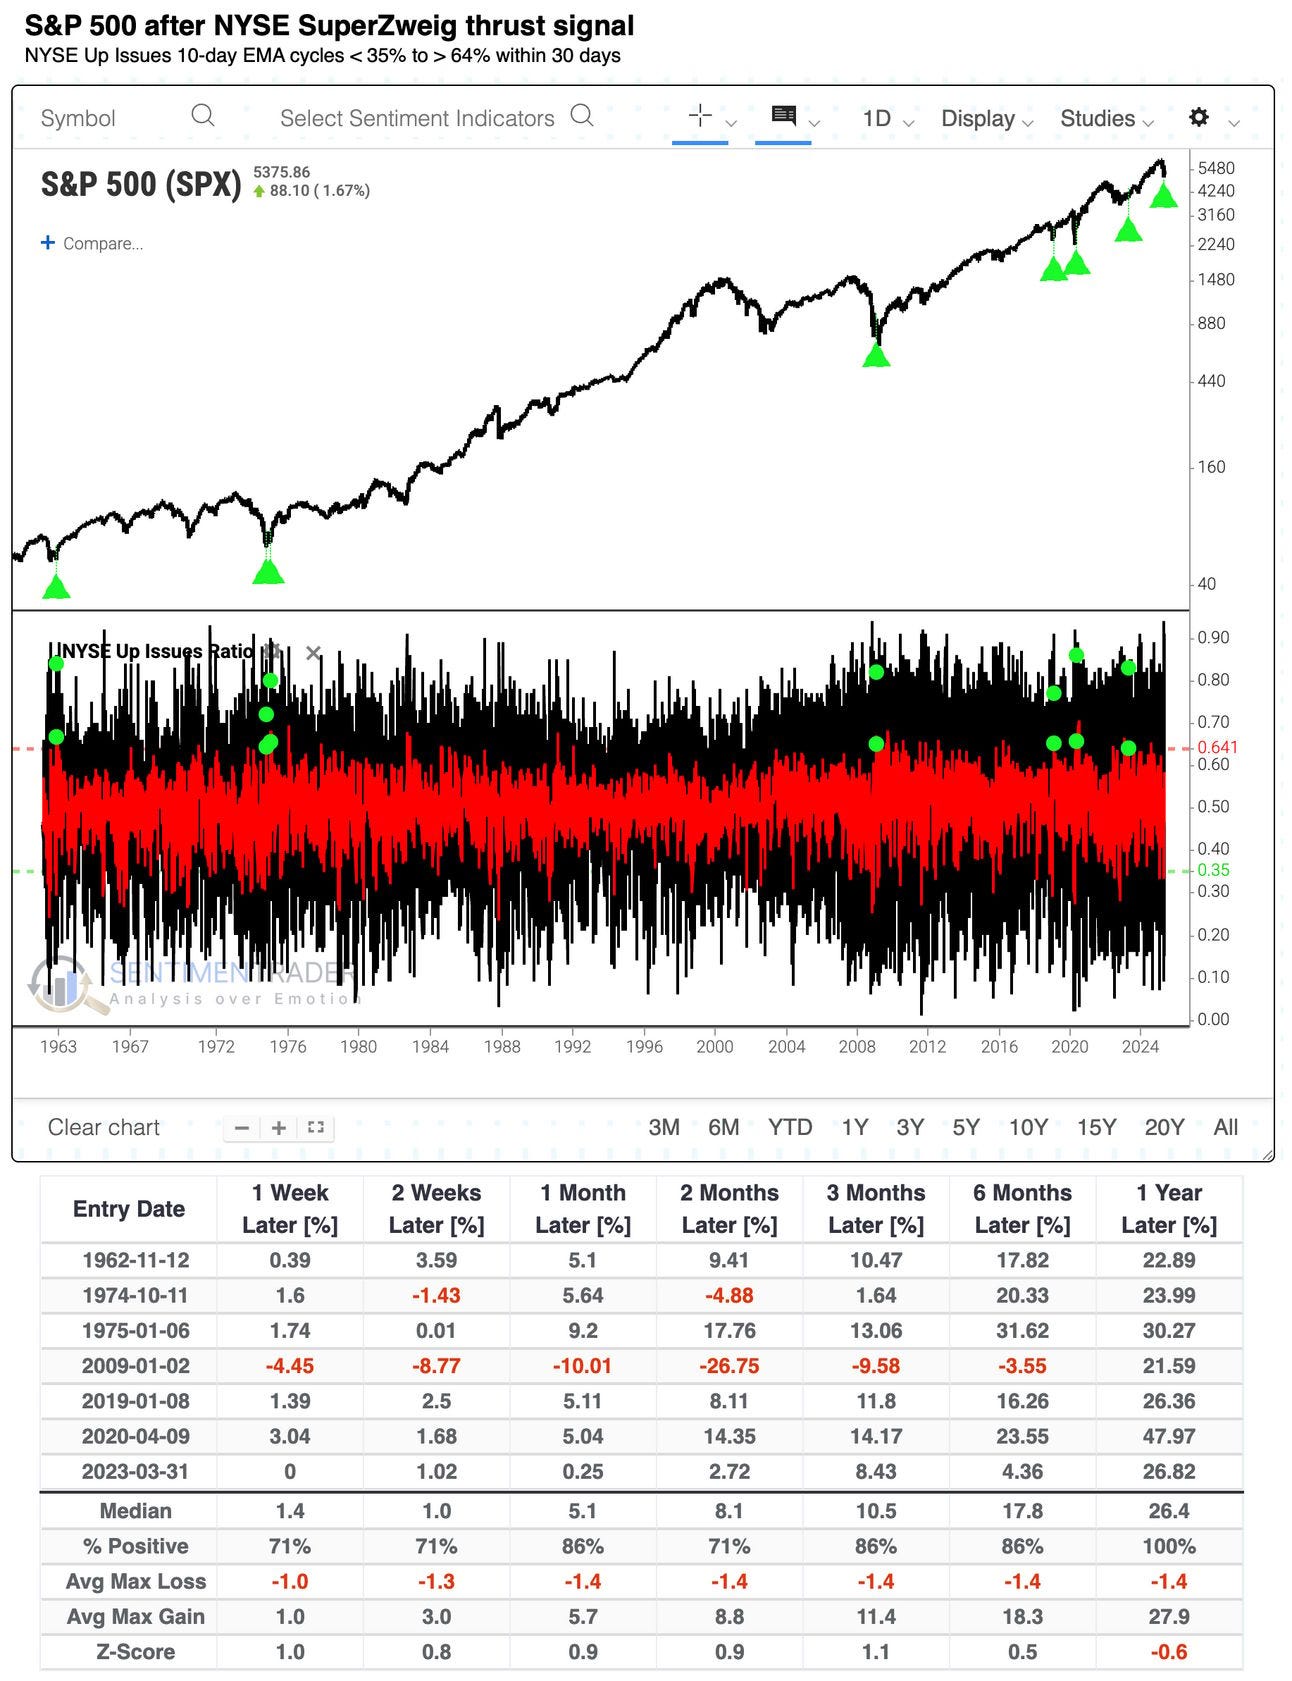
Hence, a bear killer!

Let’s take a look at the charts then. Here’s the S&P 500:

Indeed, this suddenly looks bloody constructive!
The monthly candle on the S&P 500 will be Boss-Level if we close around current levels, rivalling the tremendous March 2020 (COVID) and December 2018 (Christmas Eve Massacre) candles:

The Nasdaq 100 is already positive on the month and has beautifully rebounded at the lower end of its long-term uptrend channel:

But be aware! Both indices are still below the 200-day moving average:

Only a move above will give the “ALL CLEAR” signal.
So, is exodUS™ all over then?

For now, no. exodUS™ continues, and keep in mind the potential for recovery of non-US markets:

The same is true for the Value over Growth trade. The potential is gargantuan, but past disappointments have also been extraordinary:

But let’s return to European markets for a moment. Here’s the broad STOXX 600 Europe index, scratching at the 200-day moving average already:

The narrower Euro STOXX 50 is way, way above that 200-day MA already:


Stay long!
And now, hold on to your breath (not breadth - ha ha):

Germany’s DAX is a mere five percent away from a new all-time high! Fiscal expansion definitely works for stock markets!
Turning to Asia, we note that Hong Kong’s Hang Seng Index pretty neatly followed the pattern of 30%+ rallies followed by 15-20% corrections we had highlighted in a Quotedian a few weeks ago:

Is that pattern to be upheld, the HSI should rise to anywhere between 25k and 30k over the coming months then.
In Japan, the Nikkei quite precisely tested the carry-trade unwind panic lows of last August and is rebounding nicely since then:

Zooming out on the same chart, it becomes obvious that the index is in one of its typical sideways consolidations, which can endure for a year or two. Once this period is over, the index could see its next upleg into the vicinity of 50,000:

In India, the BSE 500 dropped very briefly back into our original target zone, but recovered on the same day and has been stampeding higher ever since:

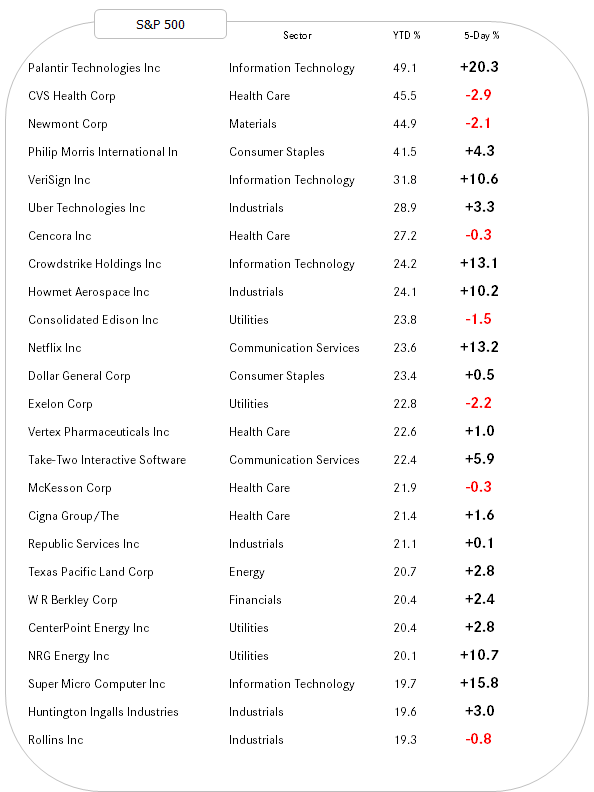
In terms of sector strength, the current leaders are not the same of the past two years:

This is then of course also reflected in the tables of the top performing stocks year-to-date where Utilities and Health Care stocks have much more prominence then in the past. Here’s the US list:
And here’s the European leaderboard:


Turning to the bond/rates markets, some degree of normality has returned to US Treasury market, with the 10-year yield having survived the tariff induced lowering of economic growth expectation (drop to 3.8%) and “The Treasury is Broke” panic rise to 4.60, all within a couple of sessions:

Accordingly the MOVE index, the treasury markets ‘equivalent’ to the equity markets VIX index, is headed lower again, i.e. less volatility:

The yield curve (30y - 2y here) has steepened and is likely to continue to do so:

German yields, as a proxy for the European rates market, have been all over the place too, only to end up where they were already a year ago:

In Switzerland, negative rates, at least on the 2-year government bond are a reality again:

Plus we heard that at least one large Swiss bank has introduced negative interests on accounts that hold more than CHF5 million in cash….
But Japanese yields, which saw their 2-year version also trade below zero for nearly a decade, are heading clearly the other direction:

This is also true for the 10-year JGB yield, which hit its highest level in about 15 years a few weeks ago:


In currency markets, the US Dollar index (DXY) is rebounding from the lower end of a massive uptrend channel after having been as oversold as hardly ever:

The breakout on the EUR/USD chart should hence be taken with a pinch of salt, i.e. not be considered fully executed just yet:

The Dollar-Yen cross is also rebounding on a support zone last visited in September of last year:

Hence, calling for the death of US Dollar is probably a bit premature.

In-line with a Dollar relief rally, Gold may also have found an intermediate top at $3,500, from where is already given back 5%:

In February our investment committee had upgraded Gold from Neutral (5%) to tactical overweight (7.5%) in expectation of a blow-off top. We remain structurally very bullish on Gold, but have reduced our exposure back down to neutral again, believing that we have seen exactly such a blow-off top last week:

We already showed the following chart in a QuiCQ last week, but it explains the Gold top so neatly, it deserves a reprint:

Oil (WTI) continues to trade below long-term support (now resistance) and I do not see a lot of reason for a tradable rally for the time being:

Time to hit the send button - have a great week!

In reality, you need no other Disclaimer than the one above, but just in case:
Everything in this document is for educational purposes only (FEPO)
Nothing in this document should be considered investment advice
Investing real money can be costly; don’t do stupid shit
Leave politics at the door—markets don’t care.
Past performance is hopefully no indication of future performance
The views expressed in this document may differ from the views published by Neue Private Bank AG