January Effect
The Quotedian - Vol VII, Issue 5 | Powered by NPB Neue Privat Bank AG
“The perfect is the enemy of the good.”
— Voltaire
Actually, with the title “January Effect” I was not referring to the impact a month without booze has on my visual aspect, especially as I decided to do a “Dry February” this year. Even in a leap year February continues to be the shortest month, hence, it lends itself perfectly to go “dry”.
So, if you want to know what I referred to with today’s title, read right down through to the end, where the COTD will enlighten you.
Today we present you the usually gargantuan month-end edition of The Quotedian, but as I started typing on Wednesday evening, I realized that this time around we will be probably leaning even more heavily on charts and stats than usual, and reduce the accompanying comments to a minimum. Major time constraints limit my babblings - probably to the readers? delight.. So, like the classical cartoon of the Lineman (La Linea, 1971), you will be served with stunning visuals, accompanied by “hhhmms”, “aaaahhhs”, and other inaudible grunts:
Less is often more in money management. Forget the babblings, talk to us.
Contact us at ahuwiler@npb-bank.ch
As we are just at the end of the first month of 2024, today’s statistical tables will show YTD (or MTD, same-same) only, except for the top pferforming stock tables, where we will study YTD gains of the Top 25 stocks and their behaviour over the past trading week.
Let’s dive right in!
That’s pretty stunning … after only one month done in the current year, the performance spread between best (Japan, +7.8%) and worst (Hong Kong, -9.2%) is an amazing seventeen percent!
Even adjusting to USD-terms, the difference is still north of 12%. Other major benchmarks were split quite precisely down the middle between winners and losers. It seems geographical allocation still matters after all …
The Nasdaq was once again one of the top performers, however, gave back half its year-to-date gain on the last day of the months.
BUT, as is this is the month-end edition of The Qutoedian, we are not looking at this as day-trades, but rather take the long-term view through the monthly chart lenses. Staying with the Nasdaq to start:
The breakout to new ATHs is clear, short-term support is clear (16,400) and the secular trend is clear.
Let’s turn to the one index to rule them all, the S&P 500:
Also here trend and breakout to new ATH are crystal-clear, and the pattern (a cup and a handle) we spoke about in previous editions counts at a minimum to 5,600 (noooo, not tomorrow …).
In Europe, the narrow Euro STOXX 50 index has not yet broken above the all-time highs set in 2000, but it HAS exceeded the 2008 highs, which counts as a major victory:
Even more so, as this index is heavily geared towards financials (19%) and technology stocks (165) only coming in at fourth place in terms of sector weighting, proving the point that this rally is not only about tech.
The broader STOXX Europe 600 index, which includes from the UK, Switzerland et al., is less than two percent away from a new ATH set in 2022:
And talking oof new ATHs, over in the land of the rising sun the ascent (pun intended) of the stock markets towards reaching new highs 40 years later seems unstoppable:
“Ain’t no mountain high enough ...” keeps humming through my head …
Here’s the monthly candlestick chart of the same:
Whilst there will be large drawdowns on several occasions, the combination of low valuations(for now), together with those massive balance sheet reforms initiated by the Japanese stock exchange, sum up to a once-in-a-lifetime investment opportunity in Japan.
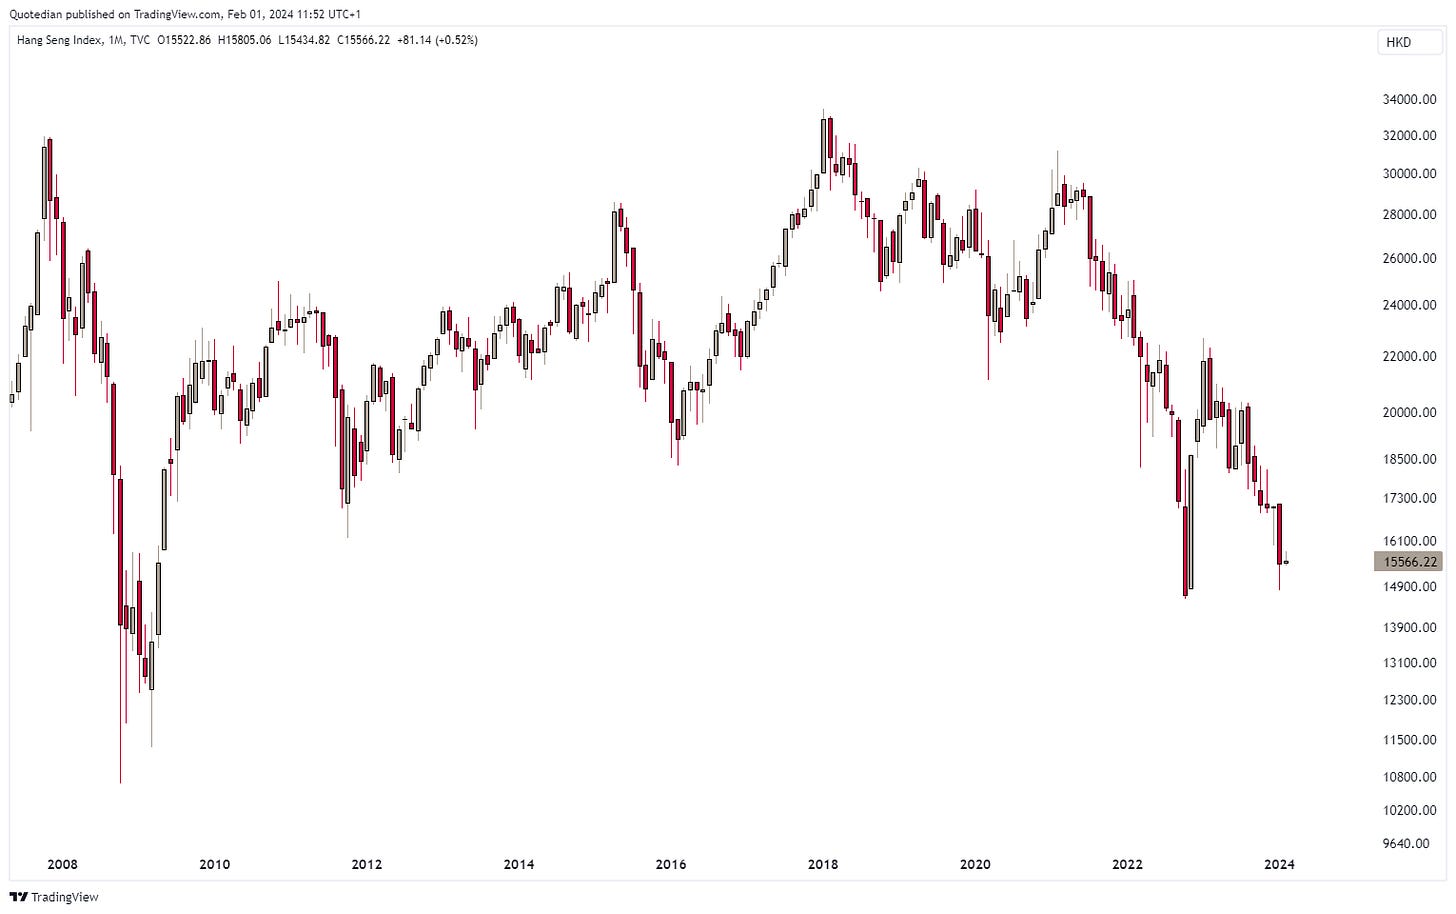
Hong Kong and Chinese stocks … well, the next line of the same song (“Ain’t no mountain high enough ...”) above come to mind now. Here’s the Hang Seng:
Here’s the monthly candle version of the Hang Seng since 2008ish:
“Stocks for the long run” or “On the long run we are all dead”?
Let’s have a look at the chart of Indian equities to get rid of that stale taste we just got in our collective mouths:
Now that’s better.
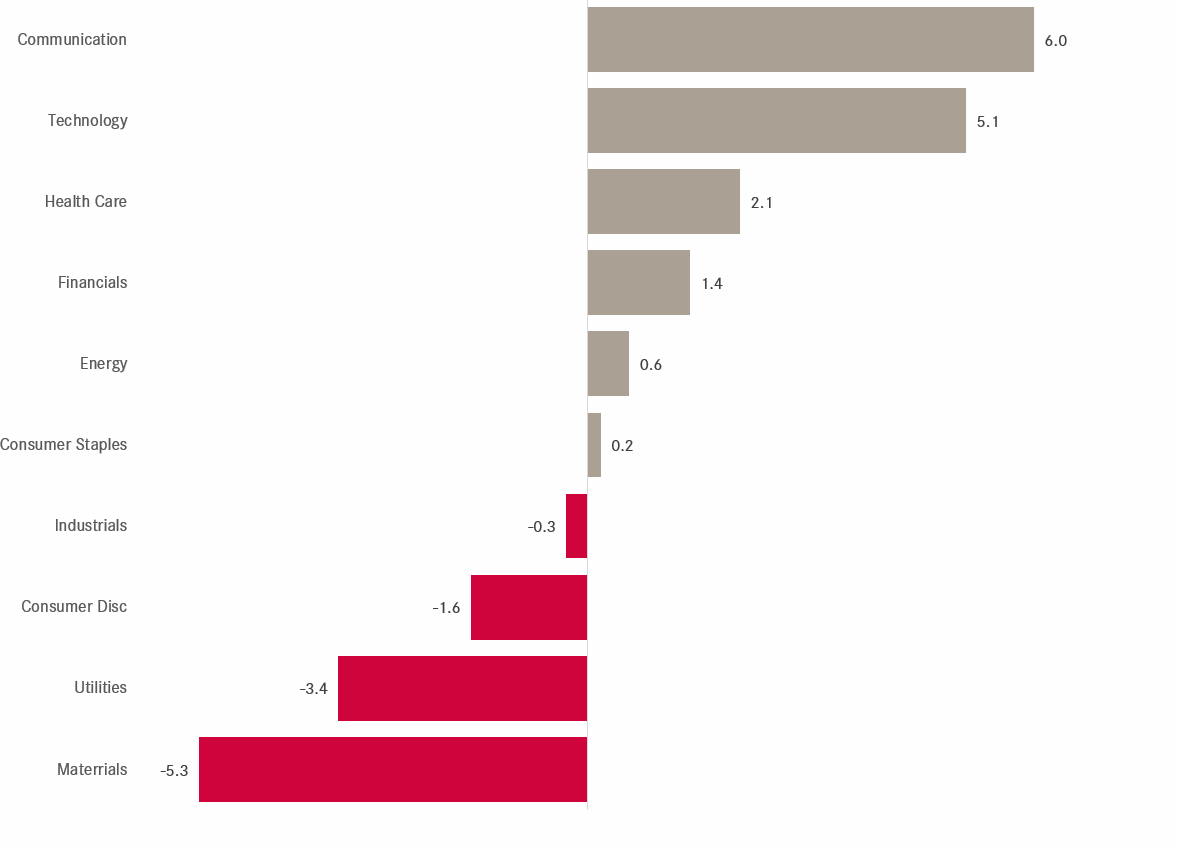
Ok, time to review equity sector performance in January 2024:
Again, an eleven percent plus spread between best (Communications) and worst (Materials) proves that a lot of energy (no pun intended this time around) should be put into sector selection. This is hence why we decided in our most recent Global Asset Allocation report to include an entire, detailed section on sector selection. Check it our here:
Just two quick chart s here in the sector performance section though, which kind of fit the COTD section too and are of more shorter term concern nature.
First, let’s look at the ration of Consumer Staples (XLP) stocks to Consumer Discretionary (XLY) in the US:
Even though carry consumer in the name, the represent pretty different aspects of consumer behaviour and hence have different impact on market mode. Consumer staples (CS) shares are considered defensive (you always have to eat and drink and brush your teeth) whilst consumer discretionary (CD)stocks are all about risk on (let’s buy that new car, dishwasher, boat, etc.). Hence, when the CS/CD ratio falls, as it has most of 2023, the broader stock markets tends to do pretty well (as it has). Now, that downtrend, has been violated as depicted above. No reason to panic, as we would also need confirmation from the CS/S&P 500 ratio, which we do not have yet:
And even if we get confirmation over the next couple of sessions, still no reason to panic. It would perfectly fit the seasonal pattern (weak February) and be a buying opportunity within the longer-term uptrend.
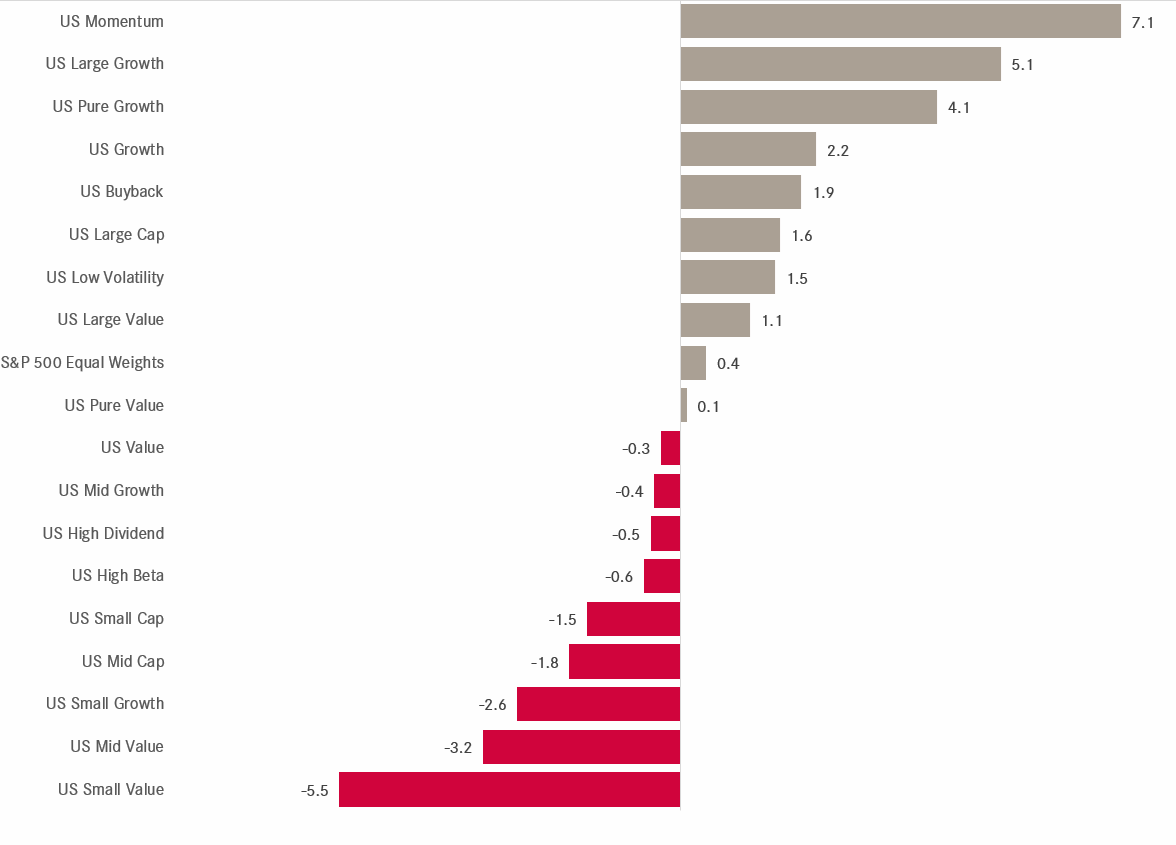
Over in Factorland© , here’s what worked in January:
Large cap worked, small- mid cap did not. To my mild surprise, Momentum worked, but high beta did not. And talking High Beta, the ration of that facotr to the low volatility factor has been diverging with the S&P 500 performance, fitting the CS/CD situation described further up:
And finally, to conclude the equity section, let’s move even more granular to the stock level.
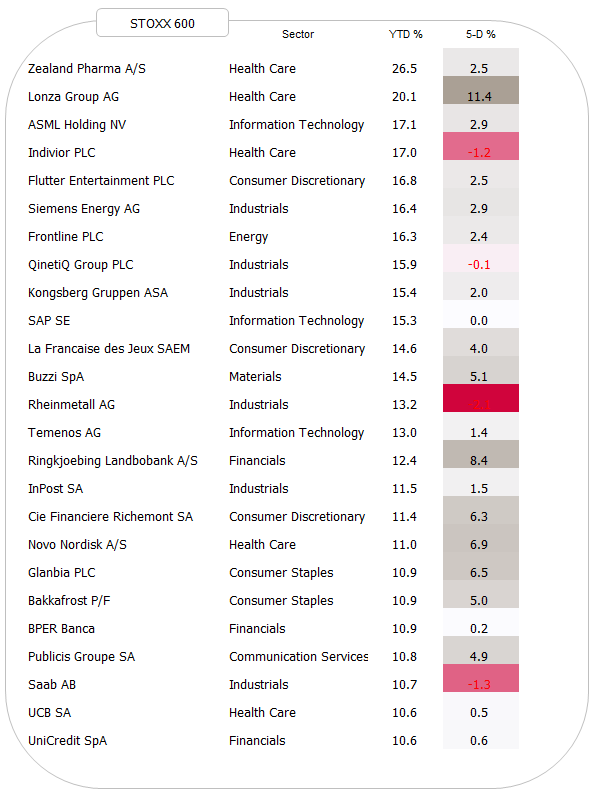
You will remember that throughout the year we look on a regular basis at the top performing 25 stocks in Europe and the US and check how they fared over the past five sessions or the month just gone by. More importantly, I hope you also remember that usually, most of what is in the top 25 at the beginning of the year is also still there at the end.
With that said, here’s what got off to a good start in 2024:
Moving in to the realms of fixed income markets, we note that high yield bond indices behaved relatively well, inline with benevolent equity markets. Treasury bonds however, mostly exposed to the interest rate risk component suffered, as yields pushed higher on the back of stronger-than-expected economic data:
A couple of (monthly) charts here, starting with the US 10-year treasury yield and zooming out quite a bit in order to get the full picture:
Our main working assumption remains that the 40 year downtrend in yield has been broken and was replaced with a decade (or multi-decade) secular uptrend.
However, zooming in a notch, we expect a bit more consolidation before the next major upleg in yields unfolds sometime in 2025:
The ABC pattern above shows the idealized unfolding of such a consolidation period.
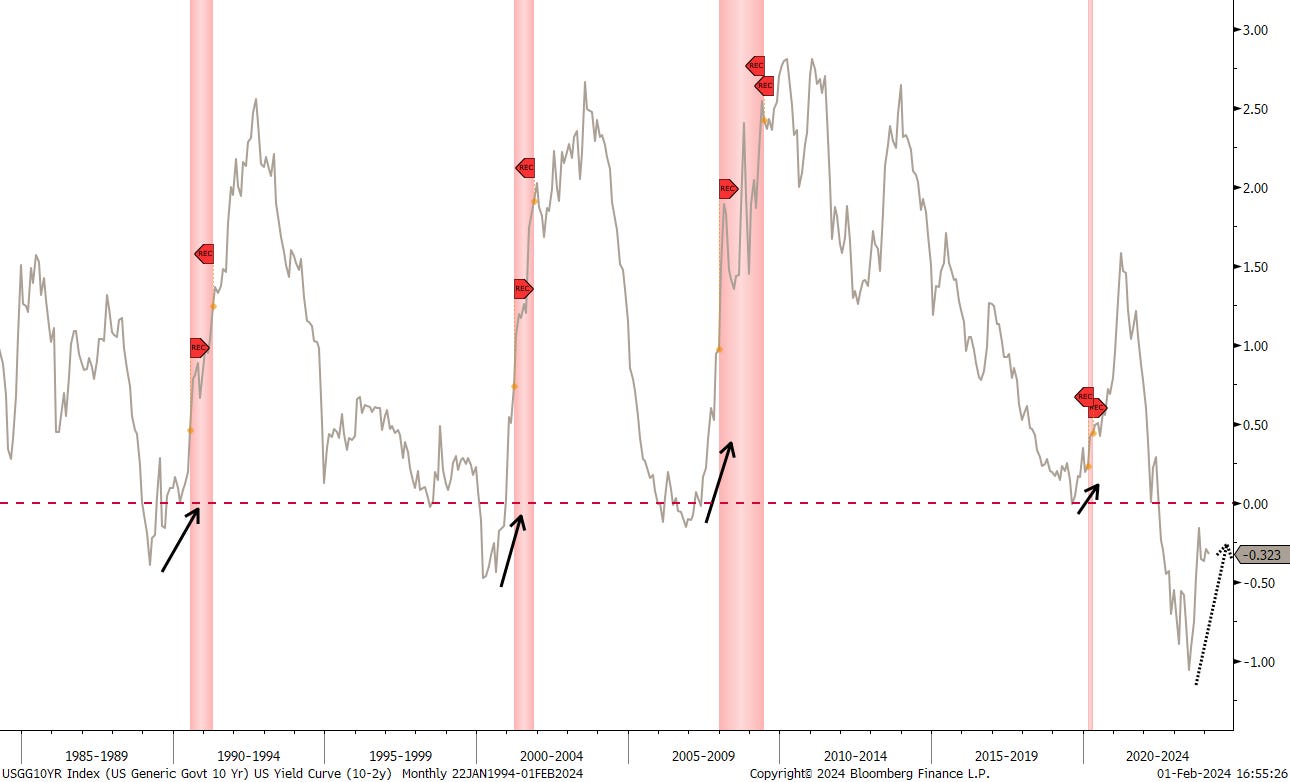
Here’s the US10y-2year spread, showing that t^he yield curve is about to still struggling to become “uninverted”:
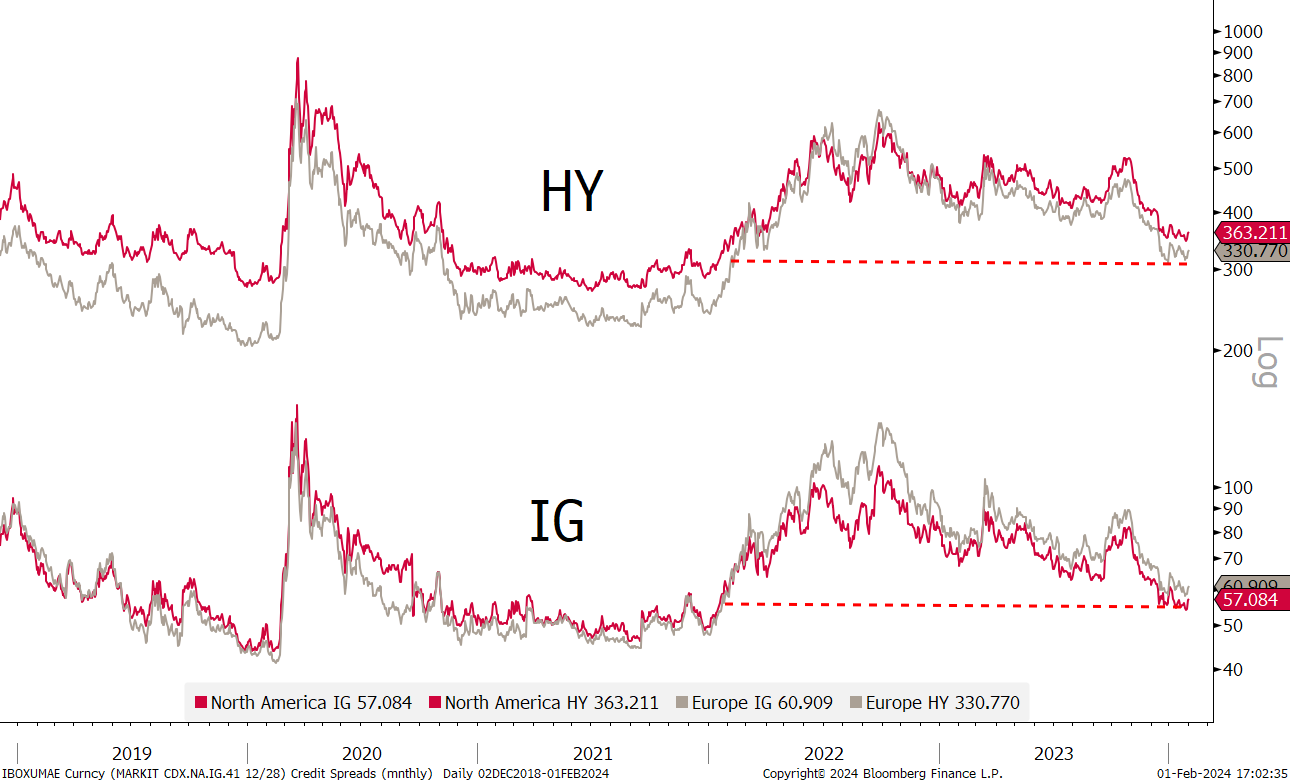
Credit spreads remain tight and invite to a neutral exposure for now:
To finalize the rates/fixed income section, do your remeber that time when government bonds were the anti-fragile asset? I.e. that asset that went up when risky assets went down?
Well, the Chinese 10-year government bond seems to be the only paper that has kept this neat feature…
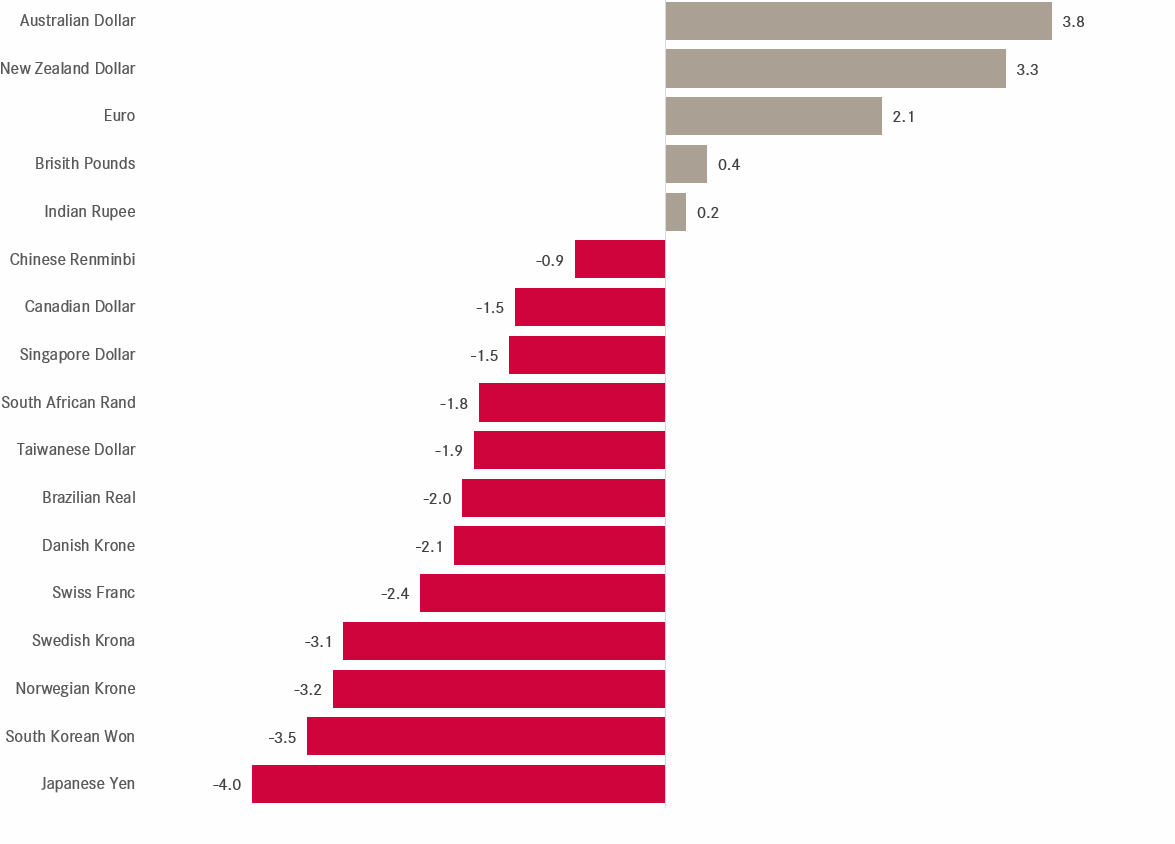
In FX markets, the US Dollar has seen a strong start to the year versus most other major currencies:
Notable exceptions are the Pound and the glittering wonder that is the Euro (both flat) and the Oceania currencies.
The EUR/USD monthly chart remains somewhat of a bore - wake me up in 2026 or so when the currencies is coming into the end of its apex:
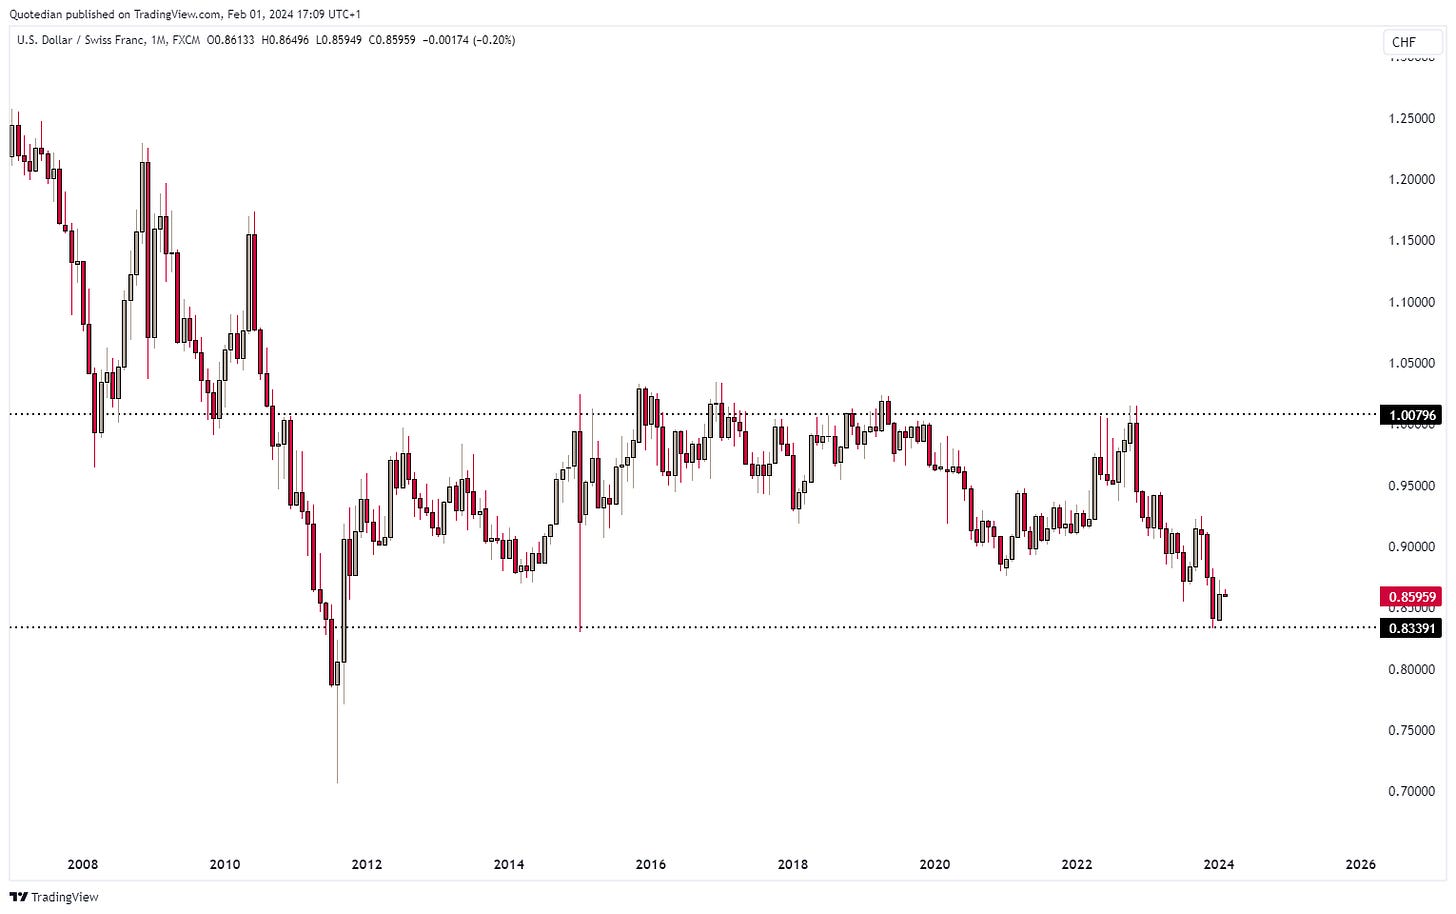
Versus the Swissie, the best case for the greenback is that this cross is bouncing back higher from the lower end of its 10 year+ trading range, though admittedly there is a lot of ‘hope’ in that call:
One of the more exiting cross rates remains the USD/JPY, where suspense remains high on the next move of the BoJ/MoF:
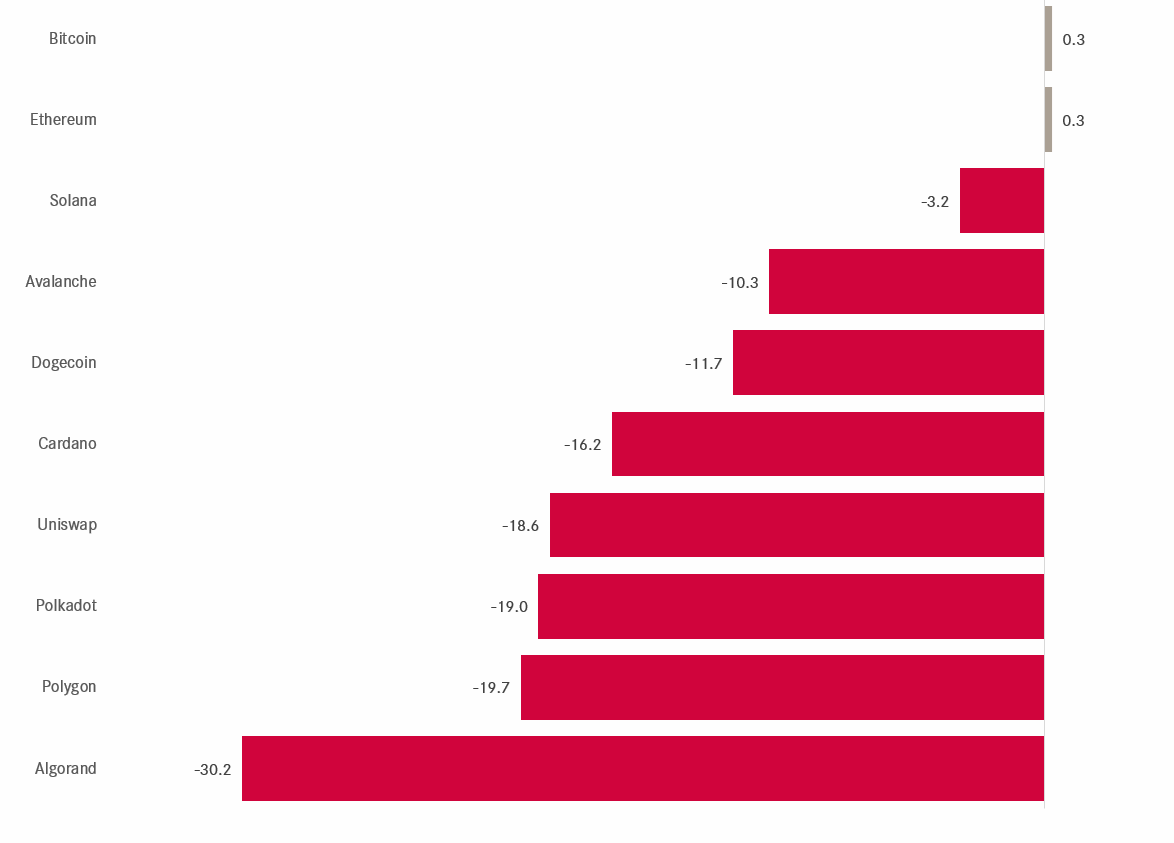
For completeness purpose, here are the year-to-date performance of some of the most important crypto-currencies:
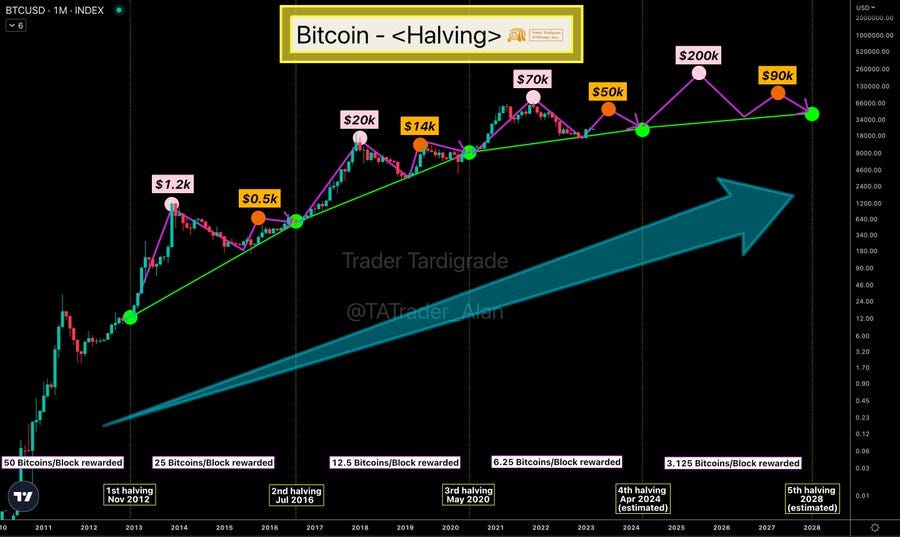
Flat to negative, and all this whilst the bitcoin disciples are getting all exited abou the next halving:
Finishing off with commodities, here are first the commodity sector performances:
Moving more granular, here are the fortunes of popular commodity futures so far this year:
Natural gas sticks out of course, which took a steep slump after US President Biden signed an executive order to not support any additional LNG ports overseas, meaning much more supply staying at home. A daily chart shows the massive impact this decision had on the NG price:
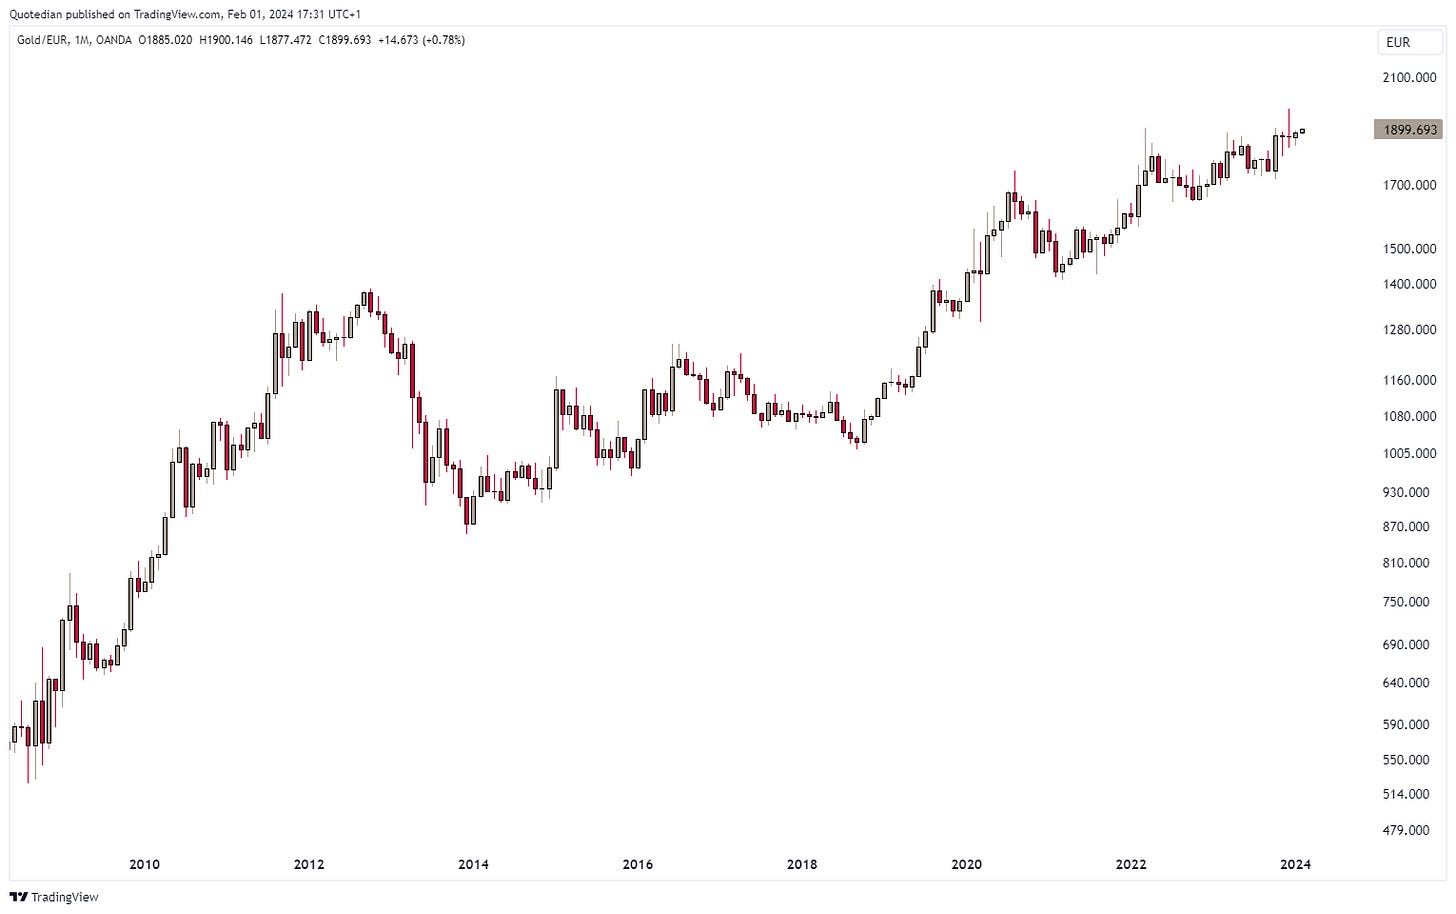
Gold is at new all-time highs … against many currencies…
Here is XAU/EUR:
or XAU/GBP
Or even XAU/JPY:
You get my point.
Ok time to hit the send button. It got much longer than expected (as usual) and I had to cut short the Commodity section (as usual). I leave you with the promise to catch up on that at a later stage (as usual).
Take care out there,
André
Since 1950, when the S&P 500 ended January up, the odds for a positive year were substantially higher than after a negative January:
That’s called the January Barometer.
BUT …
having said that, don’t jump and fill your portfolio mindlessly with all kind of nice stocks, but rather look forward to gather up those position over the coming months. February has been over the past 30 years the third worst month for stocks (S&P 500), down 0.29% on average and down 15 out of 30 times. Only September was done more months (16):
This would also fit the usual weakenss in February during election year:
In conclusion, receive the upcoming volatility with open arms (and mind) and take advantage to gain exposure to the stocks you like for the rest of the year.
Everything in this document is for educational purposes only (FEPO)
Nothing in this document should be considered investment advice
The views expressed in this document may differ from the views published by Neue Private Bank AG
Past performance is hopefully no indication of future performance


