K-POP
Vol VIII, Issue 33 | Powered by NPB Neue Privat Bank AG
“There is so much wealth and so much misery at the same time, that it seems incredible that people can endure such class difference, and accept such a form of hunger while on the other hand, the millionaires throw away millions on stupidities.”
— Frida Kahlo, 1930s
Enjoying The Quotedian but not yet signed up for The QuiCQ? What are you waiting for?!!
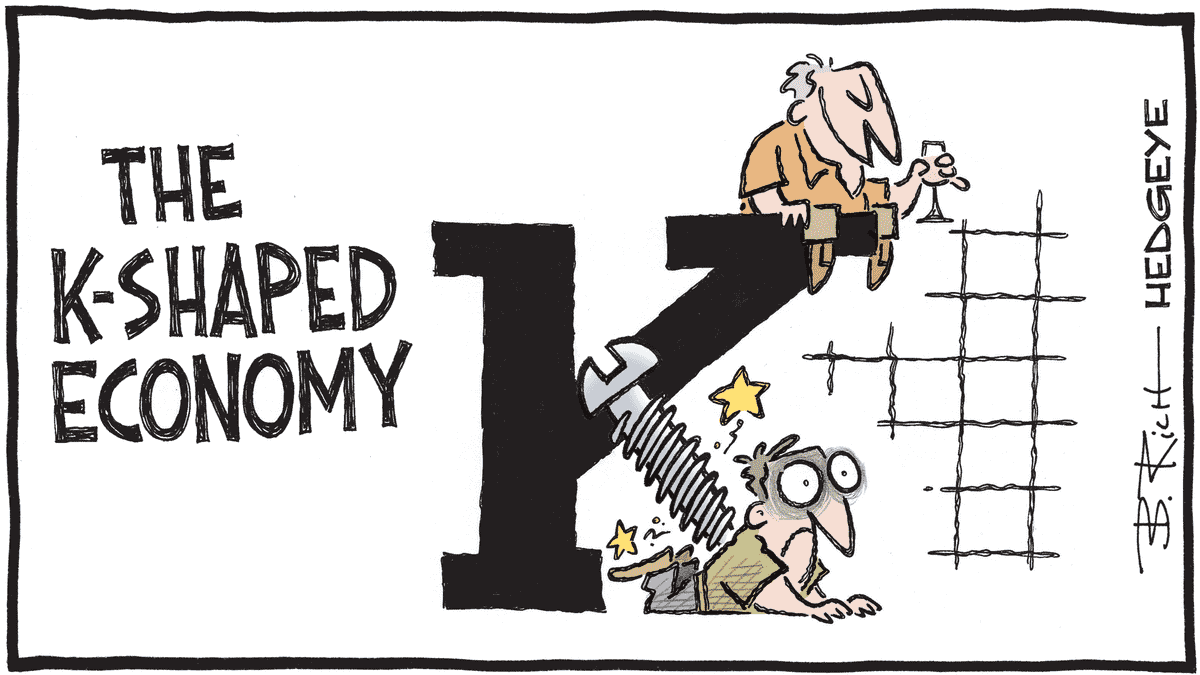
With the title K-Pop, I of course do not refer to the most-ever-watched blockbuster movie on Netflix (click here), but rather to ever increasing distance between the rich and the poor. Hence, maybe this “cartoon” would have been the better picture for this week’s Quotedian (but I had to try to tease in the younger generations 😉):
Now, talking about K-shaped economies and the increasing difference between rich and poor is nowadays a bit like beating a dead horse, and as Frida’s quote above shows, is also not new to the 21st century.
Nevertheless, it starts feeling like “rich or poor” is not the right definition anymore, but rather, it seems we are racing towards:
Those who have everything to lose
andThose who have nothing to lose
A pciture may say more than a thousand words here:
Let’s look at same charts for evidence of this potential K-Pop…
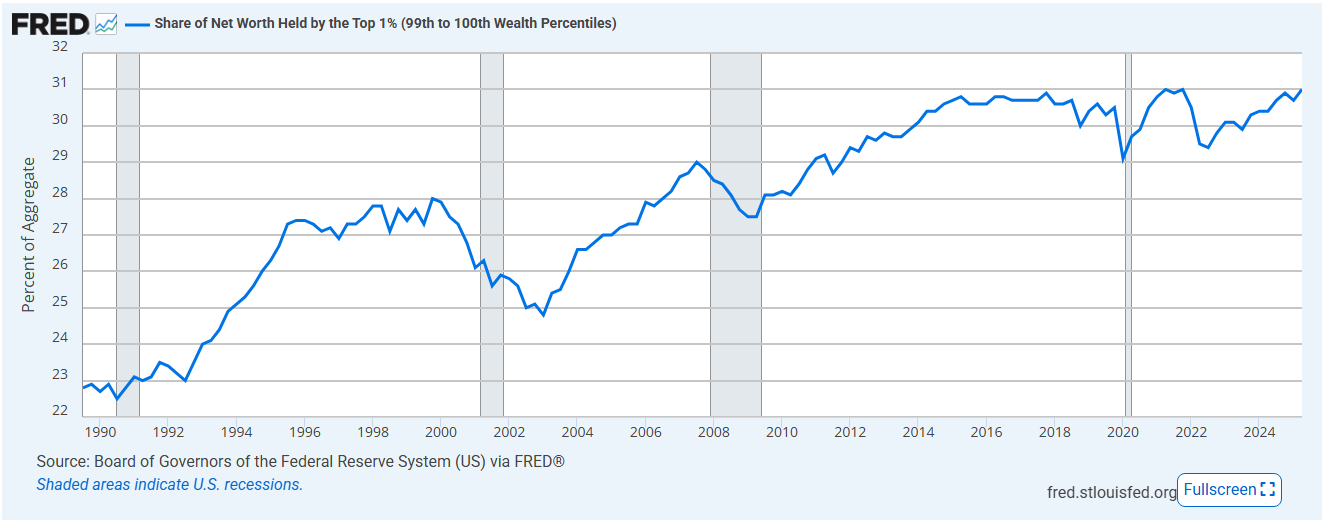
Exhibit #1 … The wealthiest 1% own more than 30% of the wealth cake:
Exhibit #2 … In stark contrast, the bottom 50% hold less than 3%!
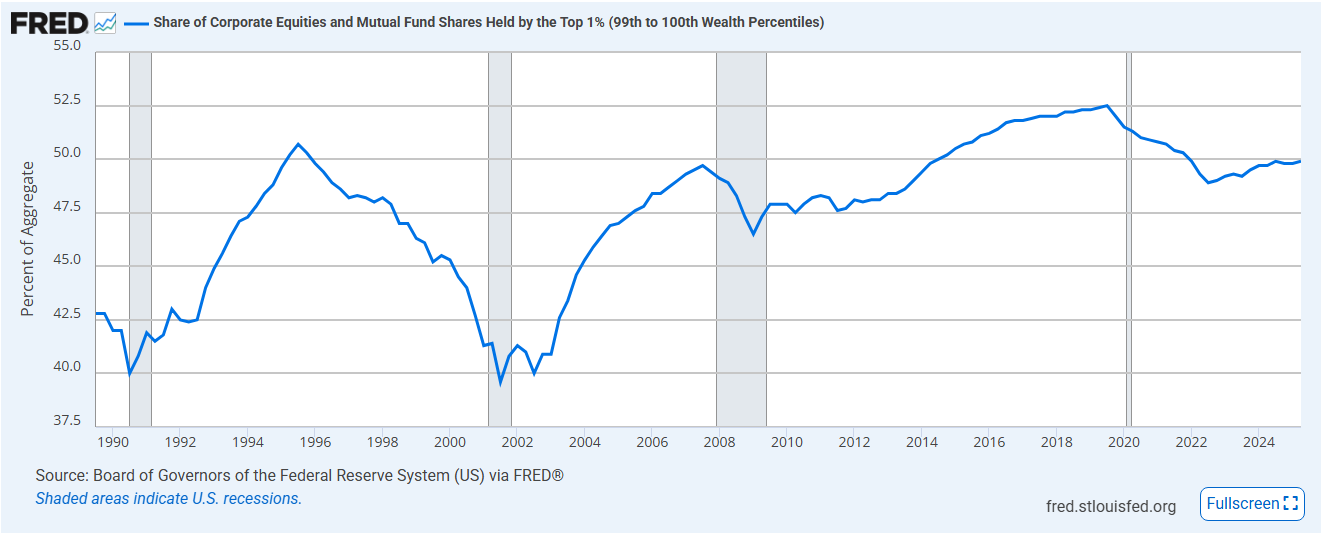
Turning to stock market “wealth”, it gets worse:
The top 1% holds more than 50% of equity “wealth”.
My view has been that the next recession will be induced by a stock market sell-off, rather than a recession that would provoke a stock market sell-off. Considering the chart above, however, it is difficult to imagine how a serious market correction could evolve (i.e., no forced sellers)!
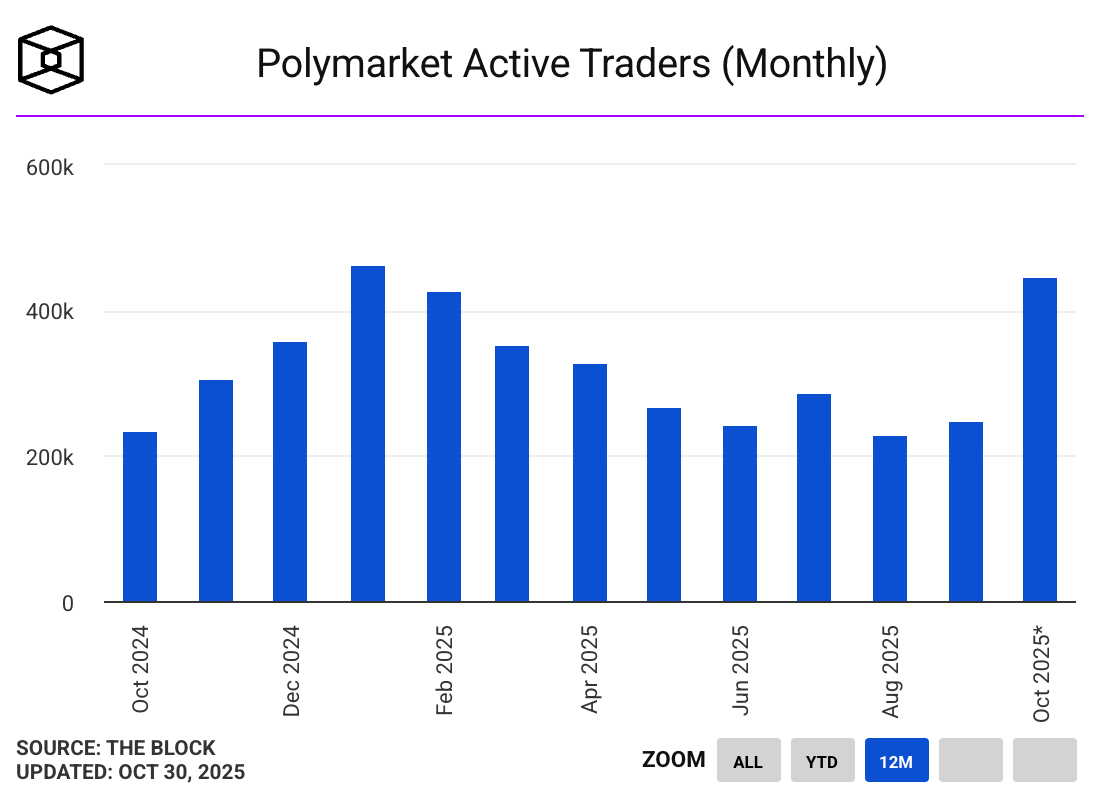
Simultaneously, the bottom 50% is max pain.
This would explain the pick up in 0DTE options,
and Polymarket bets,
as the “Those who have nothing to lose” crowd is better off taking absurd risks rather than doing nothing.
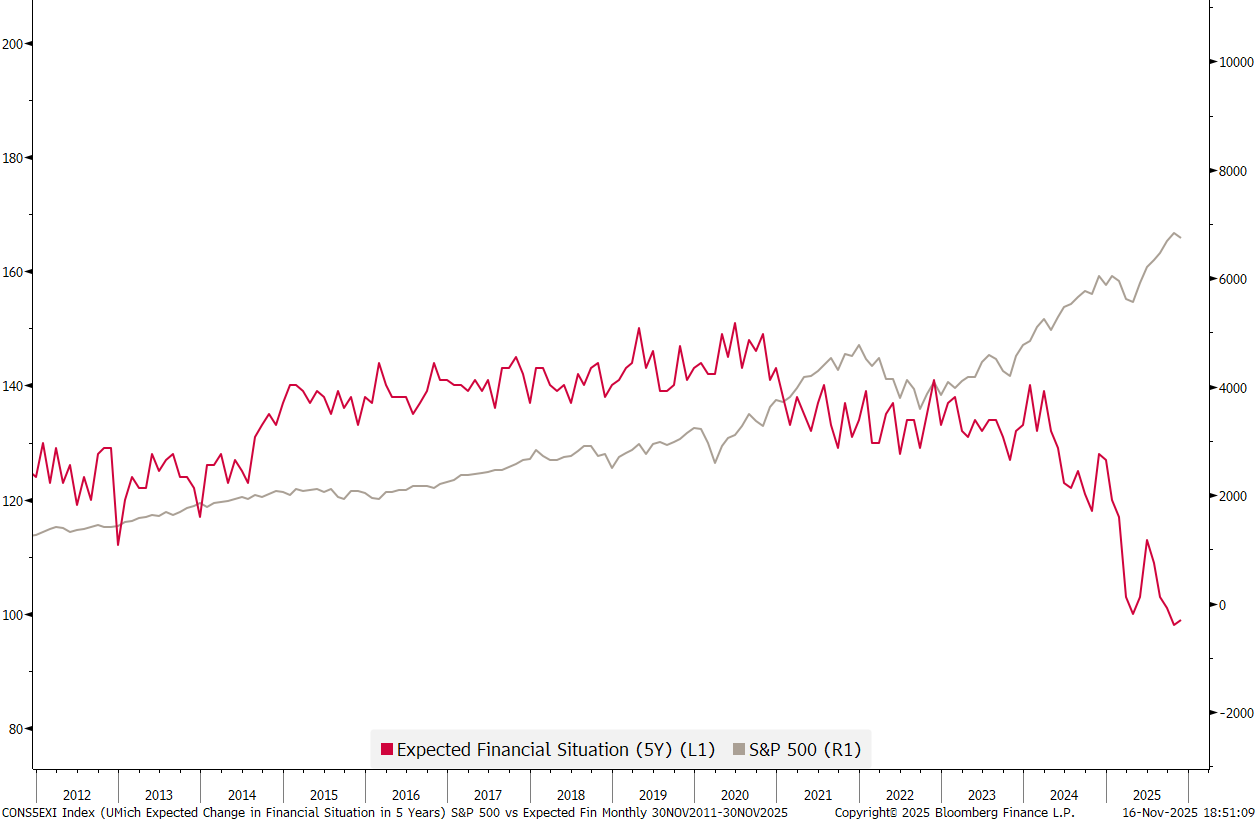
The stock market has been deviating from public sentiment for a few years now, as shown in the chart below, demonstrating the widening K between the S&P 500 (grey) and University of Michigan Survey of financial expectations five years from now:
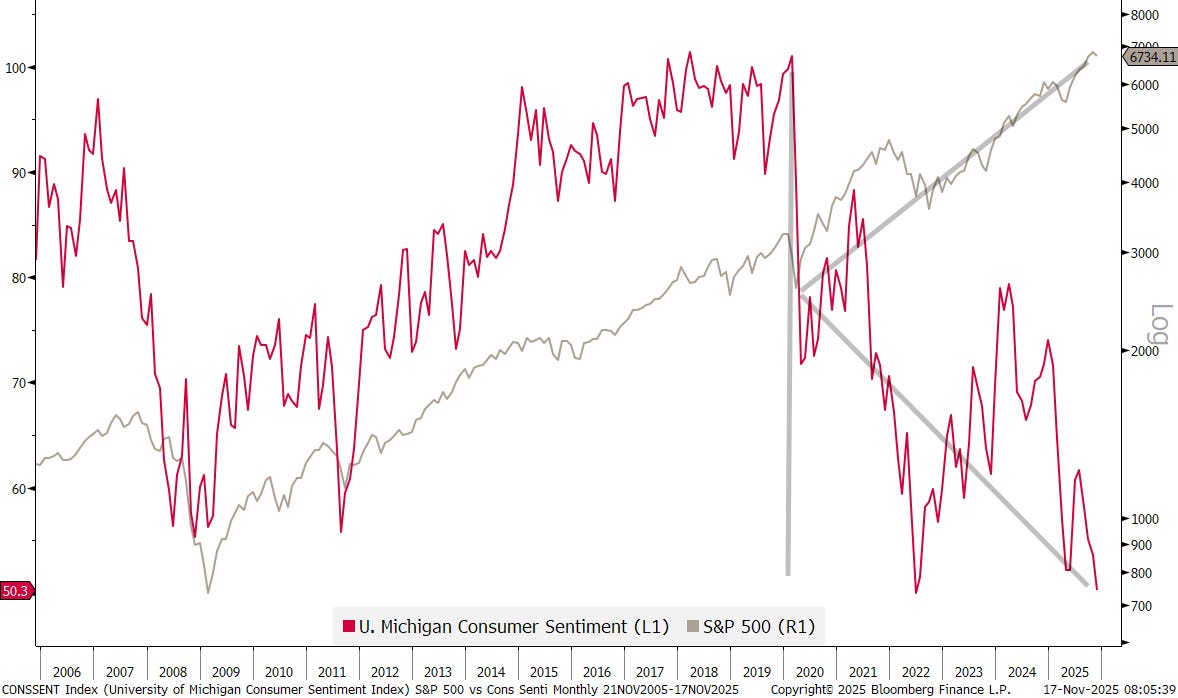
Very similar is the overall consumer sentiment divergence from stock prices. Can you spot the K?
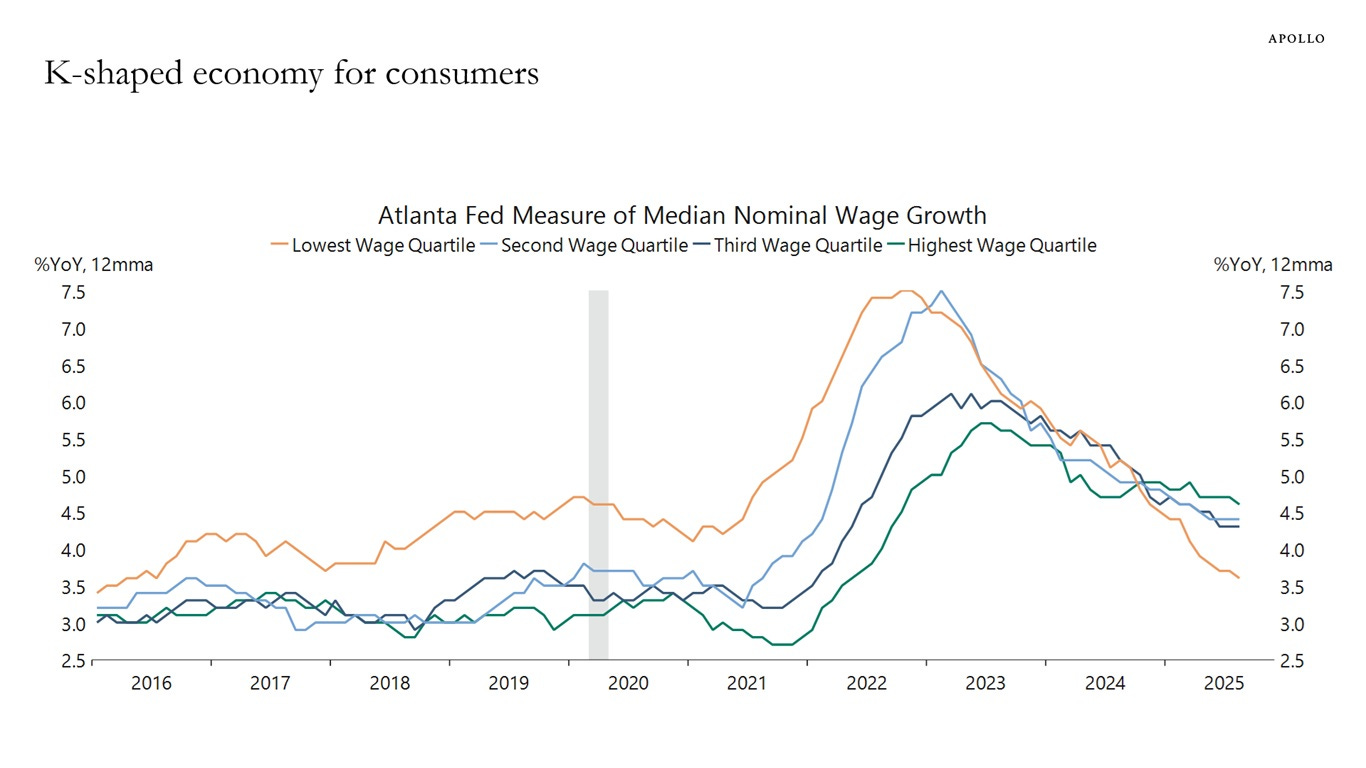
Before and during the pandemic, lower-income households experienced higher wage growth than other income groups. But that has changed over the past year, see chart below:
Today, wage growth for low-income workers is significantly lower than wage growth for middle- and high-income workers.
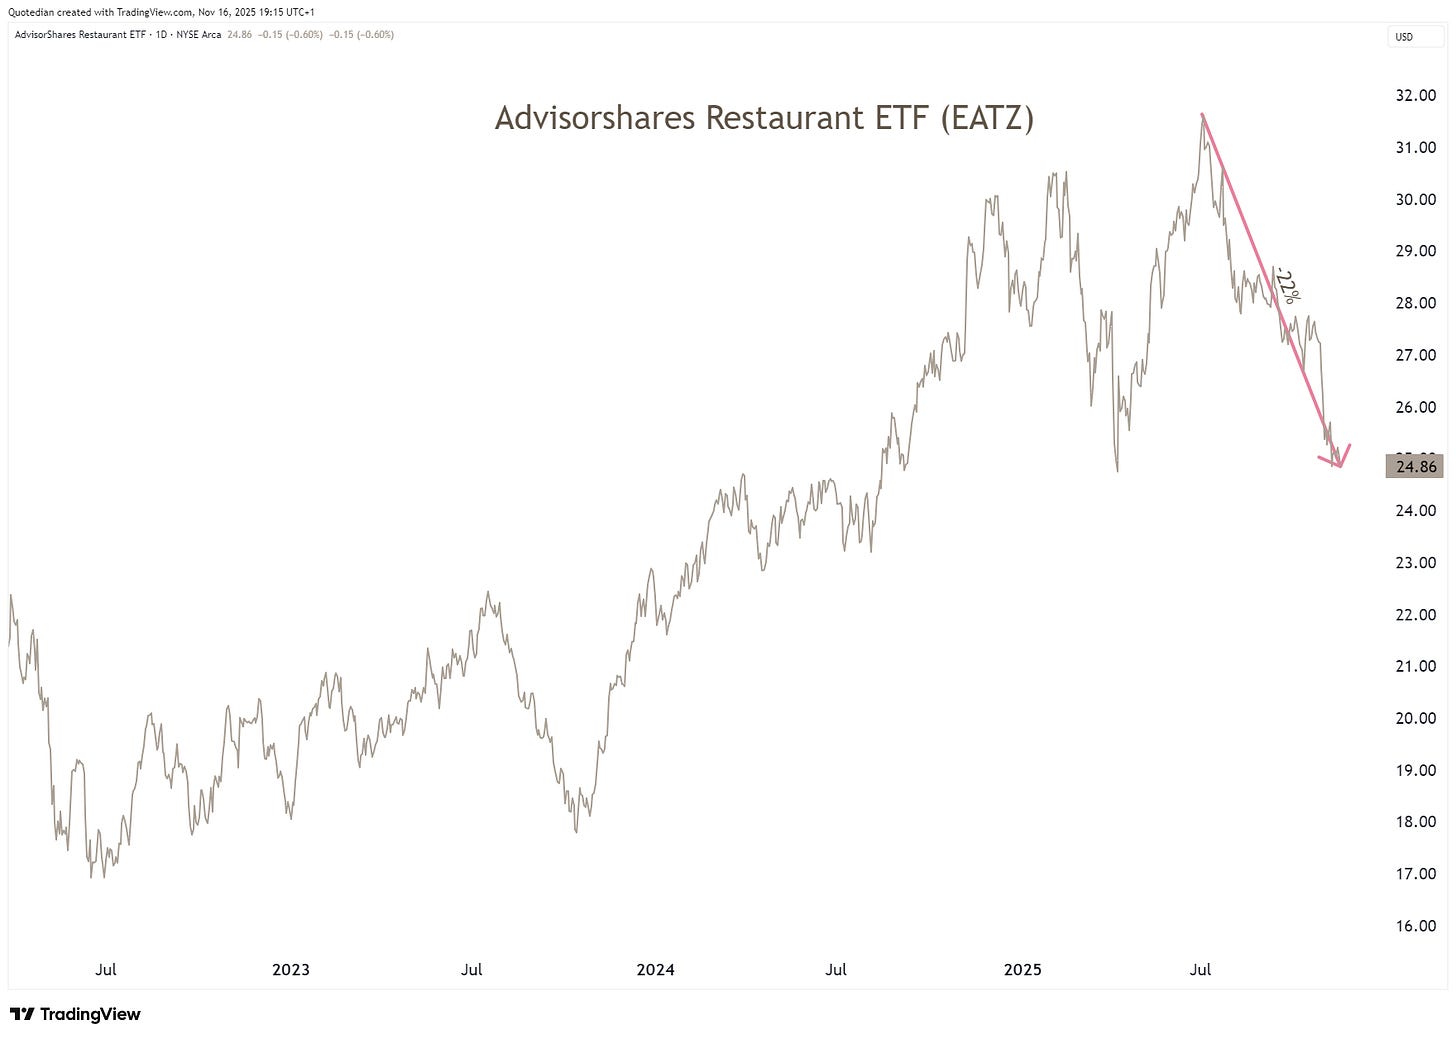
Is this why Restaurant shares are already in a bear market (> -20%), as fewer ‘normal’ households can afford to eat out?
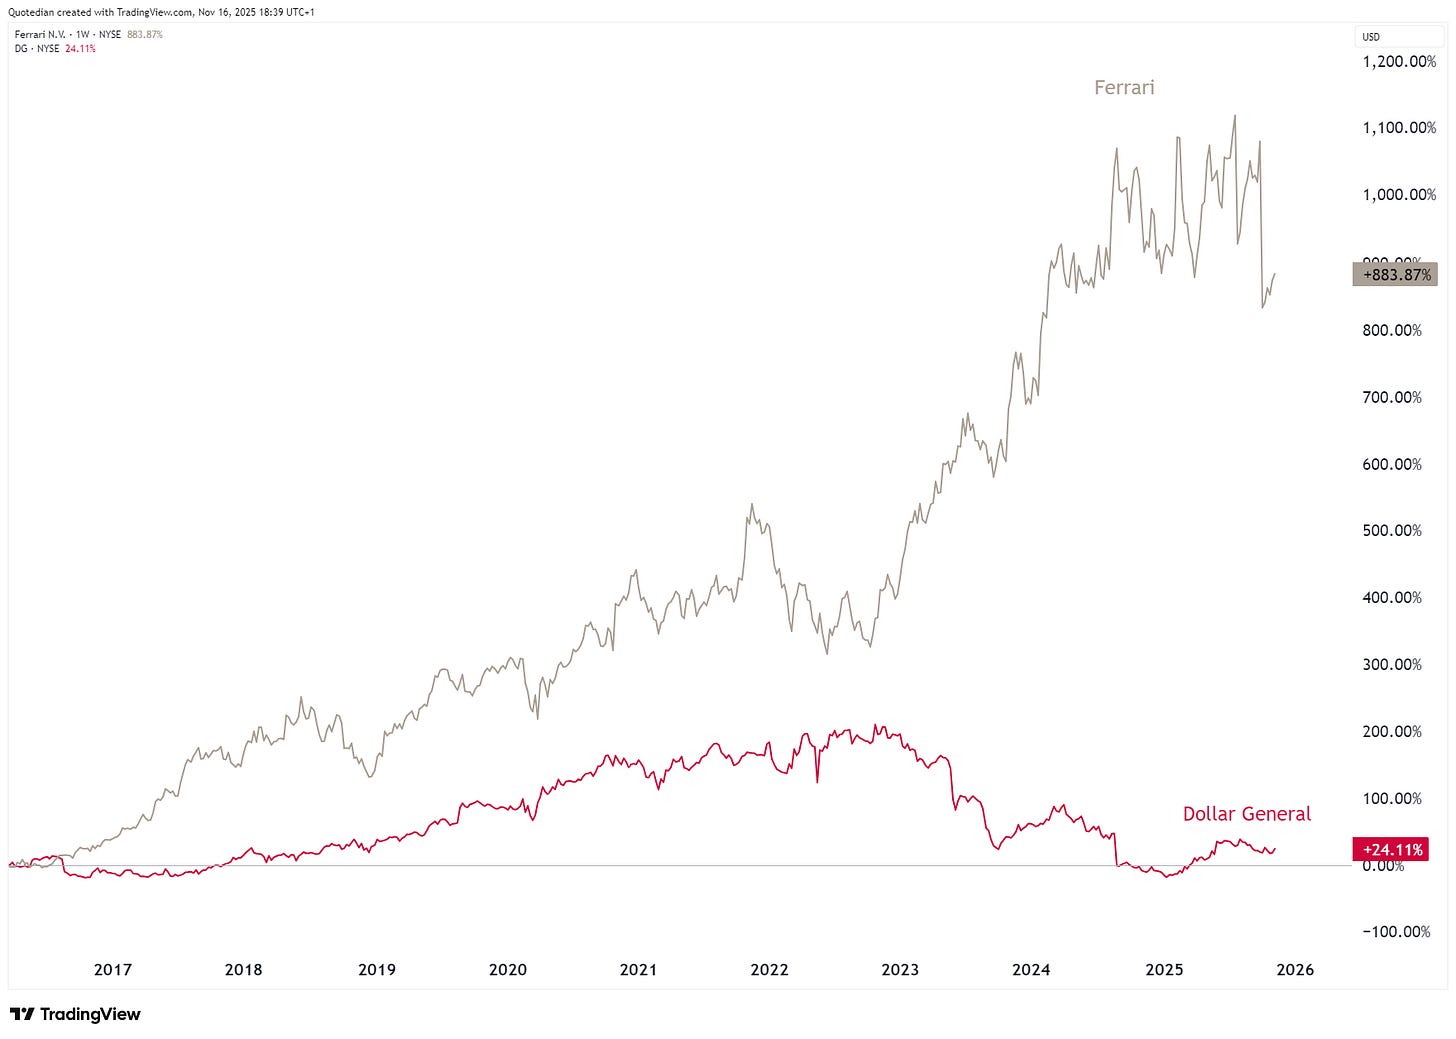
As the ultimate insult, “rich” Ferrari stocks, have been outperforming “poor” Dollar General stocks by a wide margin:
Is the K going to go Pop soon?
Perhaps not soon. But as Yoda would say:
OK, enough of K, let’s start our weekly cross-asset review, to try and find out where markets are heading.
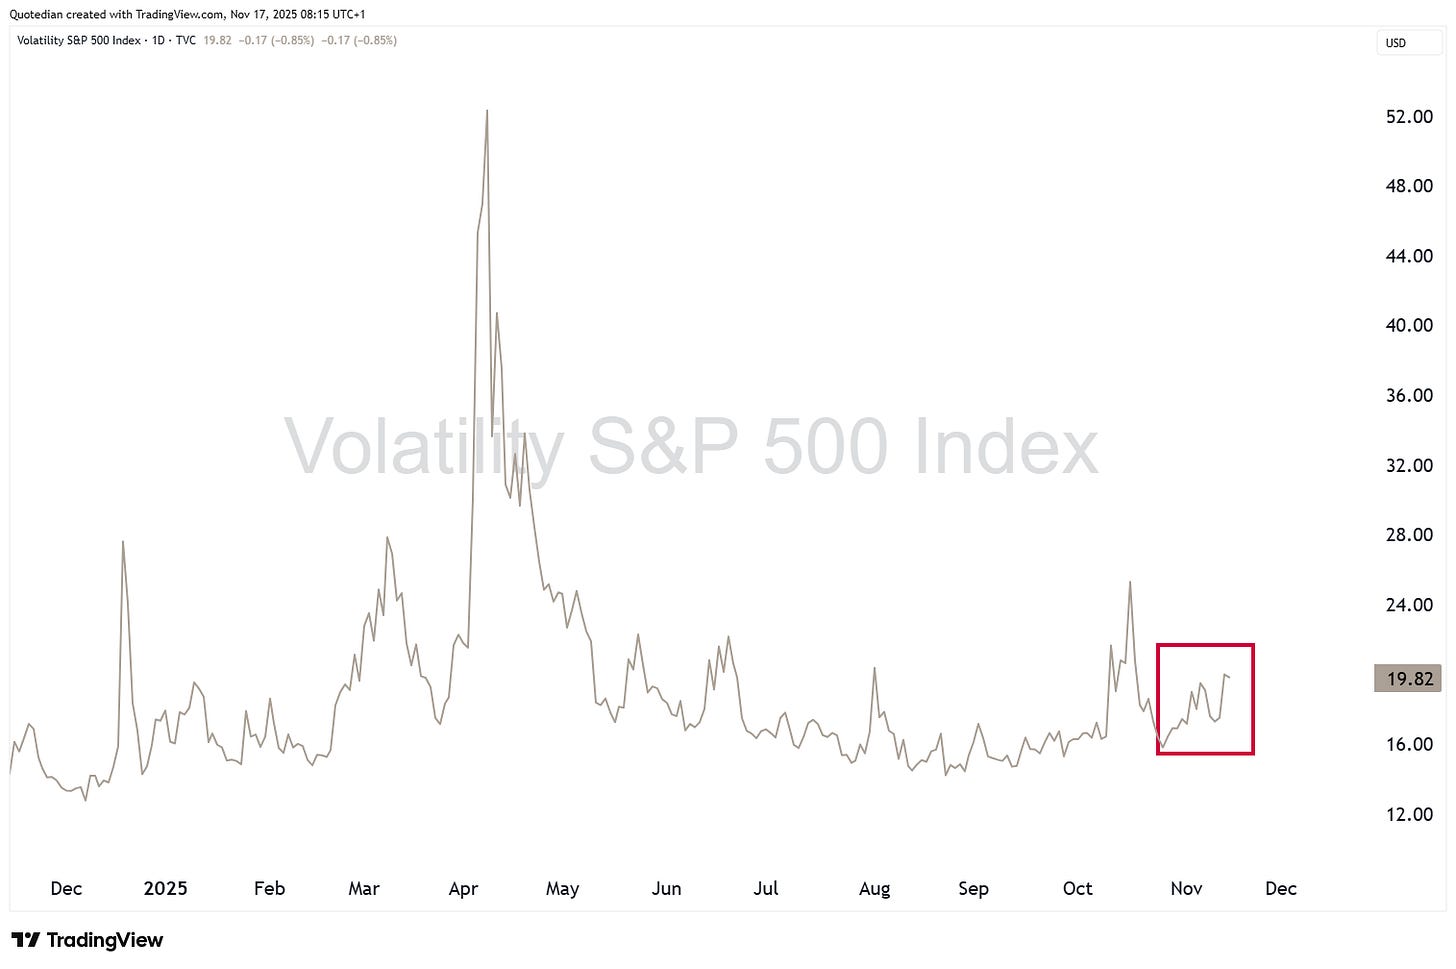
Starting with equities, volatility has been picking up over the past two weeks,
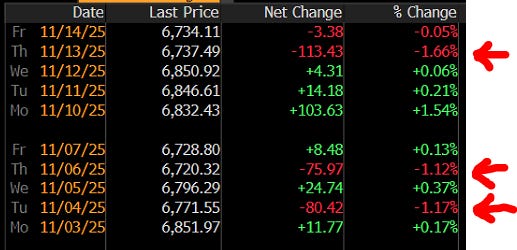
with several drawdowns in excess of one percent registered on the S&P 500:
Growth stocks, as measured by the Nasdaq-100, faced even higher volatility and drawdowns in the region of two percent:
So, should we dive into our trenches and buckle up our helmets, or is this yet another buying opportunity? Risking a lot of egg on my face, I probably would say it is safe to assume that the latter is the case.
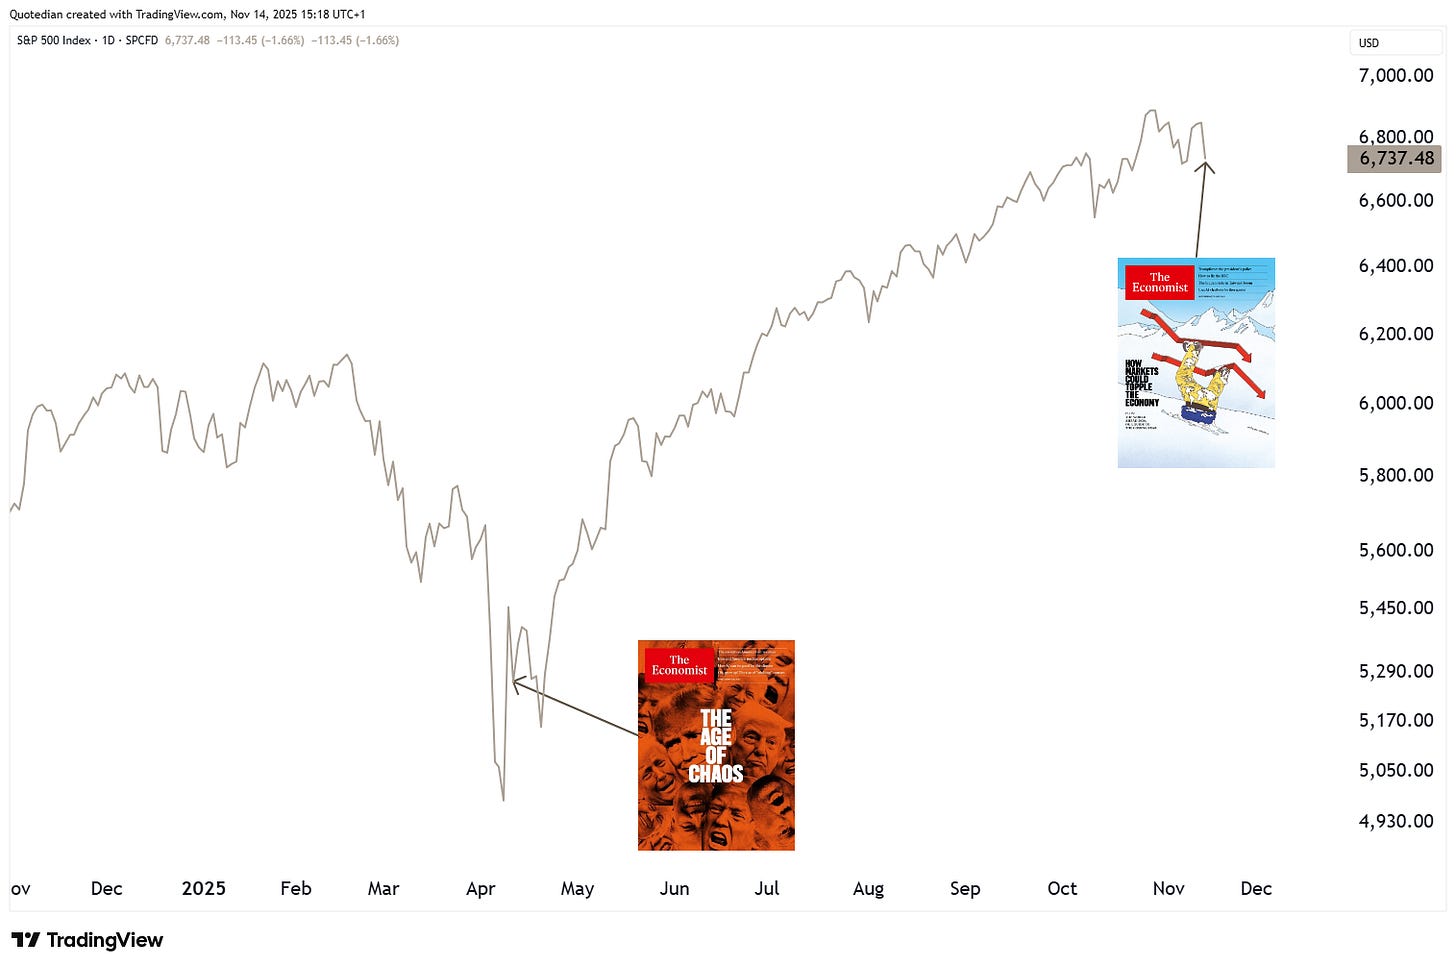
Not least, due to The Economist Magazine Cover Contrarian Indicator. This was out on Thursday:
Just to give same context, this is what The Economist wrote in mid-April:
For even more context, let me put those onto a S&P 500 chart:
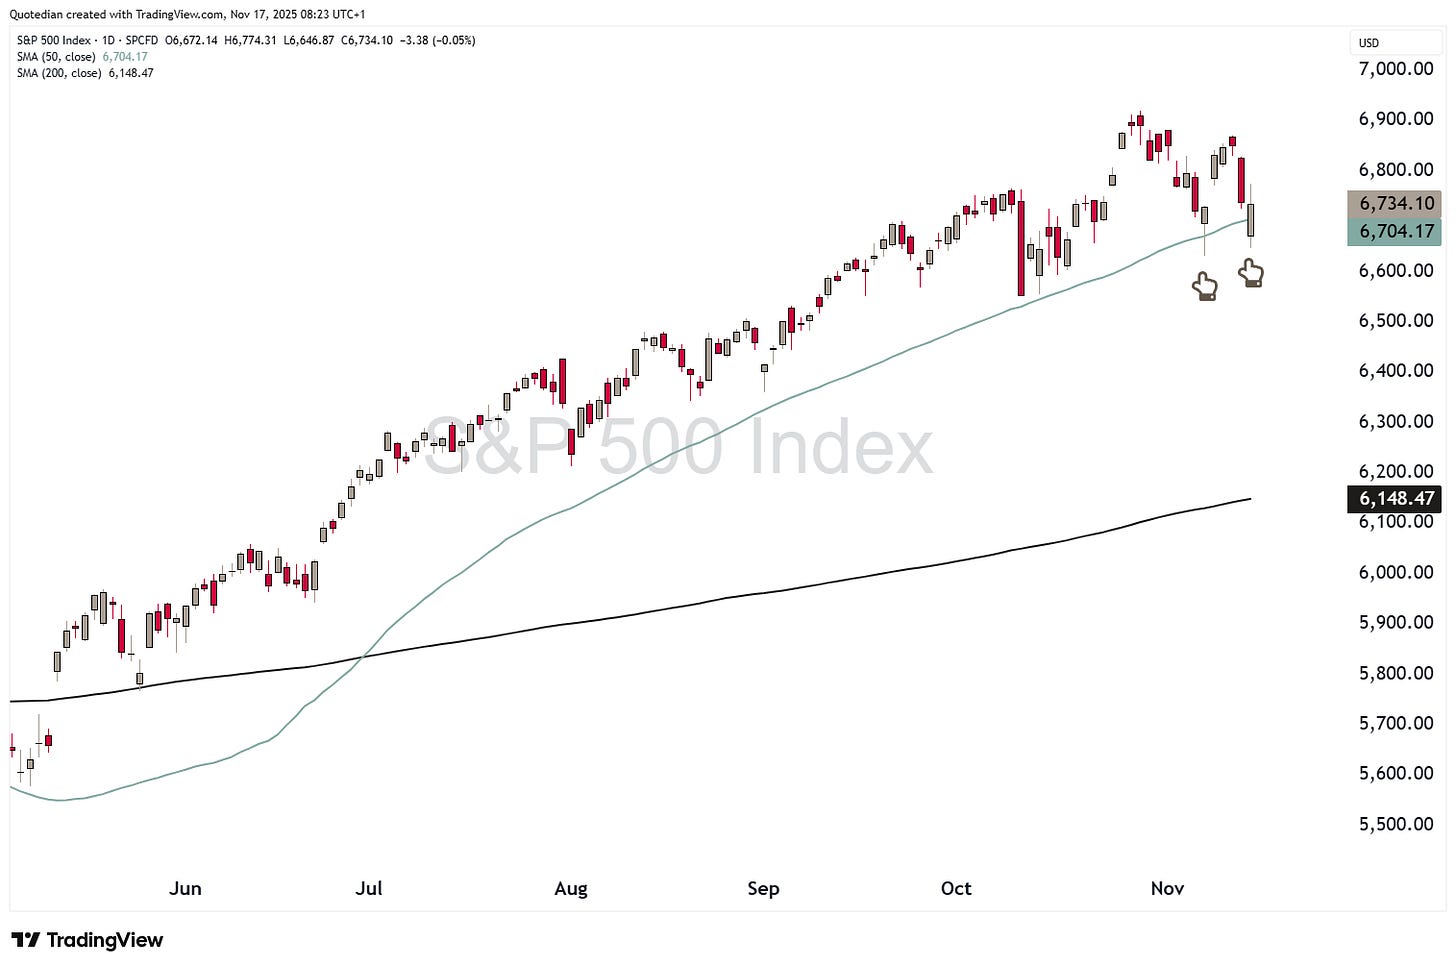
Maybe even more importantly, have sellers tried to push the S&P 500 below its 50-day moving average twice now over the past two weeks, and failed miserably:
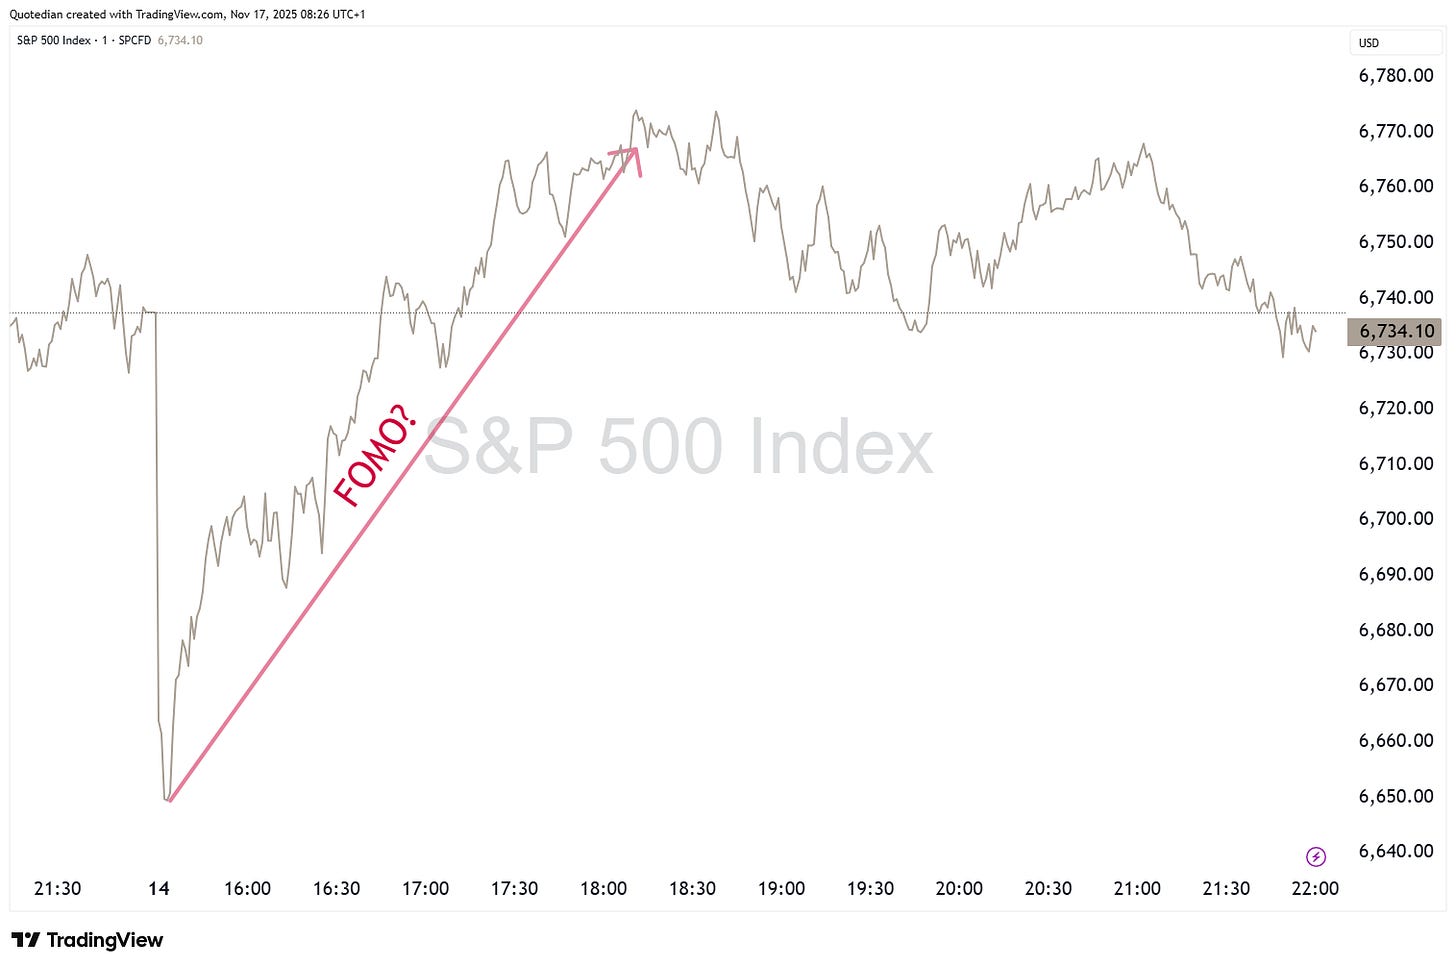
Especially Friday’s rally seemed to show already some signs of panic buying shortly after the weak opening:
Seasonality is in favour of stocks not falling much further from here. Consider the following graph, which shows that December tends to have the highest percentage number of new highs:
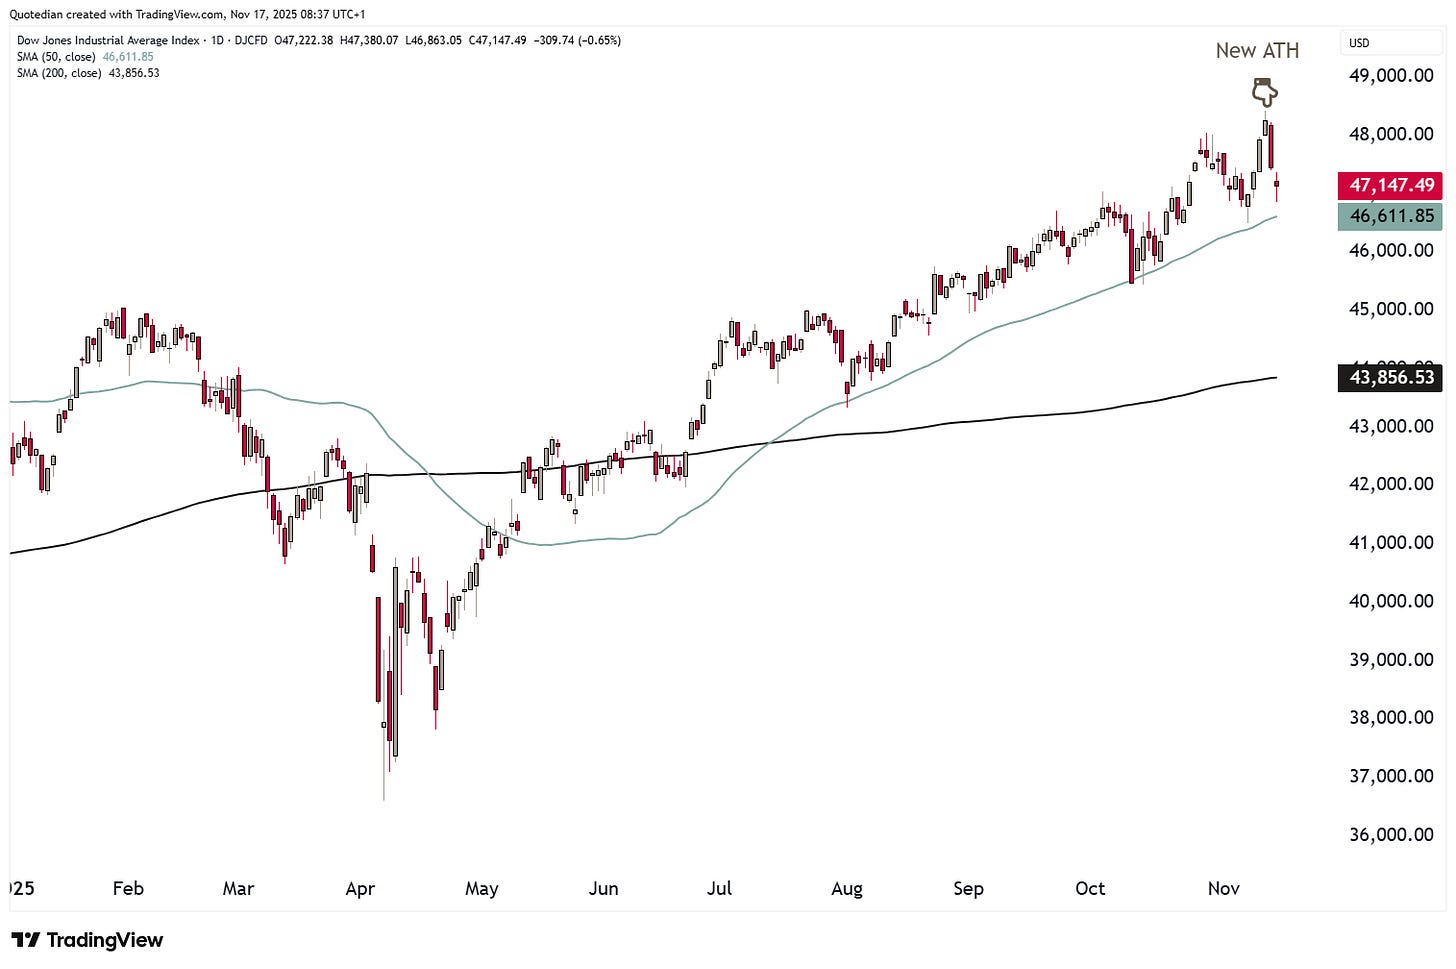
In that context, remember that the Dow Jones Industrial Index (aka Papa Dow) hit a new all-time high (ATH) only two sessions ago:
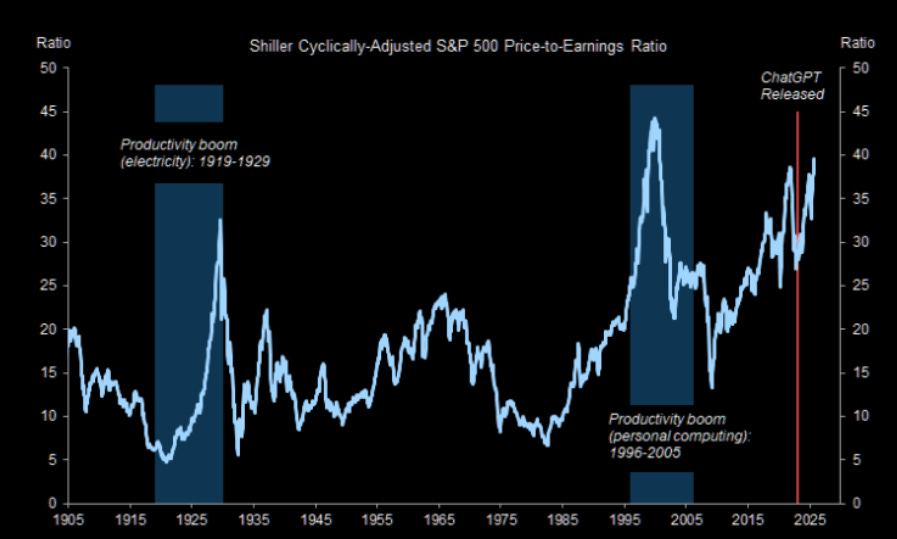
But not everything is rosy, as valuations (not a timing tool) continue to be elevated. As legendary investor Howard Marks recently put it bluntly:
“When you buy the S&P 500 at a 23x P/E, your 10-yr annualized return has always fallen between +2% and –2%, IN EVERY CASE, EVERY CASE.”
Today the market sits at a 25x P/E. Add inflation… and your “returns” are negative. The chart shows Shiller adjusted PE that is also high...
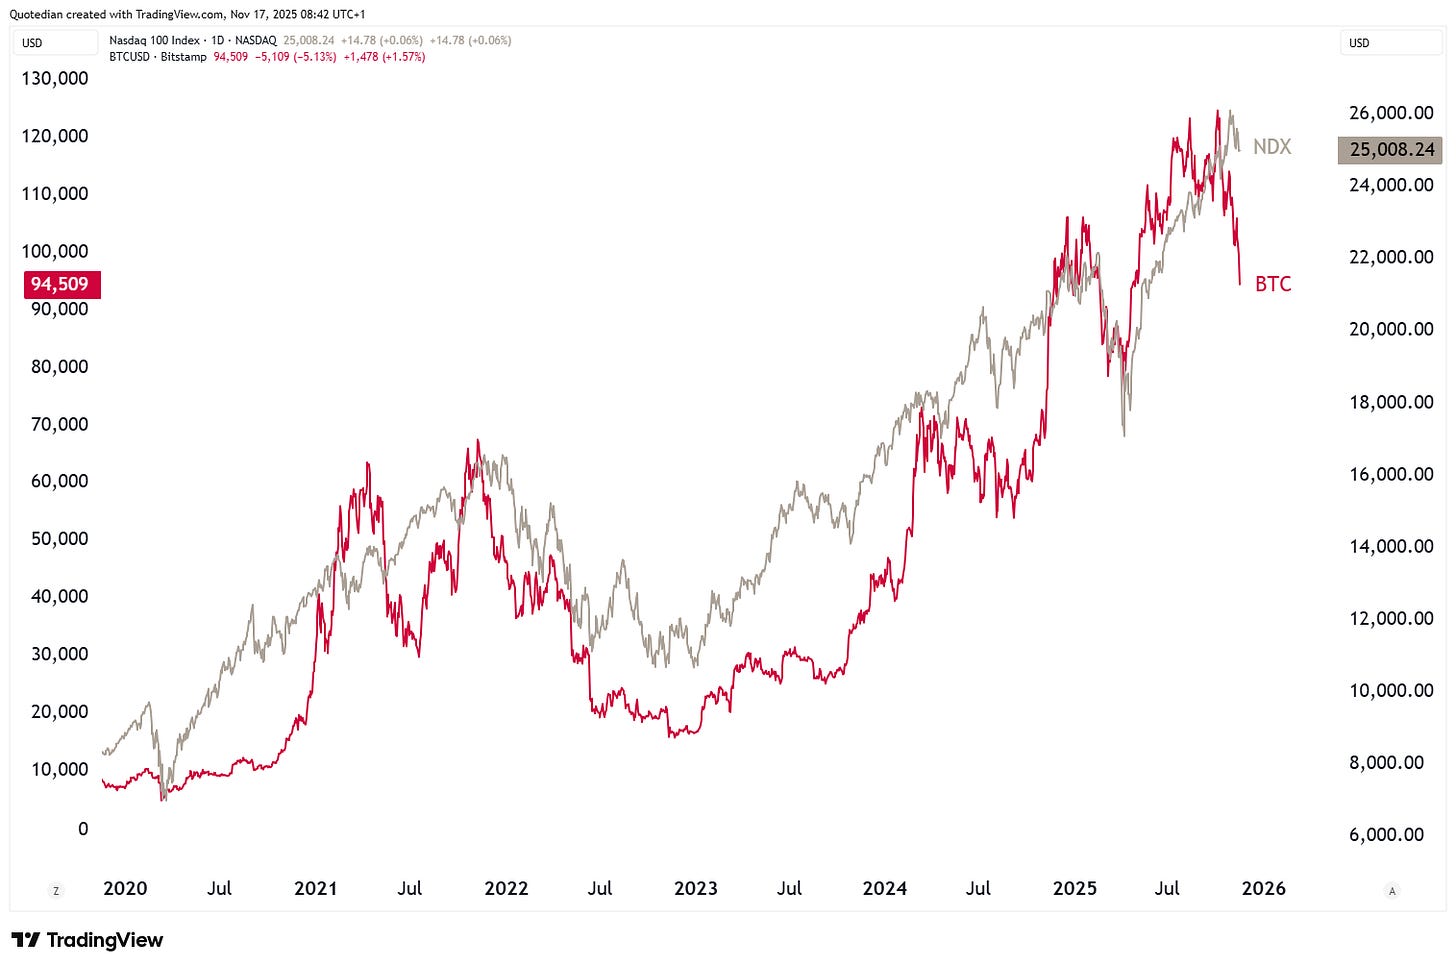
The divergence between growth stocks (NDX) and Bitcoin (BTC) also continues to be a source of concern:
Though as we discuss in the currency section further down, this may be a more Bitcoin-related problem, rather than a liquidity/risk-off issue.
In Europe, the broad STOXX 600 index (SXXP) also just hit a all-time high only last Wednesday:
The drift/uptrend higher looks very much intact.
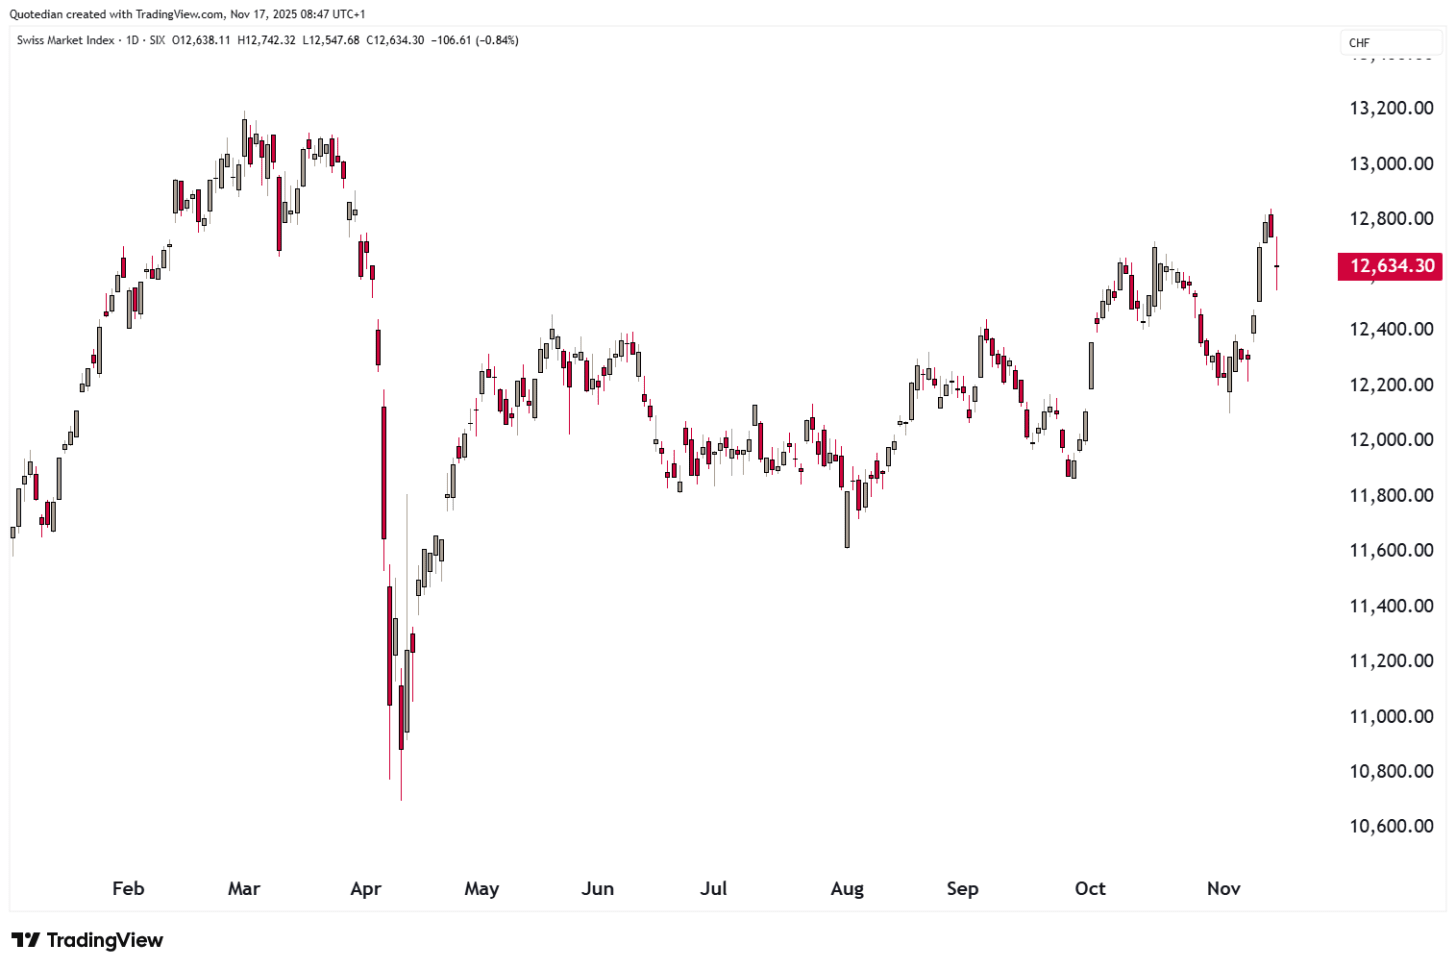
Switzerland’s SMI is up nearly five percent over the past two weeks,
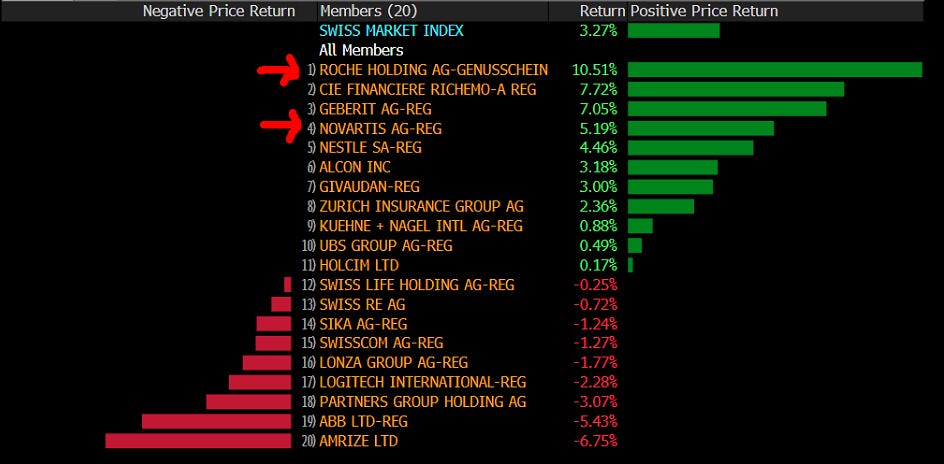
as health care stocks (also see sector section below) are waking up:
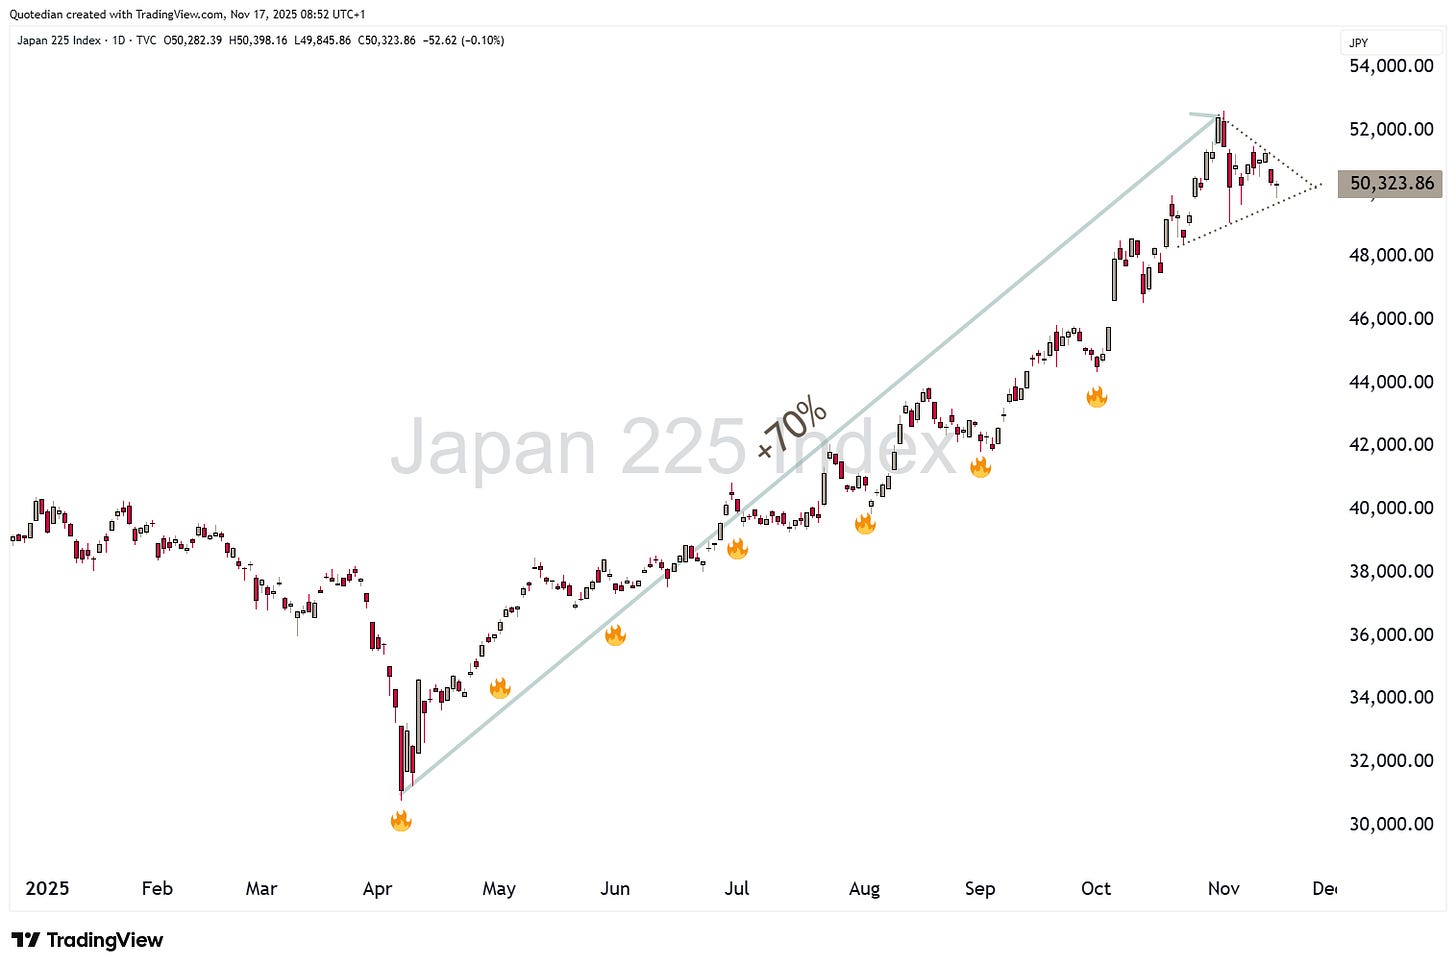
In Asia, Japan’s Nikkei is taking a breather, after it had been “on fire” since April, producing a 70% rally from the lows:
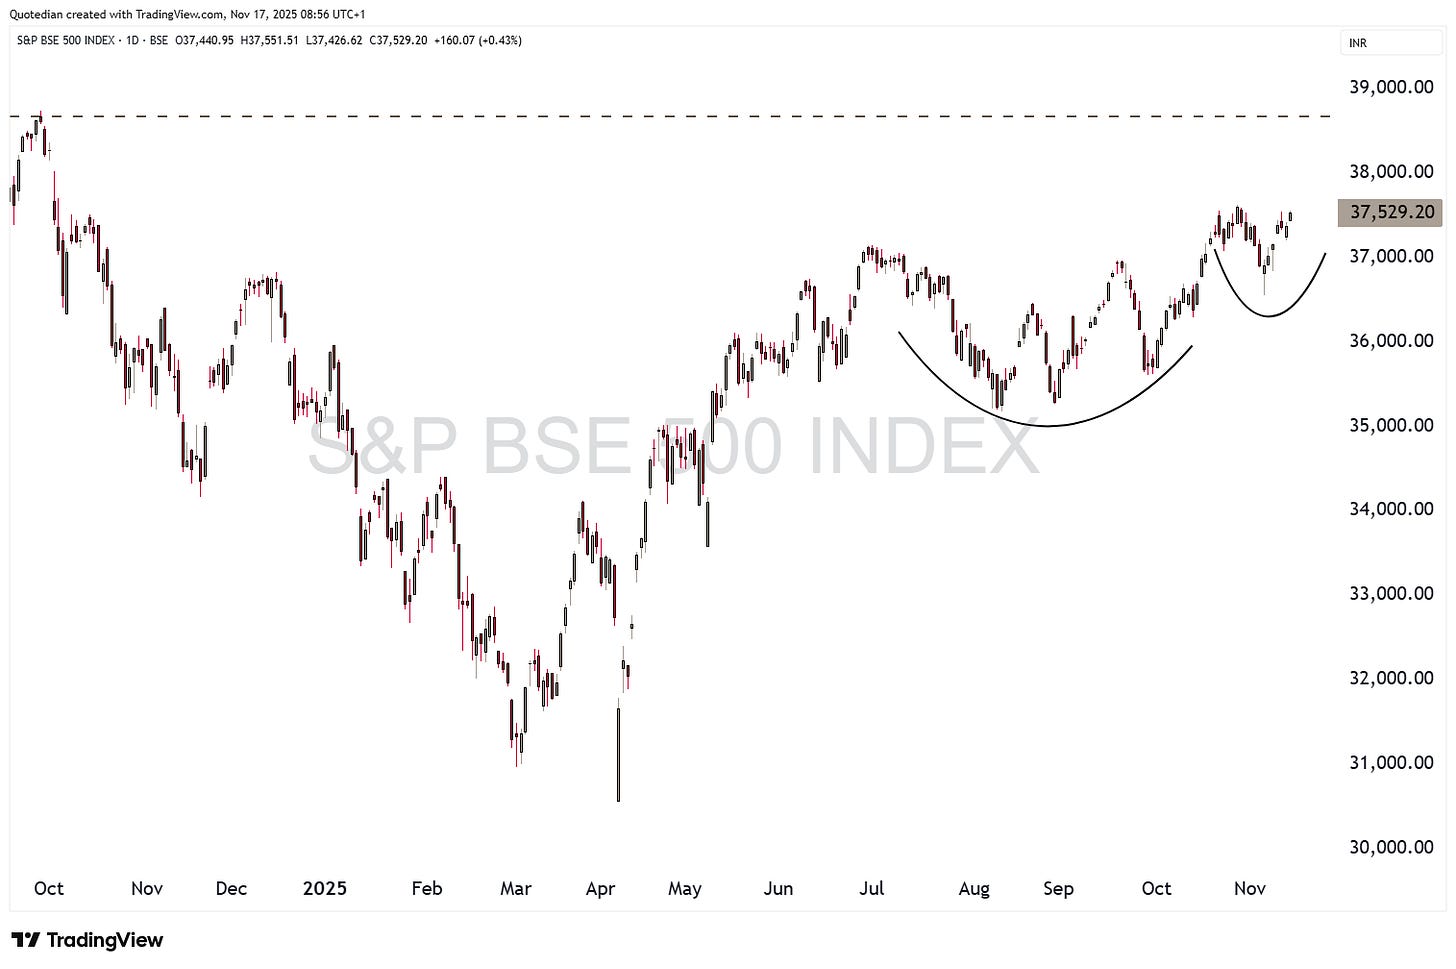
Indian stocks (BSE500) have been one of the worst performing markets over the past year, but are now only three percent from a new ATH away:
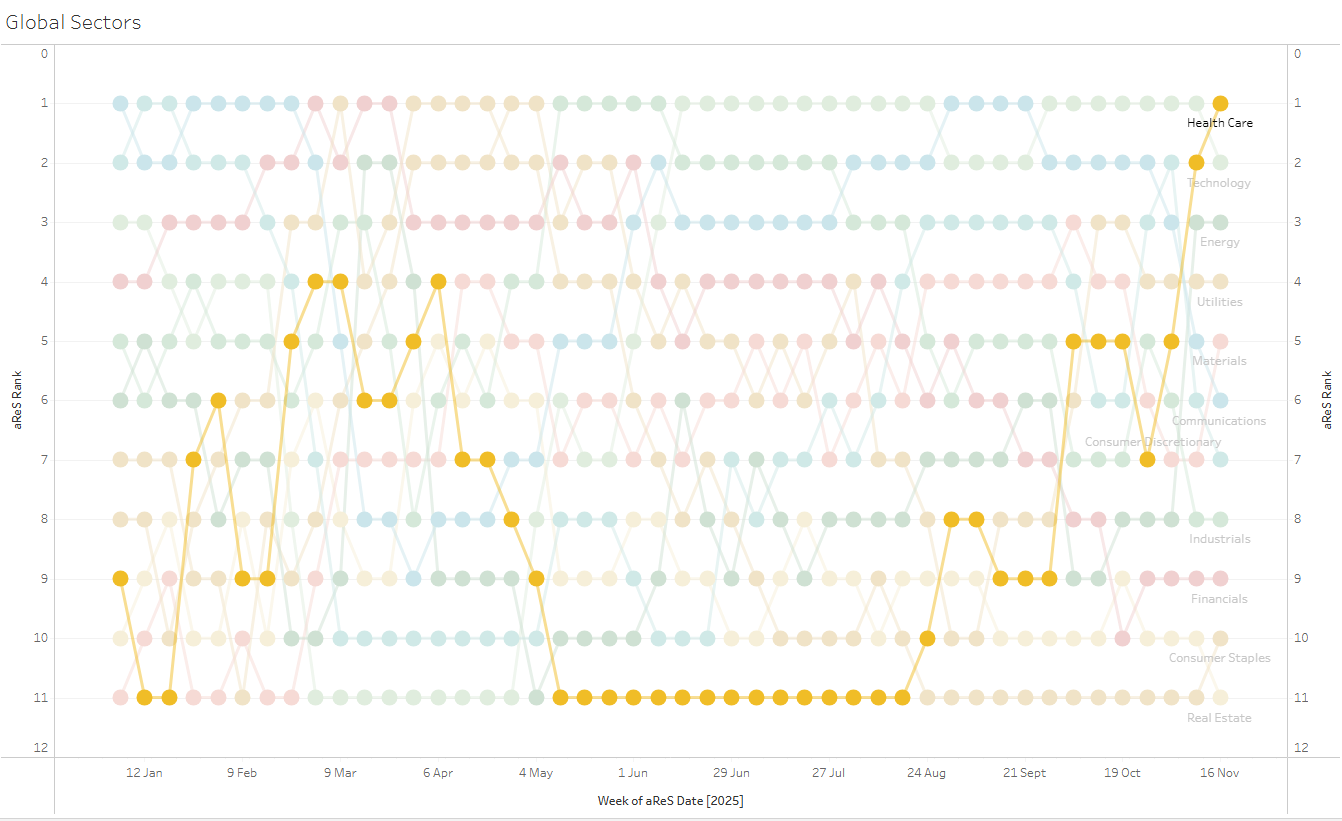
Turning to sector performance, and as mentioned above, health care stock performance has recently been shooting out the lights:
The sector is after a rocket-like ascent now topped ranked in our aReS model. Does this mean it is time to take profits?
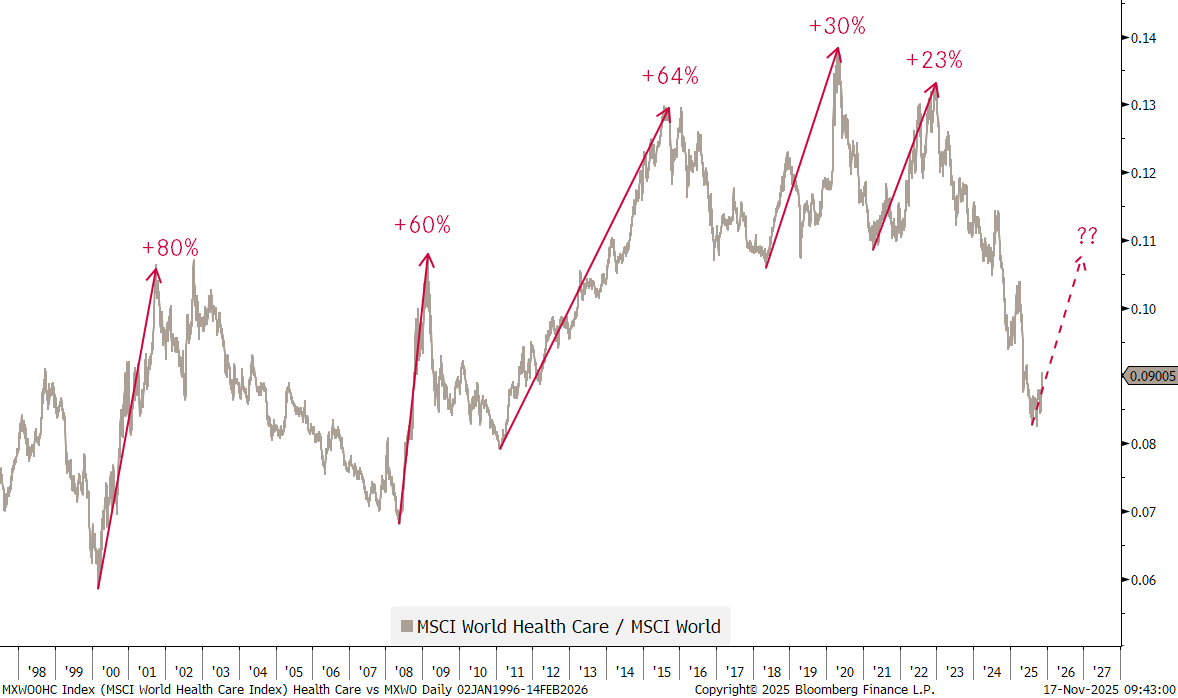
If history is any guide, and it usually is, the answer is no, looking at this ratio chart of MSCI World Health Care divided by MSCI World stocks:
I.e., lengthy periods of underperformance by health care stocks were followed by periods of strong outperformance.
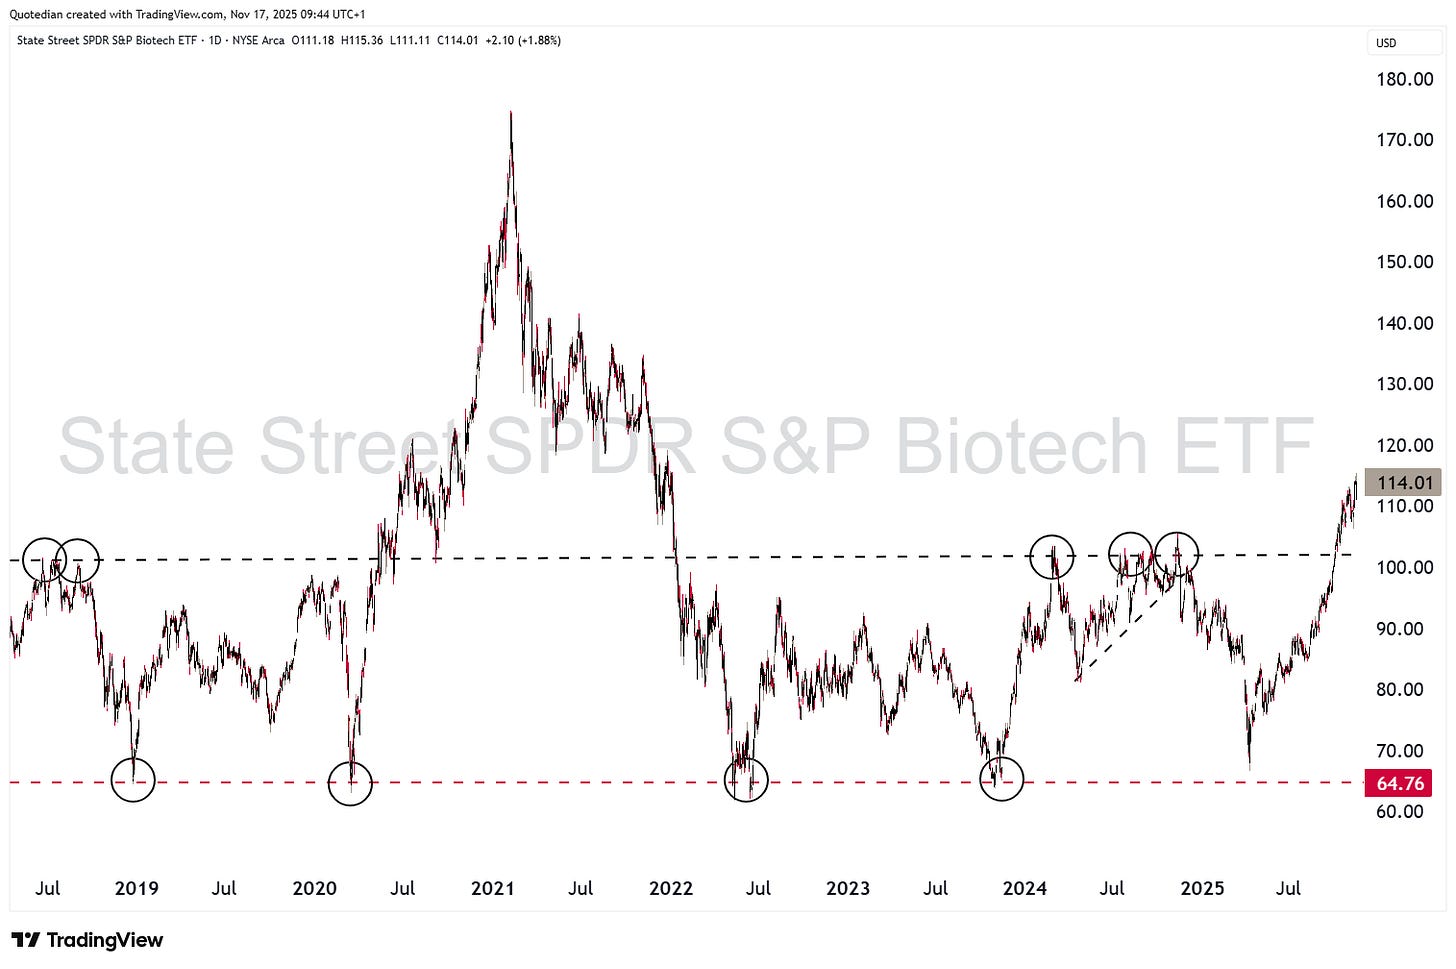
And Biotech stocks, a subsegment of the health care sector, have also just broken out of a multi-year range:
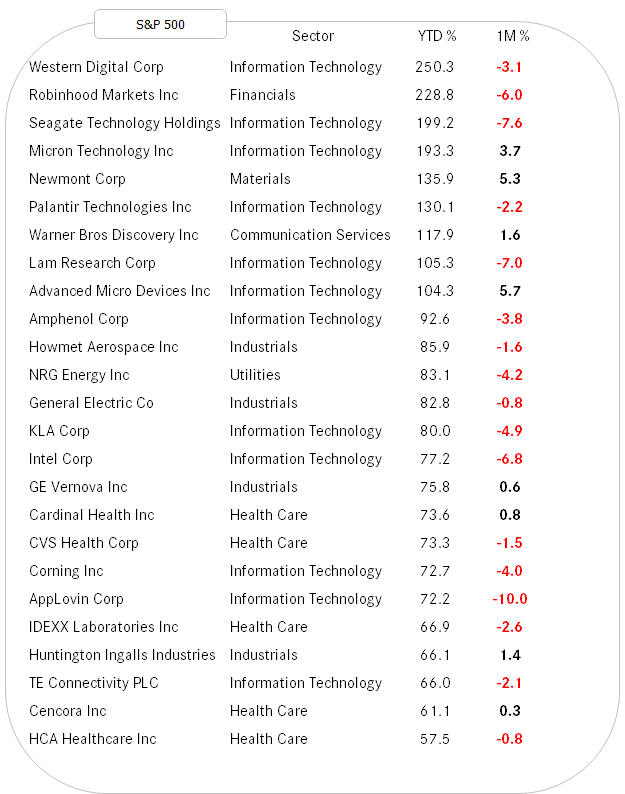
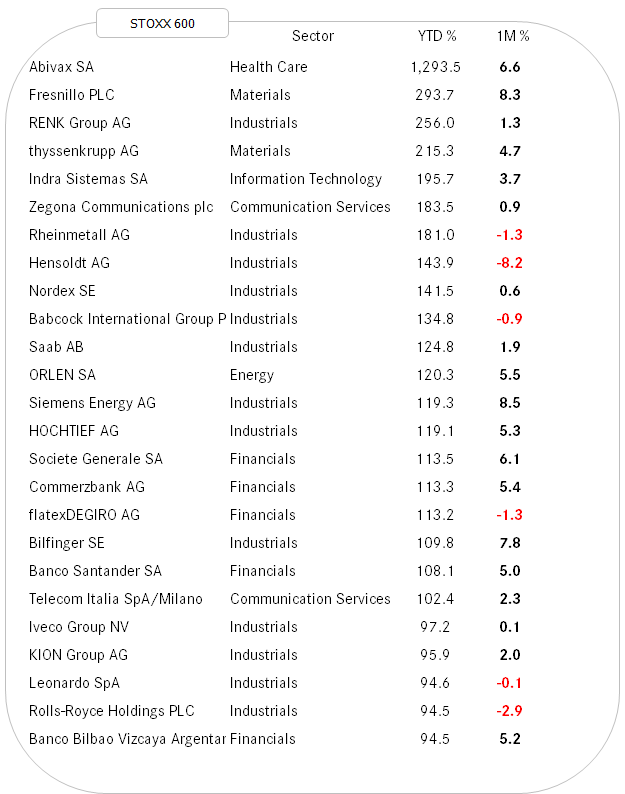
Finally, to round of the equity section, here are the two tables of the best performing stocks year-to-date in the US (S&P 500) and Europe (STOXX 600) and how they have fared over the past trading week:
Many of the US winners have seen some important corrections. Interesting enough to increase exposure again? Probably.
Here’s the European list, showing that the correction was much more muted than in the US:
One of the reasons excuses for the equity sell-off last week was a some Federal Open Mouth Committee operations. In prepared comments during his October 29 presser, Fed Chair Jerome Powell stated,
“A further reduction in the policy rate at the December meeting is not a foregone conclusion—far from it. Policy is not on a preset course.”
He was clearly pushing back against the widespread view that another rate cut would occur before the end of this year. On Friday, the odds of that happening had dropped from nearly 70% at the end of October,
to less than 50% (i.e., 43.2%):
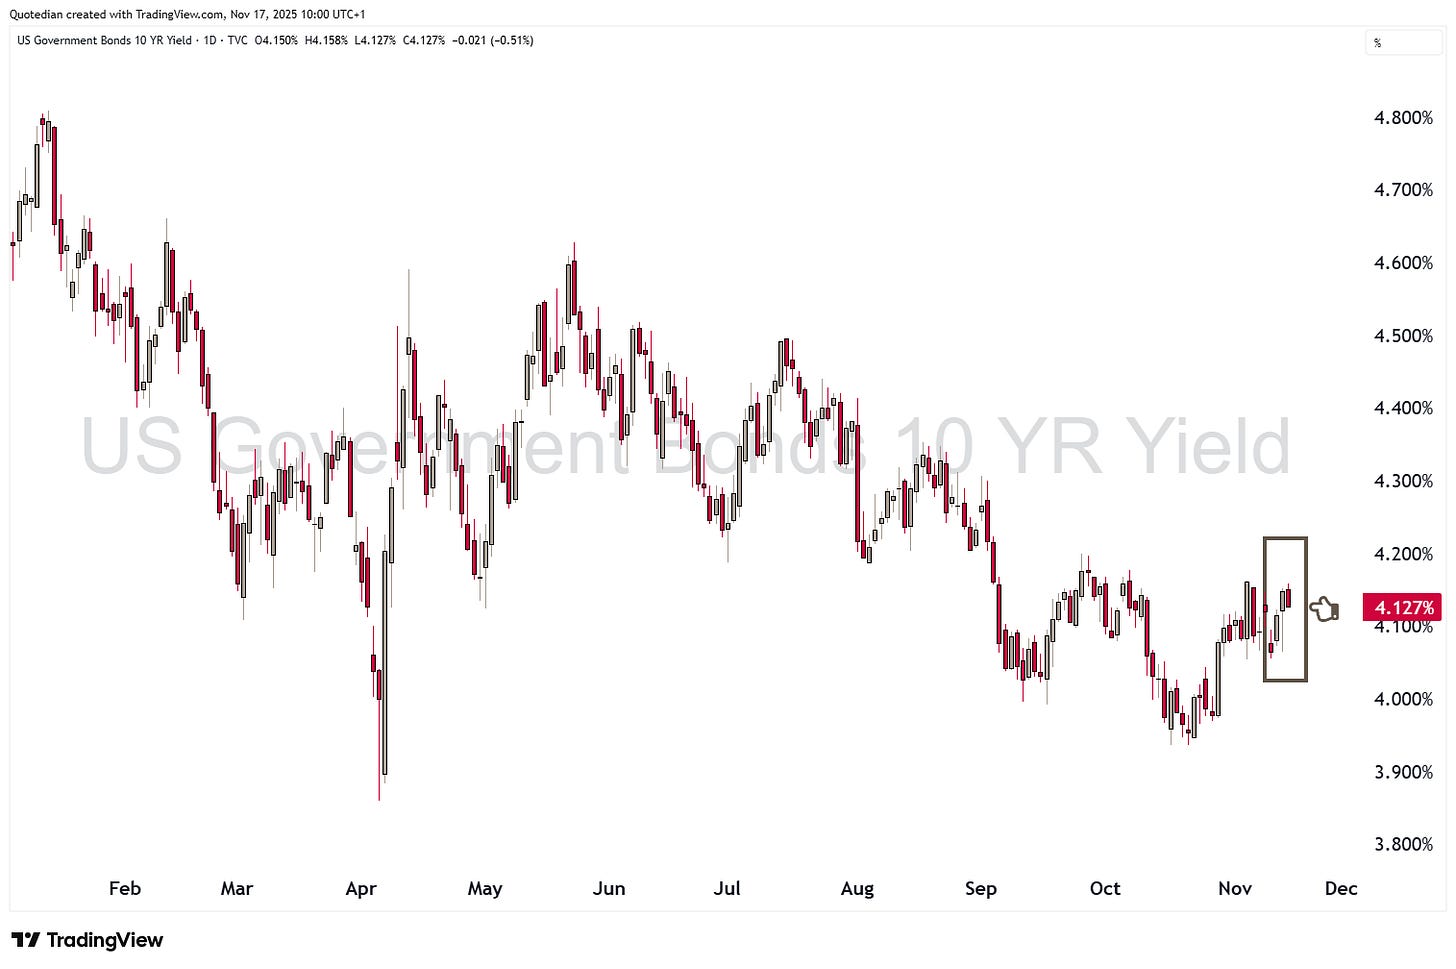
Not only did stocks sell-off, but bonds too, with the yield on the 10-year Treasury for example rising by nearly ten basis points over two sessions:
German Bund yields, as proxy for Euroland rates, rose in sympathy,
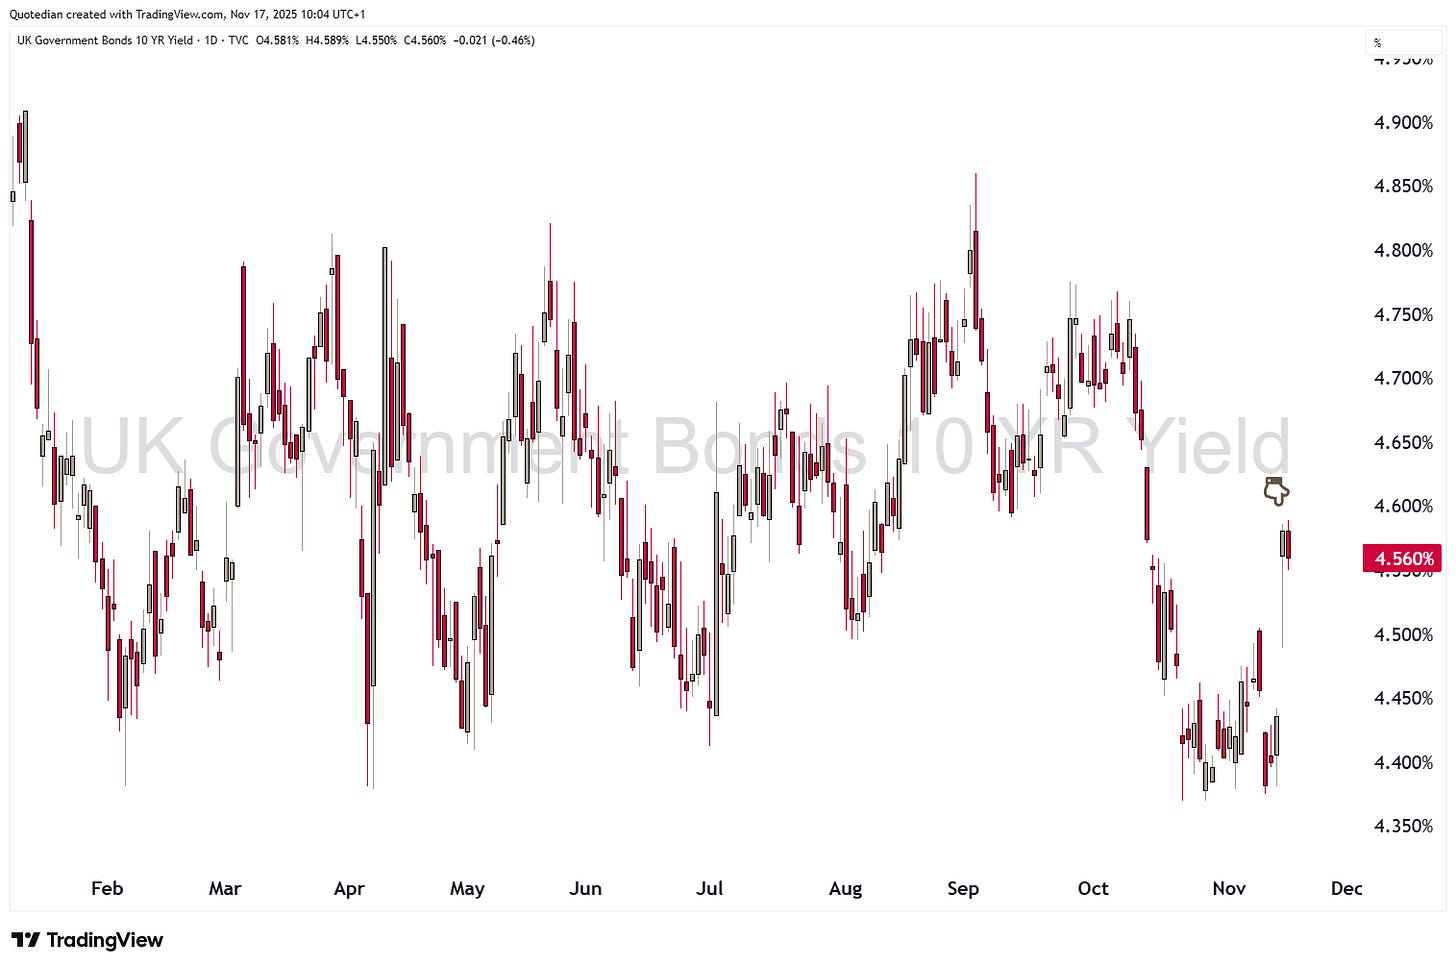
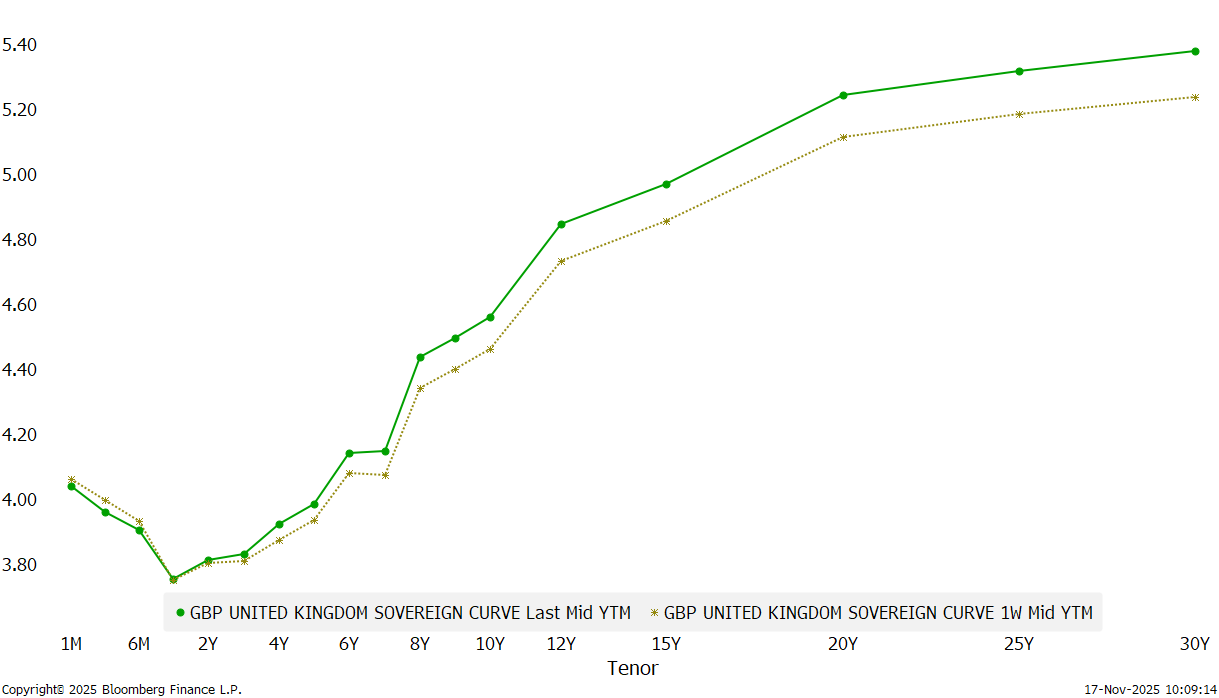
but the real drama happened in the UK Gilt market, where 10-year yields jumped 15 basis points on Friday,
as the bond vigilantes rebelled on reported U-turn on income tax rises by Chancellor Rachel Reeves.
The yield curve jumped especially at the economic sensitive long-end,
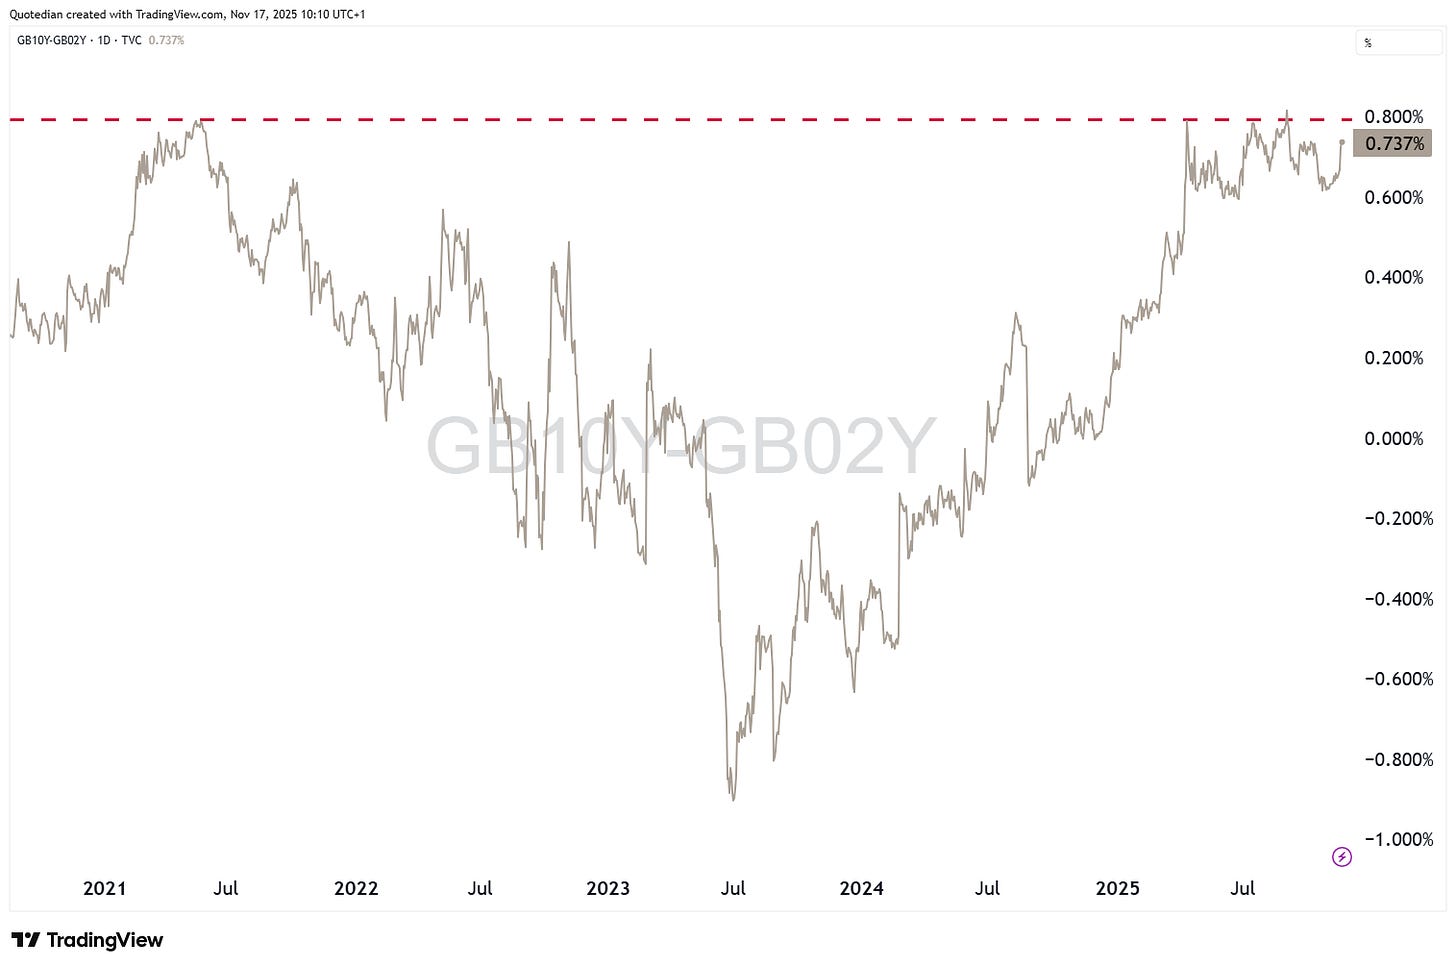
leading the curve (10y-2y) to be at one of its steepest levels of the past few years:
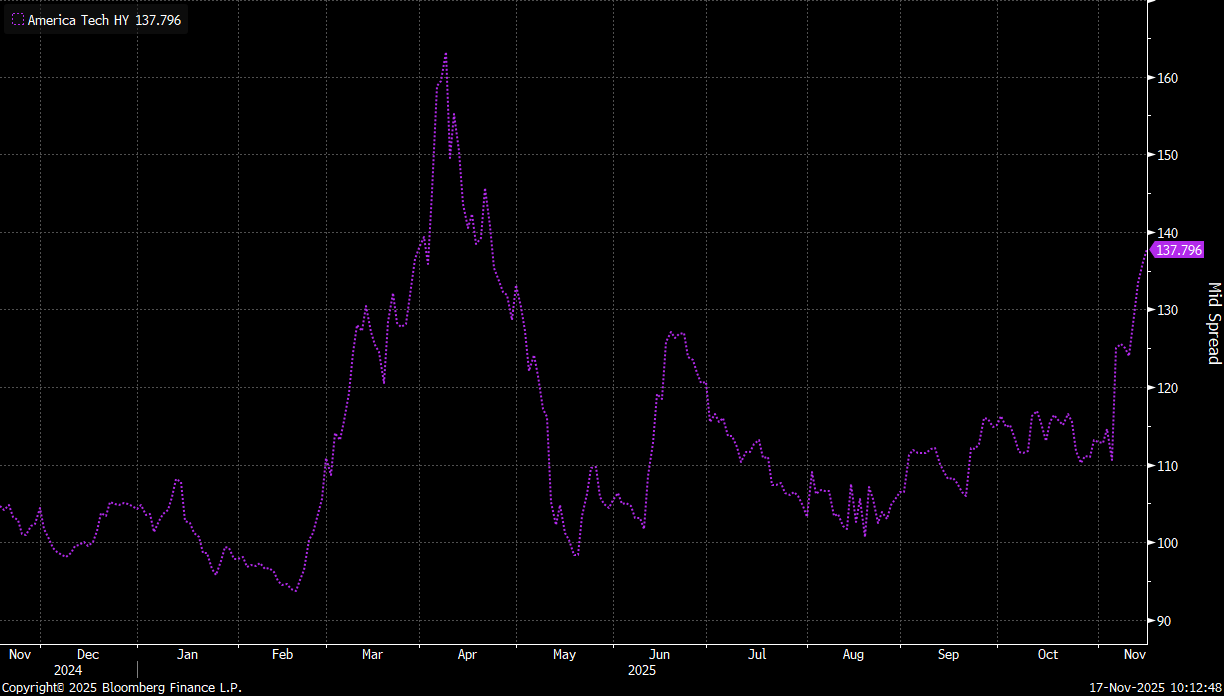
Some of the stress seen in the tech sector via equity performance is also visible in bond markets, where for example cost to hedge the default of high yield tech companies has risen sharply since the beginning of this month:
This is surely also due to the AI sector starting to “feed” itself with orders and money:
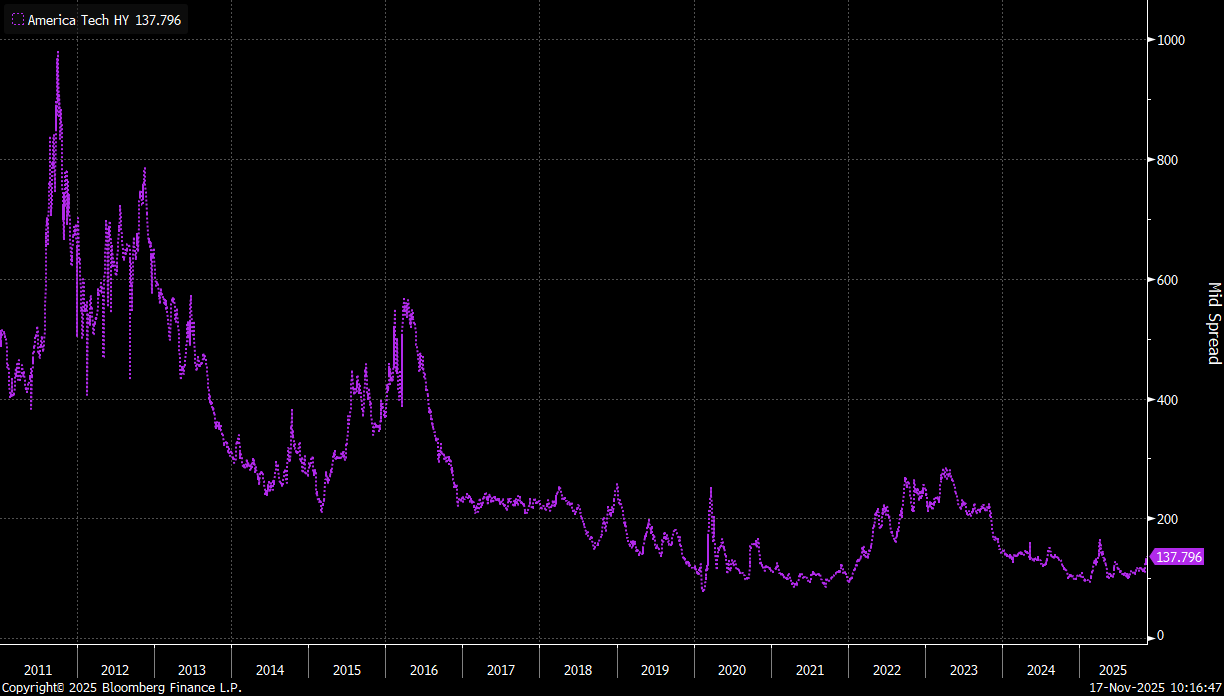
However, context is also important here. Zooming out on the same graph as above, shows the relative calm still reigning in the HY CDS sector:
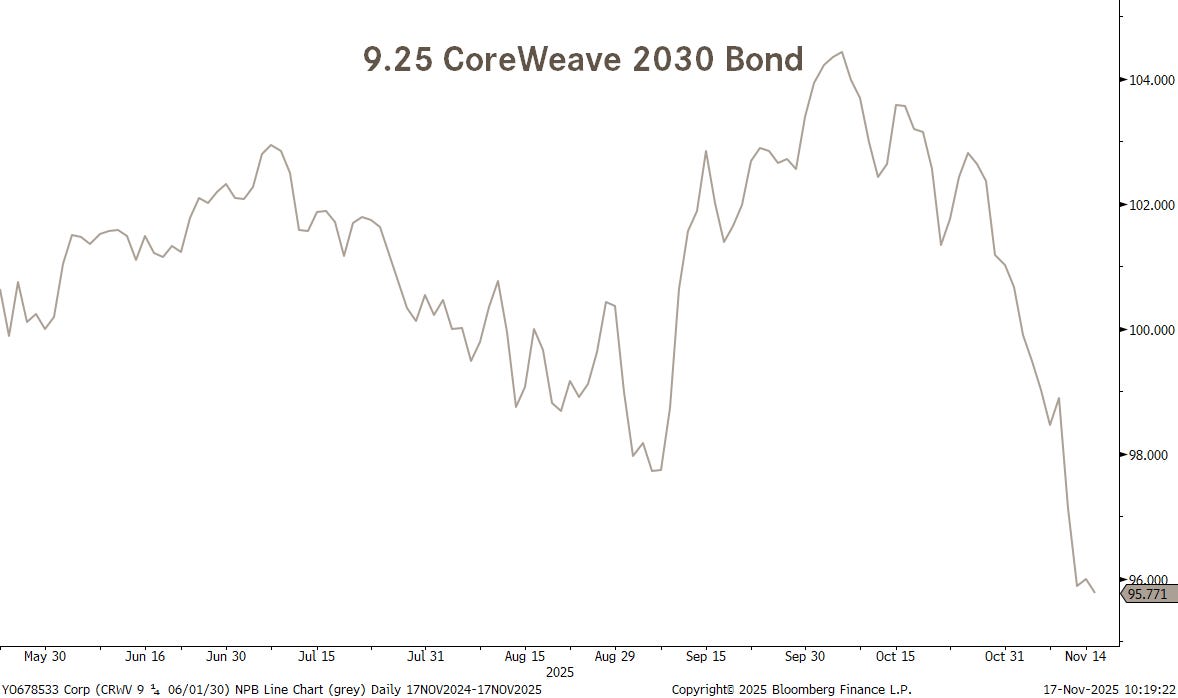
Still, a CoreWeave bond with a coupon of 9.25% and maturing in June of 2030, pays a juicy yield of 10.5% post the sell-off:
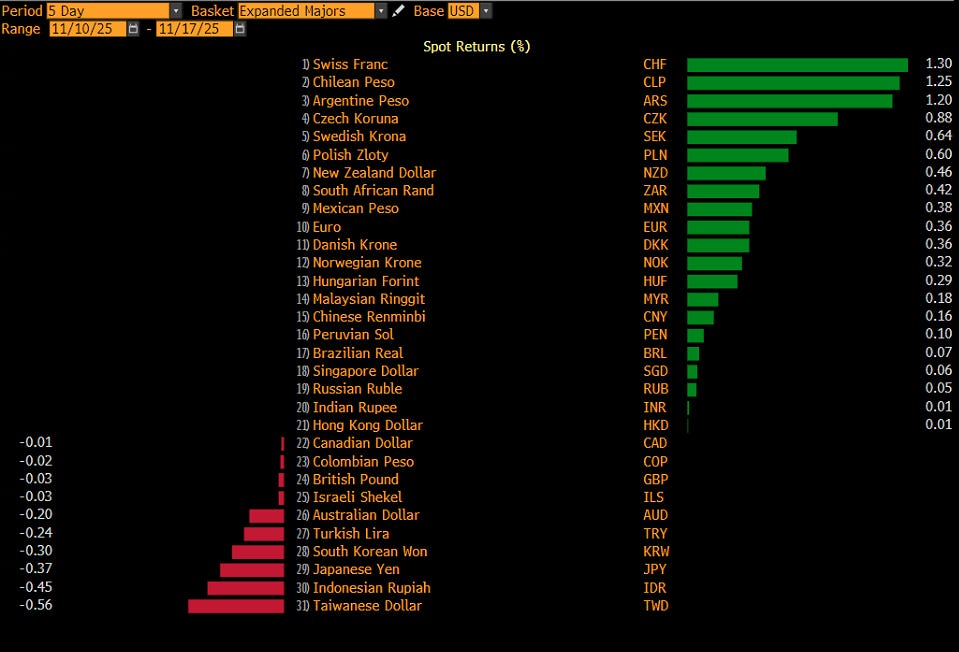
In (fiat) currency markets, the US Dollar has been softer against most other major currencies:
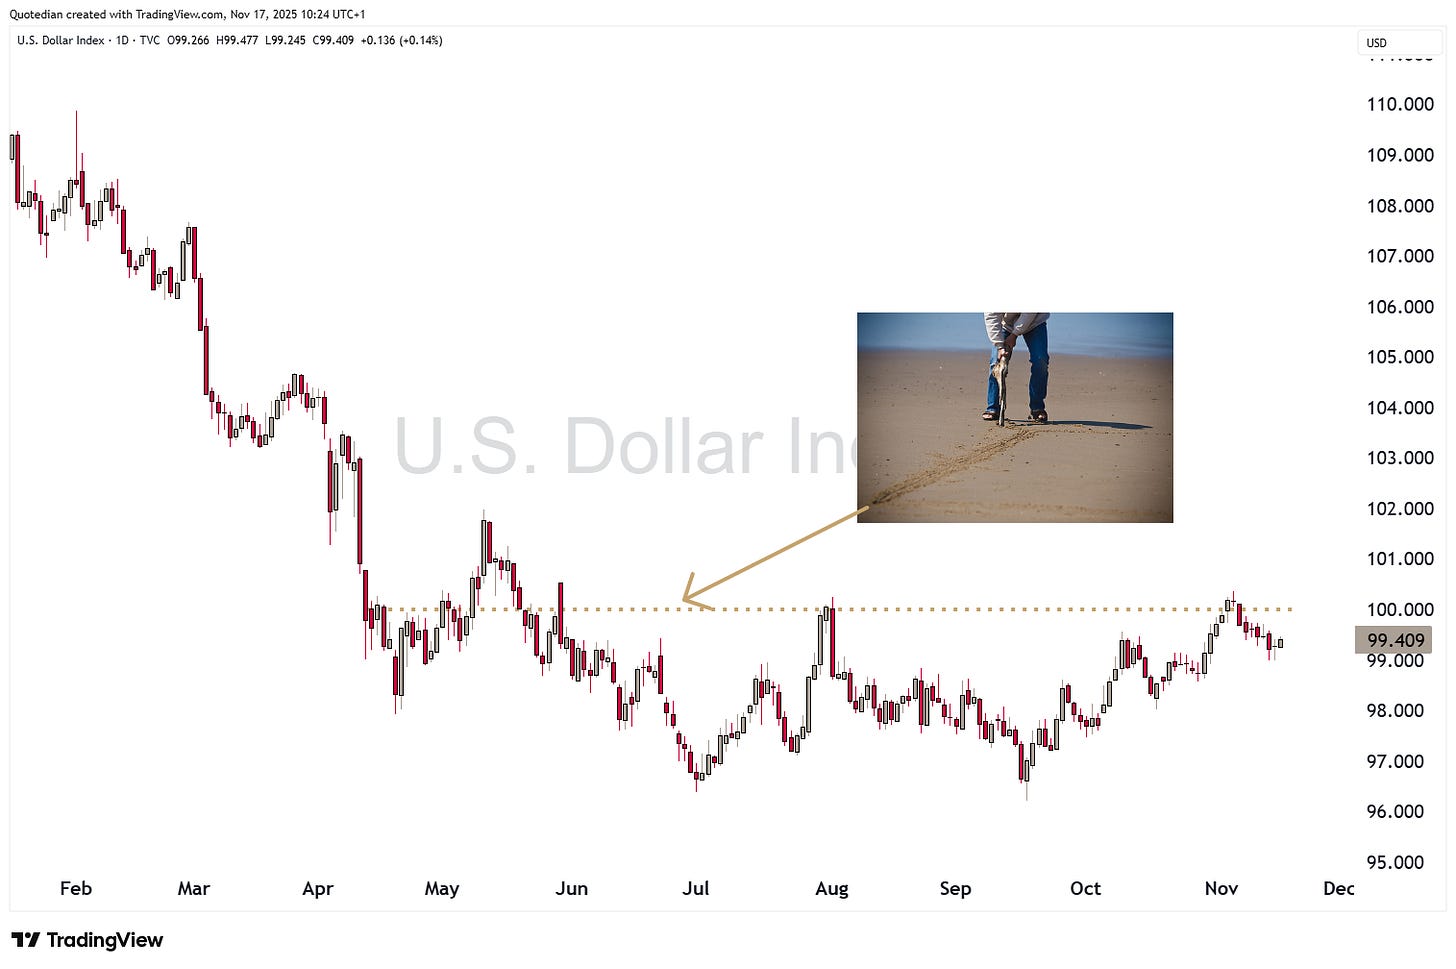
This is then also reflected in the chart of the US Dollar index (DXY), which has been retreating from our “line in the sand”:
I insist: nothing to be done here between 96.00 and 100.00 - only trade a breakout on either side.
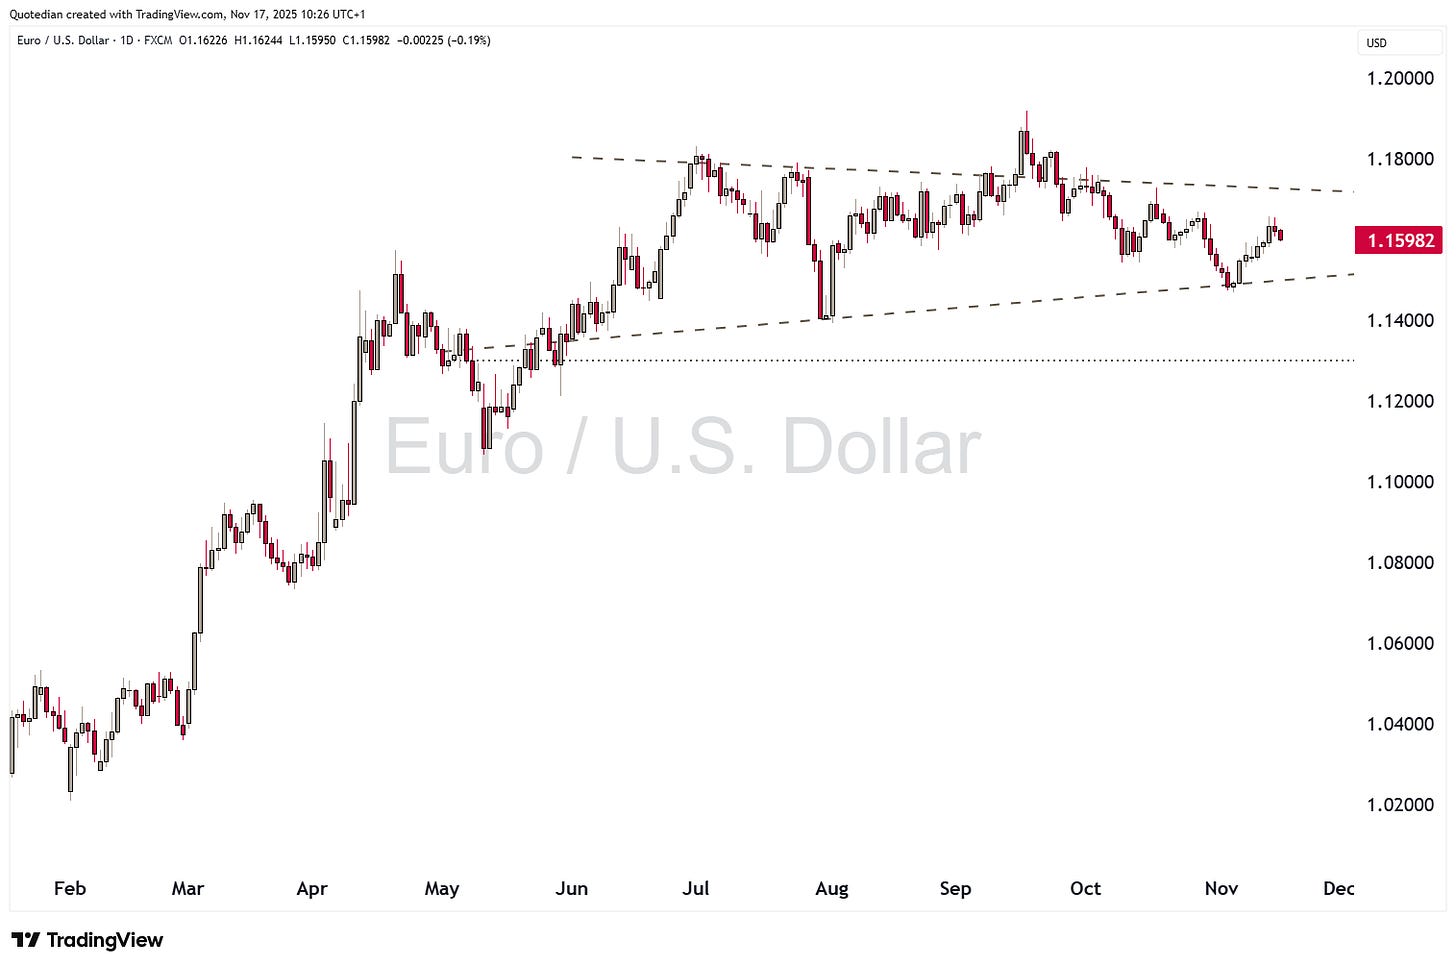
Similarly, the EUR/USD cross continue to trade in its wedge-formation range - only clear break higher or lower should be reason to initiate a new position:
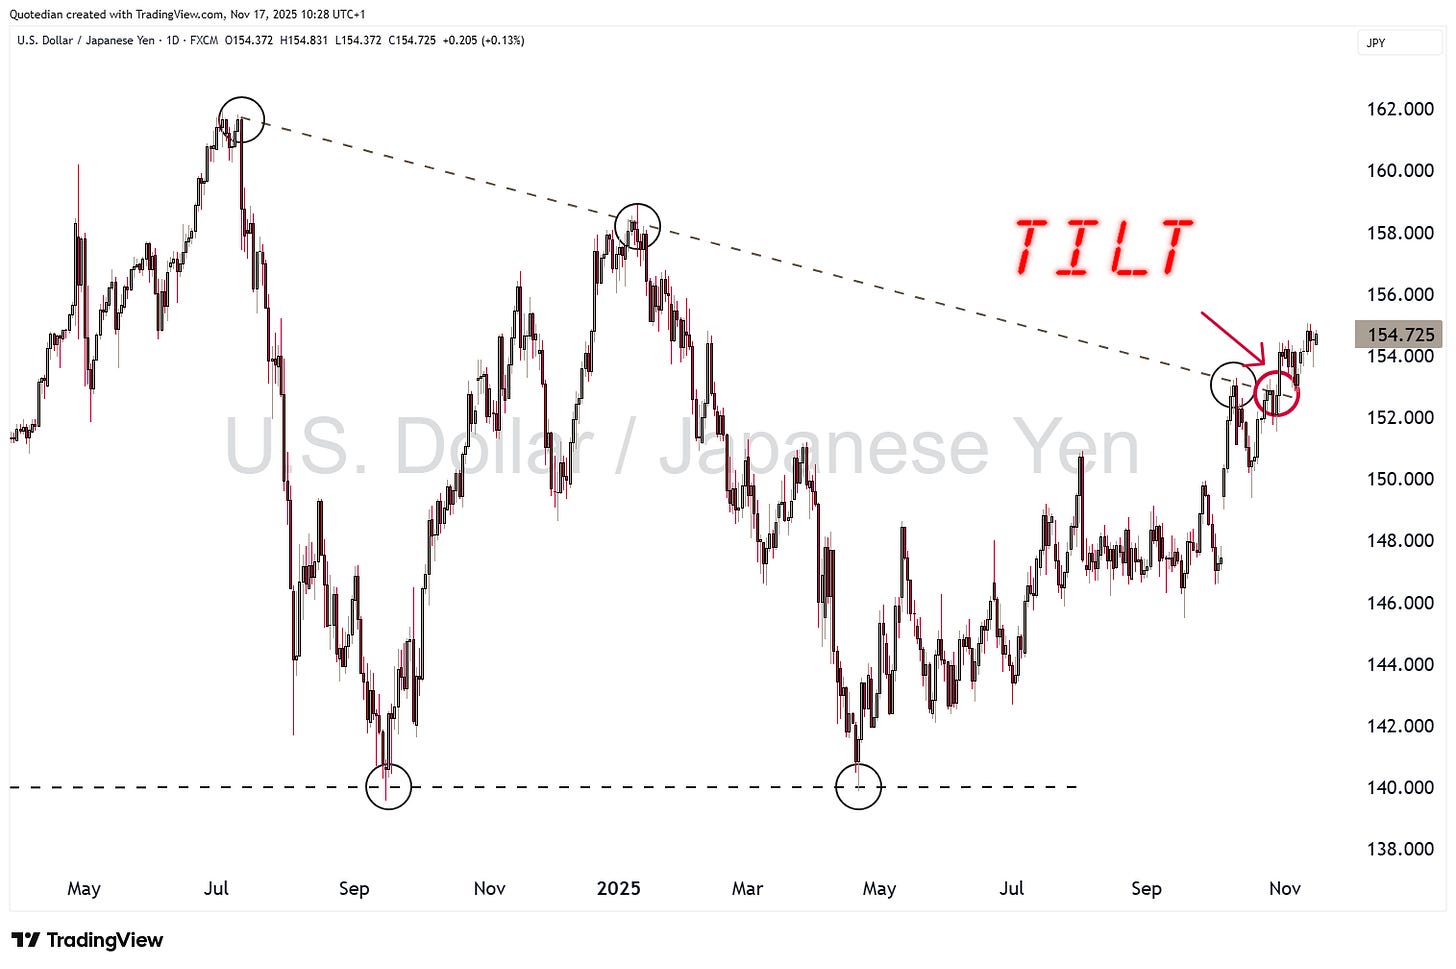
One of the few currencies even weaker than the Dollar continues to be the Japanese Yen, where our trading idea of a lower $/¥ got ‘tilted’ at the end of October:
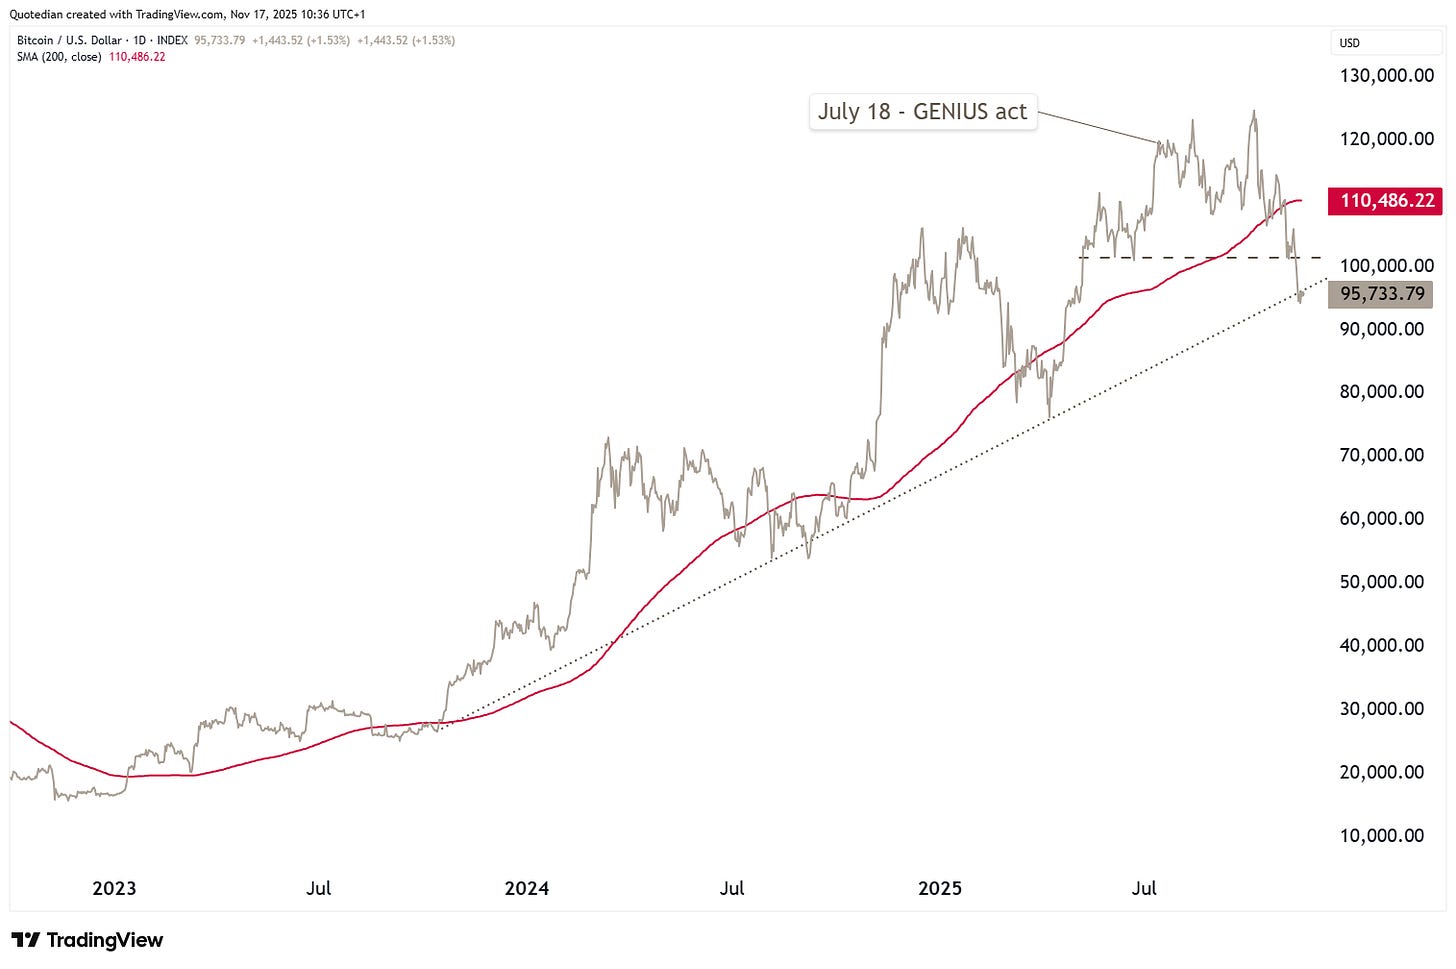
Turning to cryptocurrencies now, Bitcoin is now down 23% since its October 6th peak and down about 20% since July 18, when the GENIUS Act established stablecoin as the cryptocurrency most likely to be used for transactions, thus eliminating this role for bitcoin:
The technical pictures is not great, as BTC trades below its 200-day moving average (red line) and also below key support at 100k (black dashed line). There is some hope of support right here at 95k from the rising longer-term trendline (black dotted), but we know that “hope” is not a valid investment strategy …
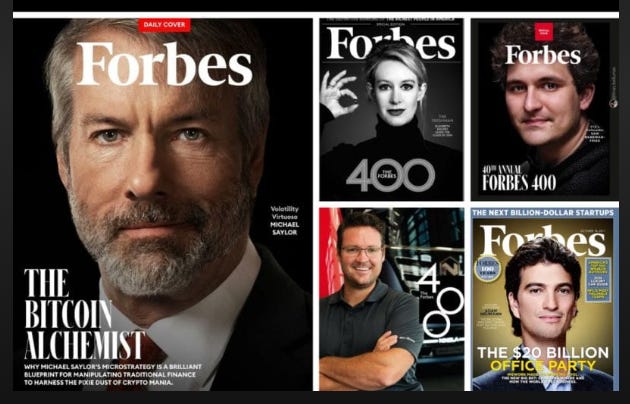
And talking about the GENIUS Act … it might have burst the balloon inflated by financial genius Michael Saylor. He was featured on the front cover of the January 30, 2025 issue of Forbes as “The Bitcoin Alchemist” (chart). That honor has sometimes proved to be a curse (image).
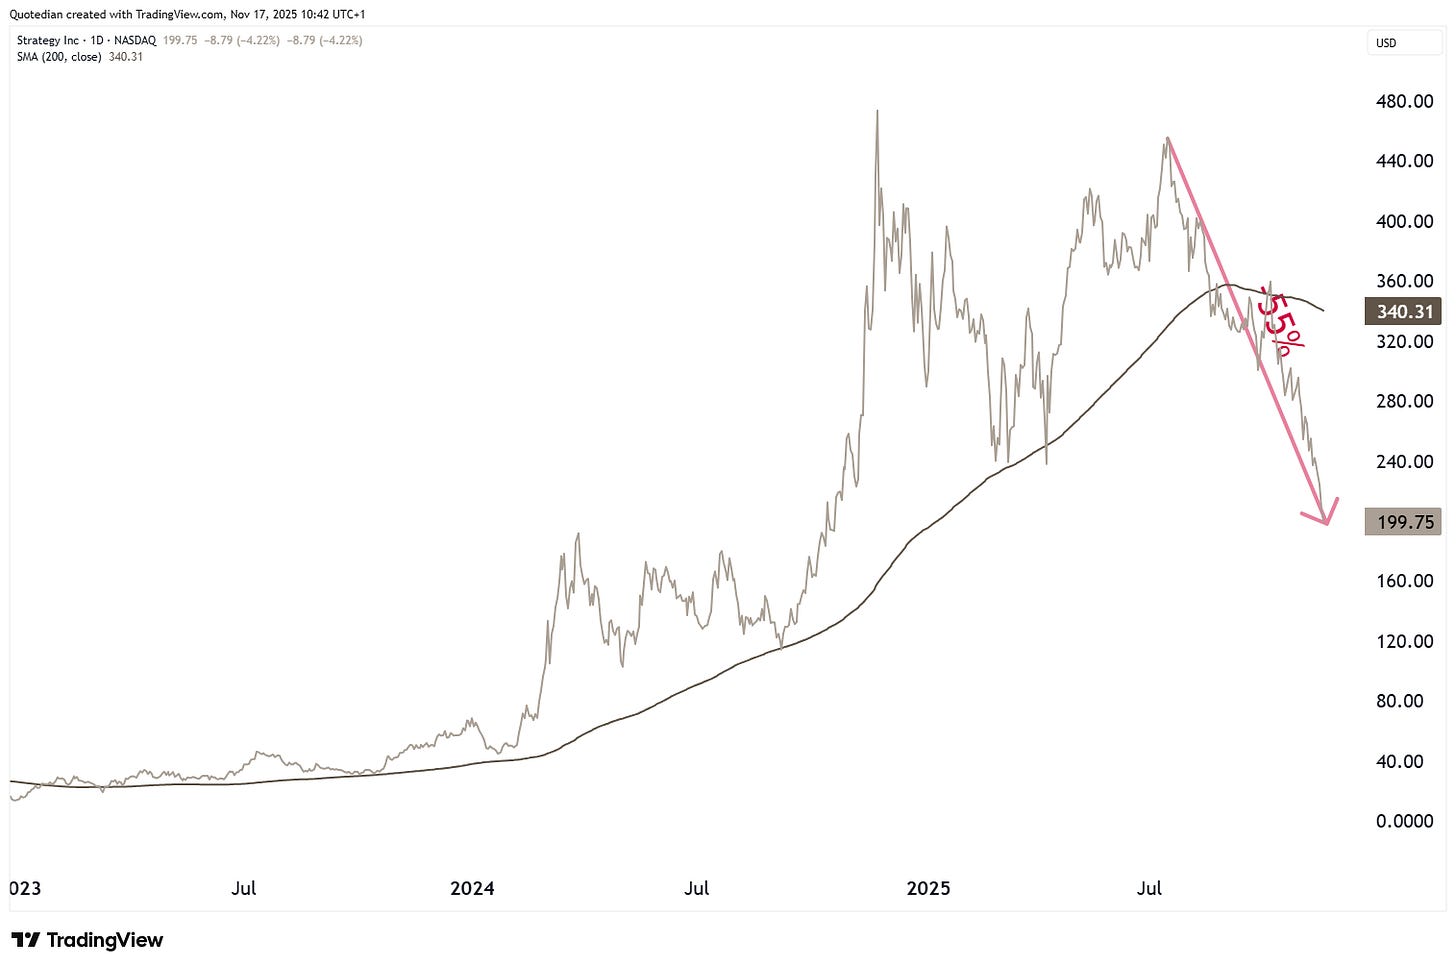
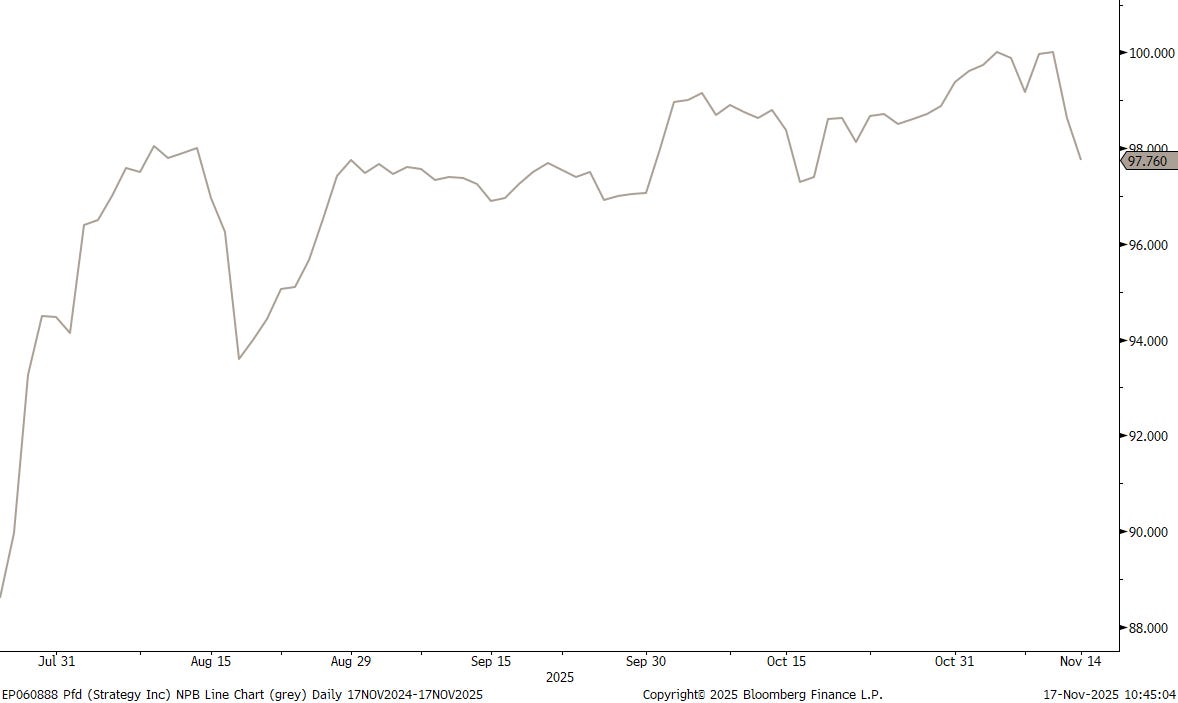
The stock price of Saylor’s company, Strategy, has plunged 55% from this year’s high on July 17:
I would not try to catch that falling knife, nor touch the preferred shares (10.5% coupon) with a stick:
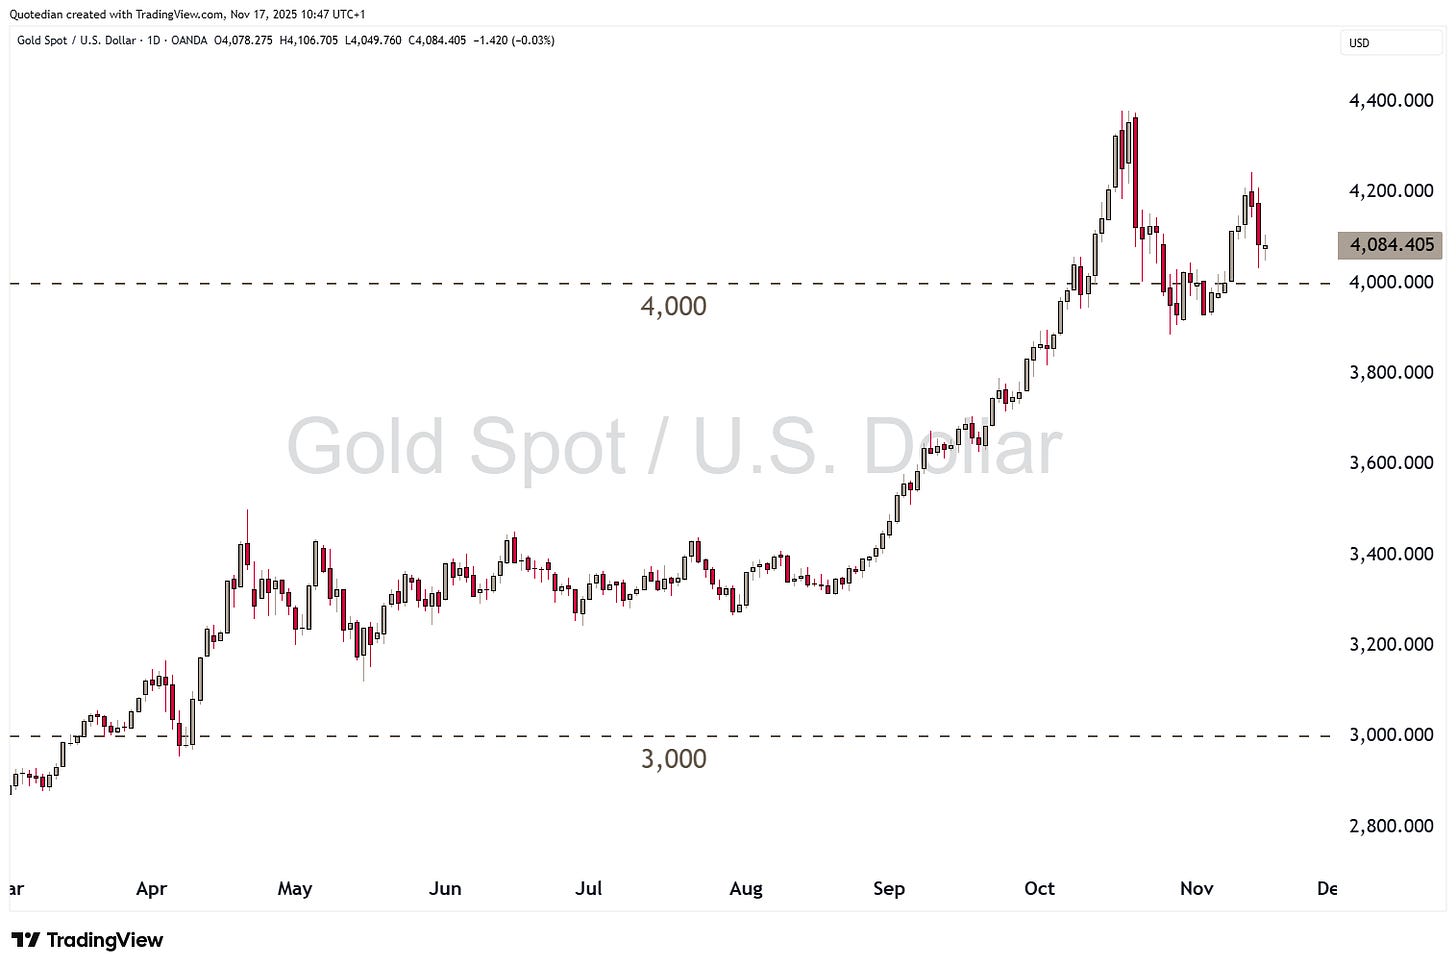
Finally, in the kingdom of commodities, Gold had briefly rallied USD360 from its late October intraday lows, but now has given back about half of those gains:
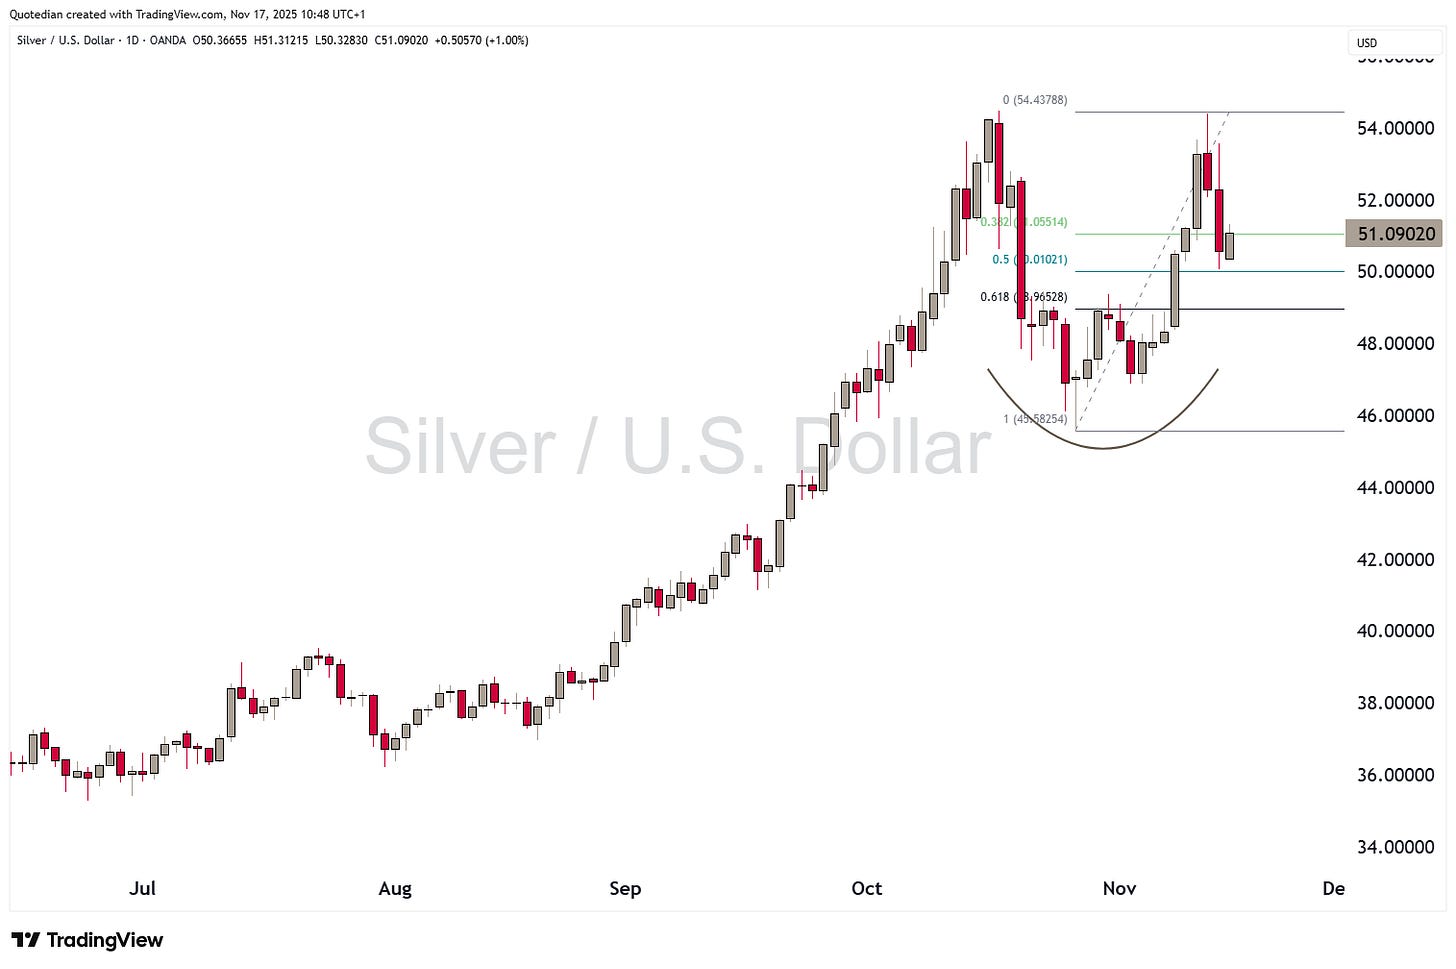
Ditto for Silver, but which seems to be rebounding now from the 50% retracement level:
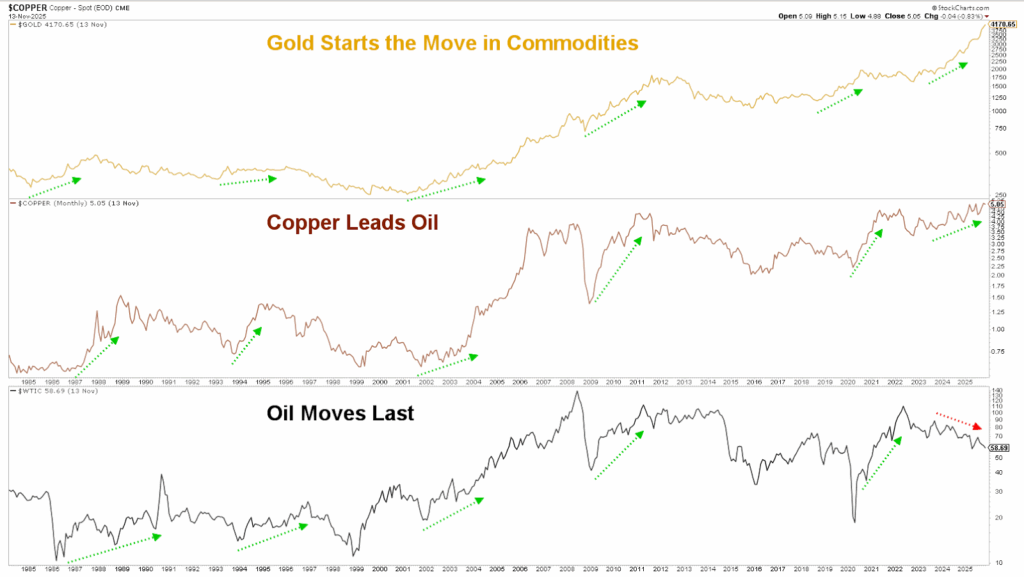
Here’s an interesting chart, arguing that Gold usually rallies first, is then followed by copper and eventually the price of oil moves higher too in the commodity cycle:
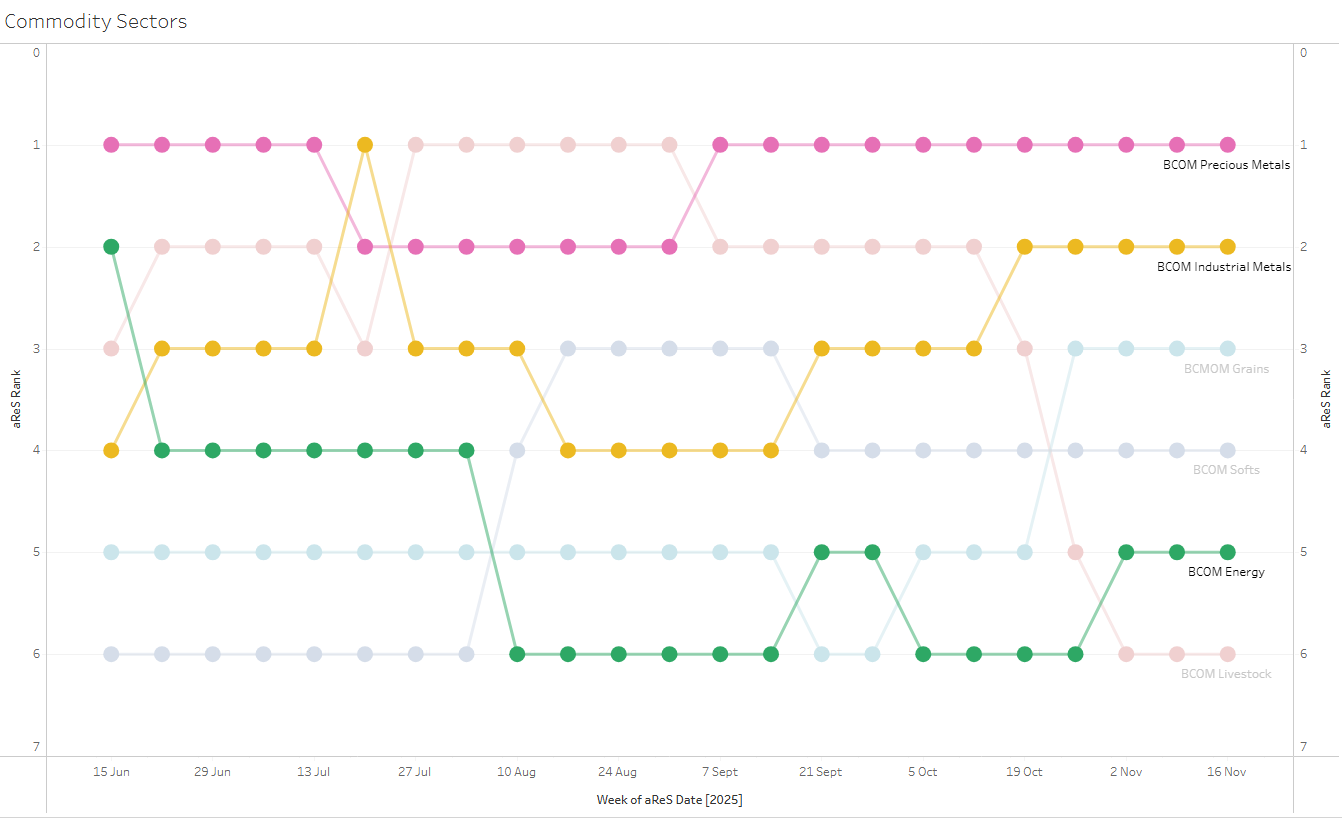
In that context, our aReS model does indeed agree with this ‘theory’, as precious metals are on top of the leaderboard, followed by industrial metals and energy commodities (green) now showing signs of life:
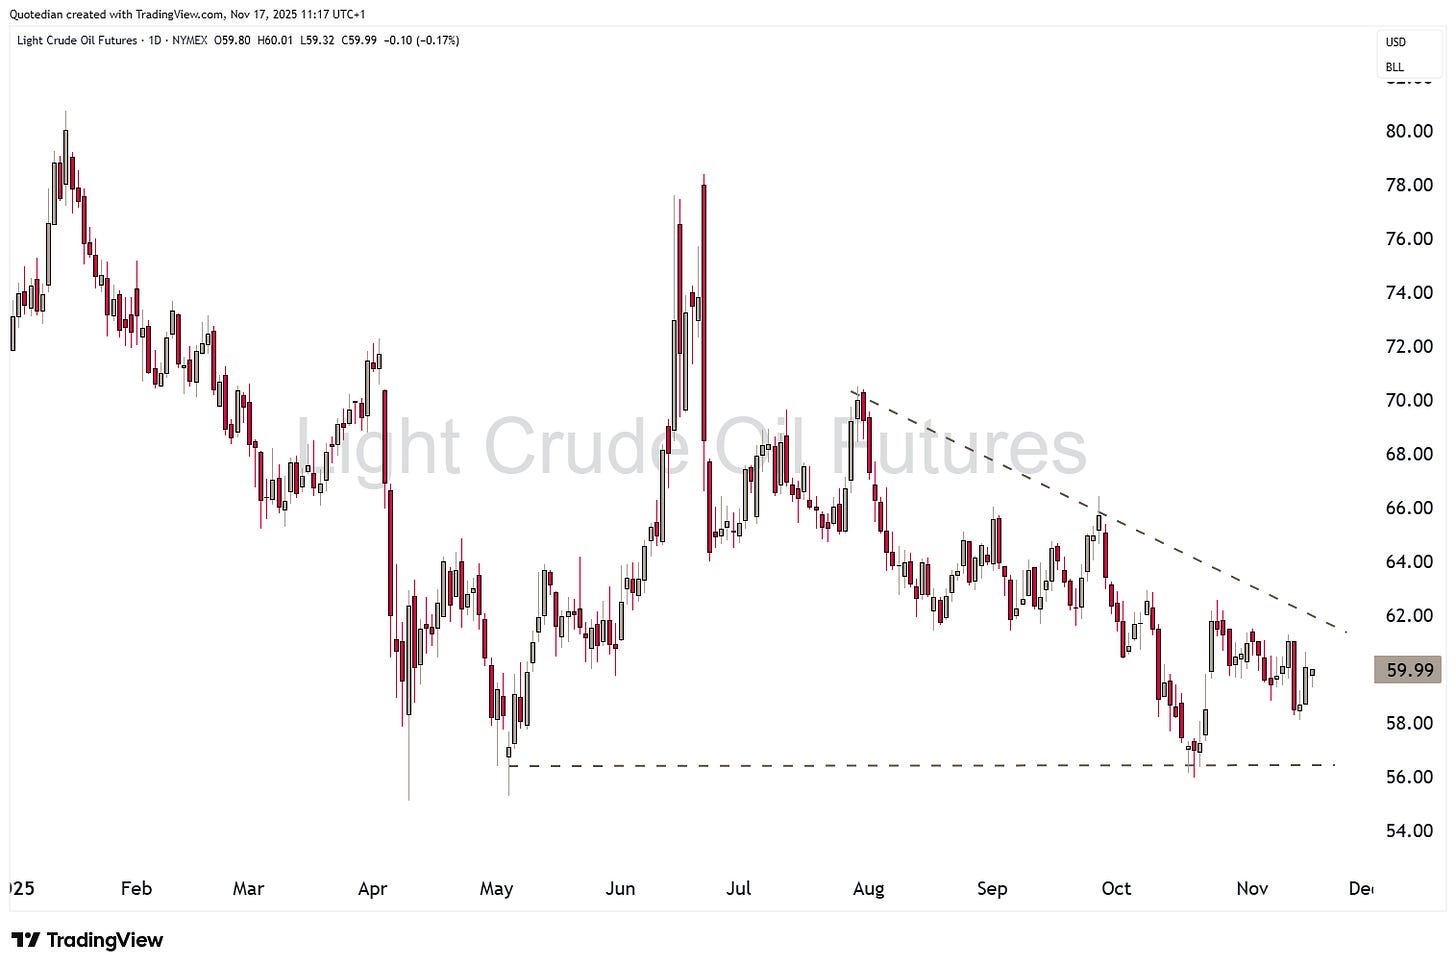
Admittably, most of the energy ‘strength’ is coming less from advancing crude oil (WTI below) prices,
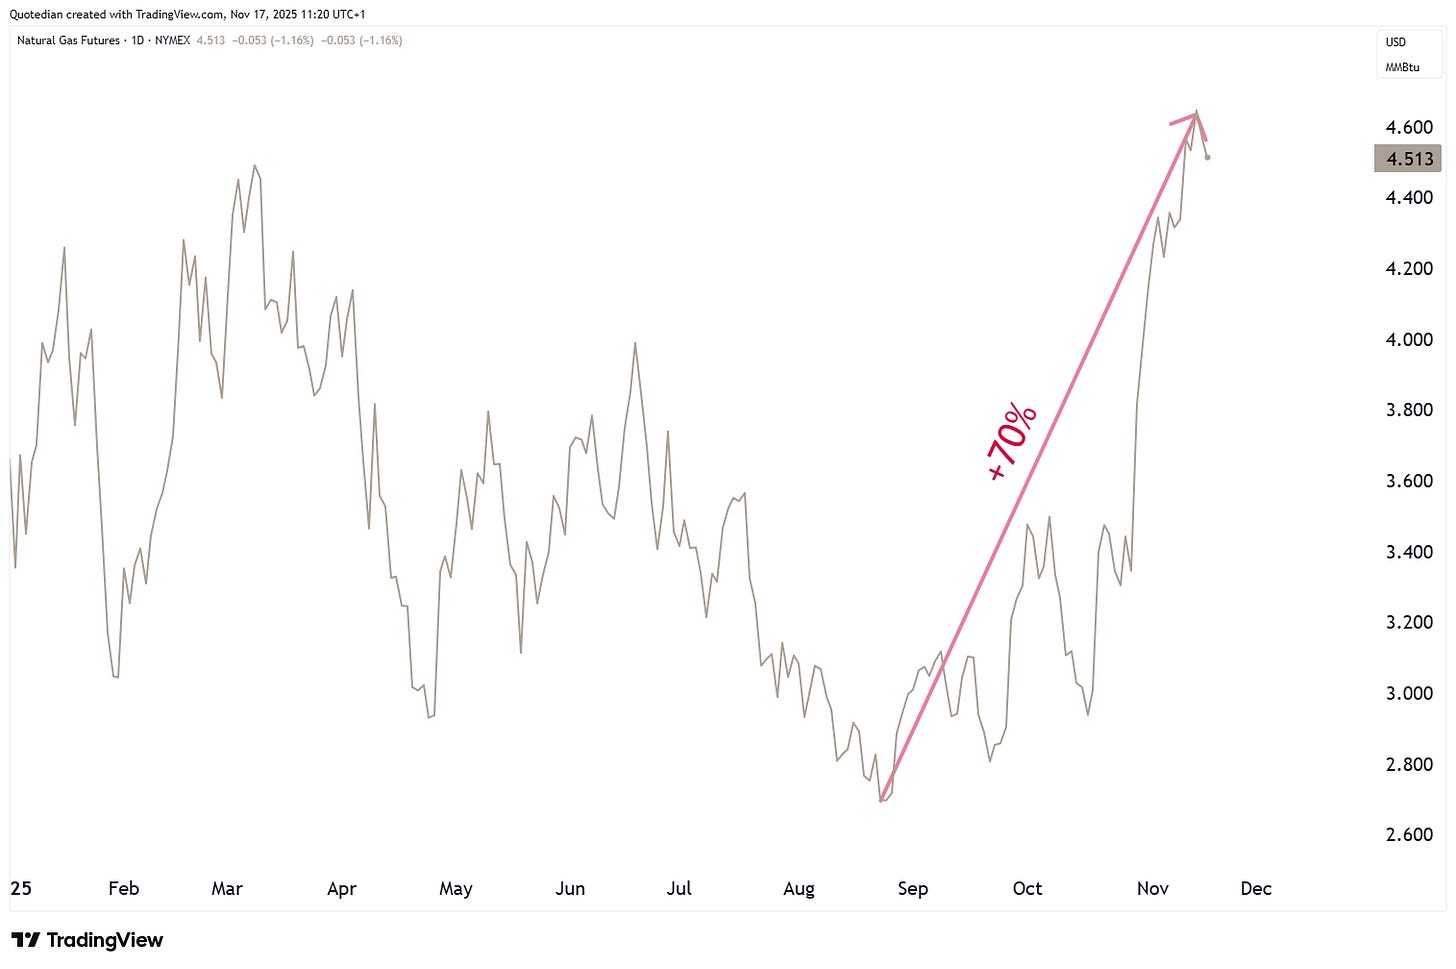
but rather from a massive 70%+ rally in natural gas:
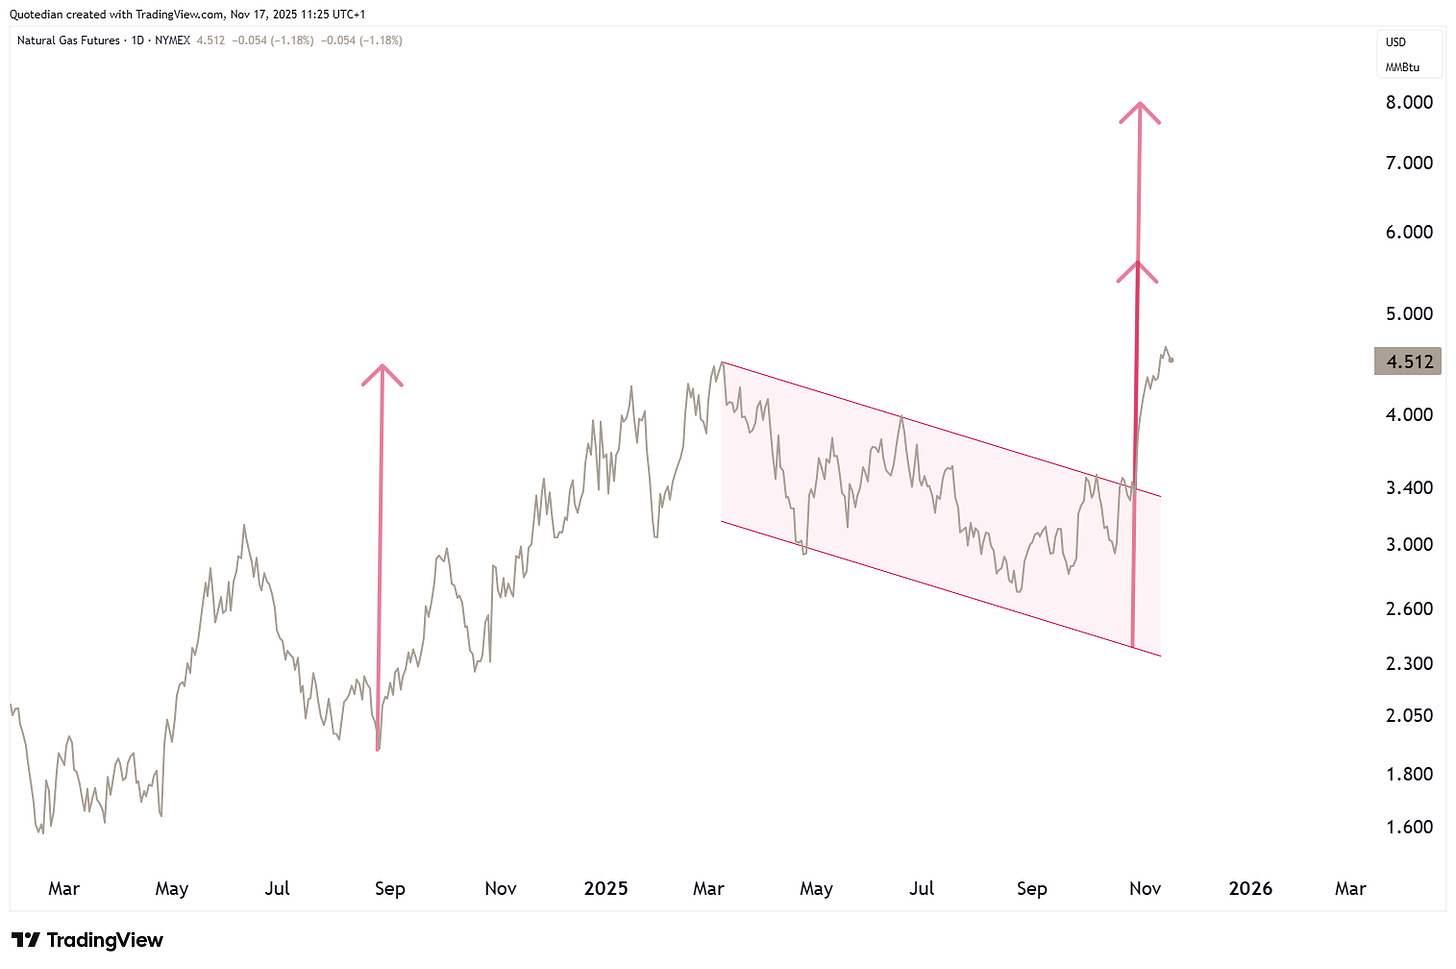
Zooming out on the same chart, a technical analyst could argue here that the rally should continue to at least $5.50 and could go as far as $8 …
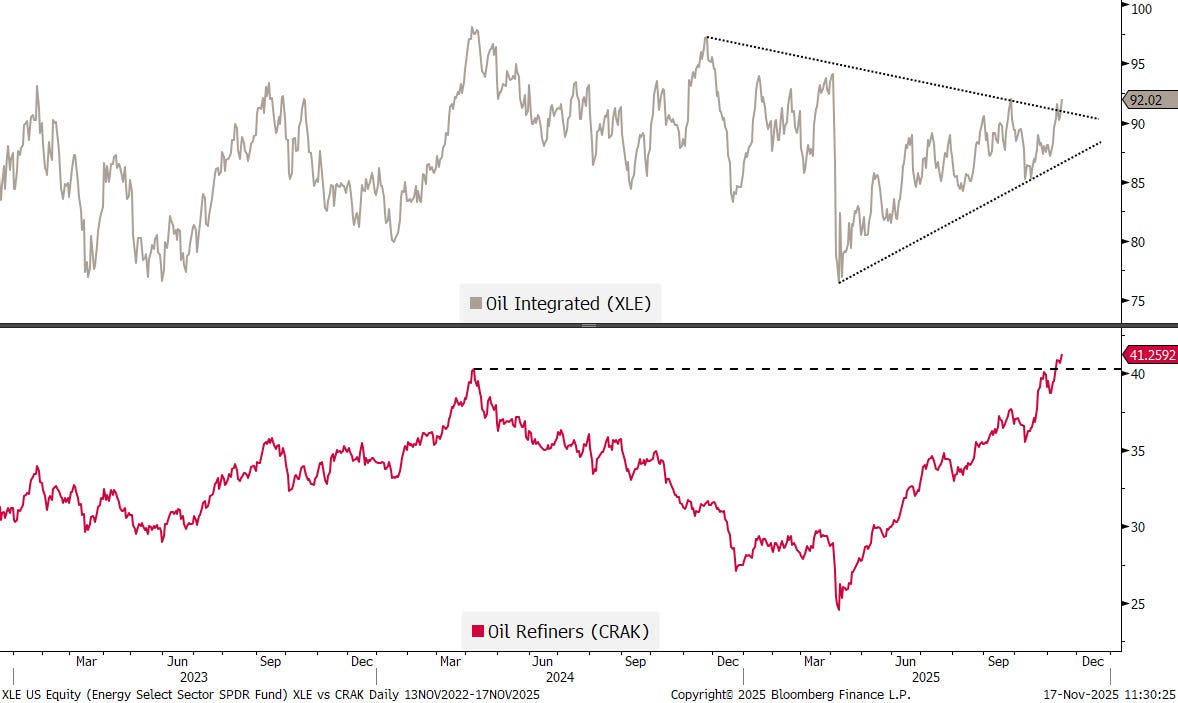
Turning back to crude oil for a moment, I have mentioned in the past how resilient oil stocks have been despite a weak underlying commodity. Recently, oil refining stocks as proxied by the VanEck Oil Refiner ETF (CRAK - lower clip, red line) have been breaking out to new all-time highs and now seem to drag integrated oil companies (XLE - upper clip, black line) out of its year-old consolidation triangle:
We (I) continue to like those high dividend yielding, low P/E stocks…
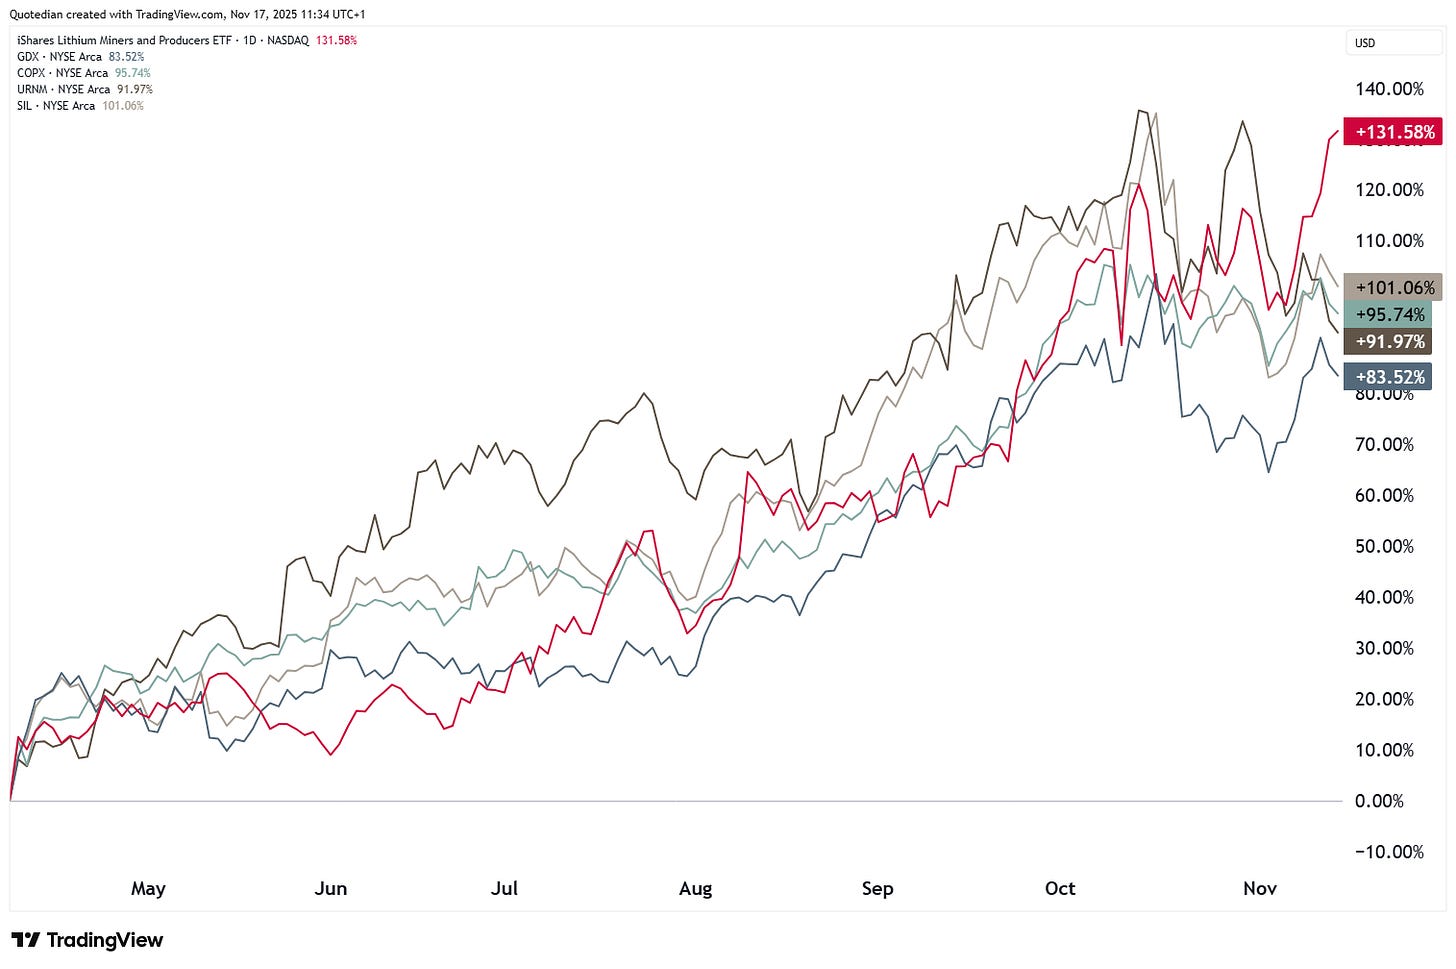
And here’s one last one of more speculative nature … lithium stocks, proxied via the iShares Lithium Miners and Producers ETF (ILIT - red) have been quietly rallying 130% since early April, beating Gold, Silver, Copper and Uranium miners!
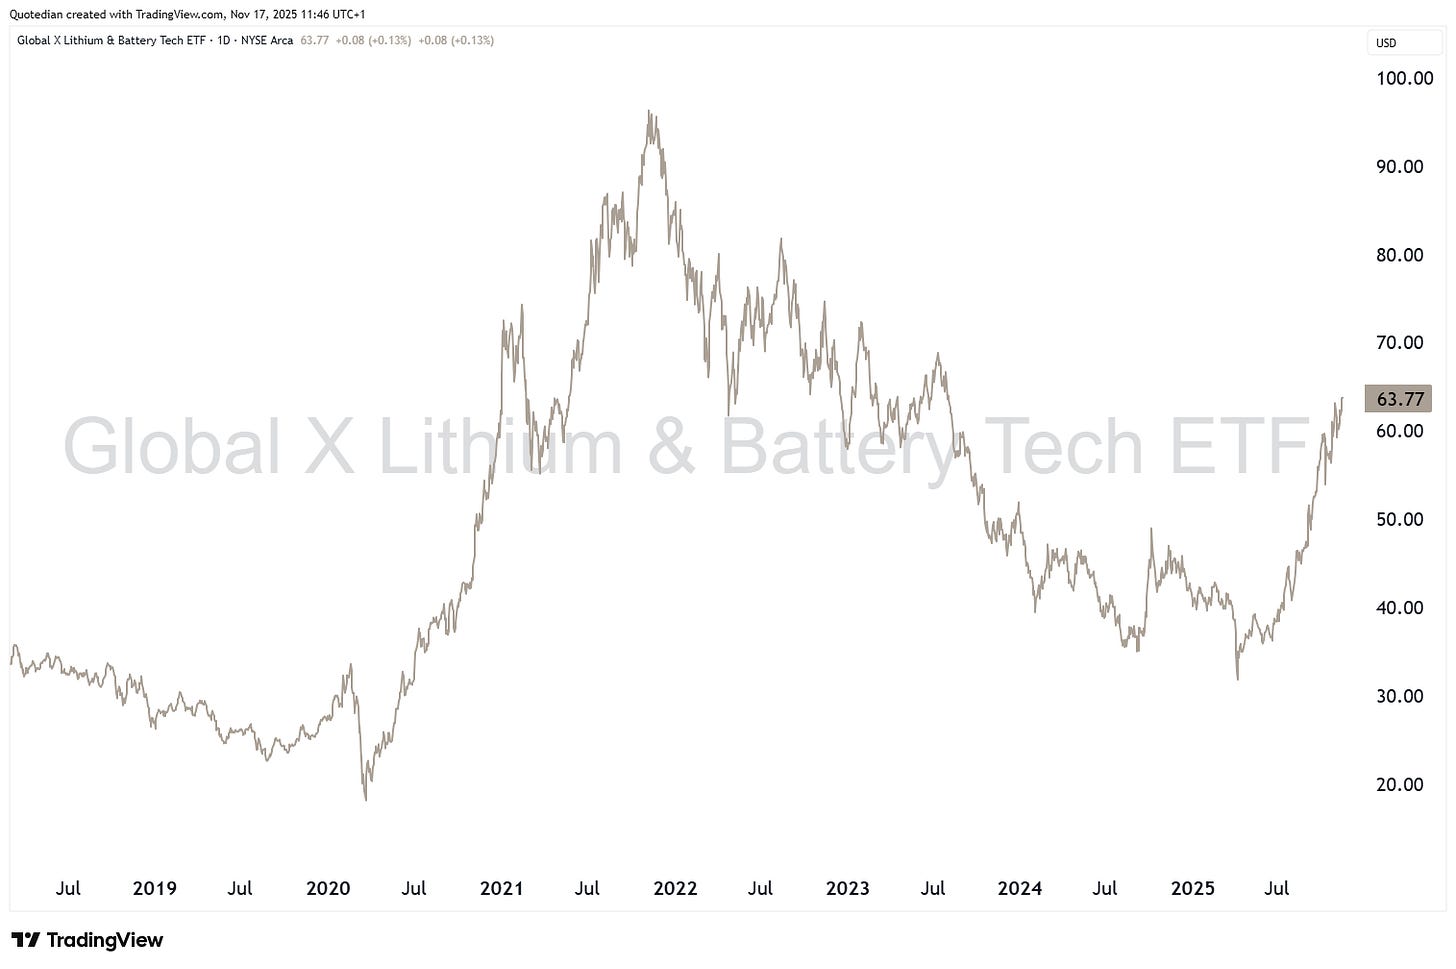
And the beauty behind this rally? Taking the Global X Lithium miners ETF (LIT) now for more historical context, we note that the rally could go much further in absolute
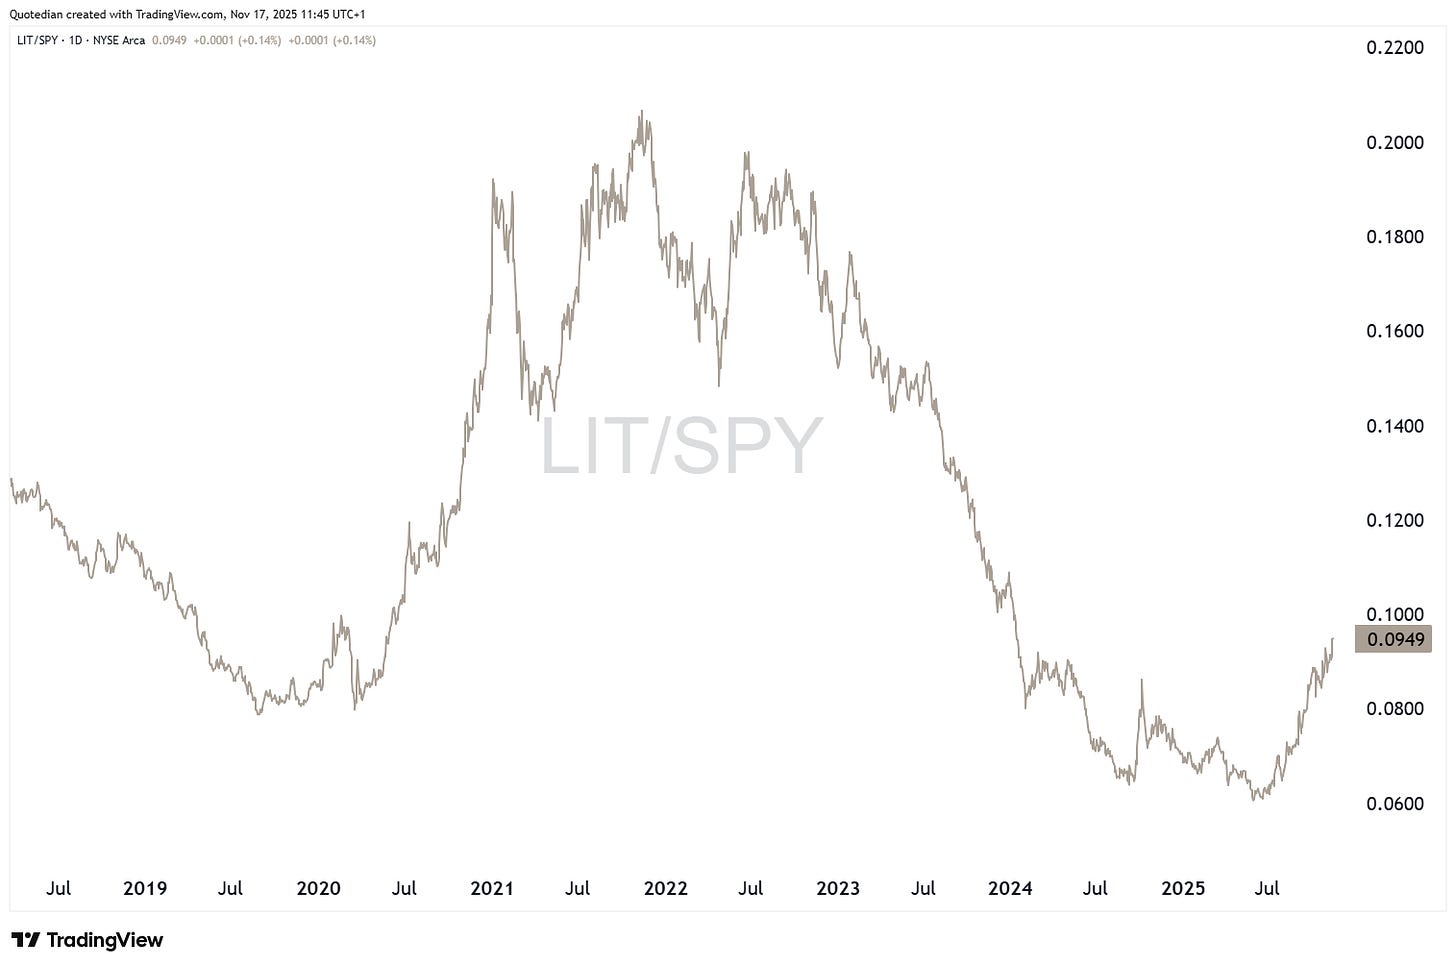
and relative terms,
should the previous high watermark levels be reached.
Alright, that’s it for this week. Same time, same place, next week. And don’t say I didn’t warn you.
In reality, you need no other Disclaimer than the one above, but just in case:
Everything in this document is for educational purposes only (FEPO)
Nothing in this document should be considered investment advice
Investing real money can be costly; don’t do stupid shit
Leave politics at the door—markets don’t care.
Past performance is hopefully no indication of future performance
The views expressed in this document may differ from the views published by Neue Private Bank AG


















Follow Me…