Knock! Knock!
The Quotedian - Vol V, Issue 150
“Home, Sweet Home”
— English idiom (and Mötley Crüe Ballad)
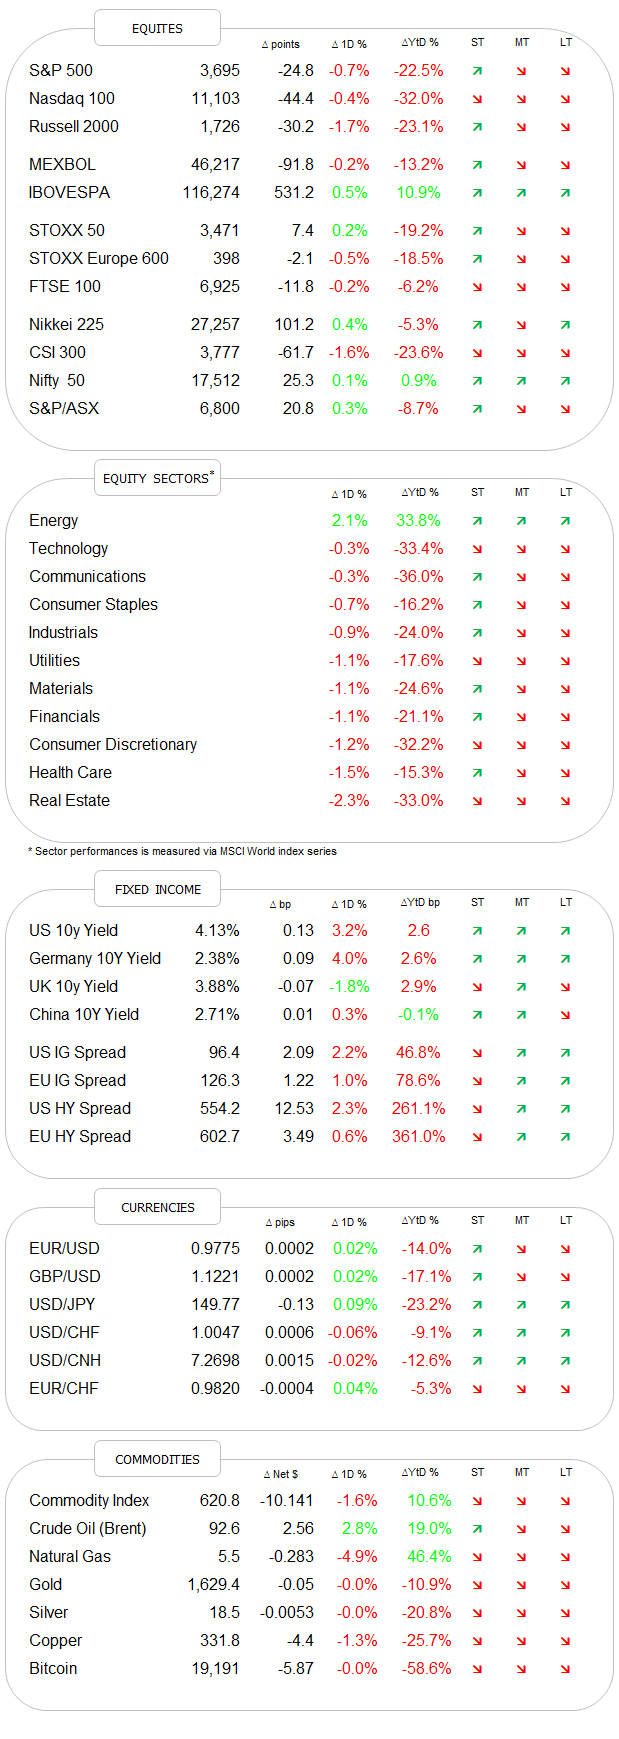
DASHBOARD
AGENDA
CROSS-ASSET DELIBERATIONS
Yesterday’s equity markets were in corrective mode, but given the increase we saw in bond yields it could have ended substantially worse than it did. The ‘slip’ on the S&P 500 bellwether benchmark was about half of the previous day’s gain, on less volume and a winners-to-losers ratio of only about 1:3 (compared to the previous two up-days with breadth readings in excess of 90%). This is what the intraday chart looks like for the SP since last Thursday’s CPI lows:
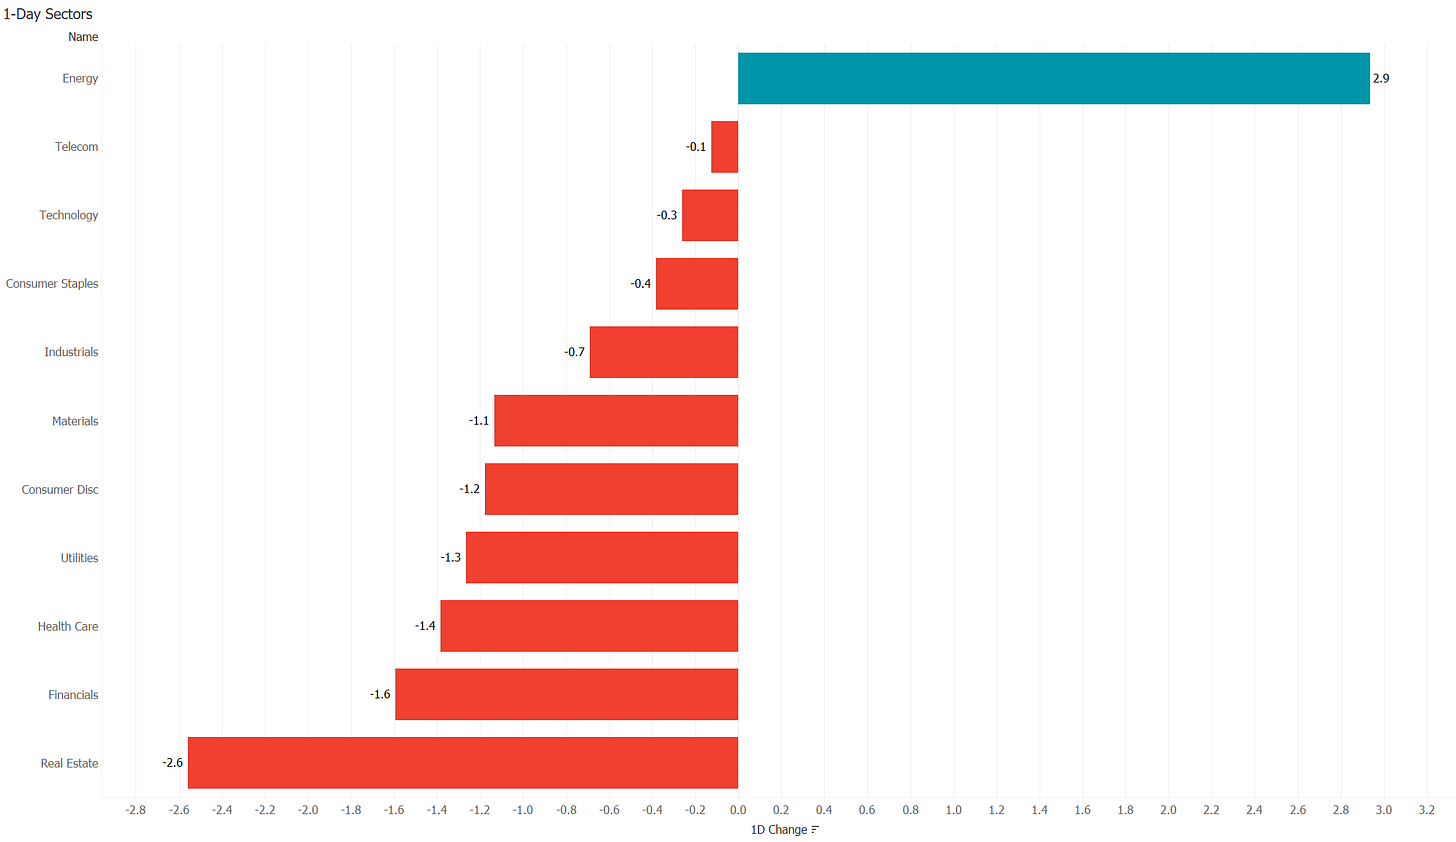
Nevertheless, only one sector in the index managed to eke out a gain,
leaving the market carpet for the day with a red tilt:
Earnings seem to have been mostly on the positive side yesterday, with some exceptions such as Alcoa (-12%), or Tesla (-5%), with beat the bottom line but failed top-line expectations.
Given the US template provided, it is no surprise that Asian markets are largely printing red this morning, though with the notable exception of Chinese stocks, which are eking out a small gain as I type.
But let’s keep the equity section short today, and have a closer look and bond markets & co., as this is where currently the real action is happening.
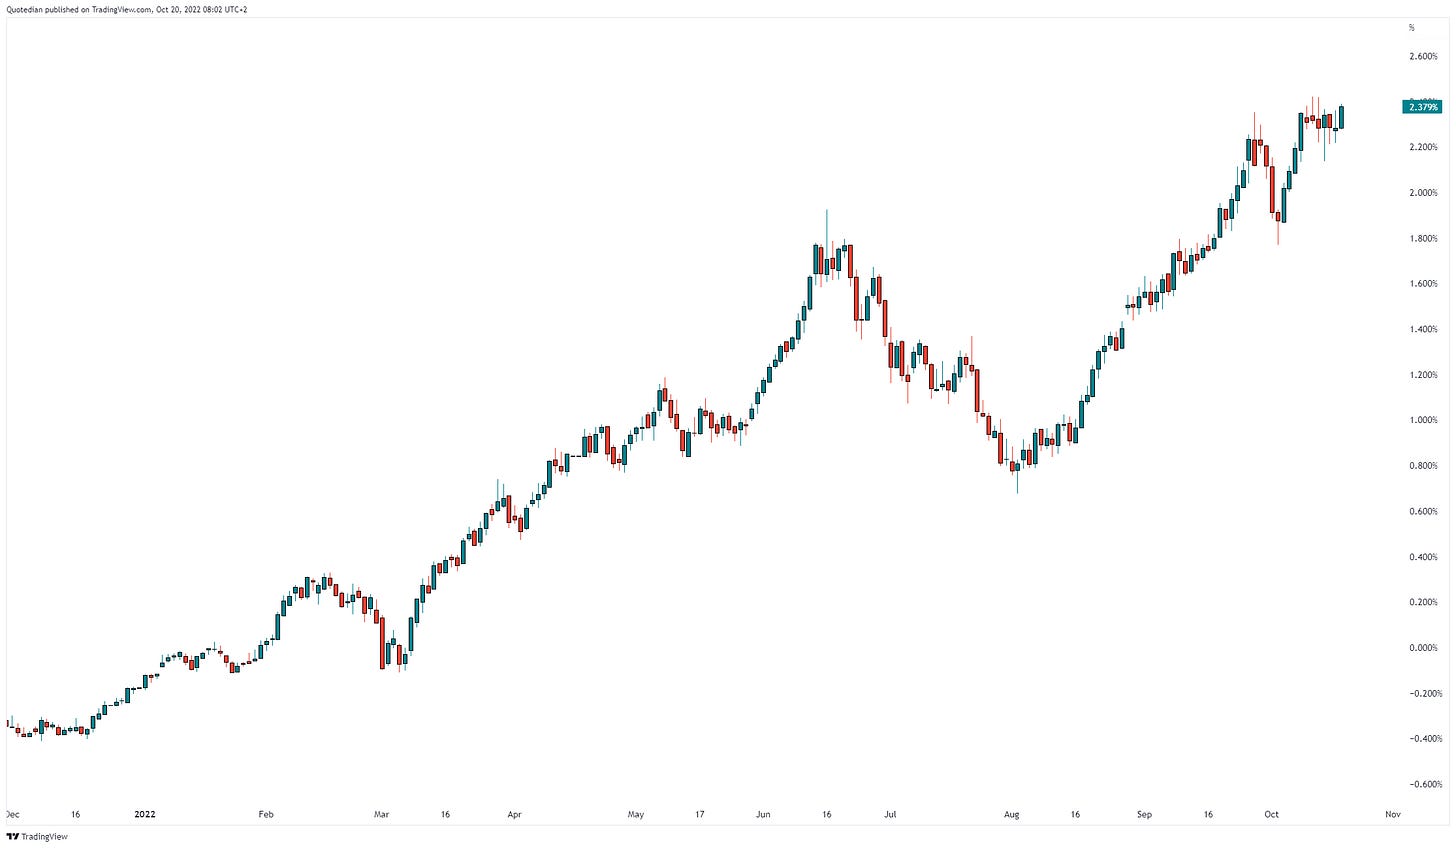
For one, and as fore-mentioned, global yields saw yet another upward shift yesterday, mainly on the back of higher-than-expected (UK) or less-low-than-estimated (Canada) inflation data.
Both, US 10-year treasury yields (first chart below) and German 10-year bund yields (second chart below) broke out to new cycle highs:
Regarding the latter, we also just had out German PPI data literally as I was copy/pasting that chart. Coming in at 45.8% on a year-on-year basis, where a 45.4% number was expected, makes me suspect that yields for the Eurozone will NOT trade lower today …
The absurdly high absolute level of this mostly self-inflicted number is astonishing (in the negative sense of the word):
But, back to the US yield market, where the real novelty was not in the new cycle high for yields, but that one of the most reliable recession indicators, the 10-year minus the 3-month constant maturity yields, finally gave the R-signal:
I have written about this measure of the yield curve several times and finally found the link to the Fed paper studying this phenomenon, and which I had promised to provide (click on picture below):
Once a signal is triggered, the recession is two to four quarters out, but of course, the question is how much is already discounted by financial markets… for the definitive answer to that, let’s consult one of our most reliable sources:
Another (overnight) bond-related news item is the following:
This defending of the 10-year segment on the term structure is becoming absurd, whether you compare 10-year govies to the more freely traded swaps:
or the yield curve itself:
Look, they can keep on printing money to apply Yield Curve Control (YCC) forever, but something is going to give. For now, of course, the Yen is being taken to the slaughterhouse:
Moving into the commodity space, I found the following chart on Diesel spreads interesting,
especially as I like (and have been long) refining stocks for a while now. Valero continues to be one of my favourites (no investment recommendation - please refer to disclaimer at bottom of document):
And another interesting chart, without any commentary (not necessary), here:
It is not time to hit the Send button yet (😉), but we have some work still to do in the COTD section.
Have a great Thursday - Friday’s happy hour is only a few stop losses away!
André
CHART OF THE DAY
And finally, to an explanation (if necessary at all) on what today’s title and meme refer to. And it is not really a COTD, as it is several charts. It’s more of a theme, but I do not want to rename the section to Theme of the Day, as that would be too daunting. And it is also not an investment recommendation for obvious (MiFID) reasons. But I am digressing …
On Tuesday, the NAHB (National Association of Home Builders) had one of their key surveys out, with a reading above 50 meaning builders view conditions as good over poor. The number came in at 38, versus an already low 43 expected…
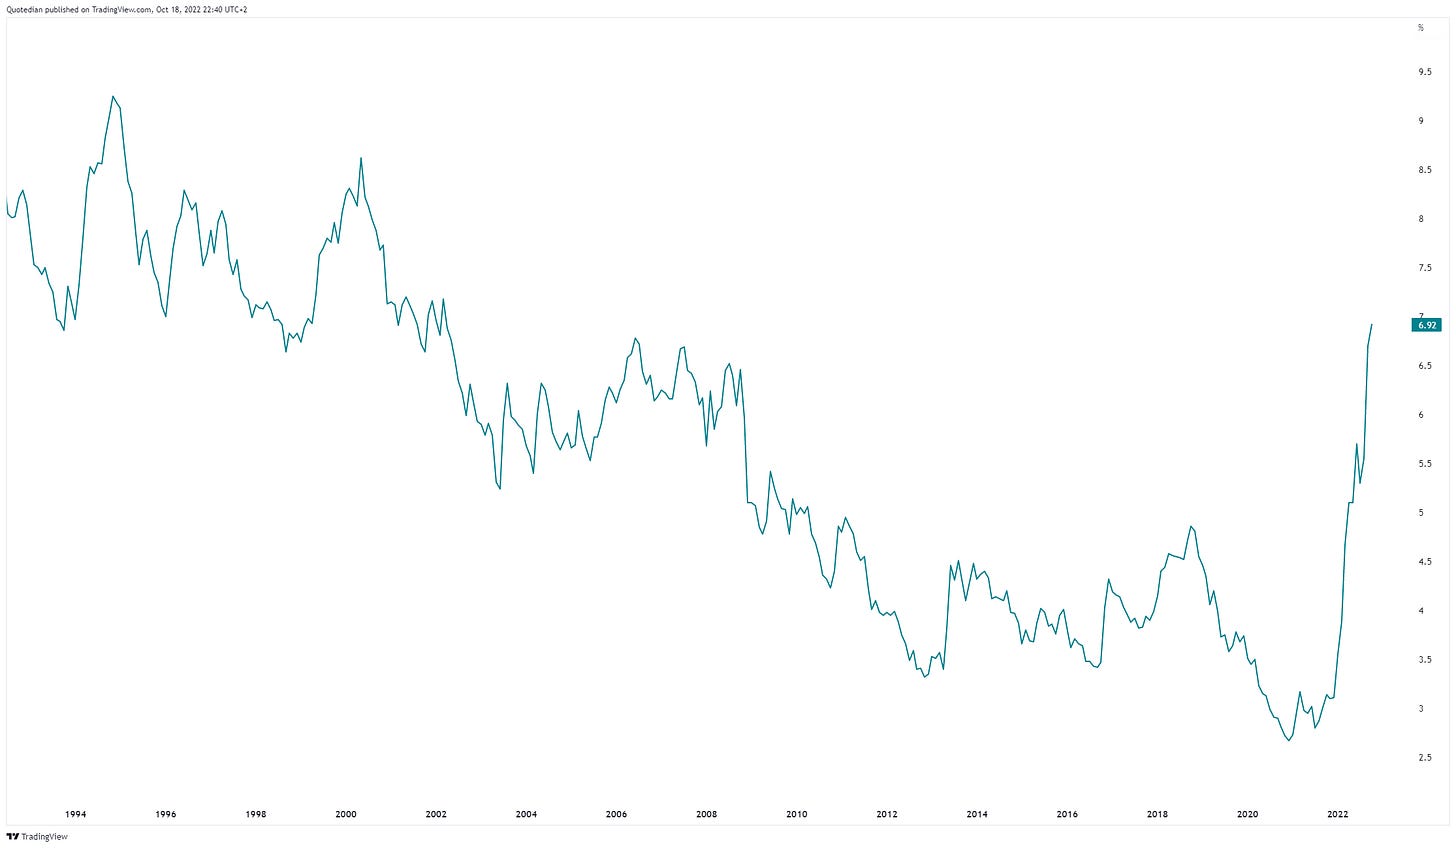
Of course, this should come as little surprise, seeing how mortgage rates have jumped into the vicinity of the 7%-handle:
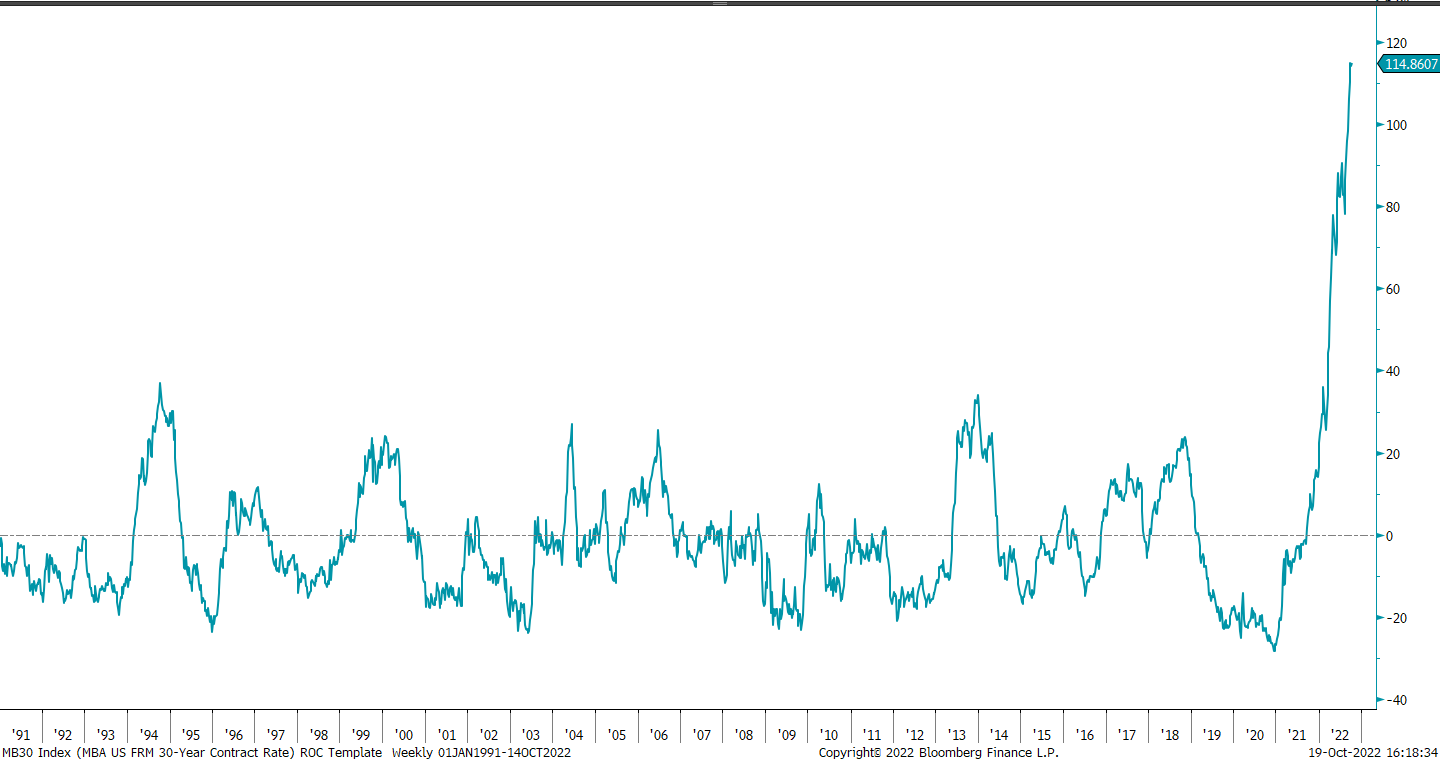
Another, even less friendly, way to look at this is via the 1-year rate of change:
WOW! All we can say is …. nothing …
So, what’s the implication? Not sure, I do not think we face a housing crisis as during the GFC, supply seem to be too tight for that, but I am definitely no expert on that. One conclusion would be that headwinds remain for homebuilders. Both major home construction/building ETFs, XHB and ITB are already down 35% on a YTD basis, whilst the S&P is down ‘only’ 22%:
But maybe a pair trade (e.g. short IBT, long DIA) could still be of interest, especially if supports (black dotted lines) break? Stay tuned…
Thanks for reading The Quotedian! Subscribe for free to receive new posts and support my work.
DISCLAIMER
Everything in this document is for educational purposes only (FEPO)
Nothing in this document should be considered investment advice
Past performance is hopefully no indication of future performance


