

Let’s Get Physical
Vol VIII, Issue 36 | Powered by NPB Neue Privat Bank AG

“The first rule of commodities is: you can’t produce them with a printing press.”
— Warren Buffett
Enjoying The Quotedian but not yet signed up for The QuiCQ? What are you waiting for?!!

Of course, we are NOT referring to Olivia Newton-John’s fantastic 1981 song, though it gives a great lead into this week’s theme:
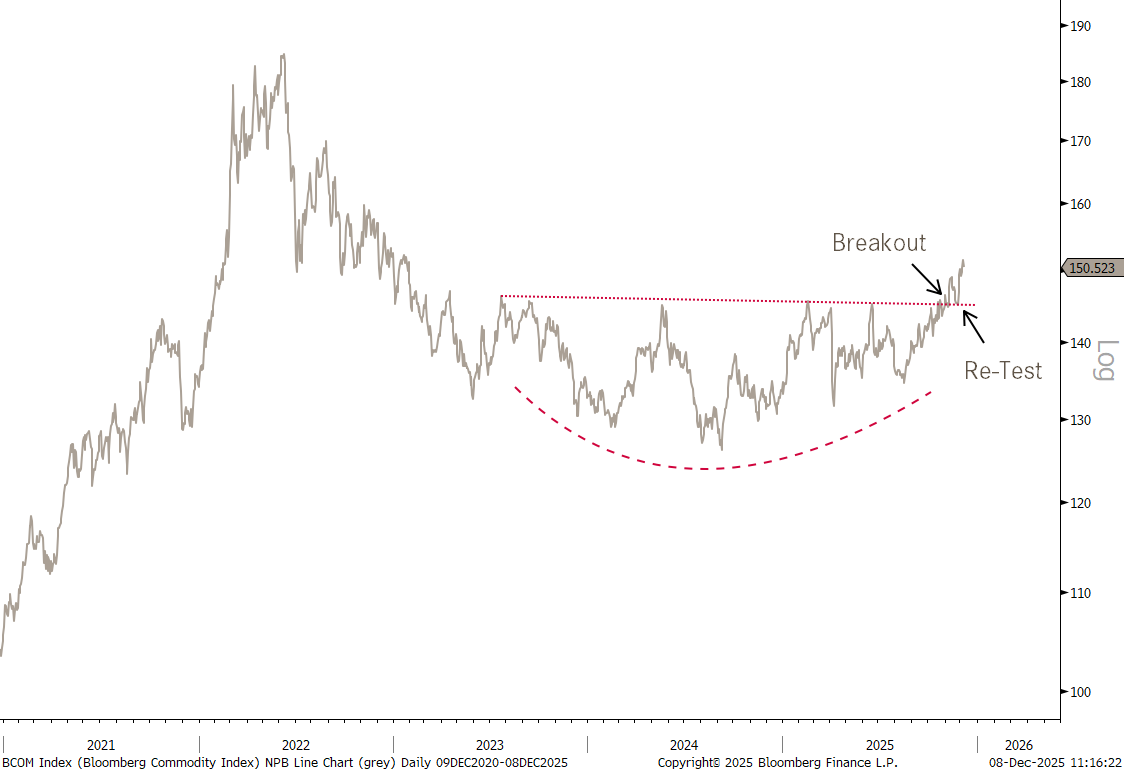
Of course we are talking physical … commodities which have been grinding higher recently! Here’s the Bloomberg Commodity index for example, showing a very nice base formation:
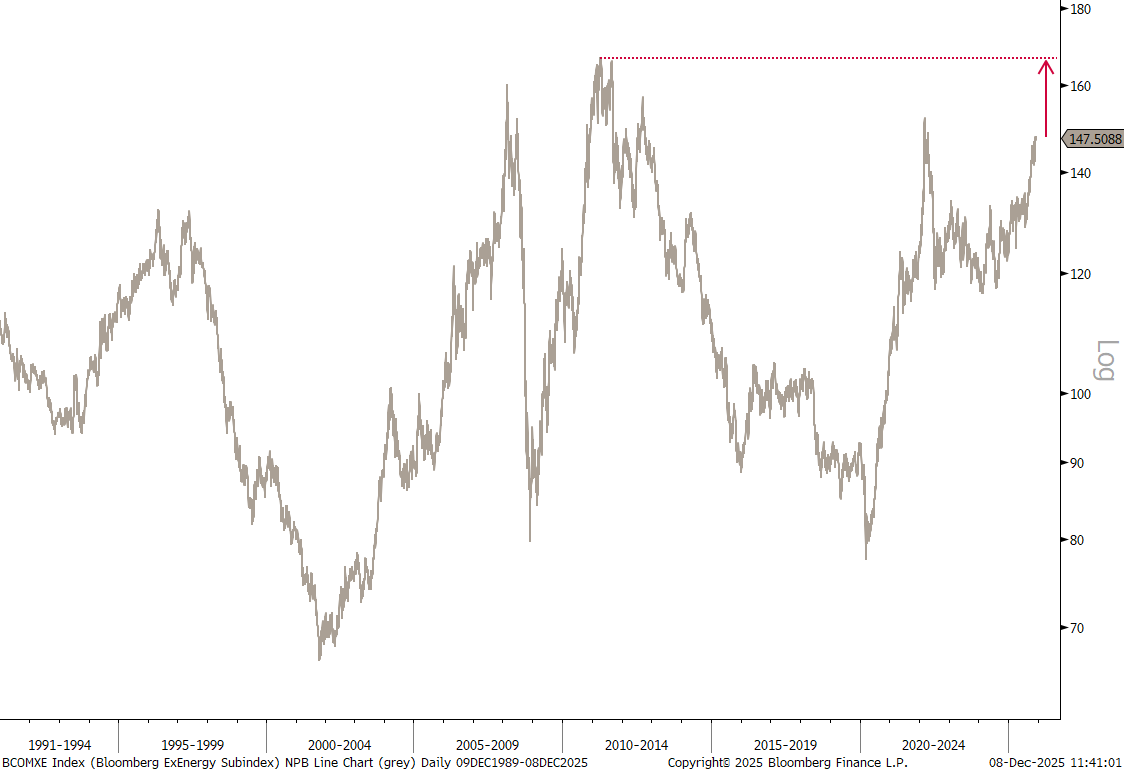
If we exclude the energy component from the index, which is around 30% between crude oil, natural gas, heating oil, diesel, etc., the chart looks even better, with prices closing in on the 2010 highs:
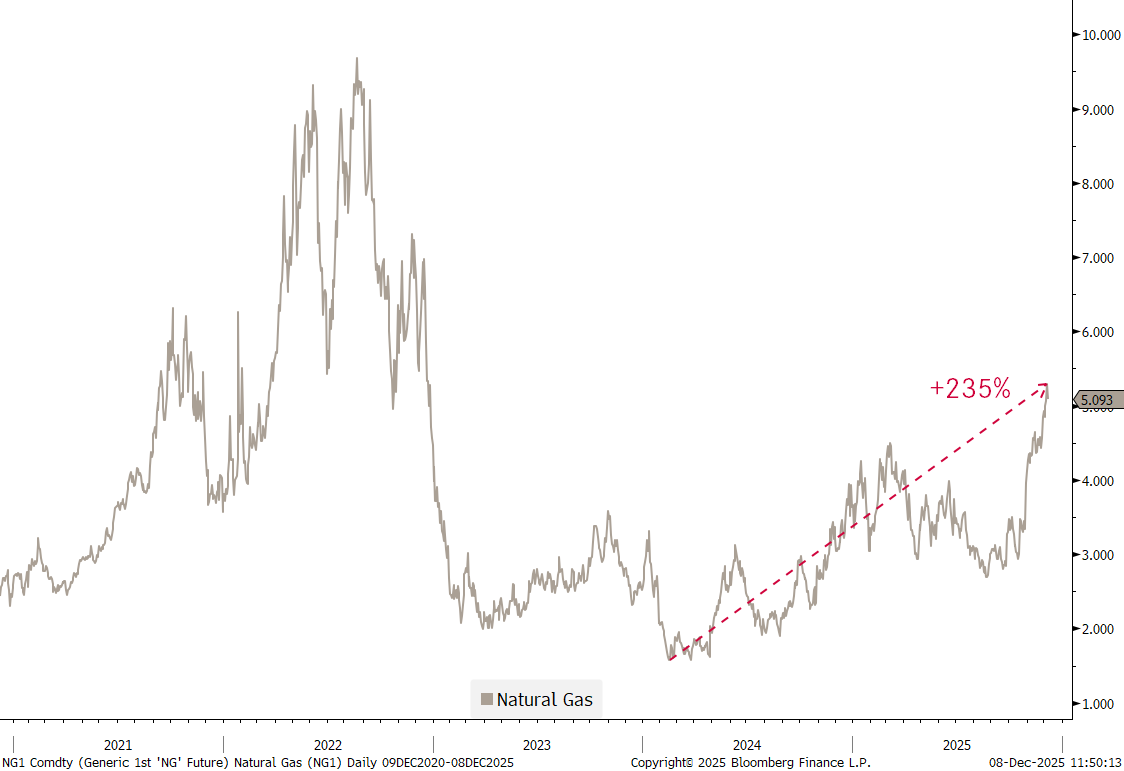
Although Natural Gas has been on a tear recently,
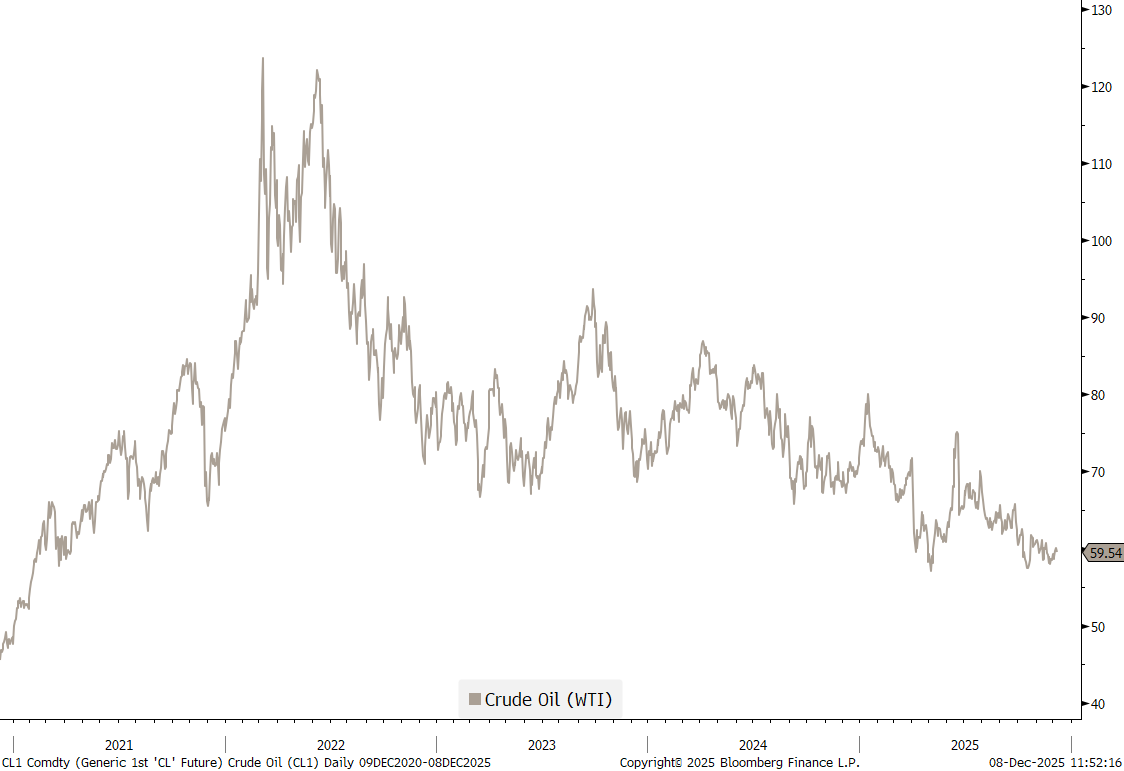
crude oil continues to be the missing ‘element’:
The rally in physical commodities has been meaningful over the past twelve months,
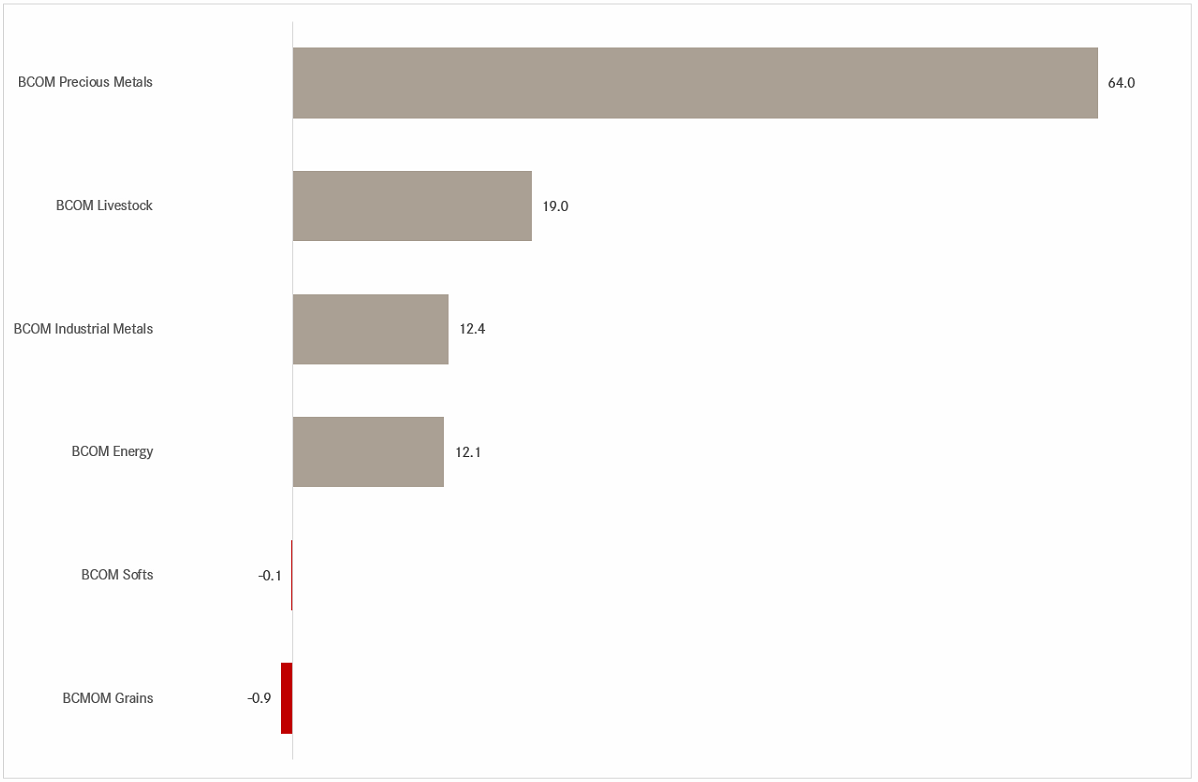
but even more so for commodity-related equities, which have easily beaten the mighty Mag 7 this year:
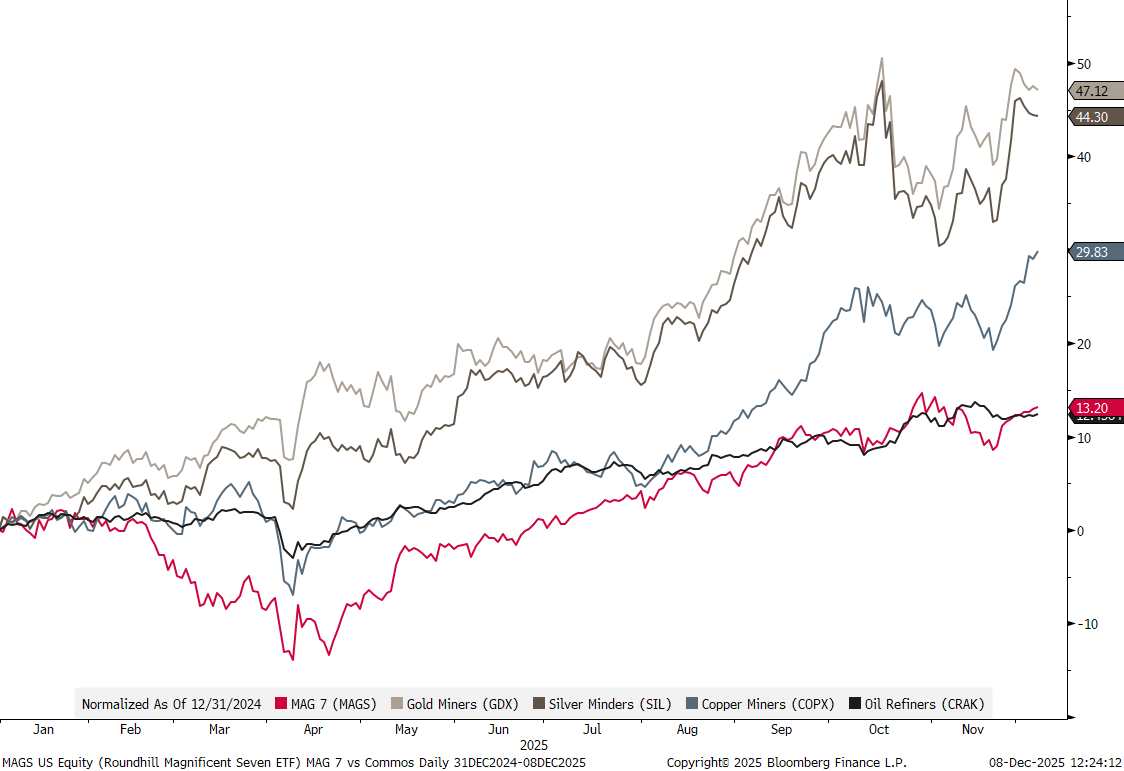
Even oil (refining) stocks were able to keep up with the Mag 7!!
With this out of the way, let’s get physical on other asset classes to, as we do our usual weekly round-up.

The S&P 500 eked out an “only” 21 index point (+0.3%) gain last week,
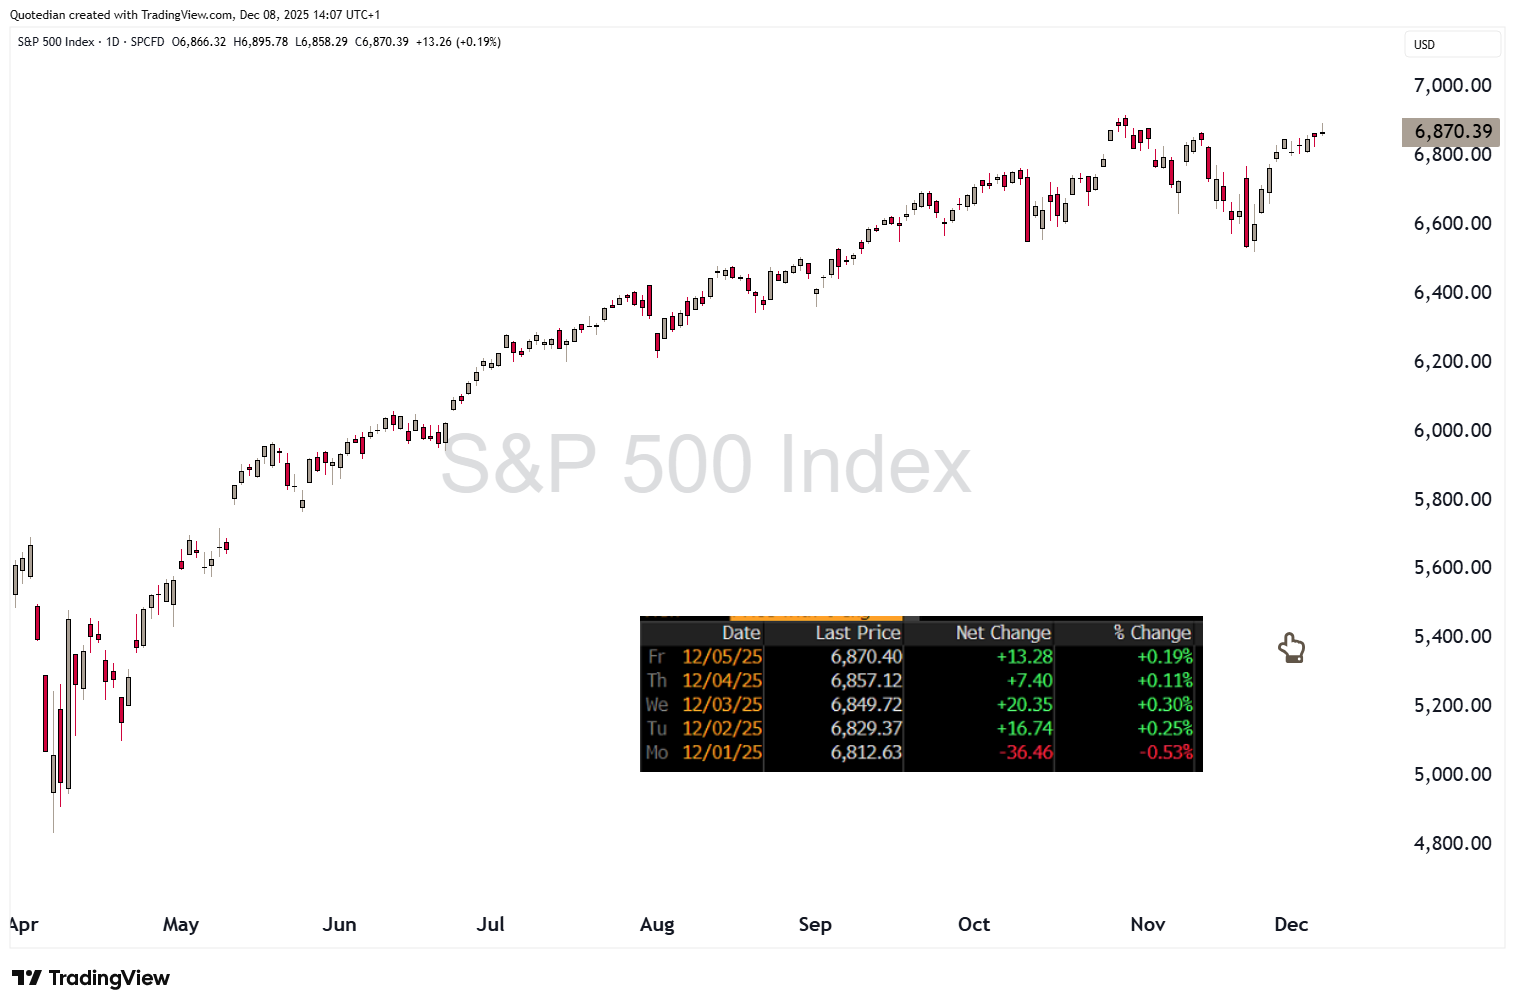
but they were an important twenty-one points gain, as the pattern of lower lows and lower highs was interrupted, decreasing the danger of a prolonged downturn:
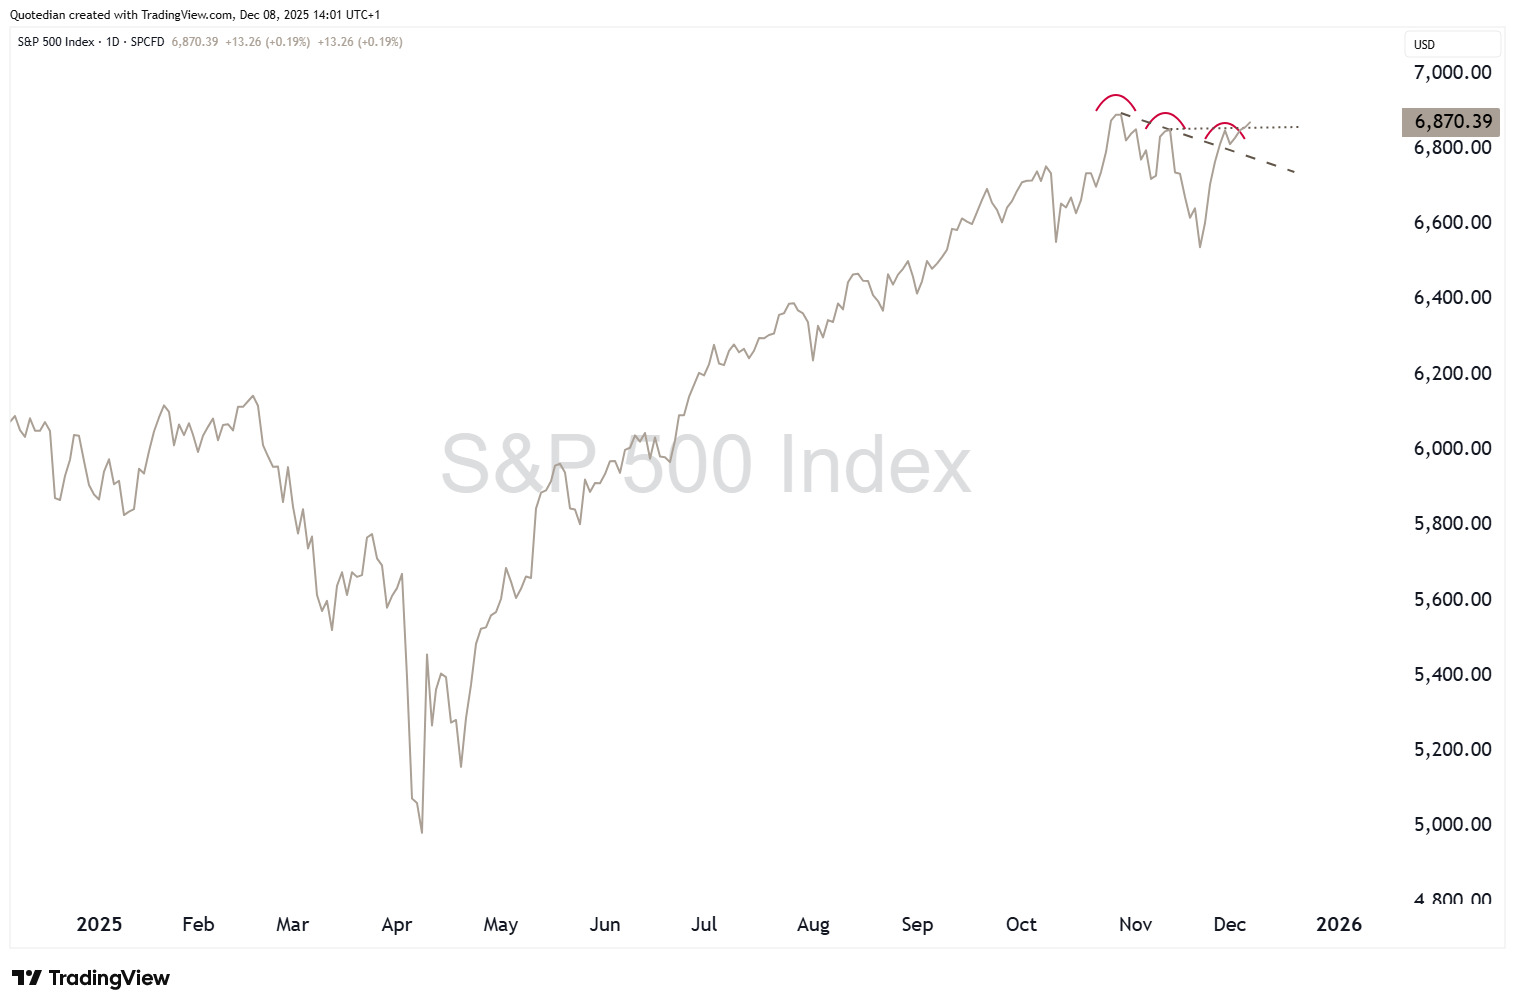
Seasonality would now dictate some weakness over the coming two weeks before the traditional Santa Claus rally,
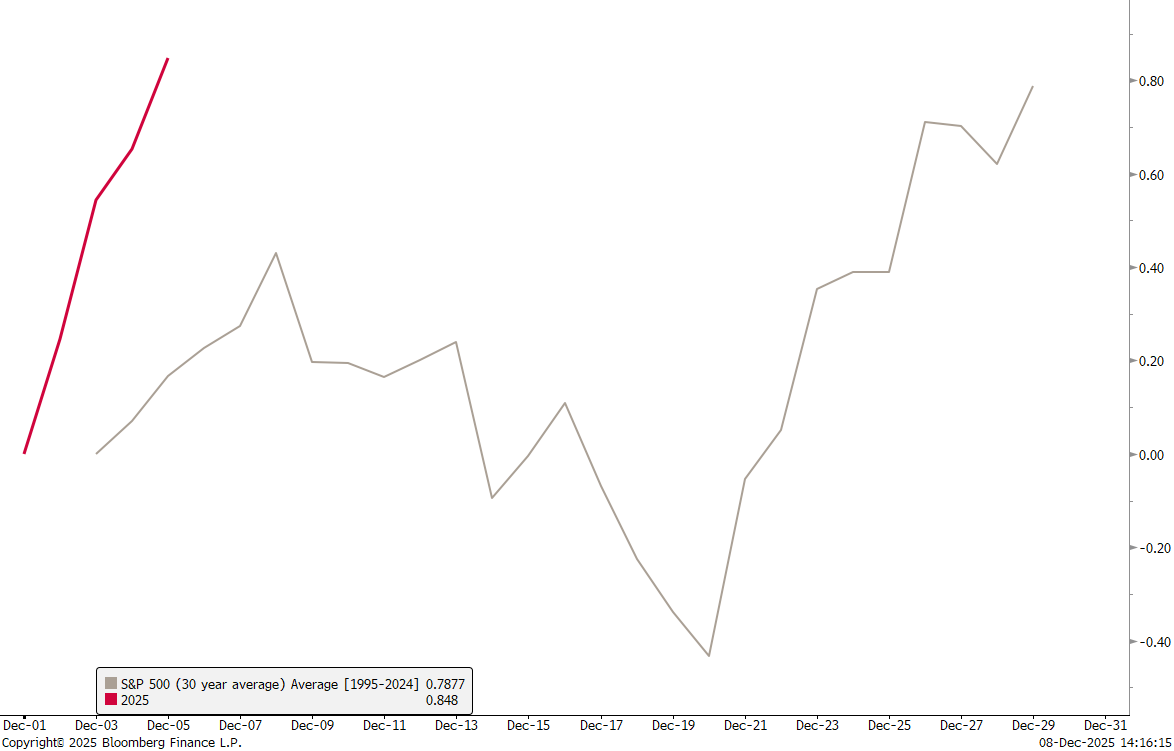
however, there is a fair chance that the weakness seen in November may be all that the bears get.
One index that pushed rapidly higher was the Dow Jones Transportation index:
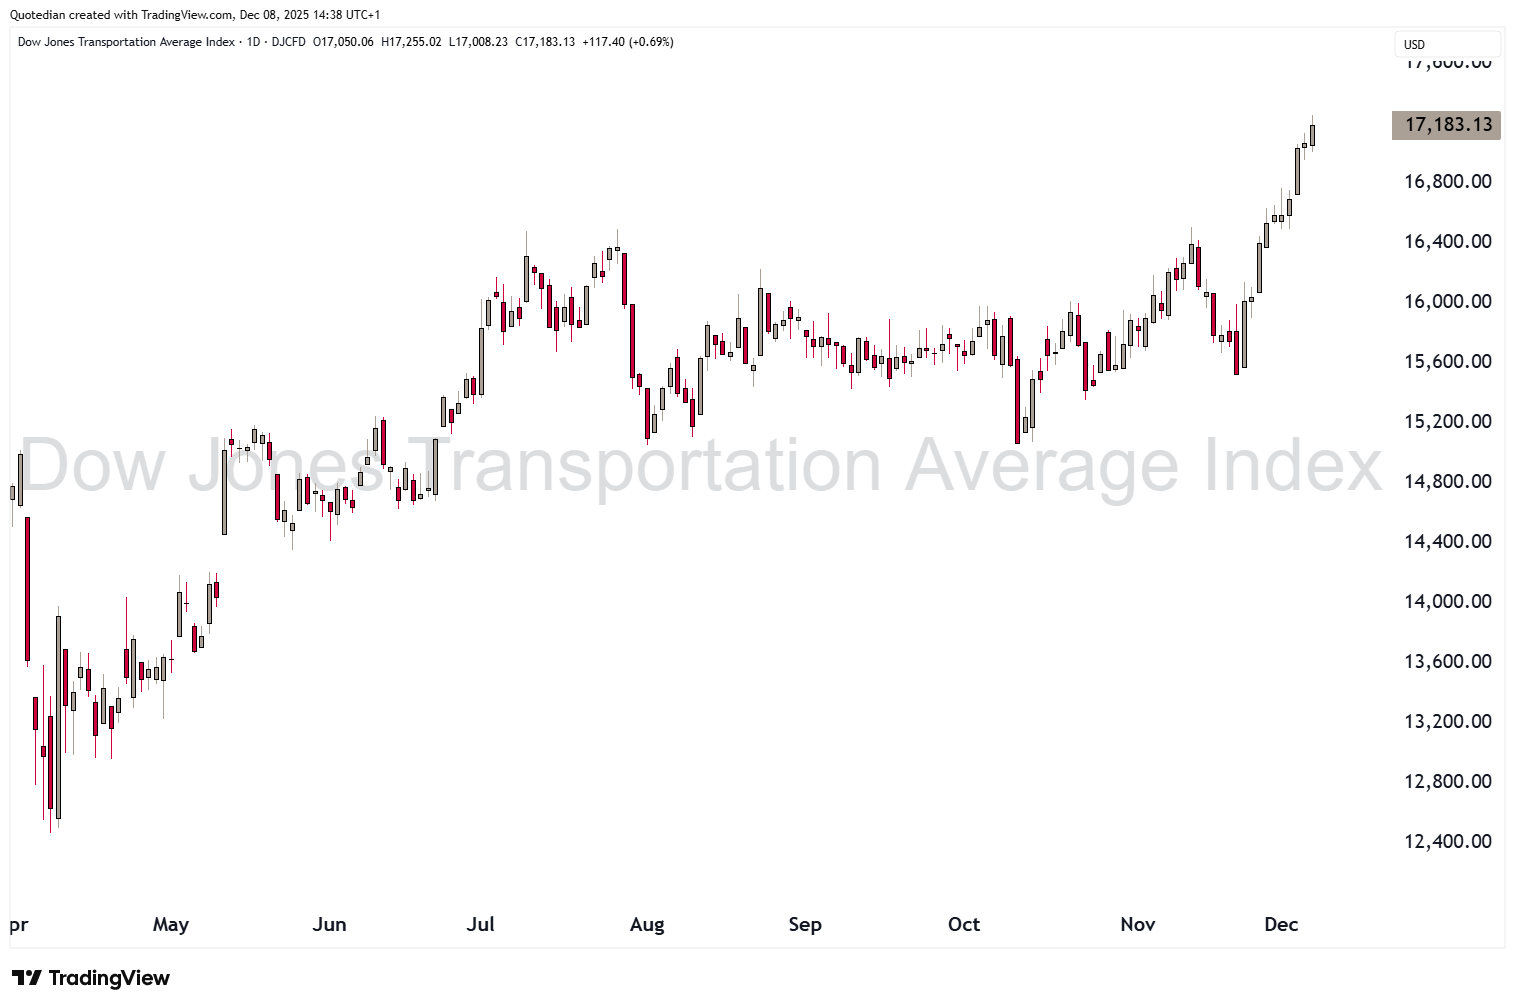
It is not quite an all-time high yet (2% missing),
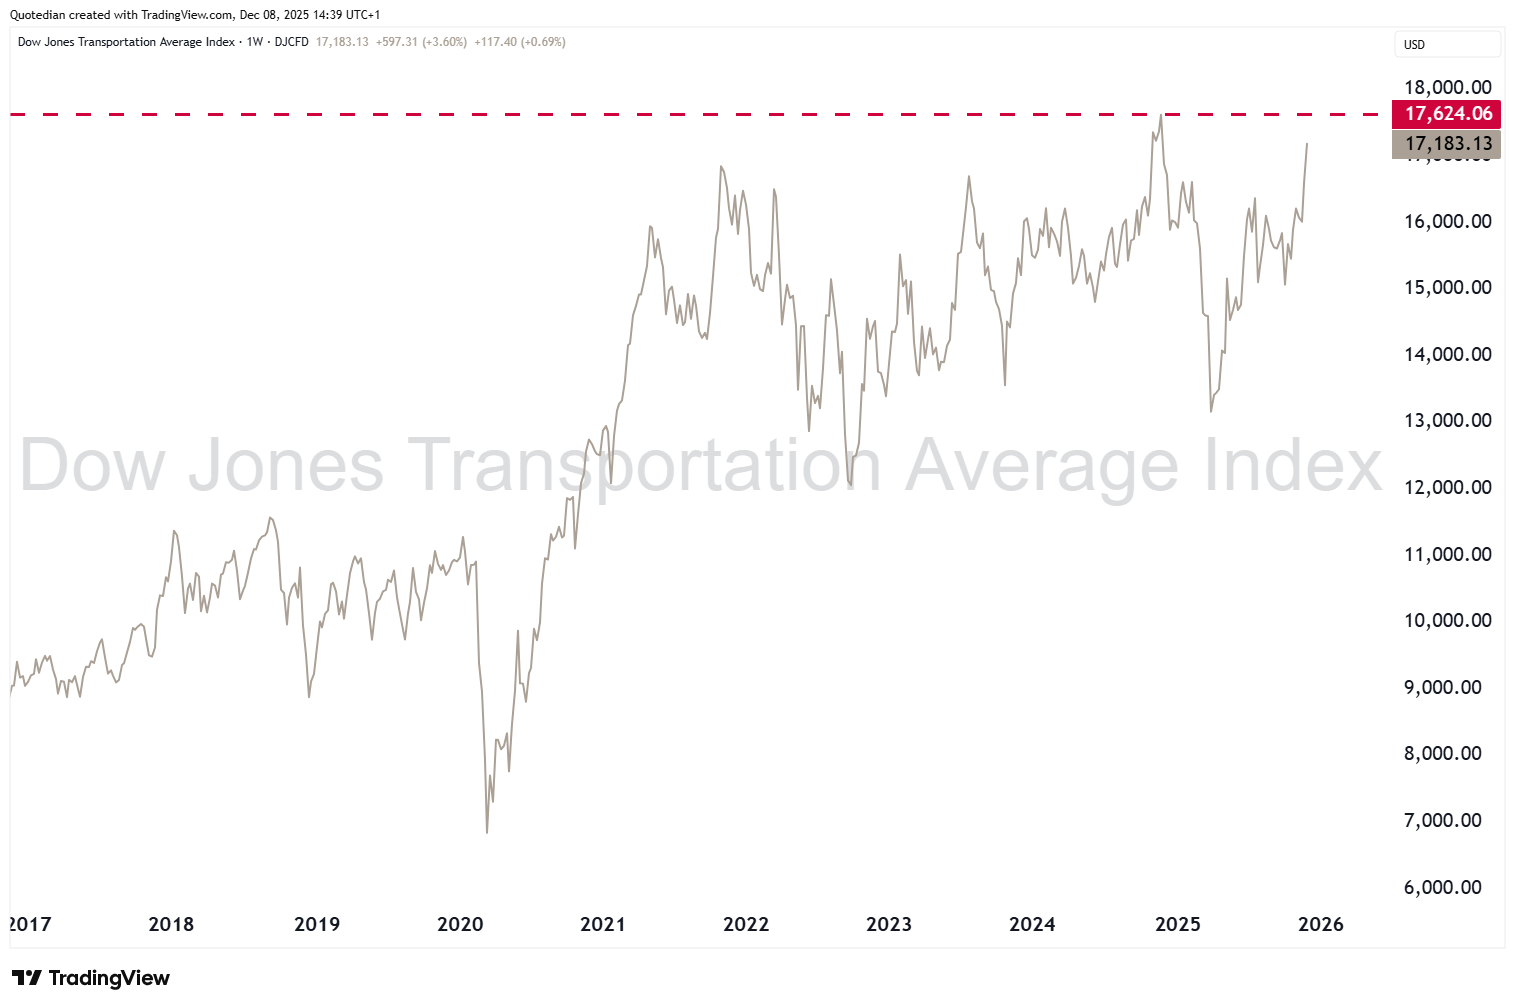
but as we highlighted last week, the new cycle high is enough to have triggered a Dow Theory buy signal.
Is the economy perhaps much stronger than assumed, given the strength in Transportation stocks?
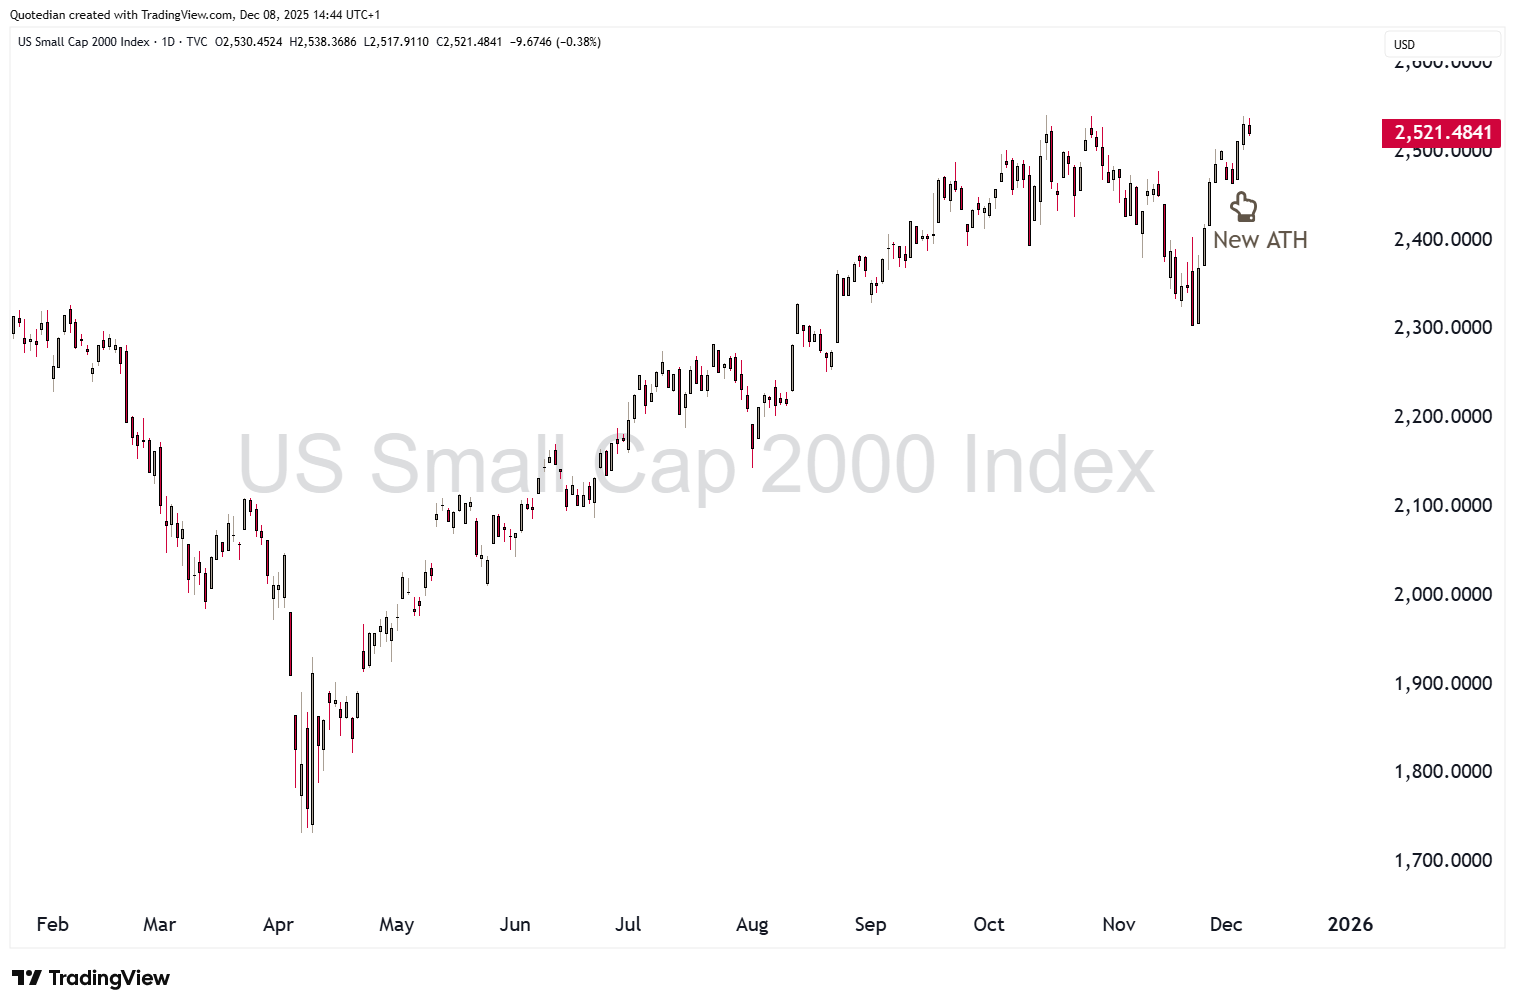
One index that HAS already reached a new all-time high is the small cap focused Russell 2000:
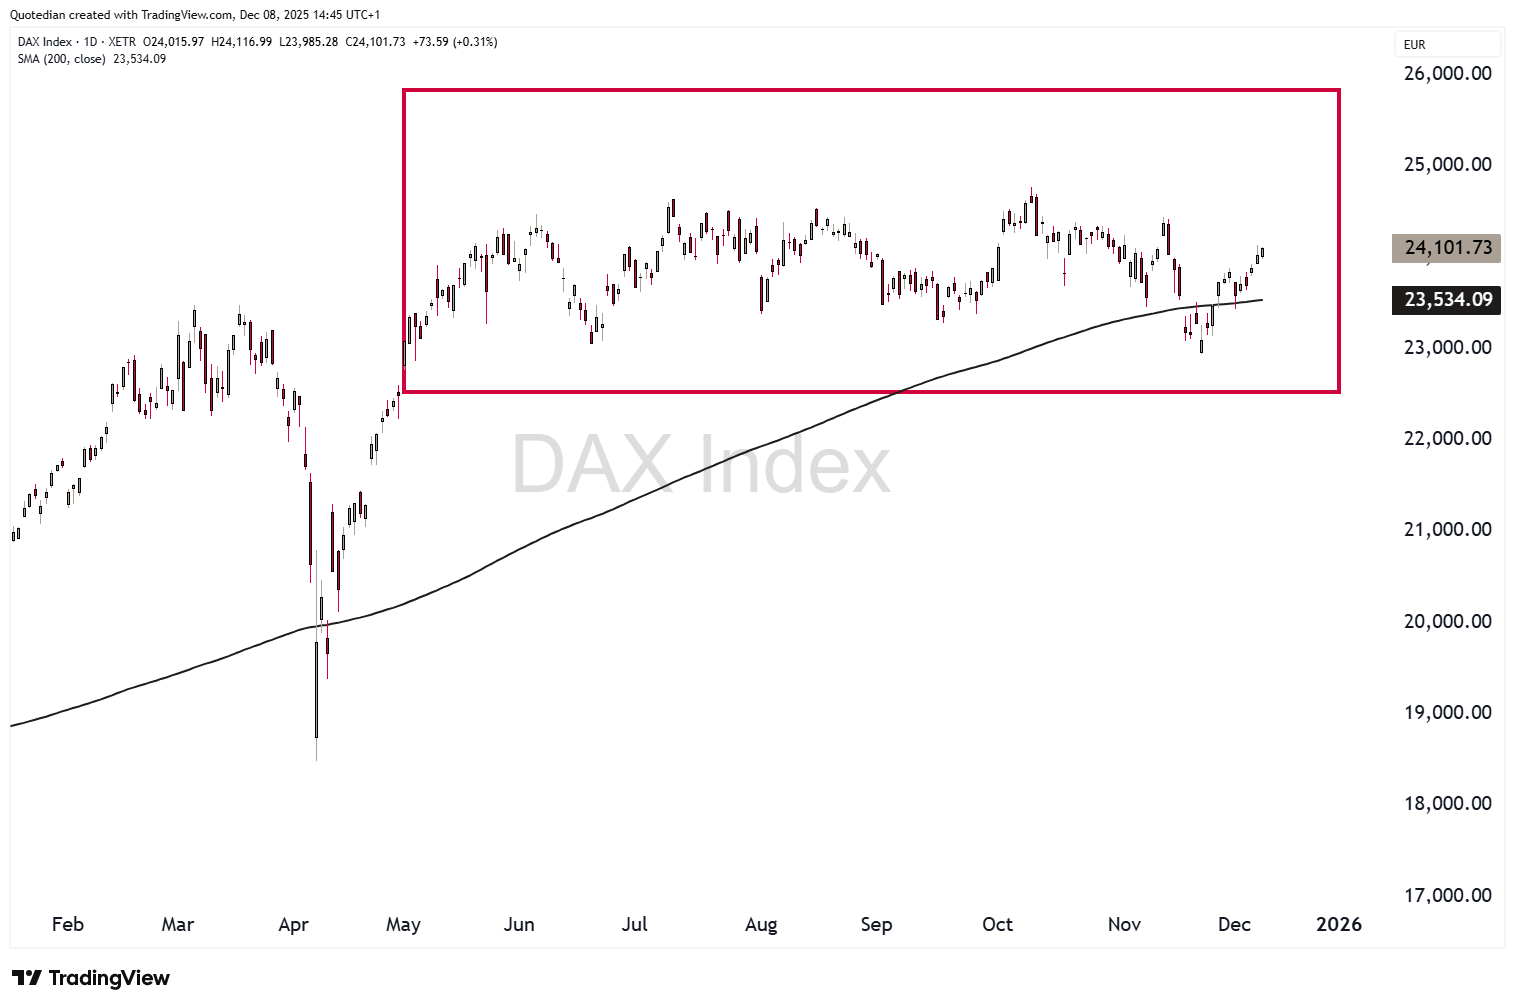
In Europe, Germany’s Dax continues to be range-bound, though the recent advances have lifted the index above its 200-day moving average again:
Switzerland SMI is leaving it relative underperformance behind,
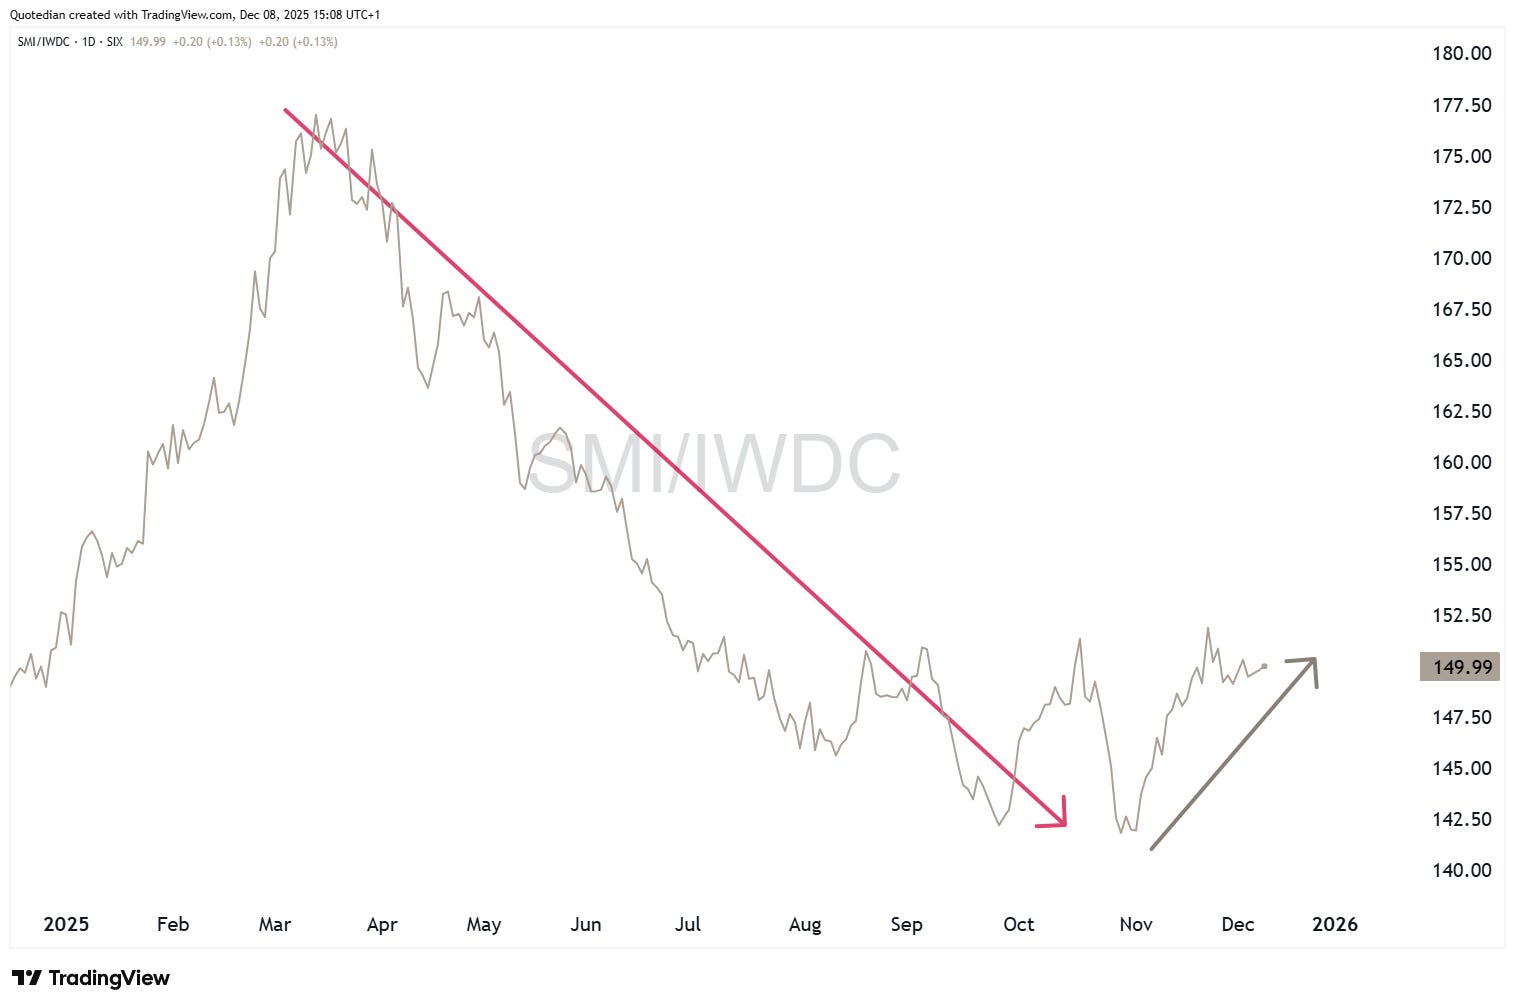
with the index closing in on all-time highs at :
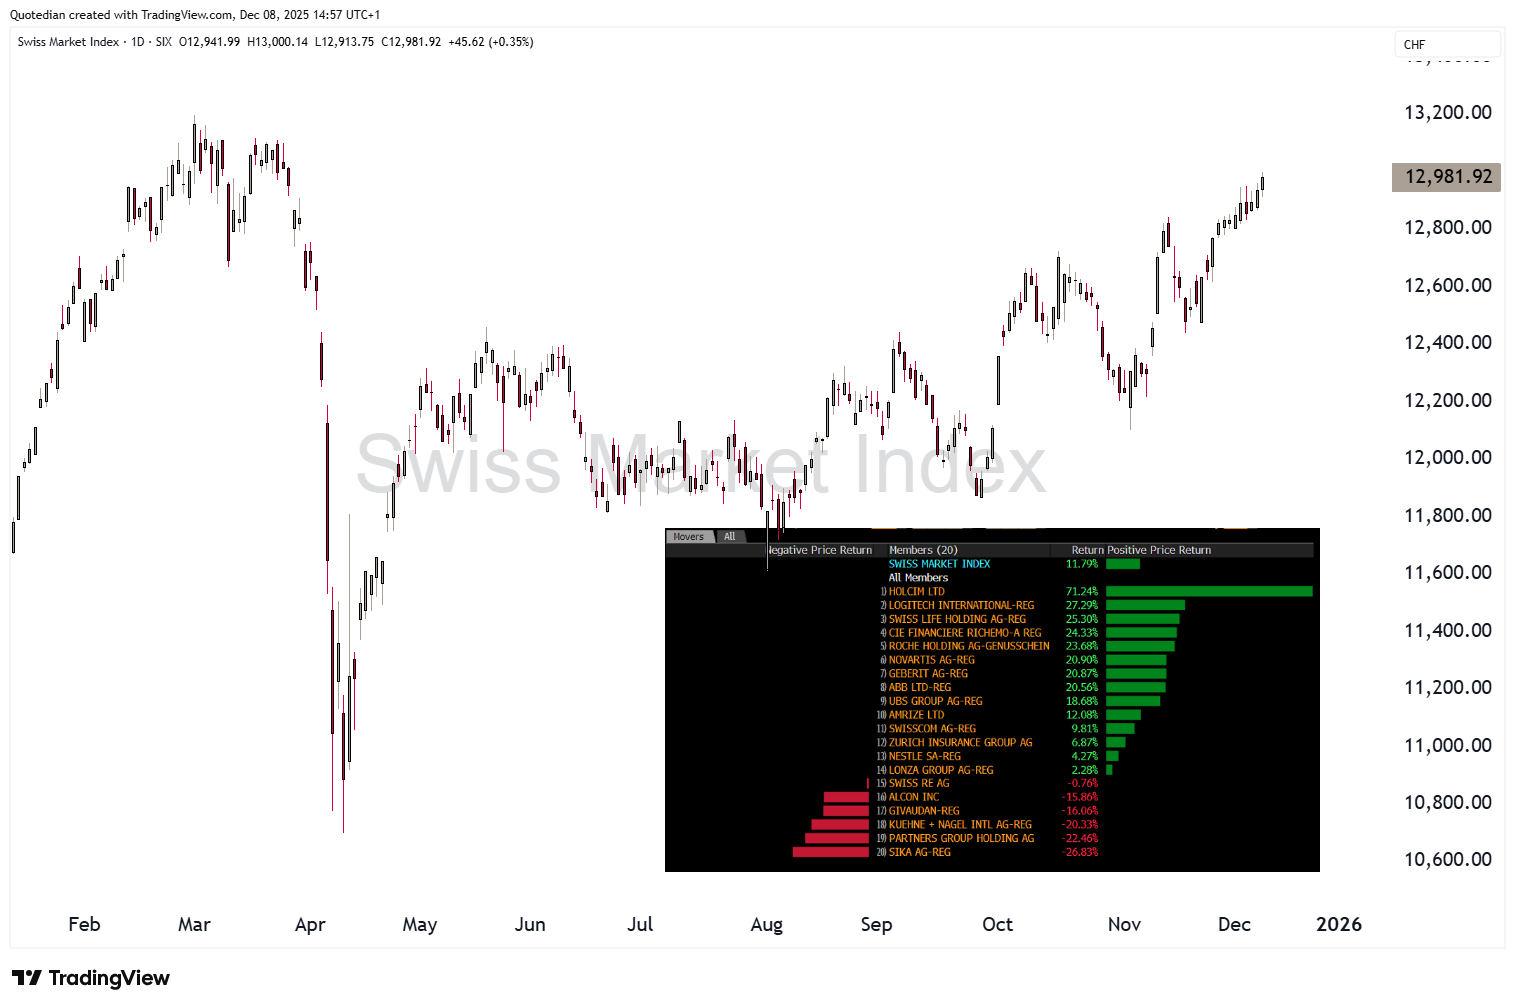
Strangely enough are the best (Holcim) and worst (Sika) performing stocks out of the same sector (building materials).

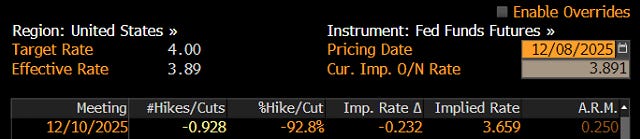
Turning to fixed income markets, this week is of certain importance, as the Swiss National Bank, the Reserve Bank of Australia and above all the US Federal Reserve Bank are all due to set their monetary policy rate (ECB, BoE, BoJ and others next week).
In the case of the Fed, the market expects a 25 basis points rate cut with a certainty of 93%:
The bond markets is already mildly protesting against the rate cut, with the 10-year Treasury yield rallying above 4.15 today:
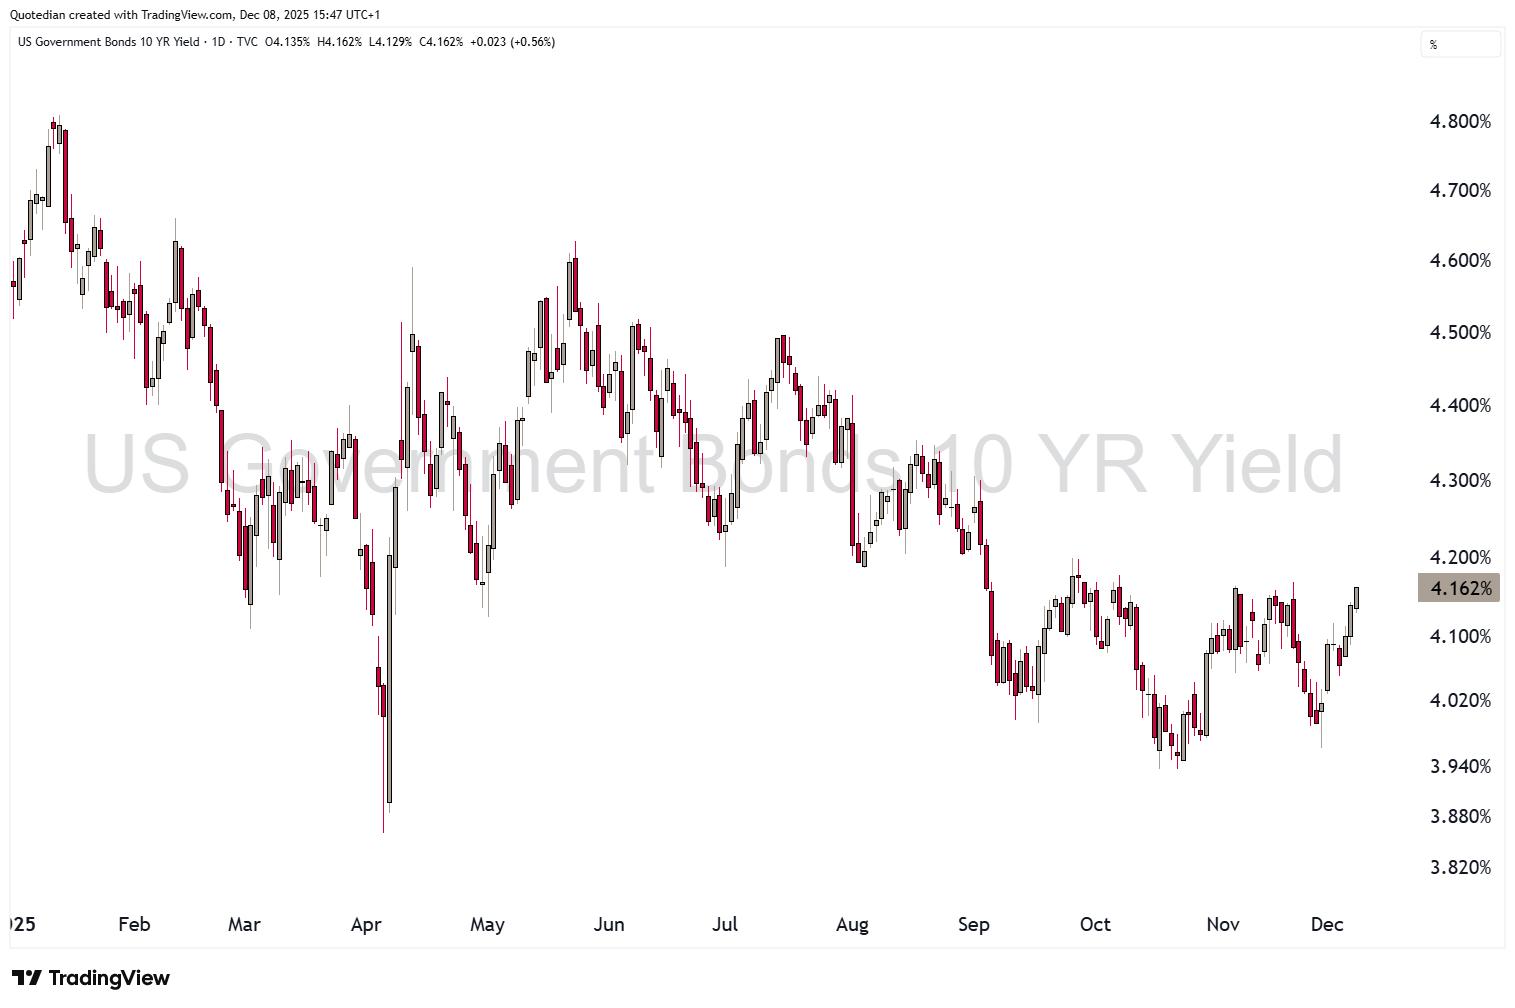
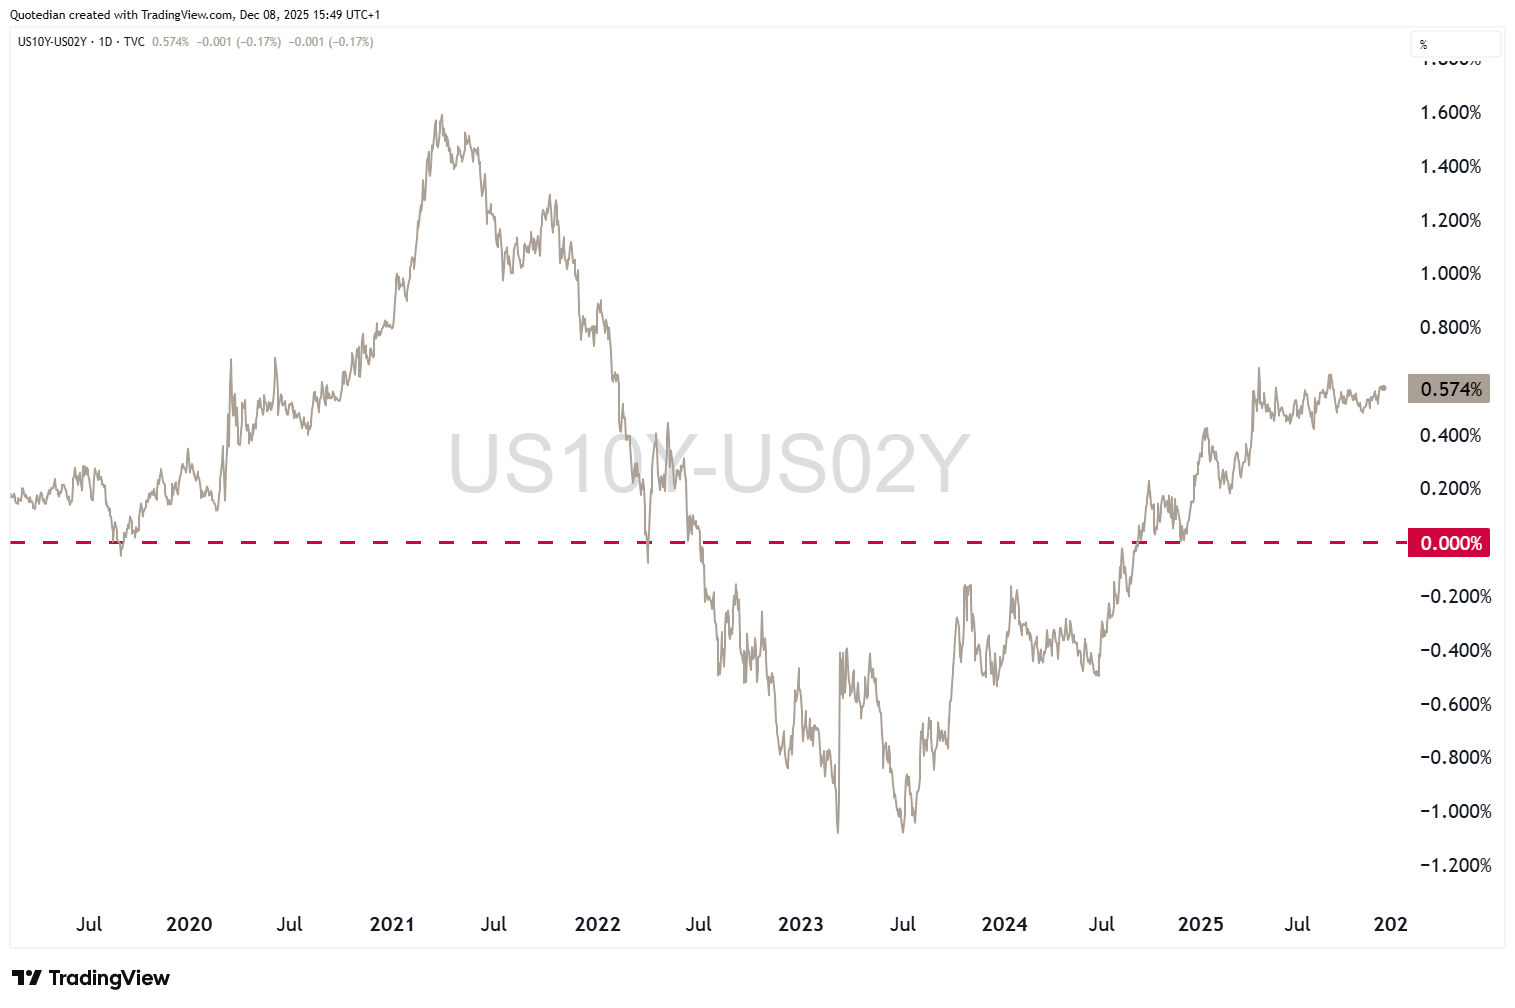
The yield curve is likely to steepen again post Wednesday FOMC cut:
Remember those bullish commodity charts at the outset of this week’s letter? Here’s a chart showing three different market inflation expectation measures compared to commodity prices (red line):
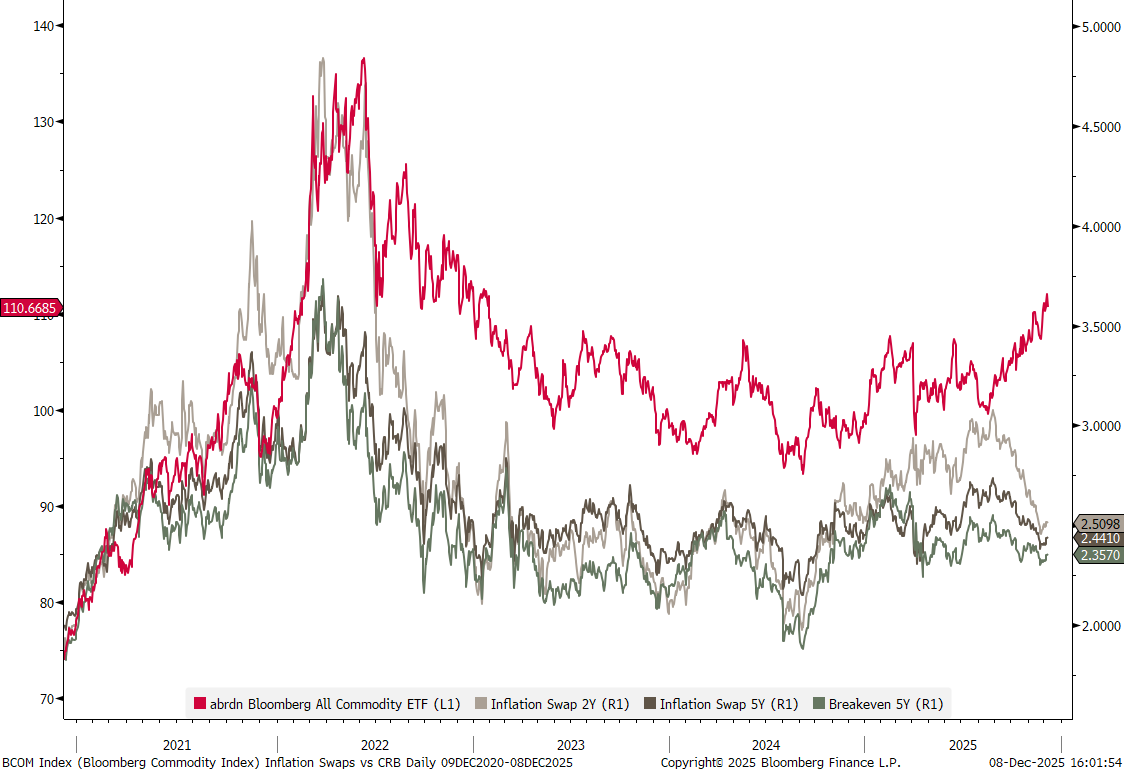
Normally, correlation between inflation expectation and commodity prices is pretty elevated. The current divergence should not be ignored - and imagine what would happen to the red line should oil prices suddenly also start moving higher ….
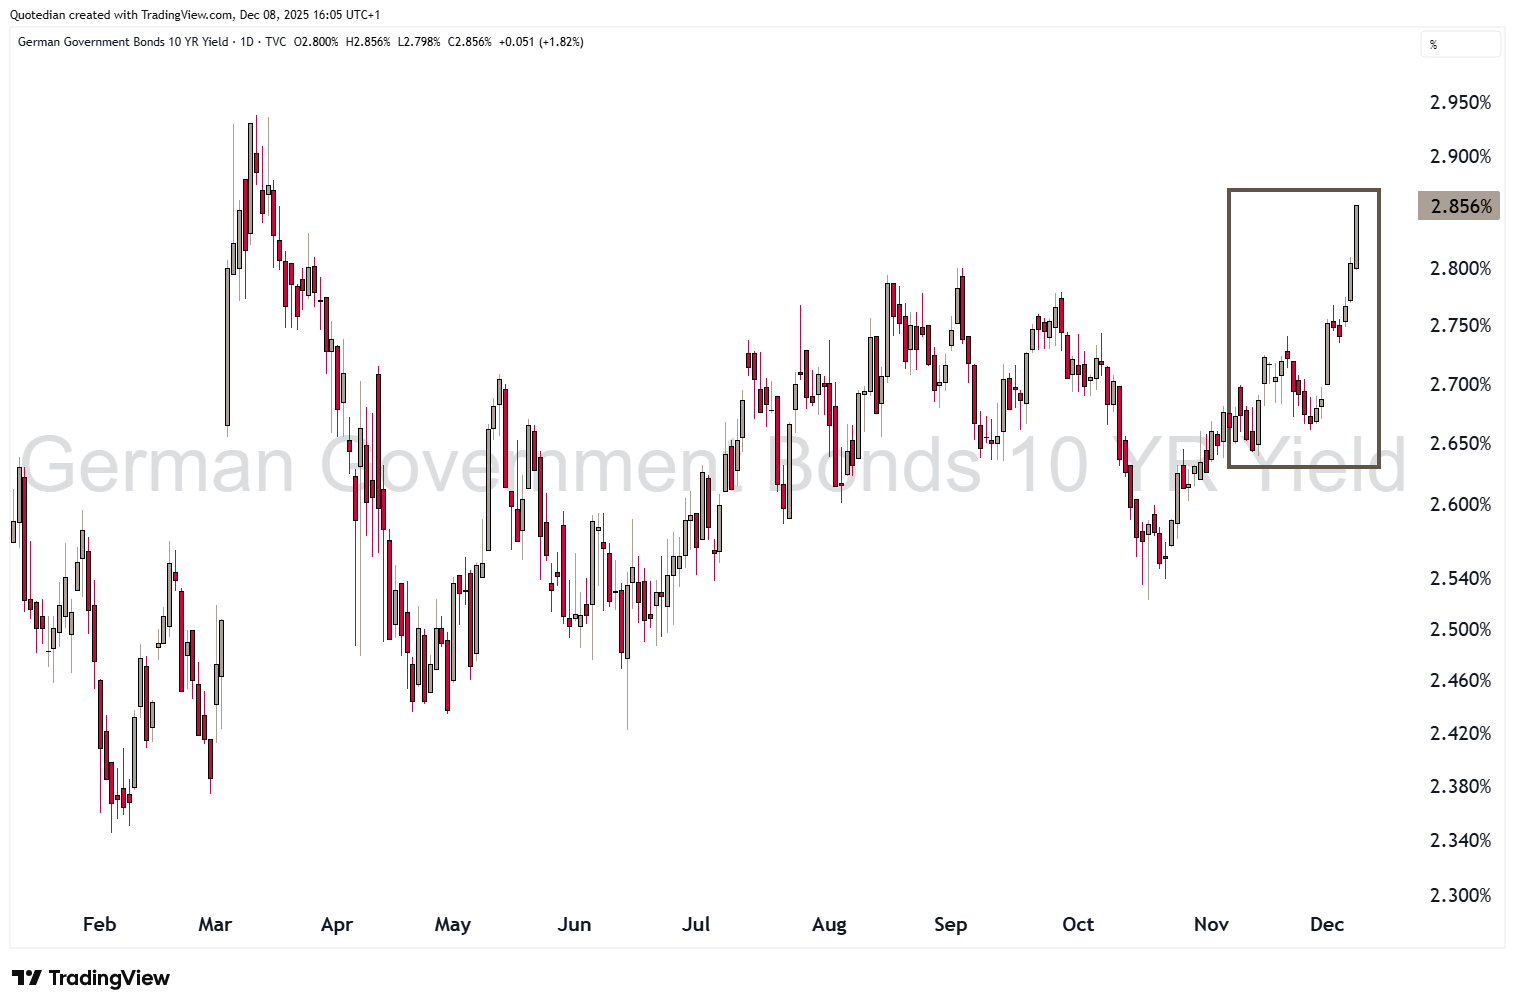
In Europe, rates have been moving higher at the long end of the curve too:
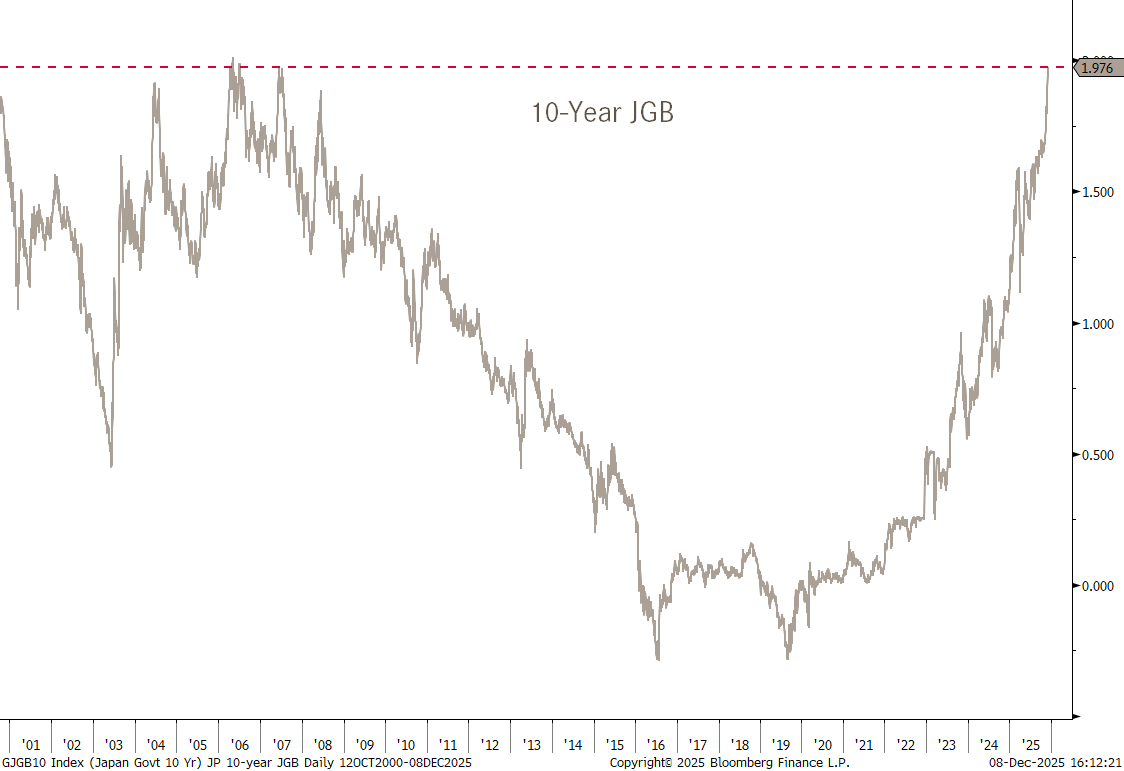
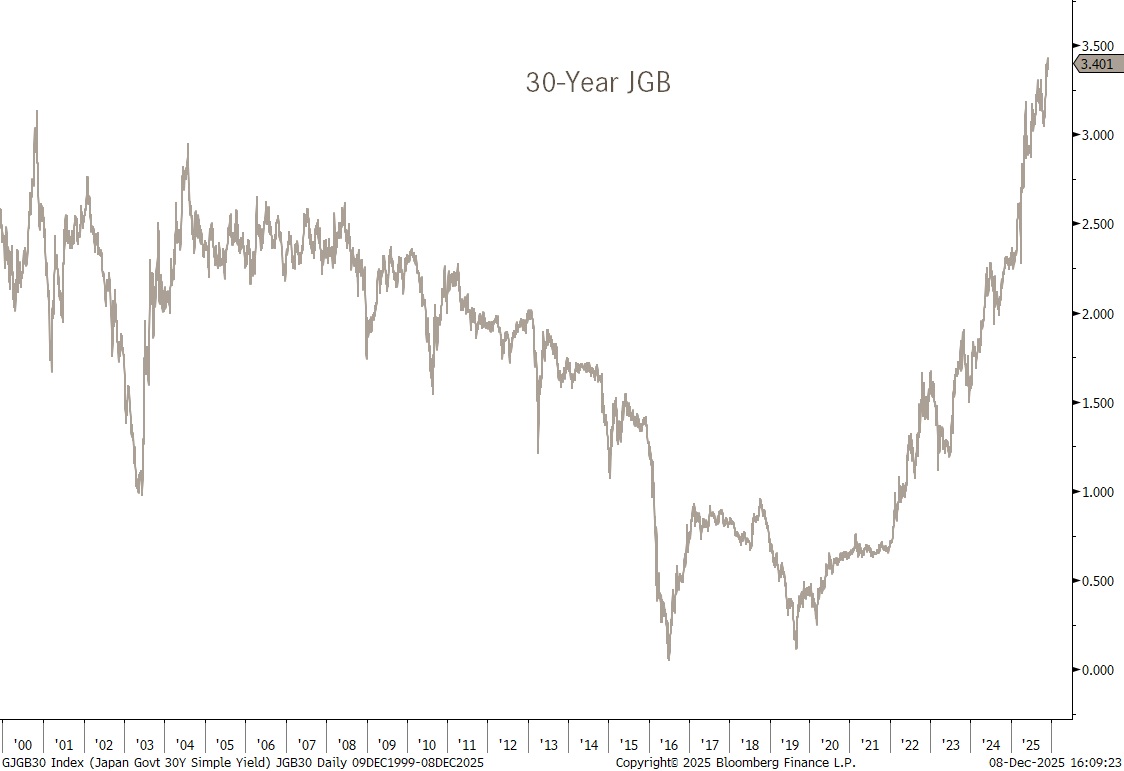
And not to mention Japanese JGB yields, with the Tens at their highest in decades,
and the 30-year version at its highest … on record!

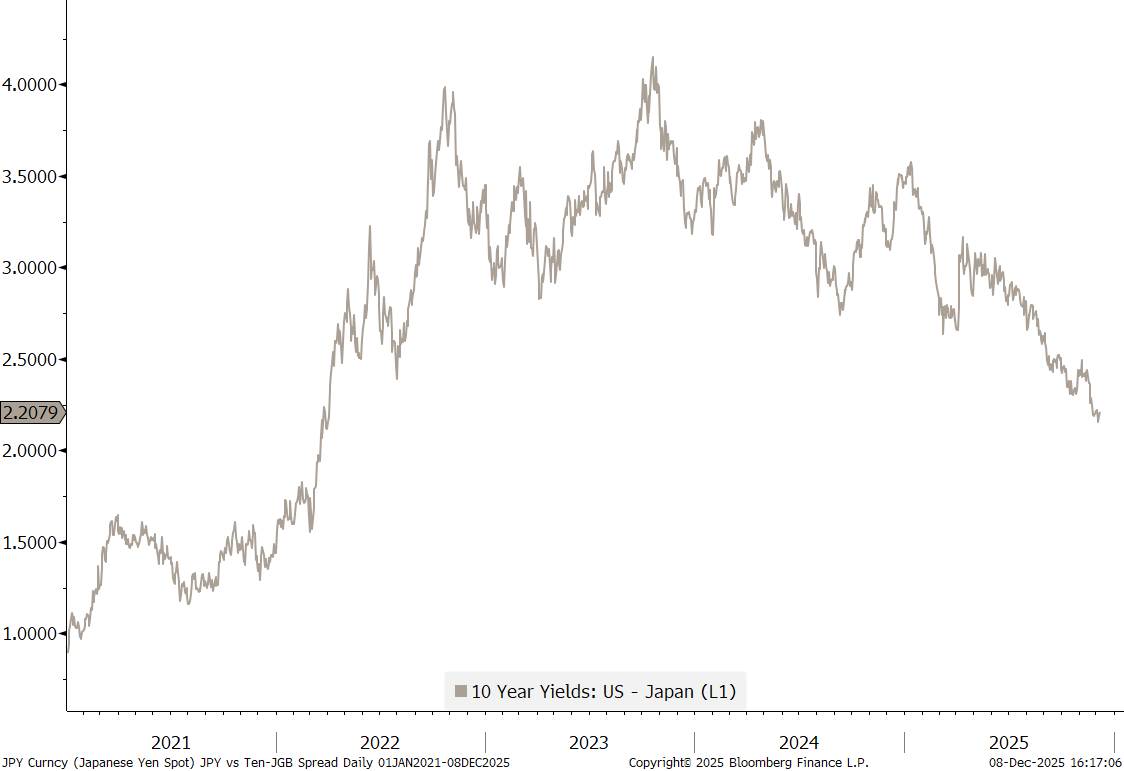
So, we have the Fed who will cut rates this week and the Bank of Japan likely with hiking its policy rate next wee. Hence the interest rate differential between the US and Japanese bonds (grey line) should be shrinking, right?
Which means the Japanese Yen is gradually more attractive whilst the US Dollar is becoming relatively less attractive, resulting in a falling USD/JPY rate (red line), right?
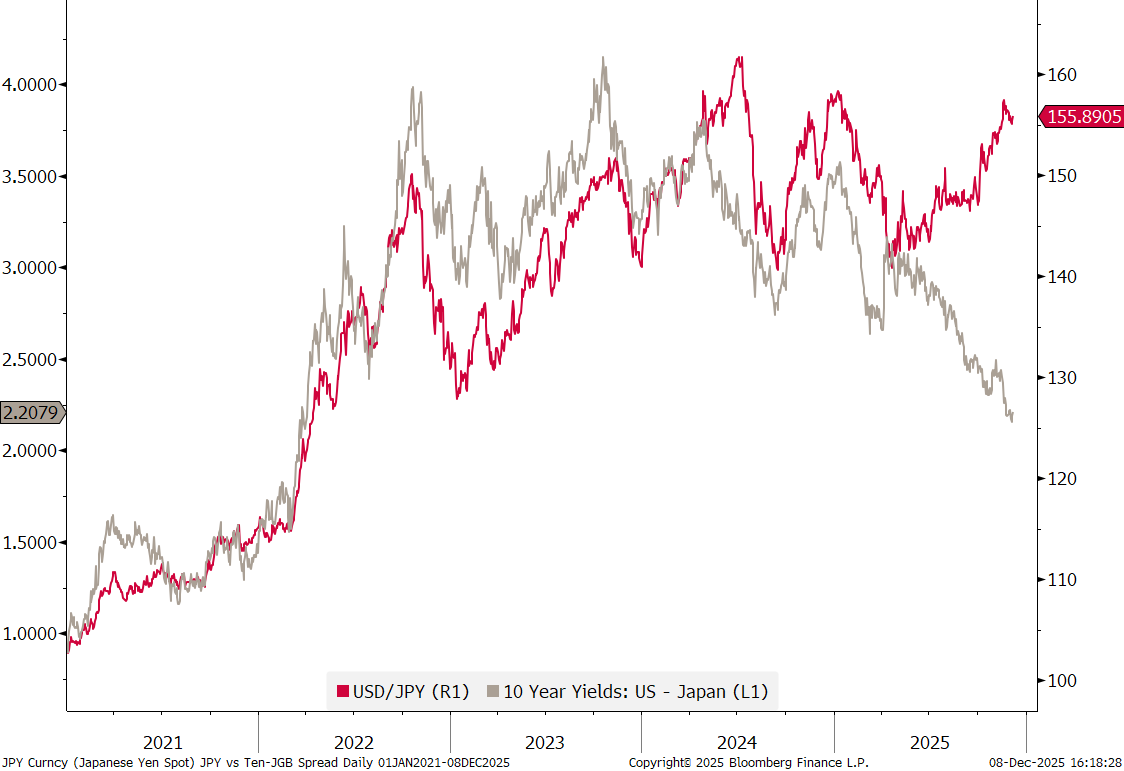
Wrong!
Another conundrum just as that falling inflation expectations versus rising commodity prices riddle previously discussed.

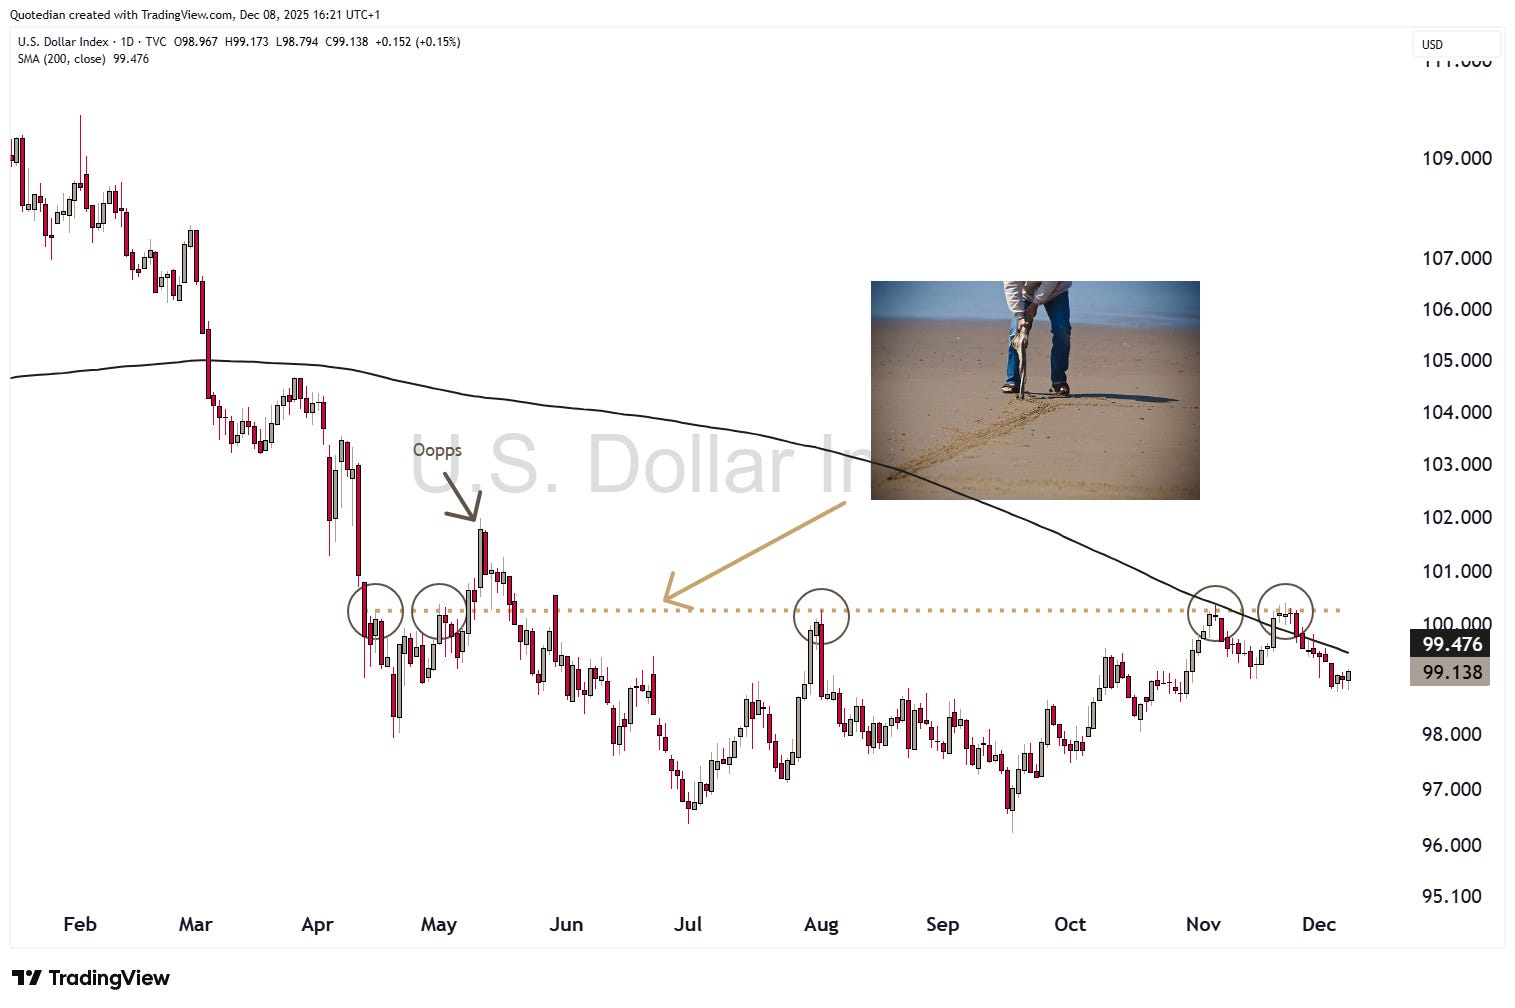
The US Dollar Index itself continues to trade below our line in the sand we drew at 100.00 and seems to have additional headwind from the falling 200-day moving average:

We have already discussed our commodity bullishness at length today, but here is one final, monthly chart of the broader commodity market:
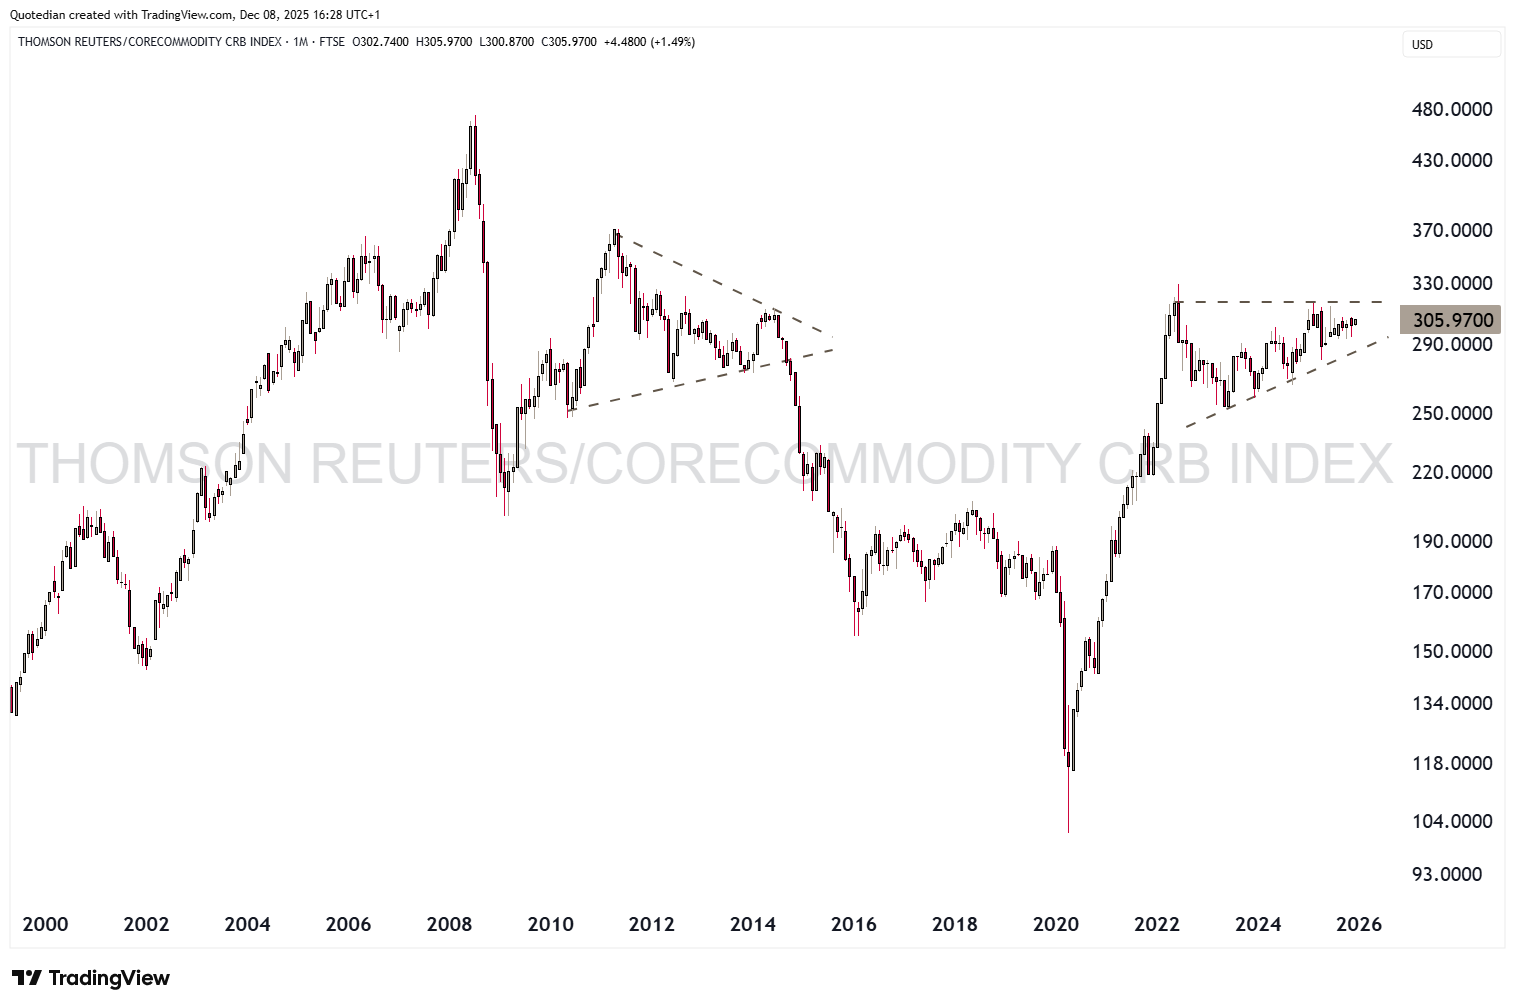
Similar as the breakdown in 2014 led to a steep sell-off, I could now imagine a reverse picture, where the index moves above 330 and sees an upside acceleration of the trend.
Alright, that’s it for this week. Same time, same place, next week. And don’t say I didn’t warn you.
André

In reality, you need no other Disclaimer than the one above, but just in case:
Everything in this document is for educational purposes only (FEPO)
Nothing in this document should be considered investment advice
Investing real money can be costly; don’t do stupid shit
Leave politics at the door—markets don’t care.
Past performance is hopefully no indication of future performance
The views expressed in this document may differ from the views published by Neue Private Bank AG