

Market Mojo
Vol VII, Issue 45 | Powered by NPB Neue Privat Bank AG

"When the market’s got its mojo, even gravity takes a back seat."
— The Quotedian

Last week in a nutshell:
Monday
Syrian rebels take Aleppo raising chances of a regime change - S&P 500 rises 0.24%
Tuesday
South Korea’s president declares martial law - S&P 500 rises 0.05%
Wednesday
CEO of an S&P 500 company (UNH - market cap $550 billion). ISM drops by 4 points - S&P 500 rises 0.61%
Thursday
Bitcoin surpasses $100,000 for the first time - S&P 500 drops -0.19%
Friday
US non-farm payroll number beats most expectations, putting the Fed between a Rock and a Hard Place for the planned rate cut of next week - S&P rises 0.25%
Nothing, really nothing seems to be able to derail this (US) equity rally at the moment. It seems only a true Cheneyian “unknown unknown” could, maybe, beat the FOMO and YOLO out of investors.
The market mojo is massive.

Let’s start our usual weekly market deliberations, if you feel like it, accompanied by this week’s theme song: Got My Mojo Workin’ , originally performed by Muddy Waters.
(or alternatively, listen to Ladyva’s version by clicking here)

Hence, as fore-mentioned, the S&P 500 closed up four out of five sessions last week, but curiously enough on all five days, more stocks declined than advanced:

A warning sign? Perhaps. However, to make “things” even weirder, on each day the number of stocks hitting new 52-week highs versus those hitting a new 52-lows was at least twice as many. A de-warning sign. Also perhaps.
Here’s the chart of the S&P 500 now:

We are hearing it from all over and everywhere …
“after two consecutive 20+ years it is impossible for the uptrend to continue”
“stock have gotten ahead of themselves”
“American exceptionalism is in a bubble”
To all the above, I say … perhaps.
Or perhaps not:
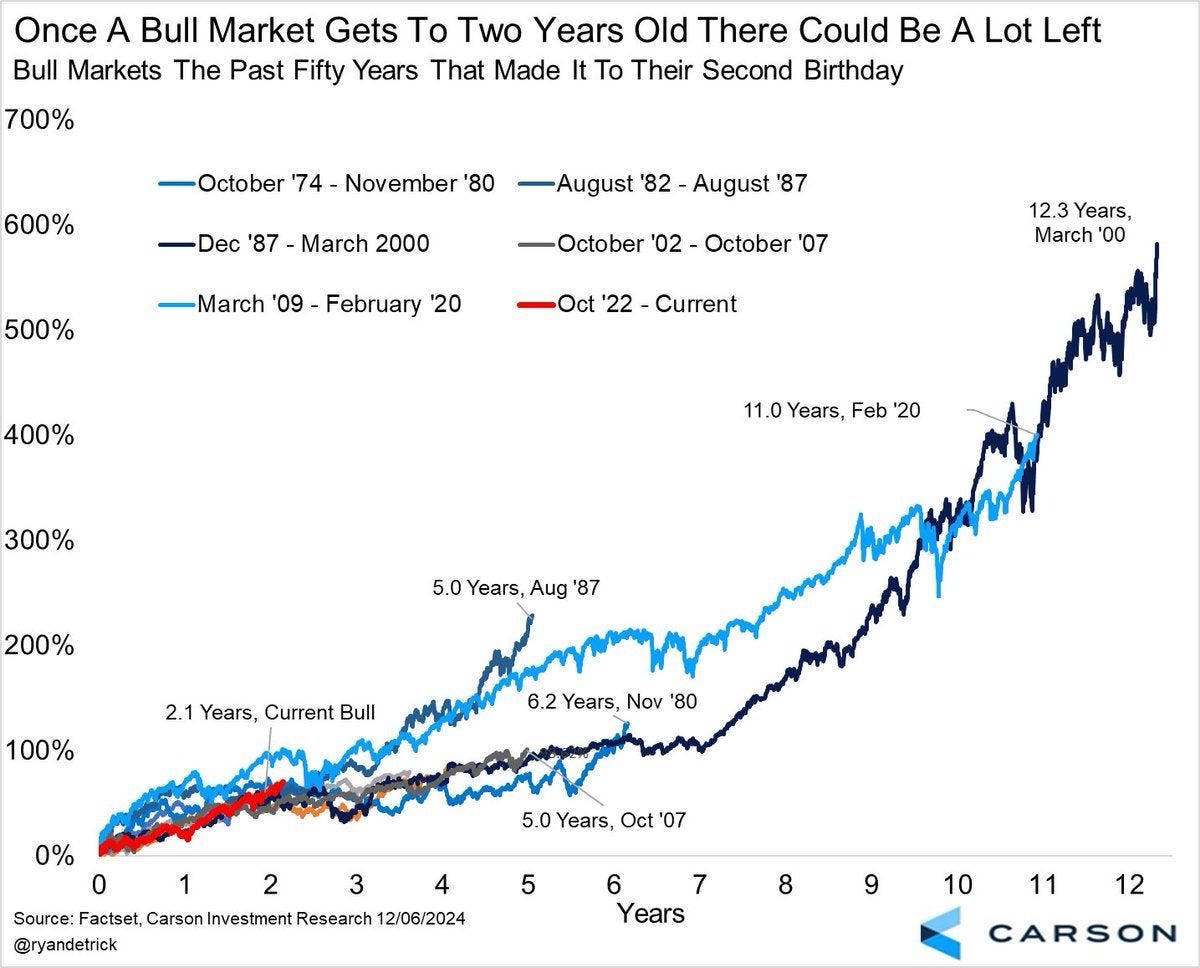
Just imagine for a moment that this will be the longest, second longest, third longest or even only fourth longest rally and you sold out at the end of 2024 …

Now, it’s never easy, especially if you get bombarded with how overbought everything is and how überbullish investors are. Here’s just one of many “get the hell out of stocks” chart that sneaked their way into my inbox over the weekend:

Scary? Sure. Relevant. Maybe. But probably not the way you think.
I find one of the best market axioms every have been stuttered by some permabull to be: “there is nothing as bullish as an overbought market that keeps going up”.
Also, two notorious … constantly wrong … a broken-clock-is-right-twice-a-day … remarkable permabears have been throwing in their respective towels in a relative short time period. First, Morgan Stanley’s Mike Wilson surprised everyone with a (equity) bullish 2025 outlook and shortly after, the following Tweet made the social media rounds:

But again, anticipating the end of the rally based on this kind of stuff can cost you a lot of upside and/or your job.
For now, at the simplest level, the charts are moving from the bottom left to the top right:

Furthermore, it seems that the market may be moving even more into “risk on” mode, as measured by the ratio of High Beta (SPHB) to Large Value (SPLV) stocks:

But let’s look at some other markets too. For example the Nasdaq-100, which had an even better week than the mighty S&P 500:

Here’s the heatmap for this index over the past five sessions:
Which, if you are on the bullish side, looks much more constructive than the one of the S&P 500:
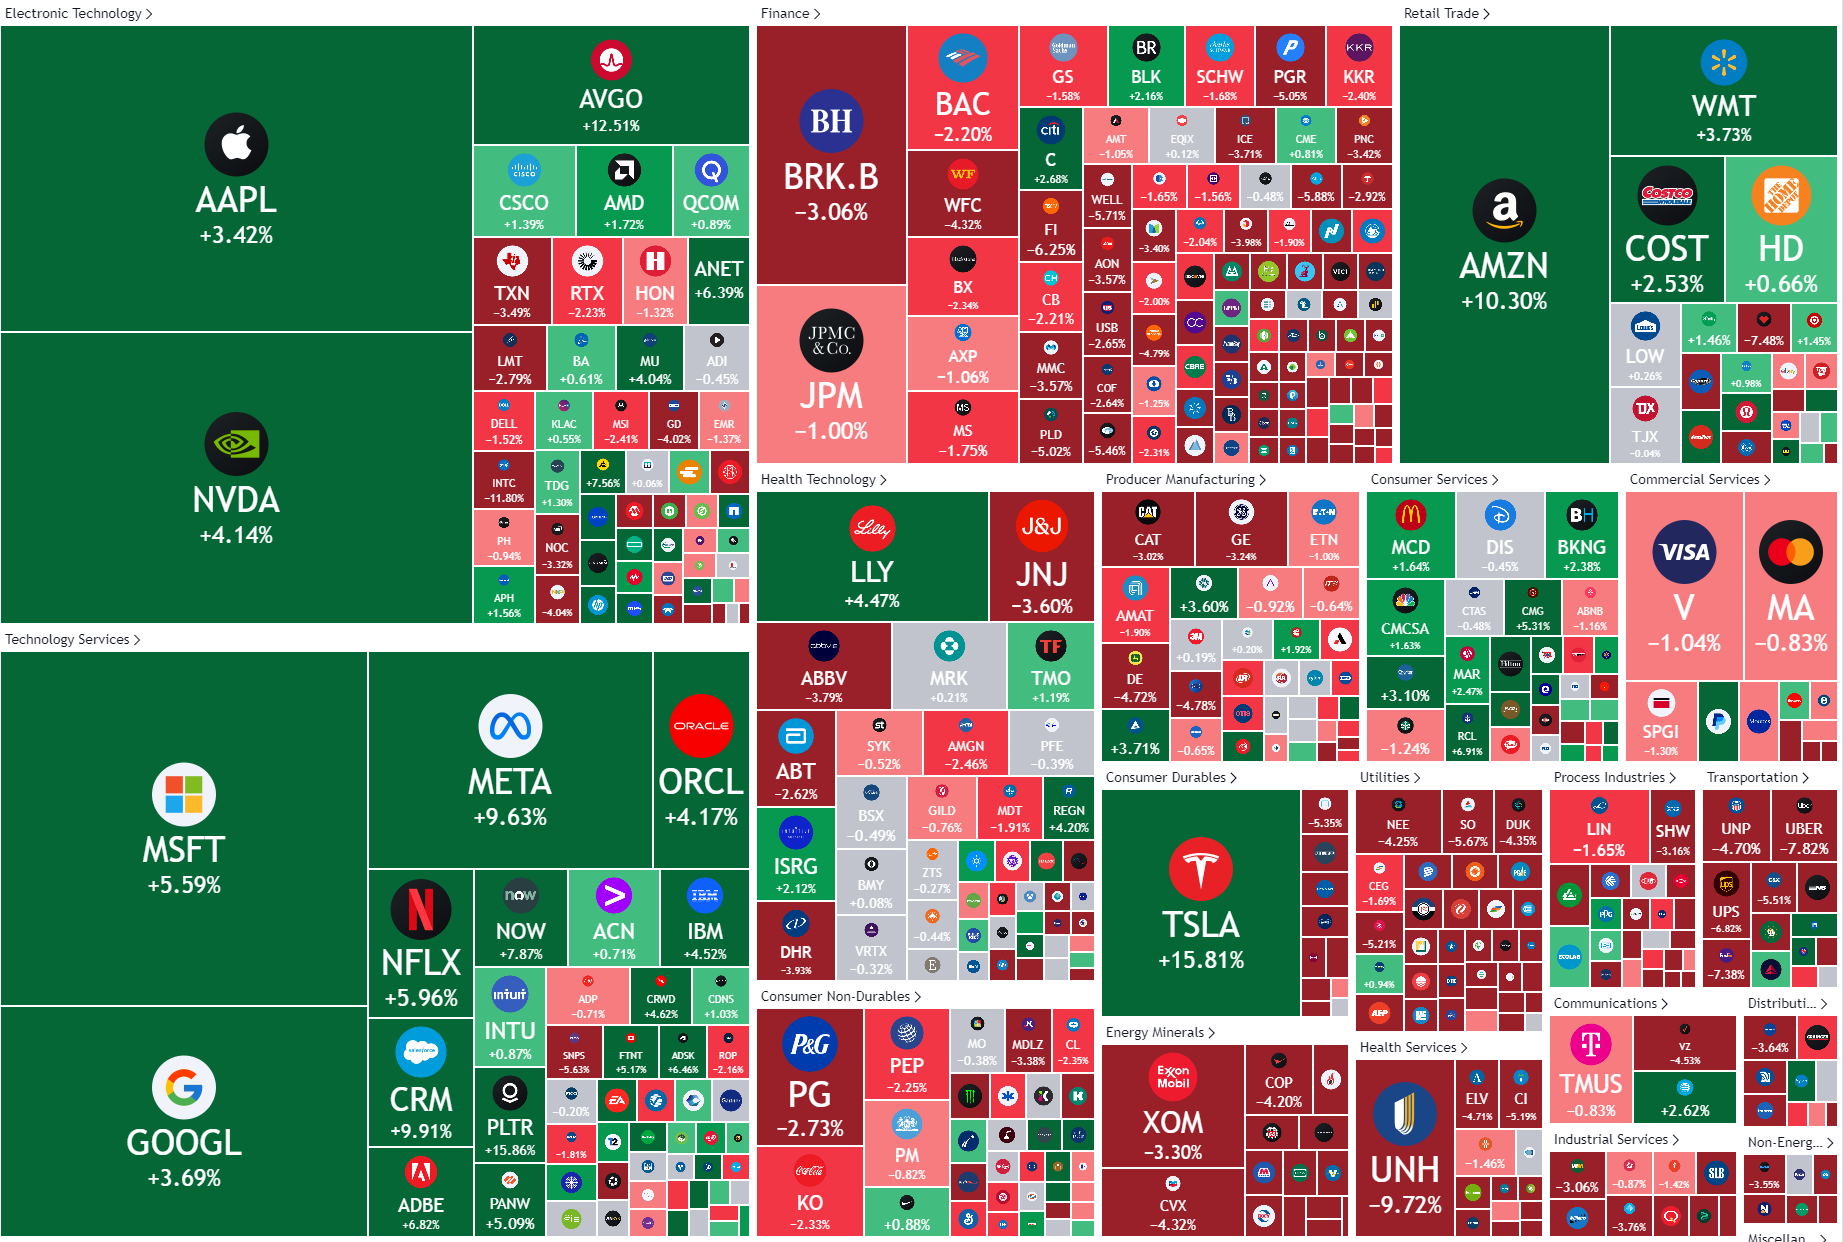
This latter showed much more red, due the phenomena outlined at the beginning of the equity section.
The above obviously already indicates the it has been a good time for the mega caps, here represented the Mag 7 ETF (MAGS - grey), which is outperforming the S&P 500 (SPY - red) and the S&P 500 equal-weight index (RSP - blue):


Turning to Europe, stocks in the basket-case zone (shall we coin the acronym: BCEU?) had a fantastic week, leaving their US peers eat their dust (for once):


Only another 100 weeks like the past and European stocks may be able to break their long-term downtrend versus US stocks:

But I am being naughty of course. Last week’s move is encouraging because,
It has gone largely unnoticed (you, dear Quotedian readers, are now of privileged knowledge)
It comes at a time when everybody is max bearish Europe
It probably has to do with Syria
Ha! That last one caught you by surprise, no?
The Syria situation is a major defeat to Russian “Aussenpolitik” and is being interpreted a net-net positive for European markets. Let’s stay tuned on this one …
Anyway, the STOXX 600 index shown two charts ago was up 2% (versus the S&P500 1%) over the week, but was dwarfed by the more concentrated Euro STOXX 50 index’s return of nearly four percent:
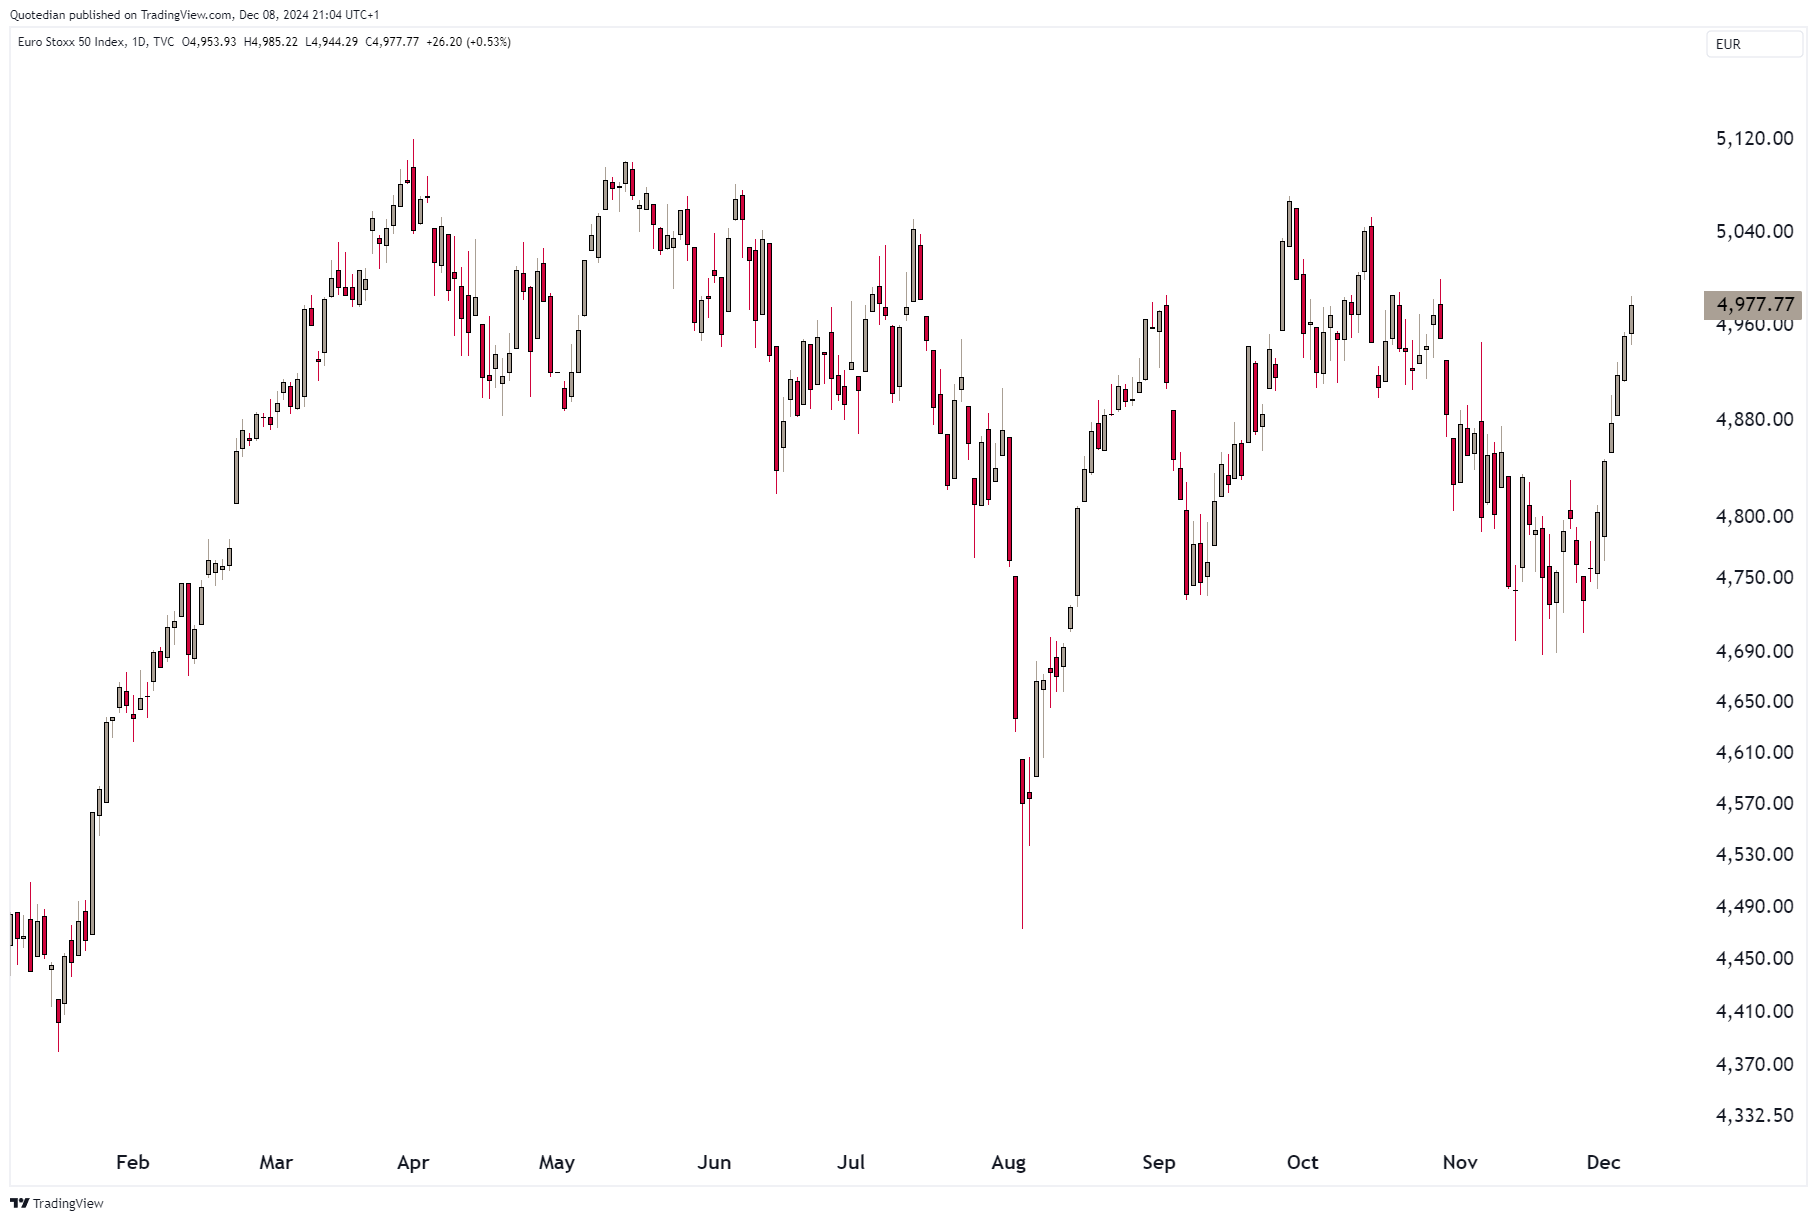
This could suddenly start looking extremely constructive. Zooming out:

Here is economic BCEU-in-chief, Germany:


Even France, was to raise a head above the Guillotine last week:

Switzerland’s SMI had a much less constructive five sessions, ending the week nearly flat (+0.14%):

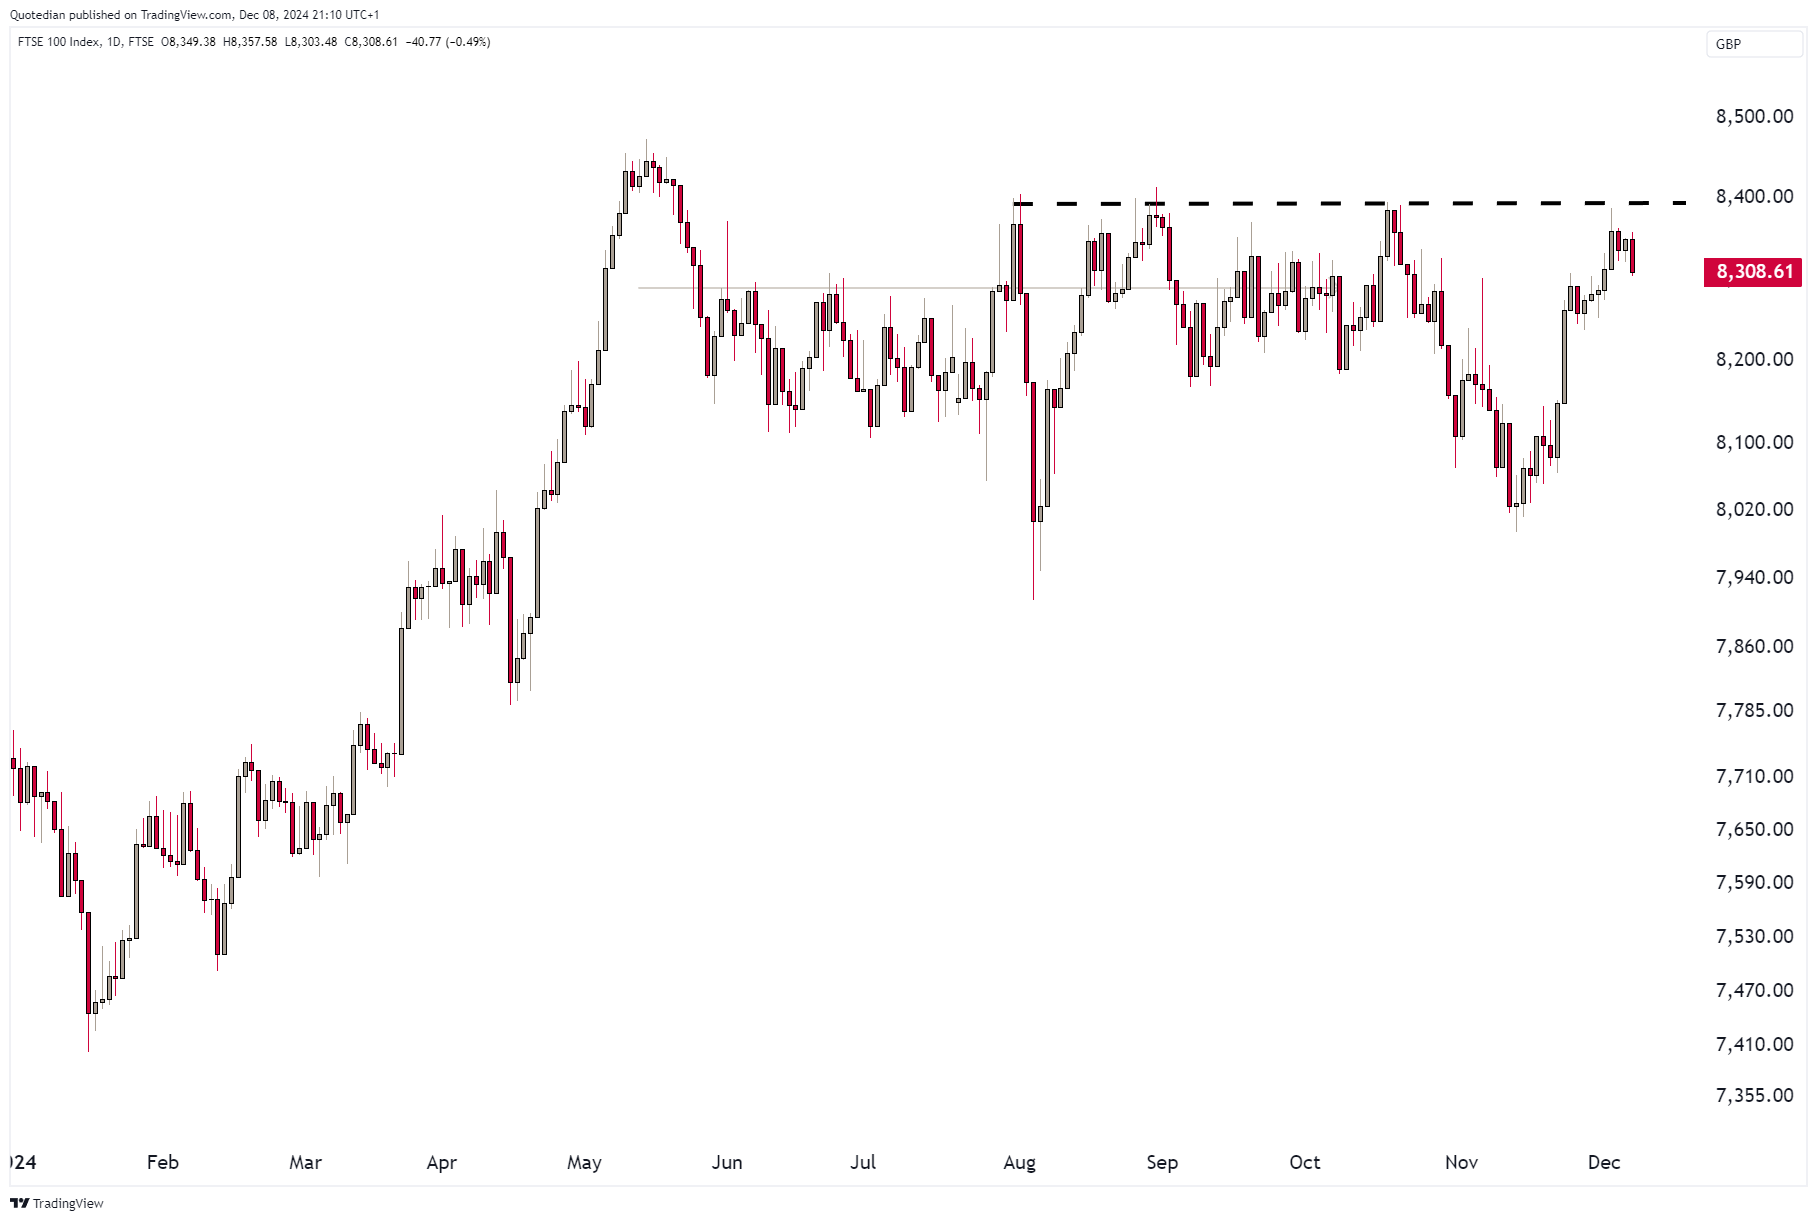
Which is similar to what was witnessed on UK’s FTSE-100, which was rejected at major resistance at 8,400 (dashed line) and remains range bound for now:
Taking the Orient Express over to Asia,

we note that our strategy to load up risk on Indian equities at the 200-day moving average after a 10% correction is starting to pay off:

And now … psssst … do NOT tell anyone

but China (CSI300) had a good week too and is starting to look pretty constructive on the chart:

Taking the iShares China Large Cap ETF (FXI) as a proxy, the downside risk (red dashed) is about 5%,

with… well … the sky being the limit really.

Sorry, wrong GIF!

That’s better.
Ok, onwards … Just one last quick glance at Japan:

Let’s close the equity section with a look at the best performing stocks this year and how they have fared over the past week.
To break a habit, let’s start with Europe:

And here their US cousins:

In short, buying the sometimes expensive winners continues to work. We tell you so at the beginning of every year since the Quotedian exists. #
How many of these do you hold?
(Note to self: Next year also introduce list of worst performers, just to make the point)

Over in the realm of rates, it has been a slightly eventless (famous last words) week, with markets “Waiting for Godot CBs”:


But, let’s take it in steps…
US 10-year yields continued to drop towards our immediate term target of 4%:
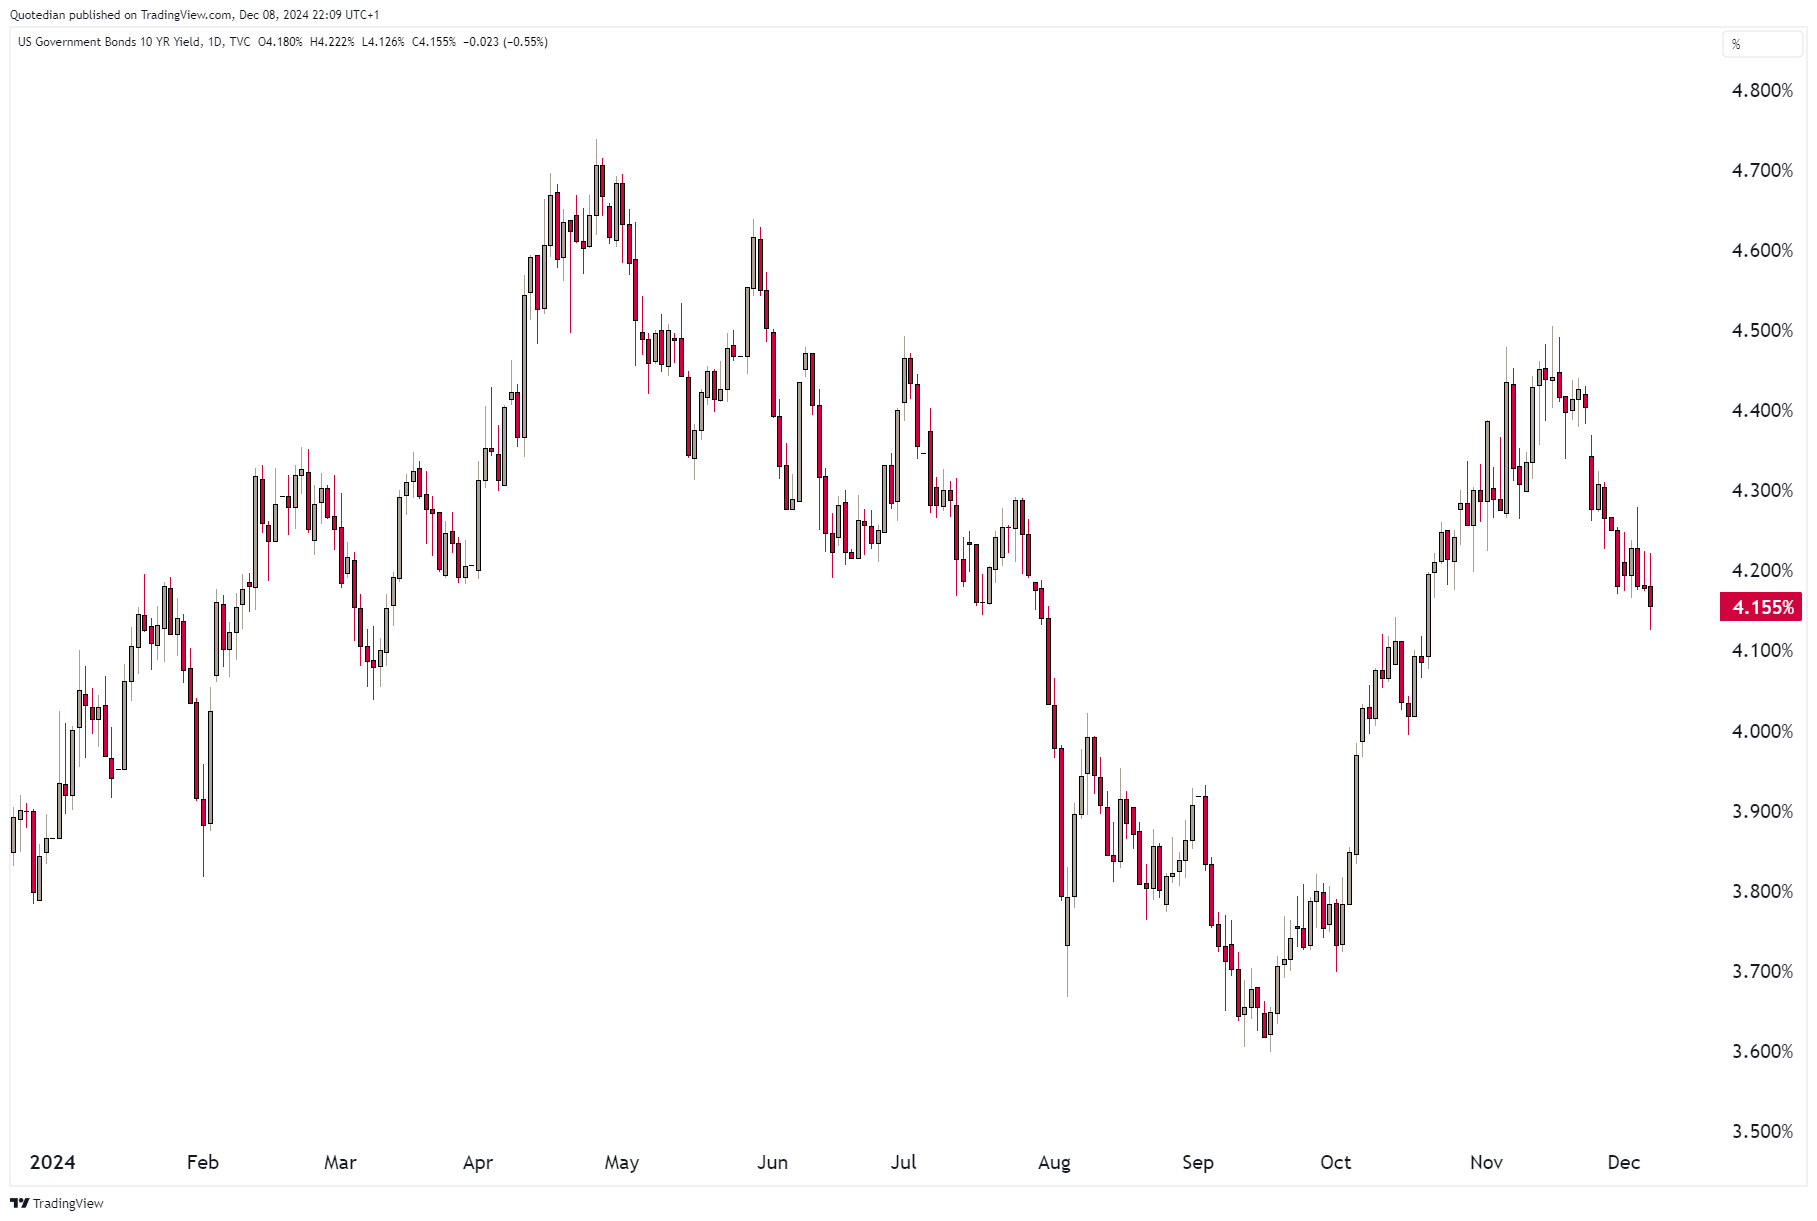
Strangely enough, the odds for a further rate cut next week increased from Thursday to Friday, despite the strong NFP number (1):

Maybe it was the rise in the unemployment number (2) that made odds jump:

But, thinking again, it probably was the weak upward revision (36k) of the October number that disappointed and hence lead to lower yields and the increase in expectations for a rate cut.
The German Bond yield, as proxy for European rates, strangely enough advance during the week, maybe taking heart from a strong equity market:

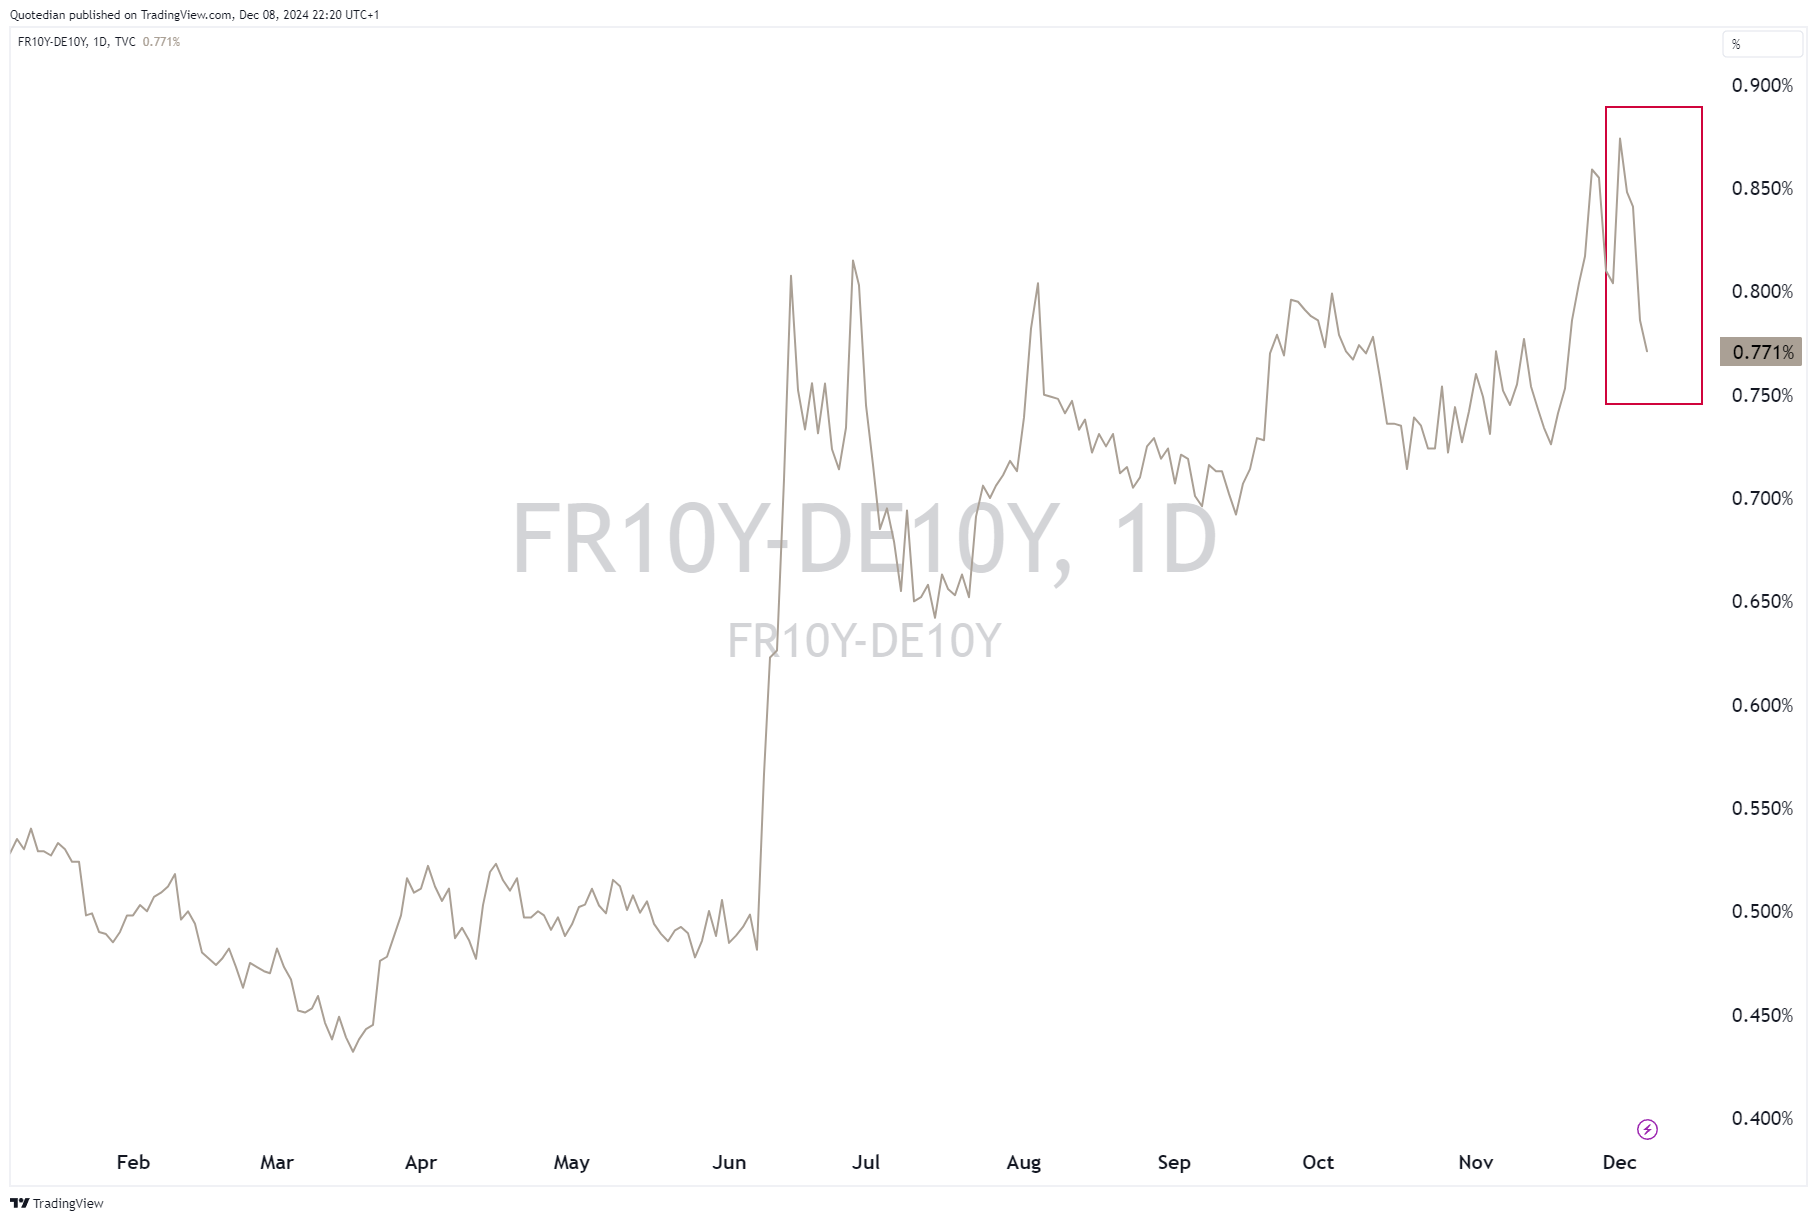
At a minimum, the French situation seems to be calming down:
Maybe it was the love shared at the re-opening ceremonies of “Our Lady” in Paris that did the trick? Click on the picture below:

Hilarious! But only a fake of course. Indeed there seemed to have been some harmony at the event.

Ok, let’s compose ourselves and get more serious again.
The ECB is meeting this Thursday and is expected to cut:

As a matter of fact, looking back at the lowest line in the table above, the ECB is expected to cut six times through October next year! That would bring their key policy rate back down to 1.5% … here’s the graph of rate cut expectations:

Given all the ‘priced in’ rate cuts, one might expect a yield curve that’s a tad steeper than the one we got:

The Helvetic Hedge Fund Swiss National Bank is also expected to cut rates this week and all the way down to zero rates again by next September:

The yield of the Swiss 10-year government bond (Conf) is at a depressing 0.22%:

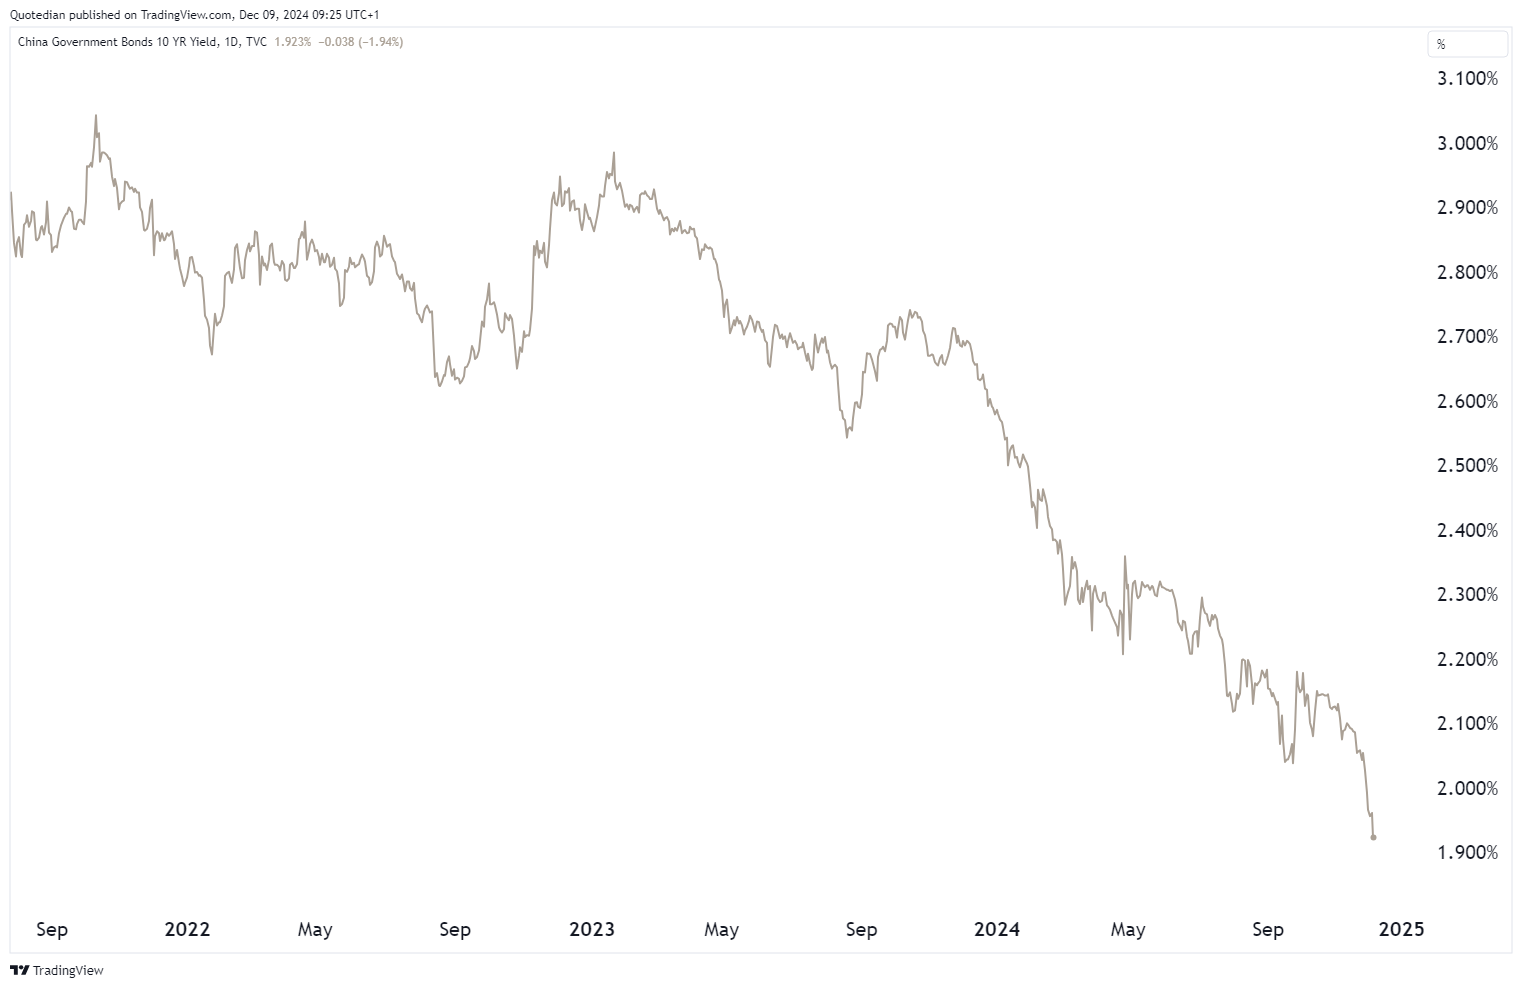
And speaking of deflationary fears (we were speaking of deflationary fears, weren’t we?), China’s 10-year government bond yield dropped below 2% for a first time ever last week, with the downside further accelerating this early Monday after reporting a CPI of 0.2%, half of what was expected:
Credit spreads are bloody tight but continue to narrow:


In FX markets, focus seems to be more cryptocurrencies than plain-vanilla fiat money, after Bitcoin exceed 100k for a first time last week:

As seen in other cycles, as Bitcoin reaches new highs, Altcoins become silly. For example Ripple (XRP), a relatively not-silly Altcoin, ripped nearly 500% higher since the November 5th US election:

Of course, also as usual, somebody paid that top at 2.90 too. Will he be taking his approximately 20% loss now or what for it to drop back below $1?
Or, maybe le idiot c’est moi, and the Exane Altcoin Cryptocurrency index is going to reach its previous highs:

But then again, the level of silliness going on is …hhhmmm… elevated.
Consider this chap here:

Good luck with that!
Or maybe the story of the Hawk Tuah Girl (don’t ask and don’t Google it), which cheated quite some people out of their (maybe) hard earned dosh via a altcoin ponzi scheme:

Dogecoin is a cryptocurrency that started as a joke in 2013 but quickly gained popularity due to its fun and lighthearted nature
But wait, it gets worse. Crypto entrepreneur Justin Sun paid $6.2 million for an conceptual work created by Italian artist Maurizio Cattelan. The “art” consist of a banana stuck to a wall with duct tape…
He then went on to eat the banana … (I am feeling sick now, but please go on and watch the video by clicking on the picture below if you feel like it):

Can it get even sillier? You bet!
Just think of that cryptocurrency called Dogecoin with the ticker DOGE. Invented in 2013 as a joke, it now has a market cap in excess of USD60 billion and a US department named after it:

Ok, back to the world of “real” currencies….
The US Dollar found a top two weeks ago, and as long as that top holds on the DXY I insist on my call for a lower greenback:

The EUR/USD is a bit less clear, as the turn higher has been truncated by EURO-specific weakness last week:

Moving above 1.06 would be a clear win for the EUR/USD bulls, but until then the danger of a break lower with a consolidation pattern also remains a valid outcome.
USD/JPY has settled in around the 150 level. IMHO it is just a question of time until we see more downside on this currency pair:


As we reach the commodity section we run as usual out of time and digital paper to make all the deliberations and comments this fine asset class deserves.
So with an apology to the raw material junkies on this list, let’s check the charts on the most important ones.
Starting with Gold, I stick to my view that for now, at a minimum until the Presidential inauguration on January 20th, the price of Gold has found a intermediate top @$2,790:

Copper may be in for a resolution out of a wide triangle:

Oil (here WTI) continues to sit right on top of key support:
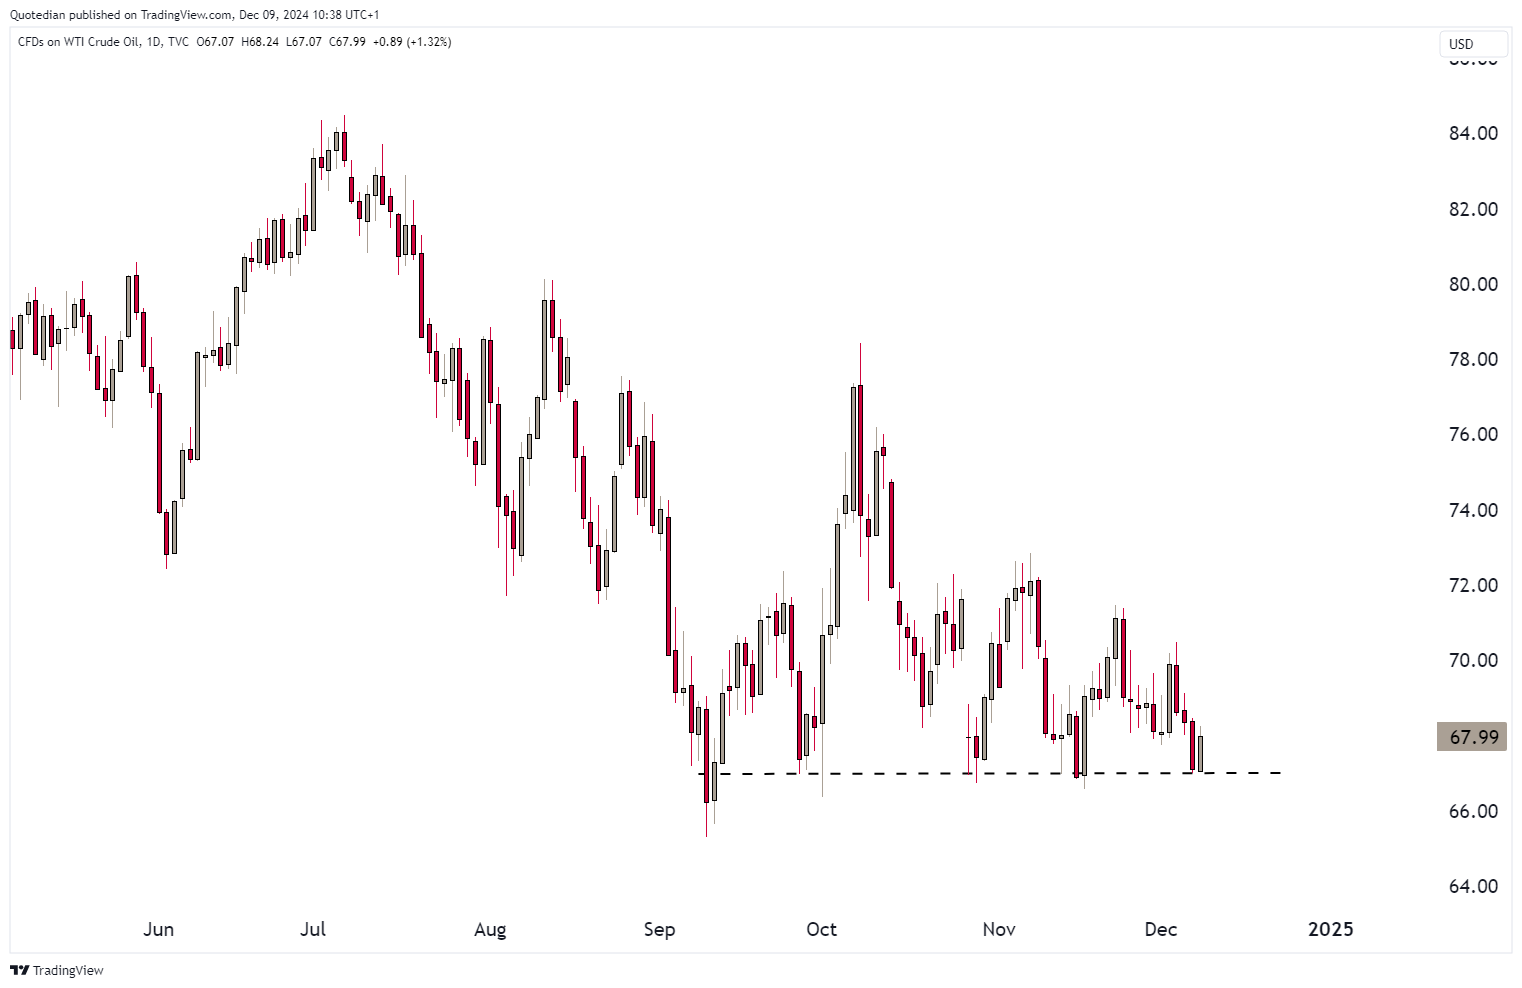
I now actually expect this support to eventually break and a new oil range to establish itself. Something as such for example:
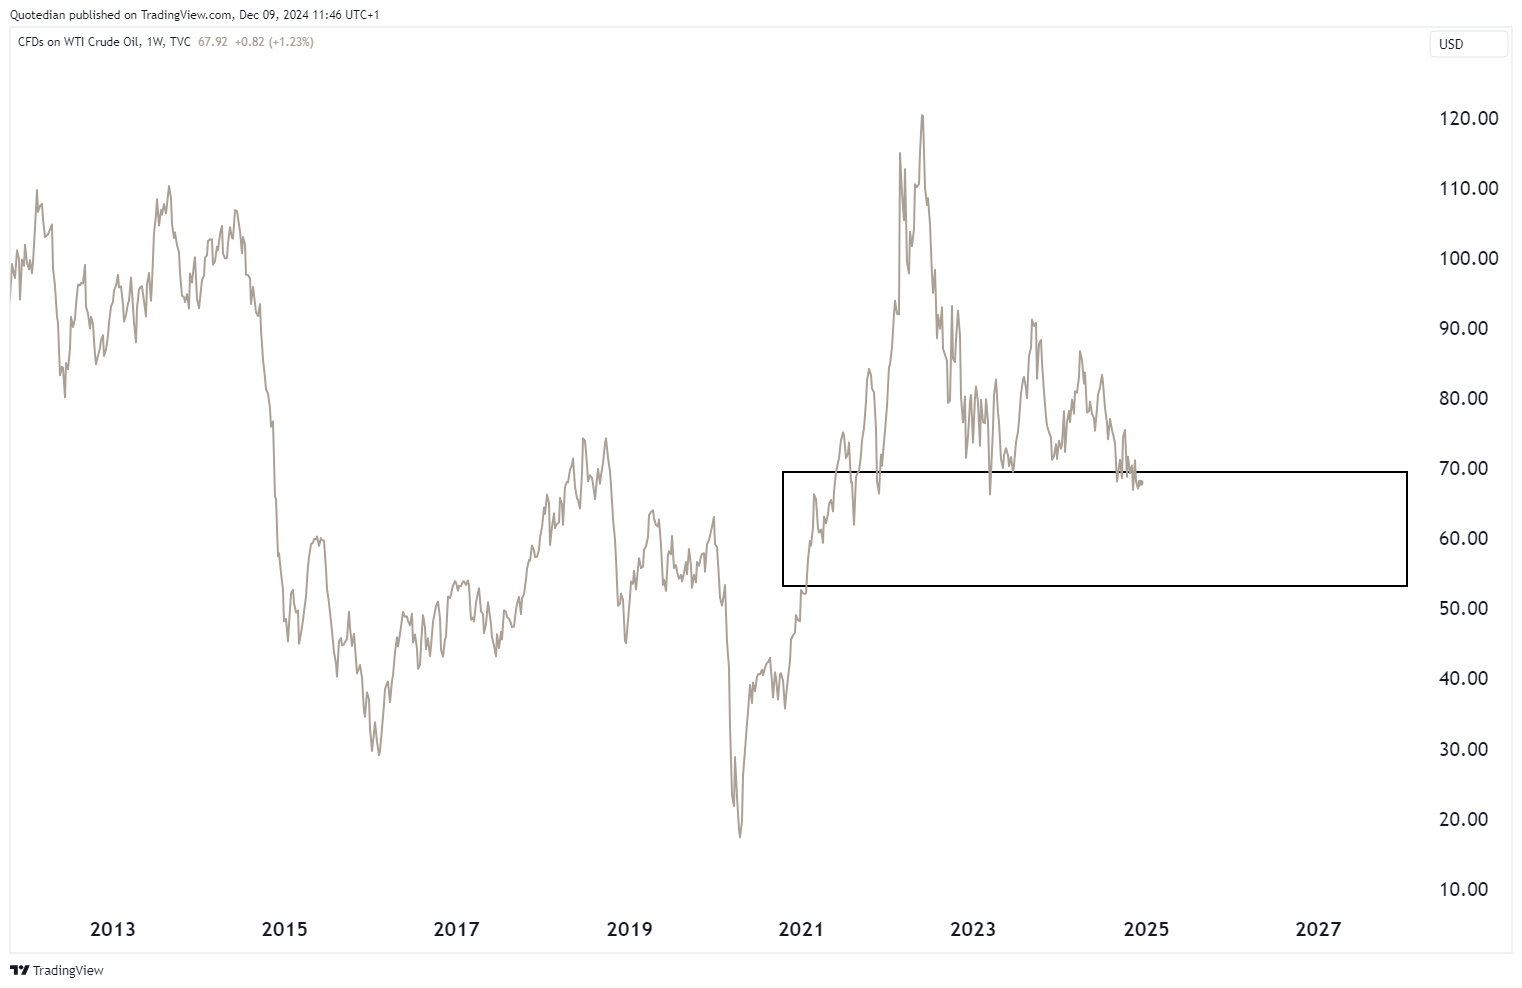
Why? Well, pretty easy. The incoming administration wants to curb spendind whilst mainting growth (inflationary) but want to keep inflation in checkers. Hence, Treasury-Secretary-to-be Scott Bessent has his Abe-inspired three arrows policy:
Achieving 3% Real Economic Growth:
Reducing the Budget Deficit to 3% of GDP by 2028
AND
Increasing U.S. Energy Production by 3 Million Barrels of Oil Equivalent per Day
Eh voila.
However, the one commodity I am really BULLISH on for 2025, is natural gas:
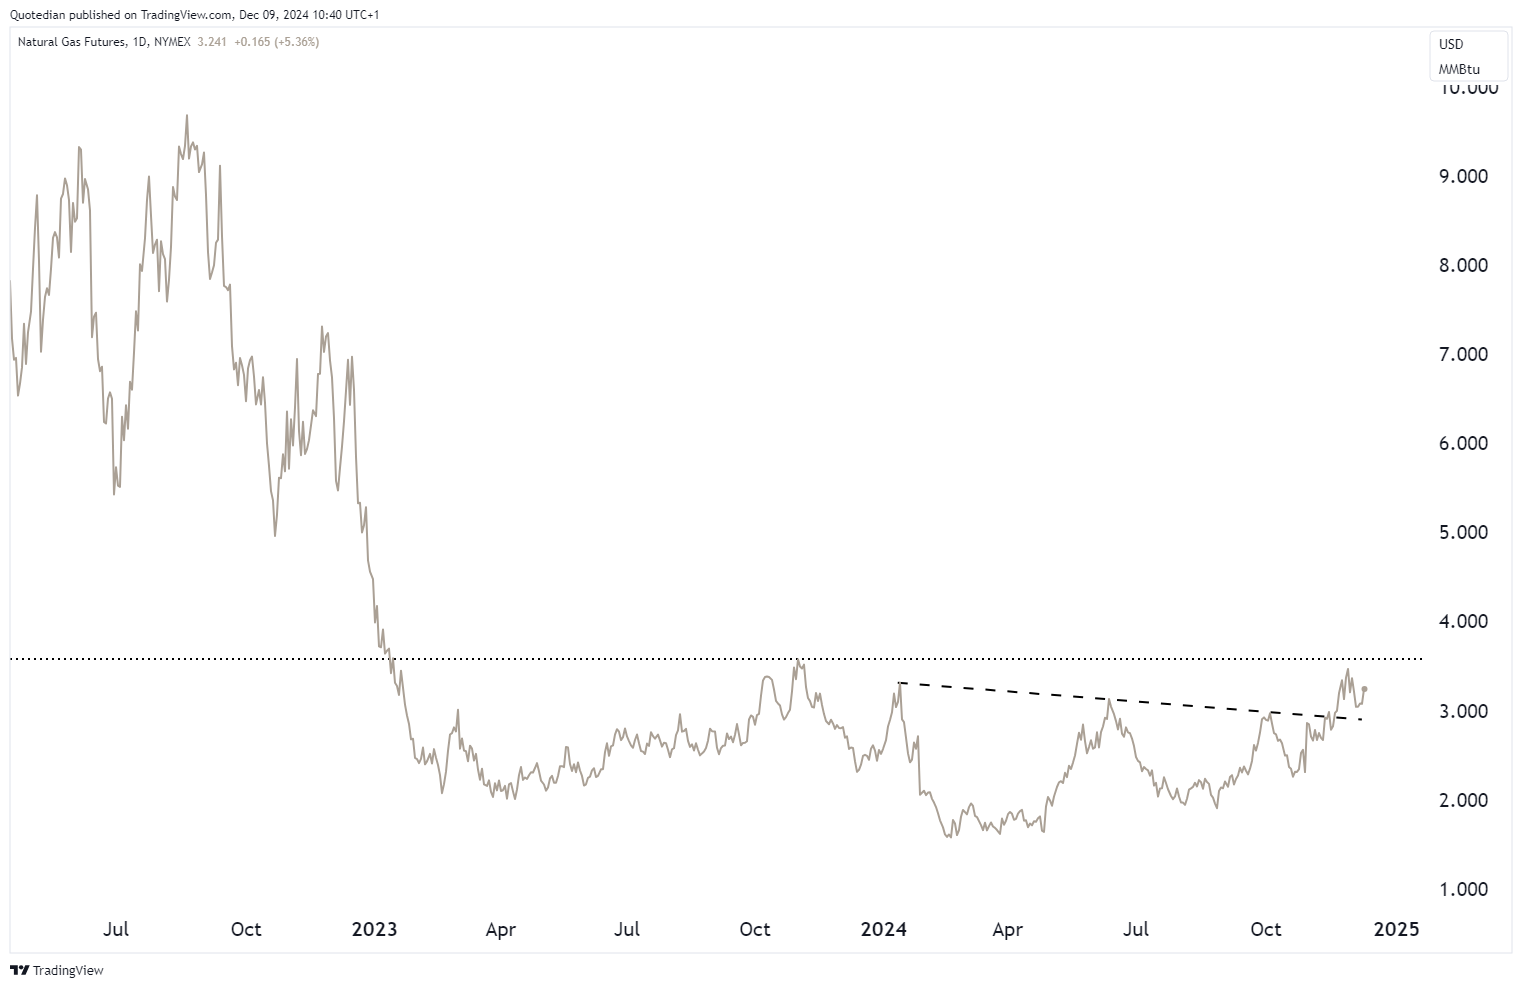
Accumulate exposure here (we will discuss how on another occasion) and get more aggressive with a price move above $3.60
That’s all for this week, but please make sure to sign up to our daily letter, published Tuesday through Friday!


Everything in this document is for educational purposes only (FEPO)
Nothing in this document should be considered investment advice
Investing real money can be costly; don’t do stupid shit
The views expressed in this document may differ from the views published by Neue Private Bank AG
Past performance is hopefully no indication of future performance