Marmite 2.0
Vol VII, Issue 41 | Powered by NPB Neue Privat Bank AG
“Emotion is one of the investor's greatest enemies.”
— Howard Marks
IMPORTANT NOTE:
I started this letter last Friday, with a big junk completed on Sunday afternoon/Monday morning and then a ton of “finishing touches”, including two entire sections (FX & Commodities) on Monday night. This morning, with my heart dropping into my shoes, I had to note that all those last changes, including several equity trade ideas, had not been saved. With the publishing deadline upon me, I have unfortunately no chance to recreate all that work done.
In other words, Dog ate my homework, and no, immigrant did not eat my dog. He is alive and well:
What a week! What a reset!
With Trump and his Republican Friends’ LANDSLIDE win, we investors are forced to go back to the drawing board, leaving our emotional bias firmly locked up in a cupboard in the darkest corner of our cellar.
OR
We can take the short-cut and see which assets have reacted to Tuesday’s US election in what way and then reverse our conclusions from there, because after all, we all agree that
NARRATIVE FOLLOWS PRICE
don’t we? But, our emotional bias firmly locked up in a cupboard in the darkest corner of our cellar.
This week is an opportunity to listen to the market and participate (or fade) what it is pricing in. The last thing investors should do is to go against the most powerful force in investing — momentum —just because their preferred candidate lost or their least favourite won …
The Quotedian is a market observing newsletter and truly political agnostic. Hence, there is no political endorsement or rejection, just a few notes on investment opportunities at hand. As for the newly re-electe US commander-in-chief, it is all about Marmite: “You either love it or hate it!”
Hence, let’s embark on this exciting journey which will allow us to spot new and old trends, which of course are all our friends.
Starting with equities, no better place to reflect the DJT has at hand with his Red Sweep mandate than the S&P 500:
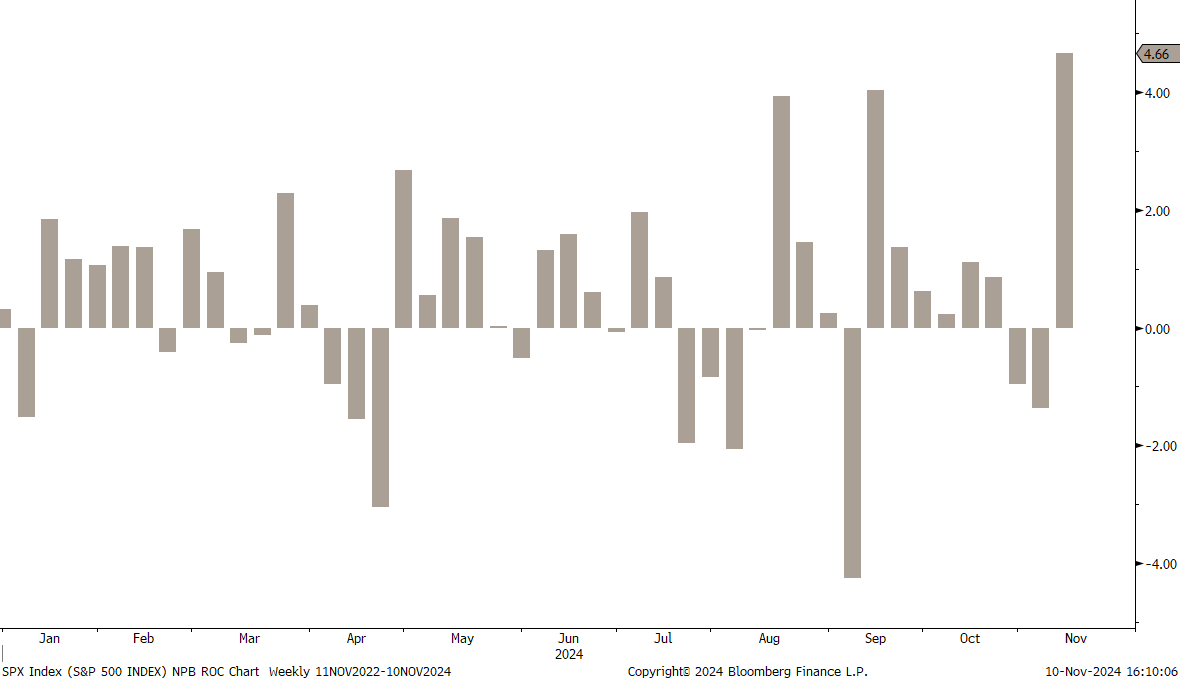
The above chart shows weekly returns of the S&P 500, with the last week being the best so far. US equities have voted.
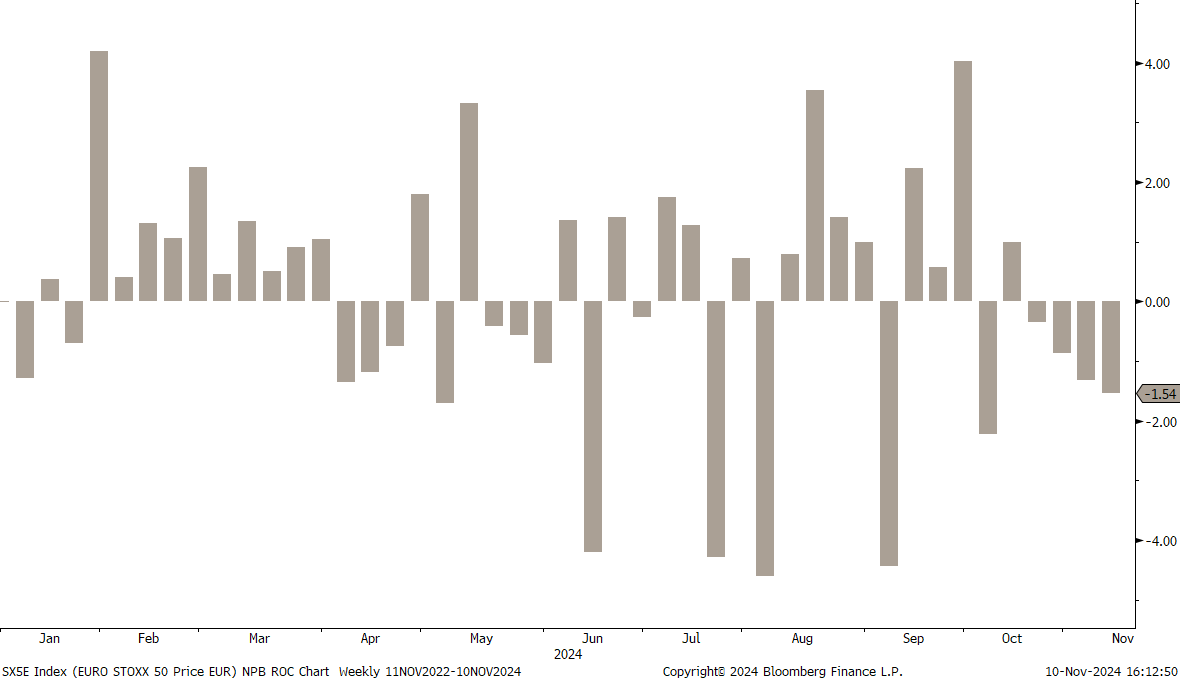
And here is Europe’s answer to the US rally:
My very personal (and optimist’s) interpretation here is that the European Union is getting a final wake-up call to get their f-ing act together, or else, to be left behind for dead…
Let’s check some regional performances over the past five days …
China, of course:
Even I could not come up with a more sarcastic outcome than China being the big winner the same time that Trump is the big winner …
The other observation that stands out from the table above, is that Southern Europe was the big loser last week. To be completely honest, I have not yet quite found an adequate explanation therefore, BUT, price leads narrative, so let’s stay tuned …
One long-shot suspicion I would have is that several Southern European companies are involved in the renewable energy space and so are their associated local banks. As a possible “the prove is in the pudding”, here’s the performance of the Global X Renewable Energy Producers ETF, with last week’s post-election drop highlighted:
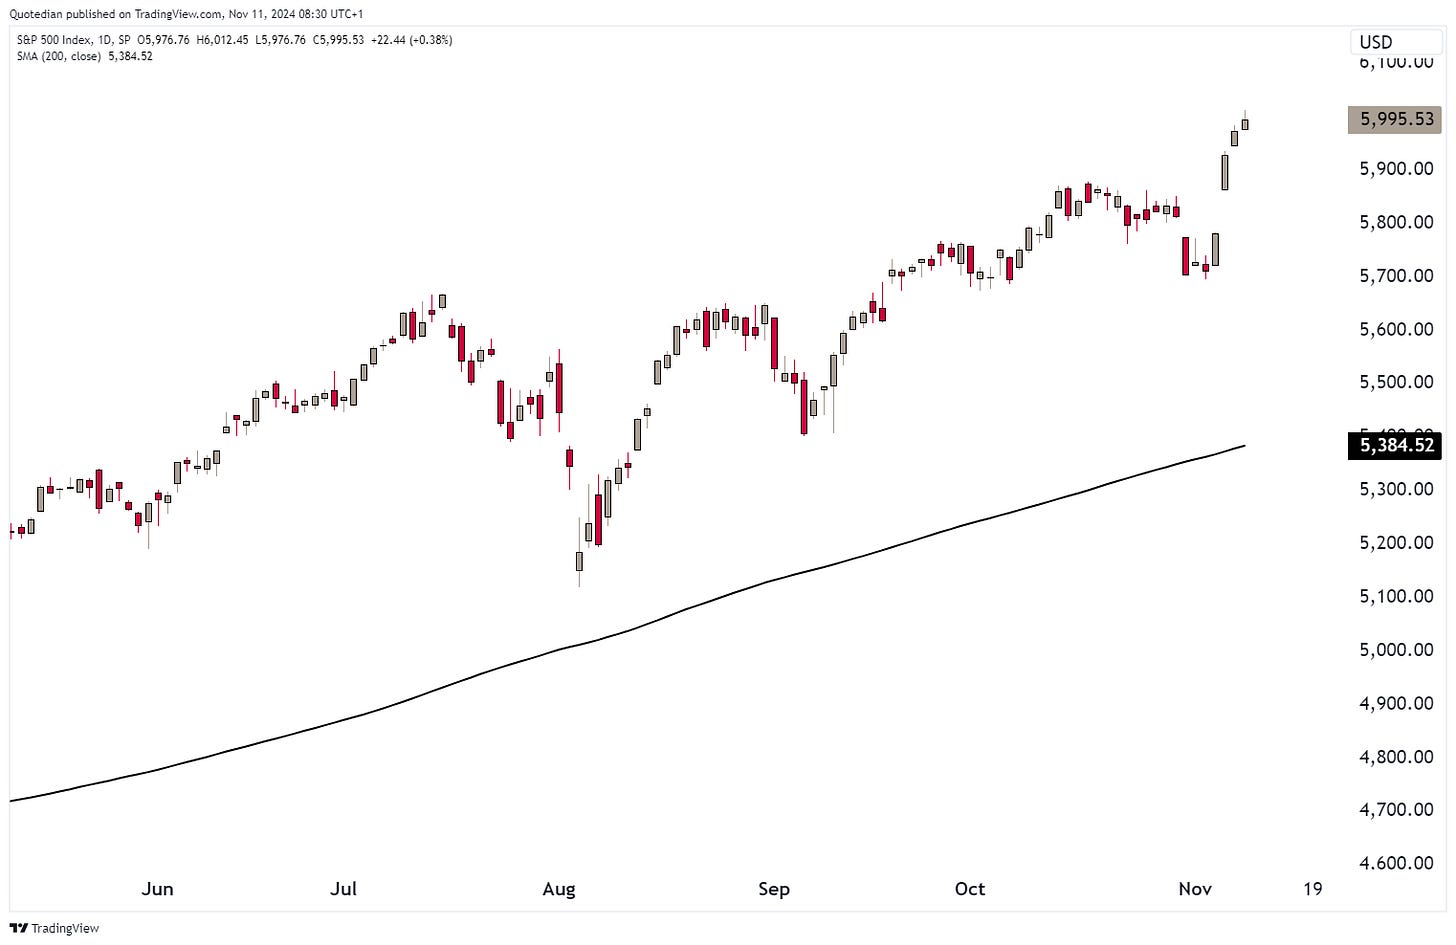
Ok, let’s check some major benchmark charts, before moving more granular again. Starting with the S&P 500, we note that this index has been three stairsteps upward last week:
We get a very similar picture for the Nasdaq, with the extra “add-on” that this index hit a new (all-time) high for the first time since early July:
Checking in on Factor-performance for last week, we note however, that small cap was the place to be in the US:
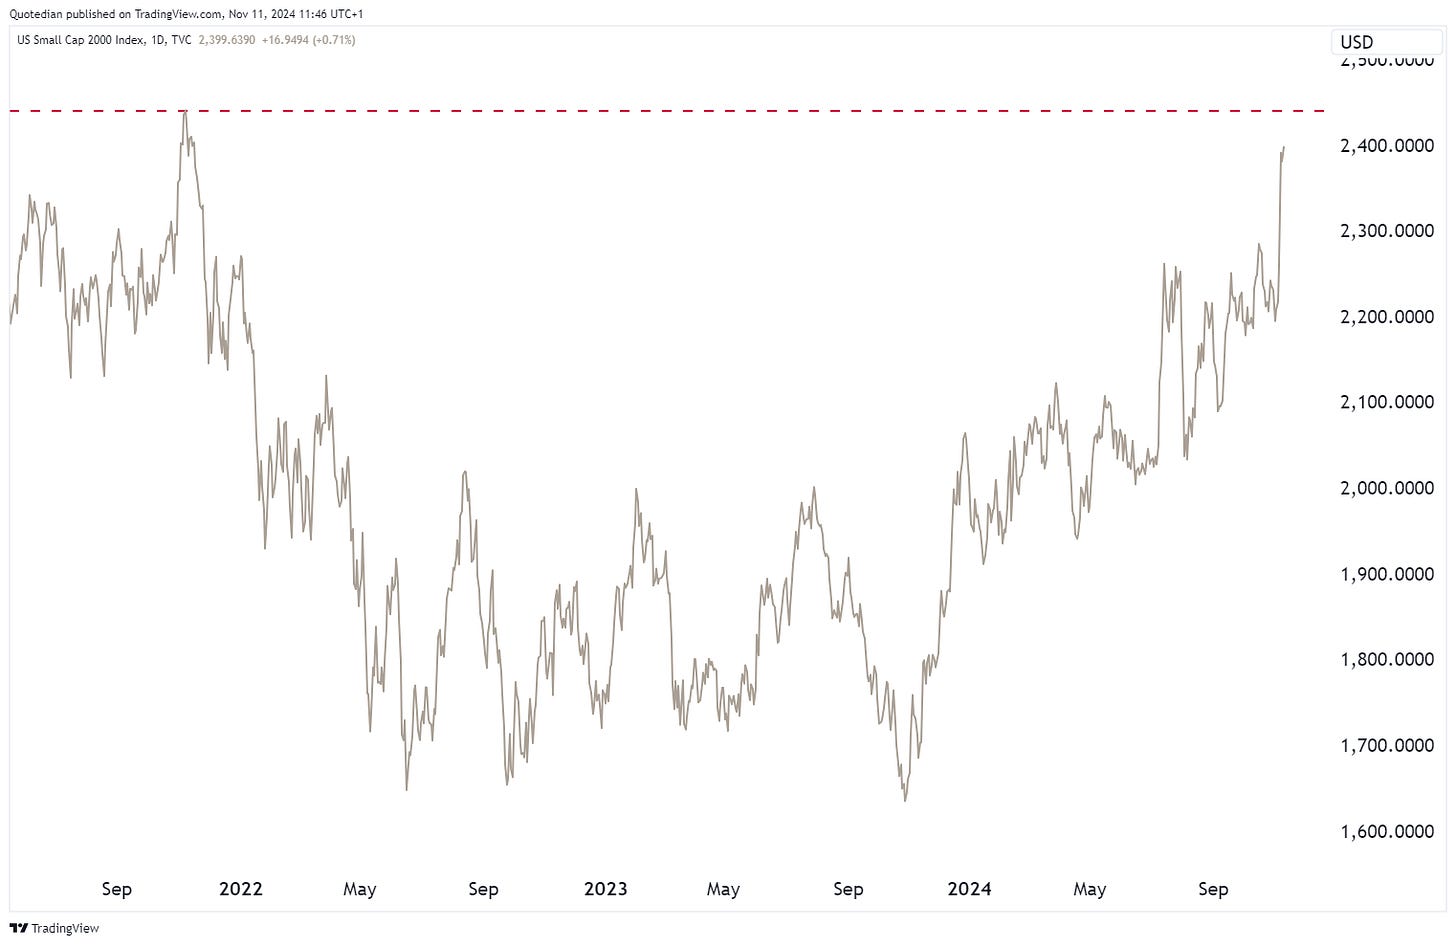
Here’s then the chart of Russell 2000 (small cap) index, which finally got its lift boost above key resistance (blue shaded):
However, we are still a couple of percentage points away from reaching a new all-time high, which was set waaaayyy back in November of 2021:
Though small-cap enthusiast will NOT be hoping for a 2016 repeat:
Now, hopping over to Europe, we do not see a repeat of the bullish picture shown on the US indices above. Rather, the Euro STOXX 50 index for example still trades below its 200-day moving average and the series of candles since election day (E+1) have been leaning to the bearish side (key reversal, followed by bearish engulfing):
The broader STOXX 600 Europe index, which includes Swiss, Swedish and UK stocks, looks slightly more constructive, as it is trading above the 200-day MA and today Monday (11.11.) is producing a constructive up-candle about three hours from the closing bell away:
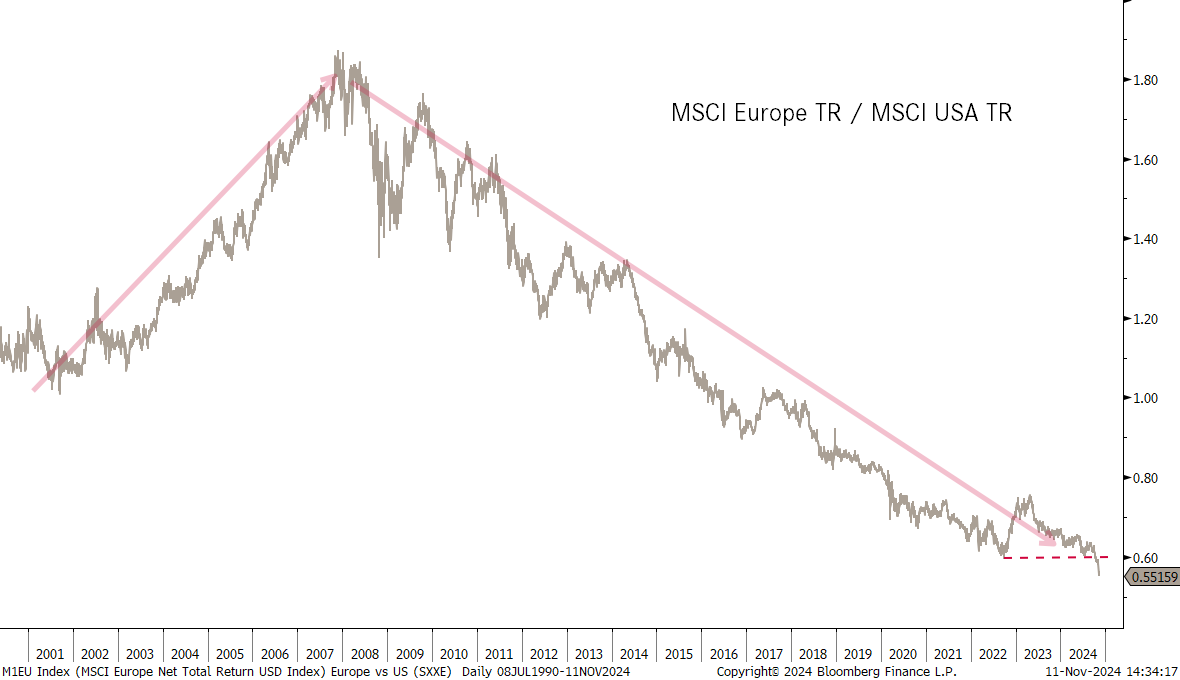
But bottom line, it feels like the overweight US/underweight Europe trade just got an additional extension for a few years:
Switzerland’s SMI had a similar, timid reaction to the US election as did other European markets. Best ‘thing’ to observe that key support (dashed line) held last week, avoiding the triggering of a shoulder-head-shoulder top … for now …
Let’s have a quick glance at some Asian markets now, starting with the best performer of last week, the CSI 300 (China Securities Index 300):
Chinese A-shares did very well during election week (box), at least until (pointing hand) the government “intervened” with another, apparently not sufficient stimulus package:
Japan’s stock market (Nikkei 225 below) seems somewhat absorbed by its own internal dealings and largely lacked a notable reaction to the US election:
India’s Nifty index seems similarly uninterested in US happenings and is continuing to correct within its larger uptrend:
Whilst accumulation of some Indian stocks around the 200-day moving average (black line) makes a lot of sense for un- or underinvested investors, I would not expect a “touch and go” move higher again immediately.
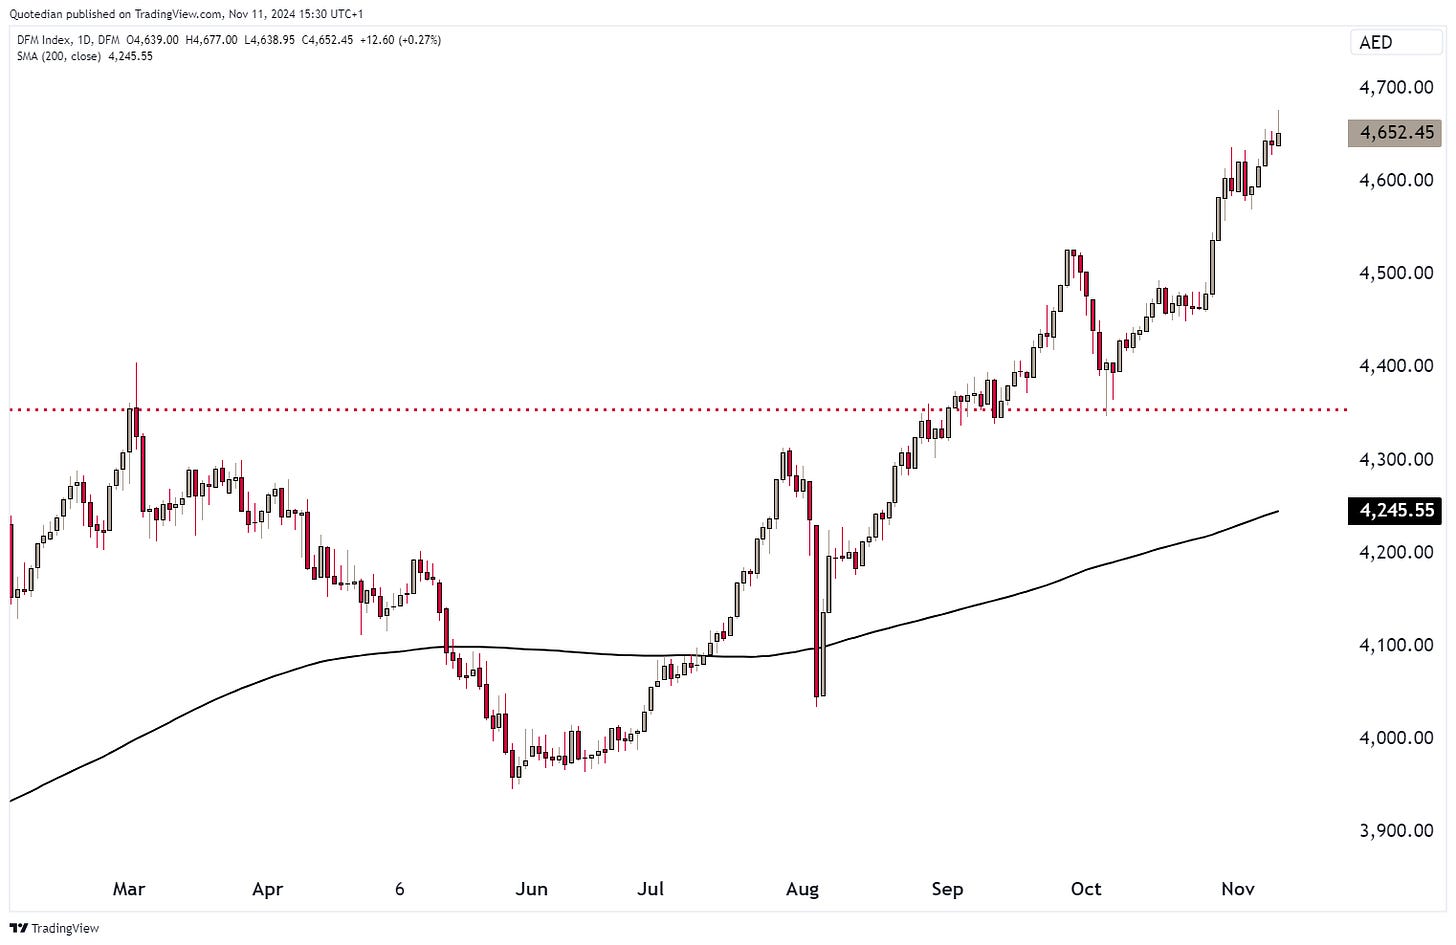
Last but not least, the Dubai Financial Market Index, as a proxy for the GCC region, is clicking higher at a healthy pace:
The index is still about 15% away from the all-time highs set in 2014,, but could reach those levels in the coming twelve months or so:
Ok, time to go a bit more granular now, by check sector performances since E-day (election day) on both sides of the Atlantic. Starting with the US, we note that consumer discretionary stocks were the absolute winner last week:
This excellent performance by the CD sector stands a bit in the way of the argument that (Trump) tarrifs are mainly a taxation of the US consumer. But may suspicion would be that the nearly eight percent move higher last week is probably largely “financed” by the explosion in Tesla (TSLA) shares:
TSLA’s market cap increased by over USD300 million to hit $1.1 Trillion this early Monday:
To be sure, only eight companies have a market cap in excess of one trillion, and maybe even more impressive, only 26 companies within the S&P 500 have a market cap in excess of USD300 billion (TSLA market cap increase last week).
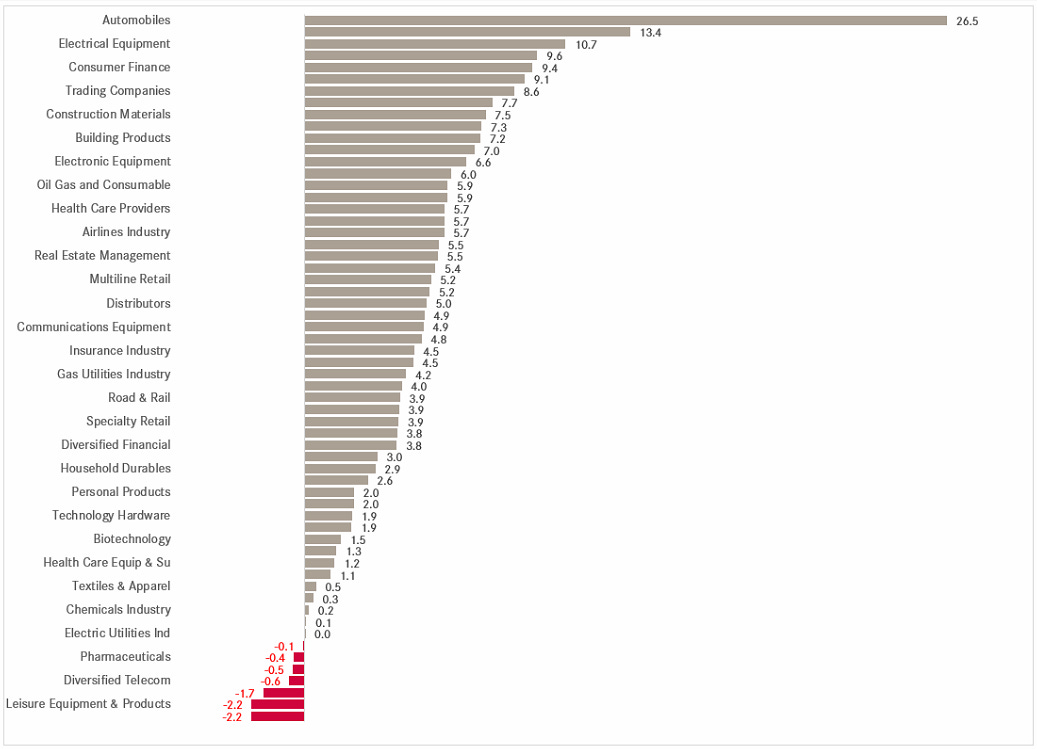
Let’s go two notches more granular and have a look at industry performances:
Somehow the graph does not want to show the last item, but it is Tobacco in case you wondered. The top performer is Automobiles Tesla of course.
Now, let’s check in on sector performance over here in Europe last week:
Uh, oh! Quite a different picture here. Especially utilities and banks got hit hard. Utilities had likely a negative double-whammy: On one side all our wonderful alternative energy companies here in good ol’ Europe got hammered on the Trump win and simultaneously did higher yields, also on the Trump win, probably not help their performances.
Regarding the weak performance of financials, I would suspect that it was rather the banks than the insurance companies that underperformed as expression of the “weak European economy” trade. Let’s check by going a not more granular and having a look at group performances:
Indeed.
The other sore thumb sticking out is the Automobile performance at the very bottom of the performance table, standing in stark contrast to what we just observed on the US performance table.
Going back to the Utilities respectively alternative energy theme, here we can clearly hear some dreams popping. The following chart shows the performance of traditional (fossil fuel) energy providers (red) to the cleaner, alternative sources (grey) over the past ten years:
The crocodile’s jaw seems to be opening again, but this time the other way …
Let’s have a random walk down chart street to see a few other notable movers, mostly red sweep related.
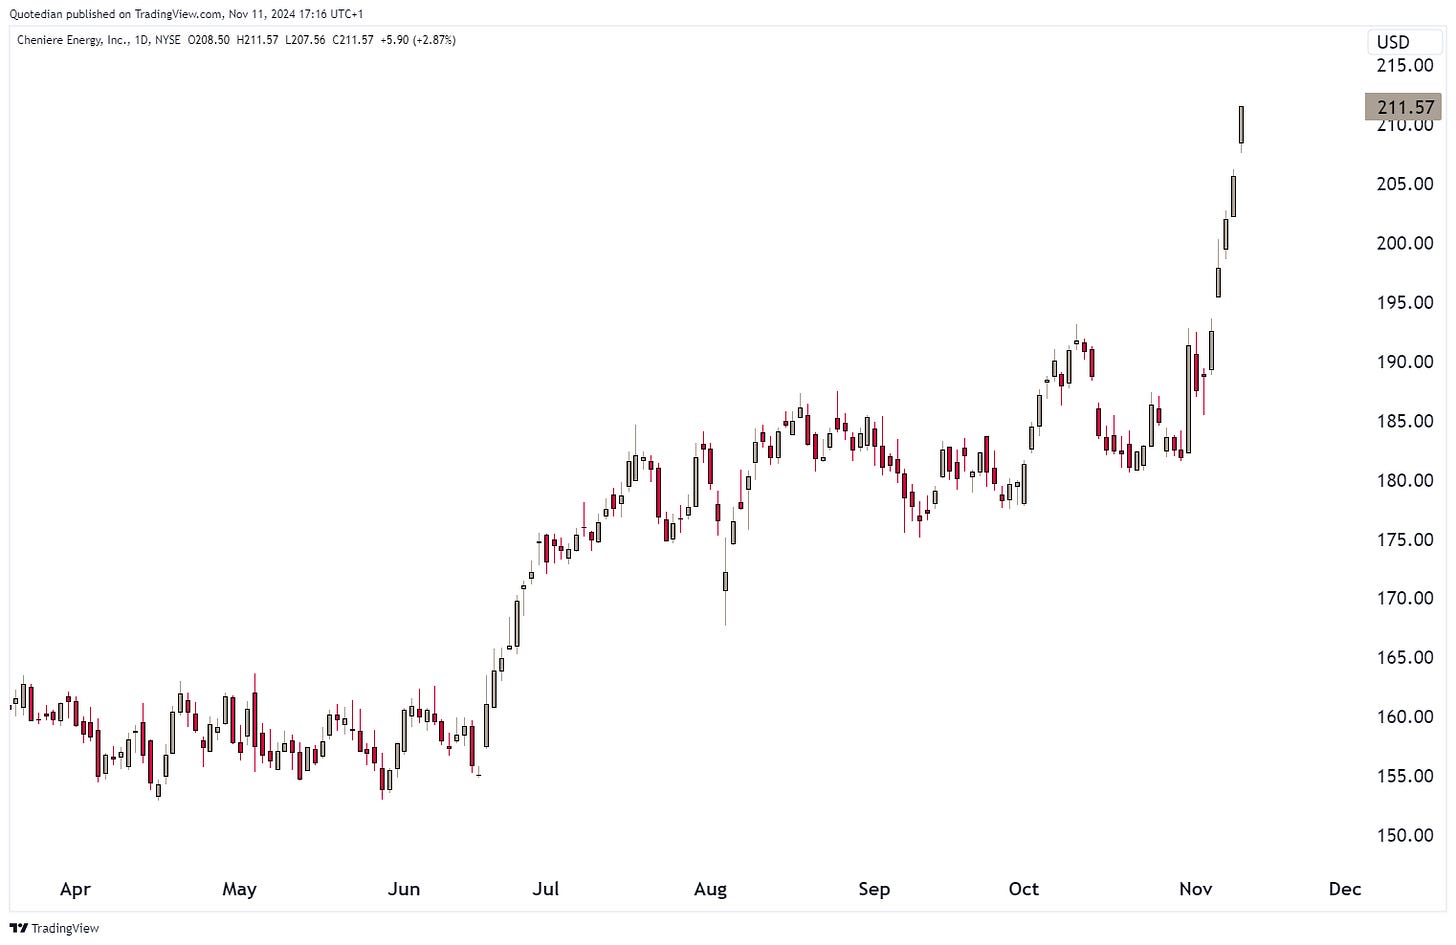
For example, and staying on the topic of energy, Cheniere Energy, a company engaged in the LNG (liquified natural gas) field, is up twelve percent since E-day:
Staying with fossil fuels yet a moment longer, it was of course one Trump’s landmark moments, when uttered:
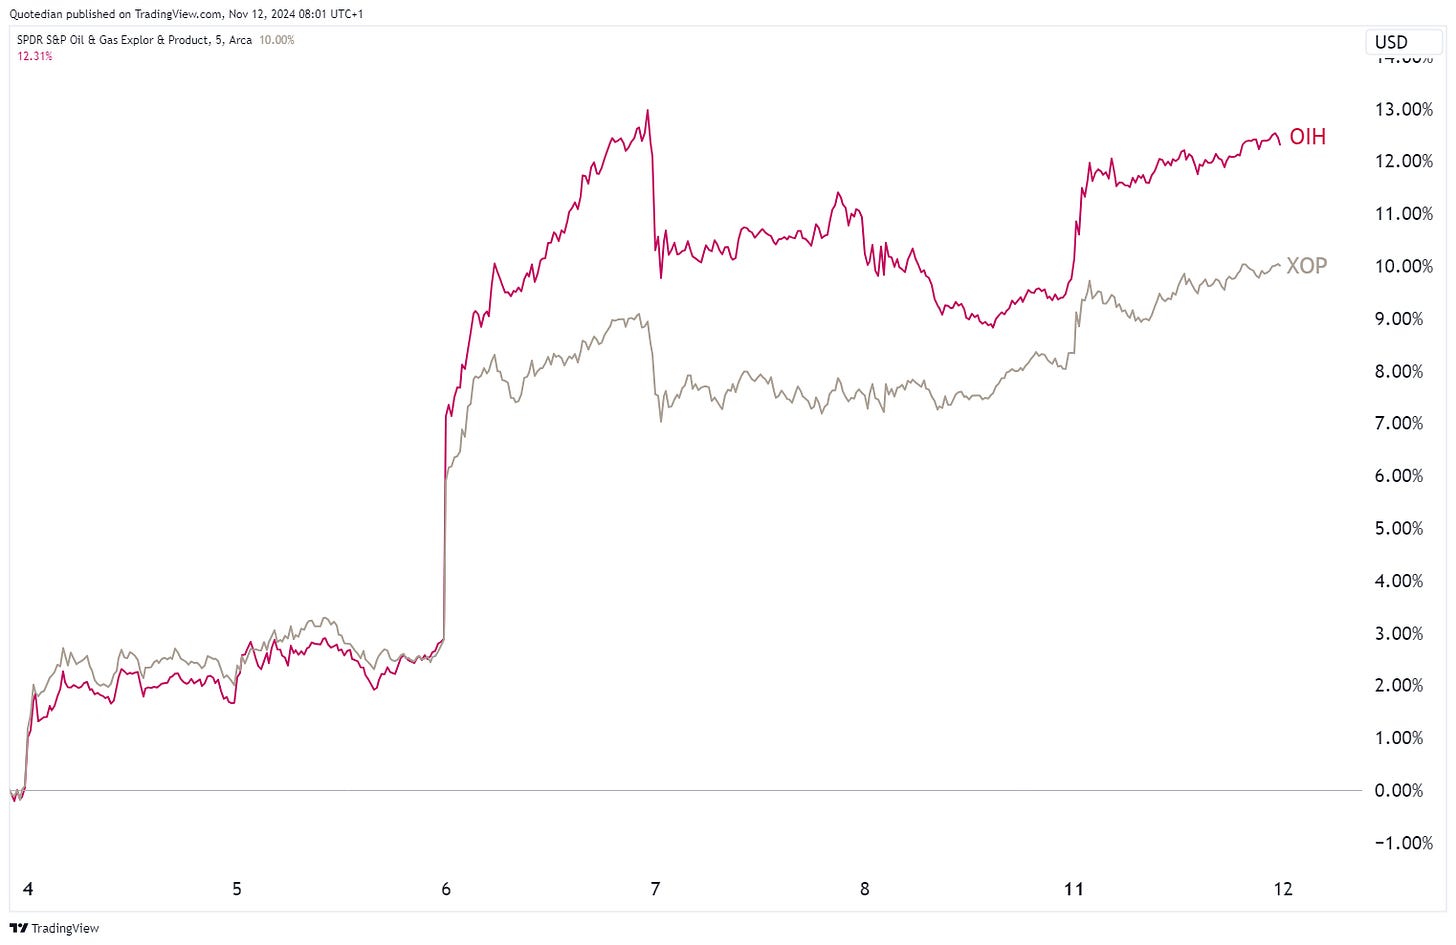
By intuition, that should be good news for Oil Service companies (OIH) and to a lesser extend maybe the explorers and producers (XOP). Let’s check:
Well, indeed, albeit it has been a decent rally for both. Nevertheless, we would concentrate on the Service companies for the next few months.
Looking for another Trump Trade? Break-in to the prison space! The following chart of the two leading “detention management” companies , CoreCivic (grey) and The GEO Group (red), would suggest that difficult time for criminals lay ahead:
I had several additional ideas and observations lined up here in the equity space, but as outlined at the beginning of the letter, does fell victim to what seems to have been a server error on the usually implacable Substack platform. But let me try to make memory and recreate some of the over the coming days and bring them to you via our daily (Tue-Fri) newsletter. Hence, make sure to be signed up to that one too:
I will just leave you then with the performance tables of the best performing stocks year-to-date in the US and Europe and how they have done over this past five exciting days, to close out this section:
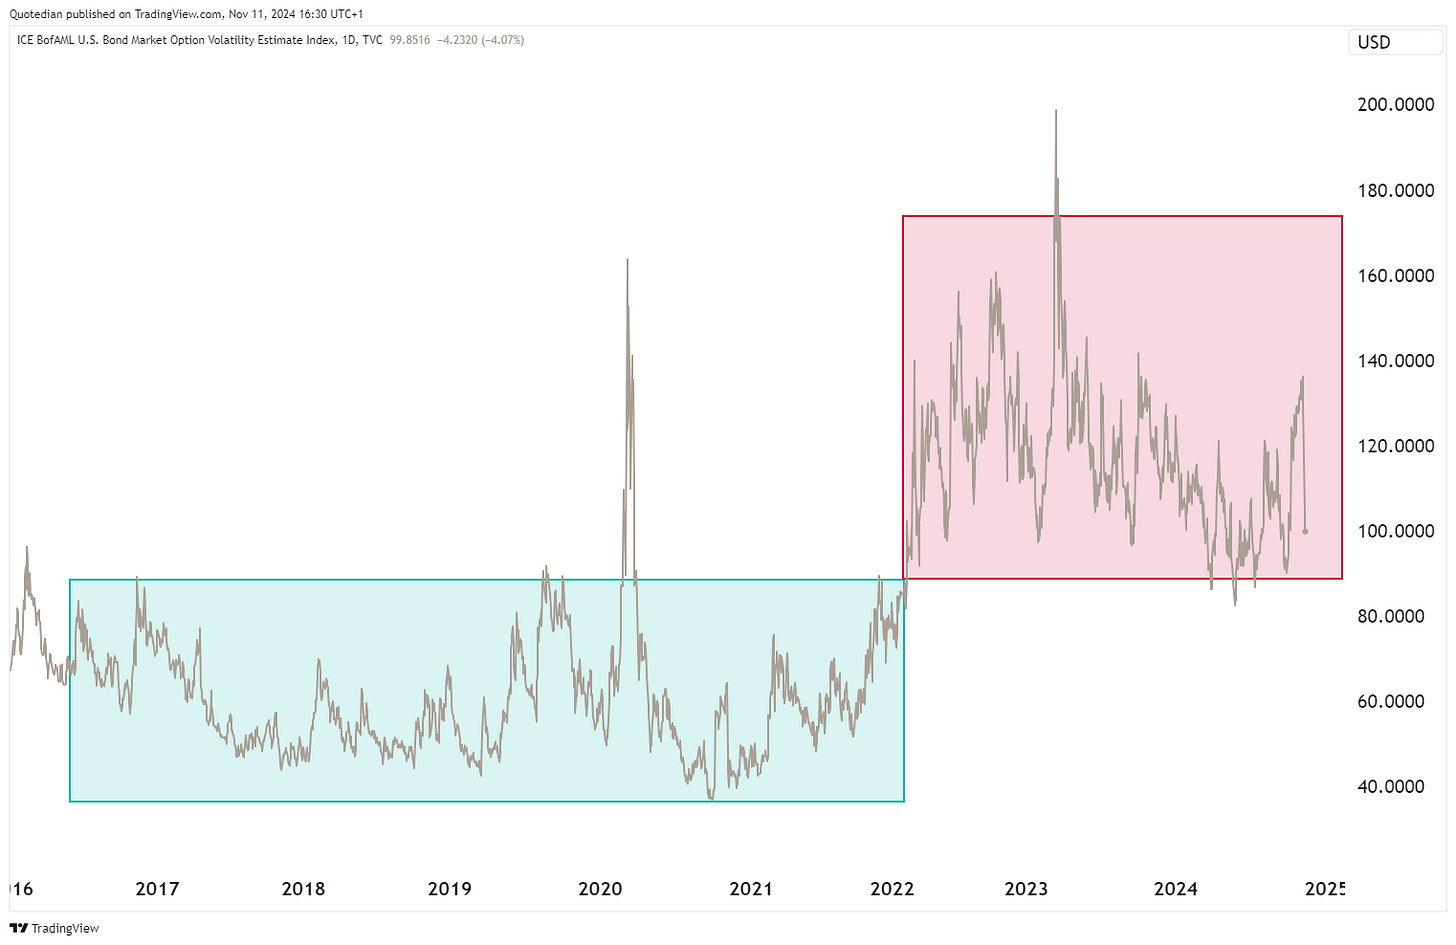
Bond investors had no reason to be jealous over the past few weeks and especially last week of their equity counterparts, as they got quite some outsized MOVEs themselves. Here is for example the bond market’s equivalent to the VIX, the MOVE:
whilst the index “collapsed” post-election last week, which is due to nature how the index is calculated (read more here), it continues to MOVE in historical elevated levels.
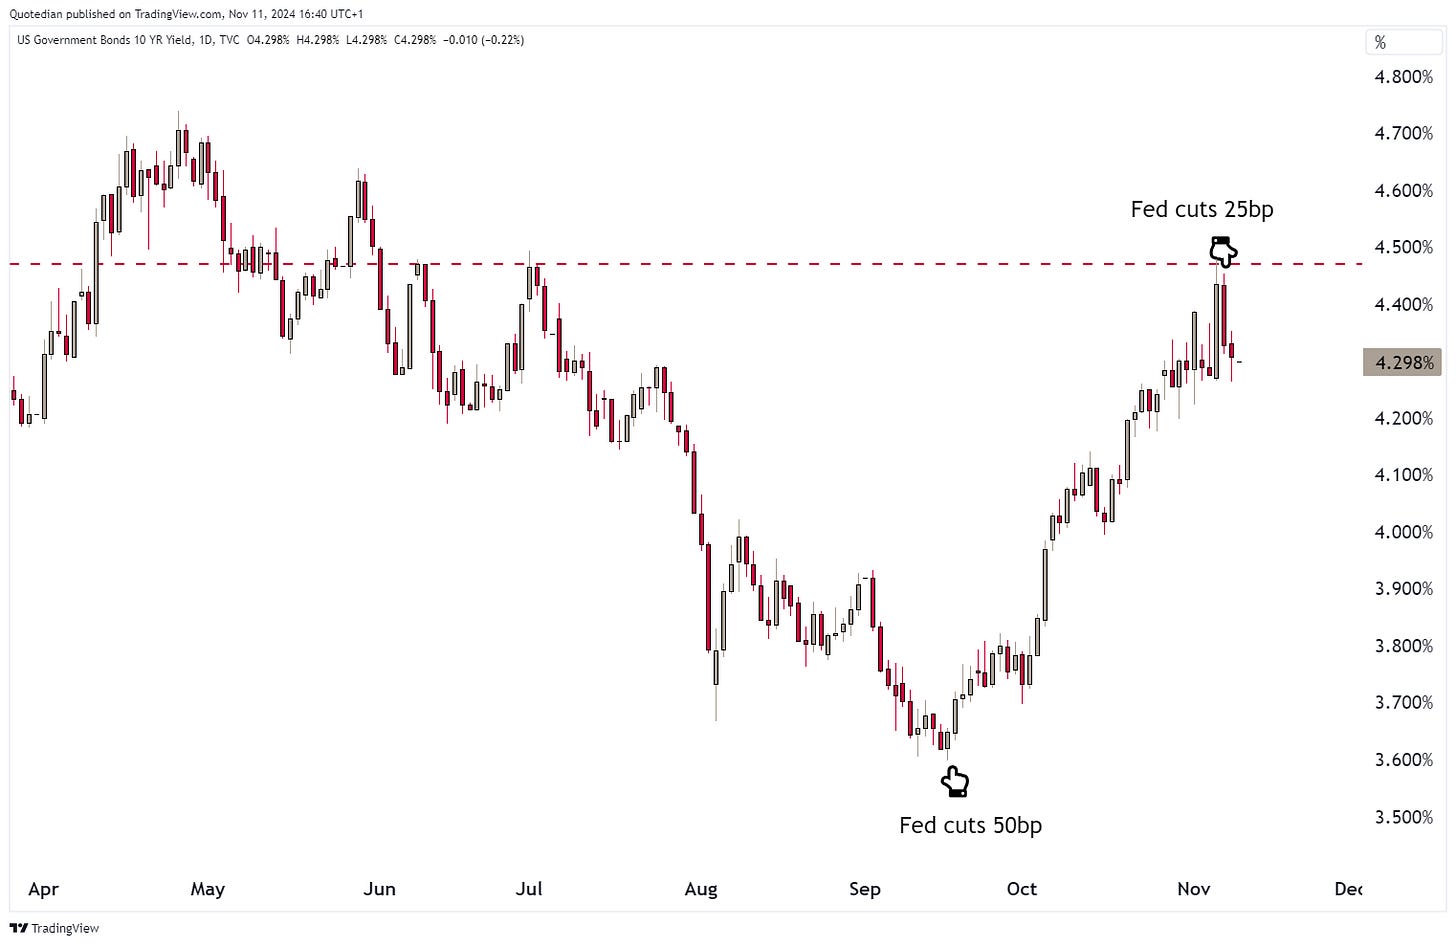
No wonder though, given the massive moves we have seen in recent history on the yield side, especially since the first FOMC cut of this cycle back in mid-September:
Talking of Fed rate cuts, what a difference 25 basis points and/or one and a half month make. Here’s the US 10-year treasury yield:
The Fed, which had already announced their intentions via their favourite “Fed Whisper”, Nick Timiraos the chief economics correspondent for The Wall Street Journal, over the weekend BEFORE the elections, seems to be on set schedule, as economic data did not seem to absolutely require another interest rate cut so soon, and less so with the stock market on the loose.
To note, breakeven rates have not reacted as much as the nominal yields post FOMC cut last week:
In that context, the next CPI number coming up already this Wednesday (0.2% MoM and 2.6% YoY expected) could potentially be a party pooper for the stock market if the reading should come in higher than expected.
Finger crossed that the BLS will cheat calculate for this not to happen ….
The number of expected rate cuts has come down sharply since early September, from 10 to 3 with only 3 done:
In Euroland, we have seen quote the contrary move post US election:
Another tell sign …
German 10-year Bund yields are down nearly 15 basis points over the past two sessions:
In the UK, 10-year Gilt yields are finally seeing some relief after their post-budget “tightening”:
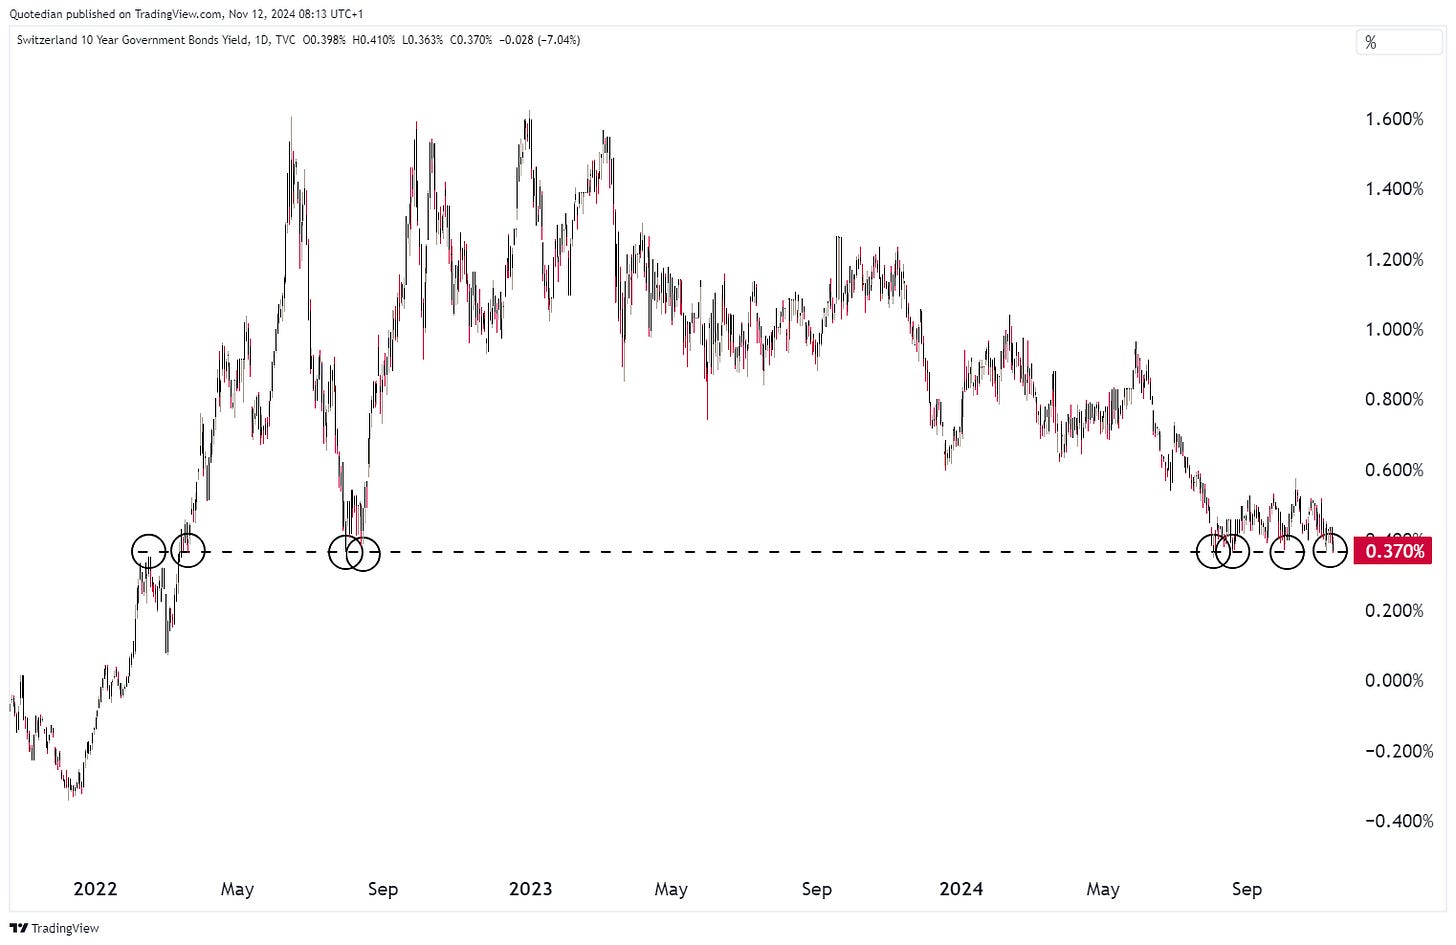
And Swiss yields are about to break support and to back into full “deflationary” mode:
Finally, credit spreads have narrowed again on the back of rallying equity markets:
In currency markets, the US Dollar has been up against (nearly) everything pre- and post-election. Here’s the performance table since election day:
Of the very few currencies that were actually able to eke out a gain over the past few sessions versus the Greenback, of course the Russian Ruble had to be in that list:
The Dollar Index itself has been on a tear and is approaching a key resistance zone fast:
On the EUR/USD chart, the Dollar strength translates as follows:
Currently the lower end of the nearly two year sideways consolidation channel is being challenged. 1.04ish seems the key level to watch.
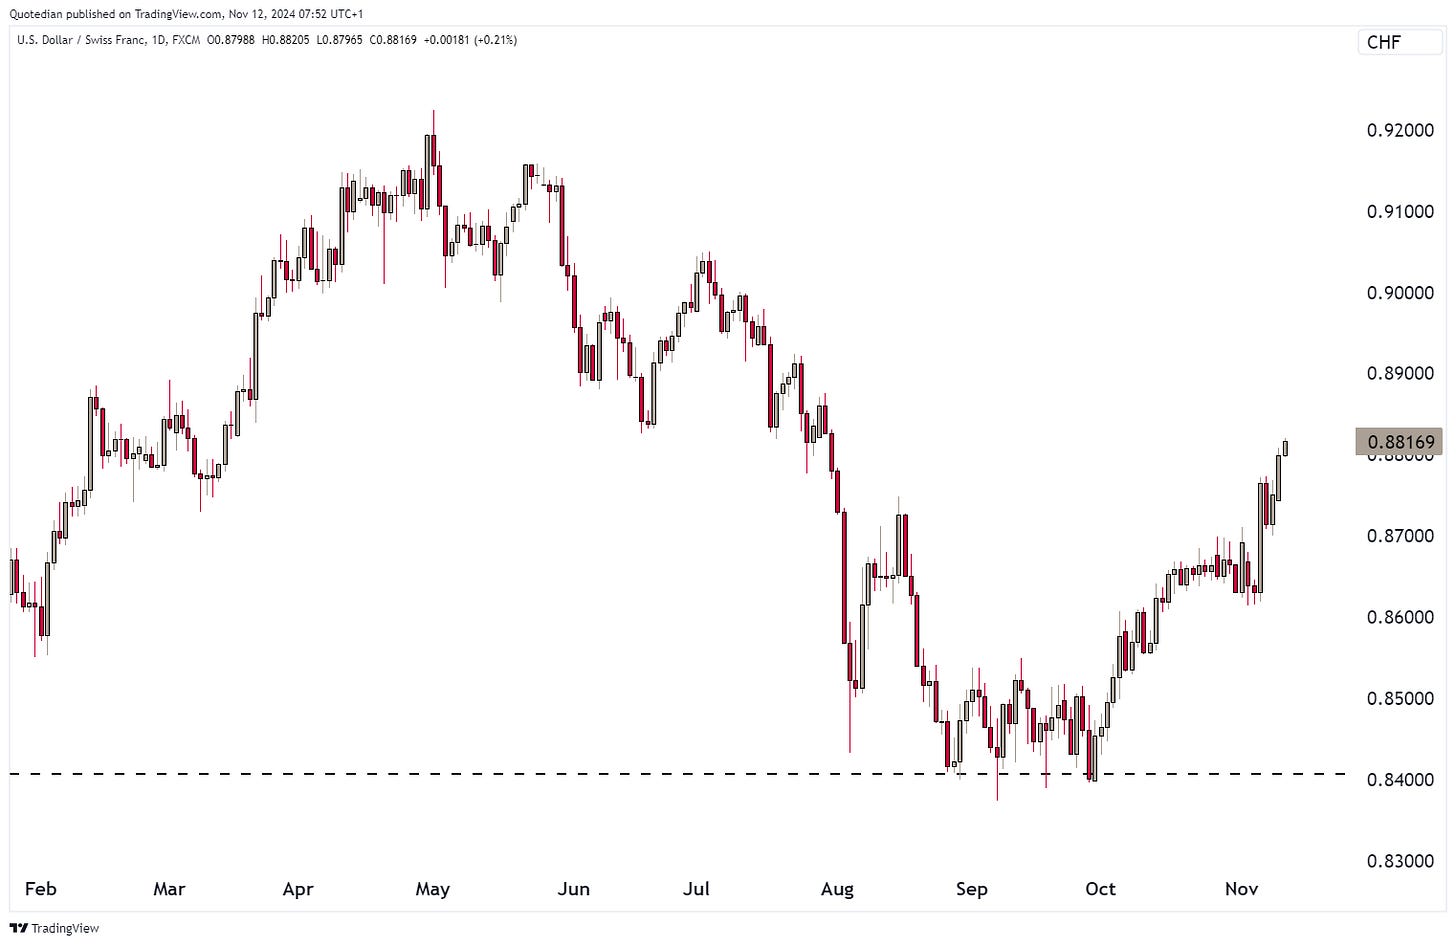
Even the Swissie, so far the “piece de resistance” during the US Dollar revolution revaluation seems to have raised the white flag:
But if we talk currencies, we of course have to talk cryptos … with Bitcoin off to the moon:
But if you think you are an investment hero for holding Bitcoin … you’re not!
Actually, you picked a laggard:
In the commodity space, we are faced with a very mixed performance picture for different commodity futures over the past five days:
Let’s focus just on two - Gold and Oil.
The yellow metal finally got its well-deserved correction, probably mainly USD-strength induced more than anything else:
If USD/oz 2,600 gives, to which I assign a high likelihood, then we should see a swift retreat to 2,400, where buyers should be showing again.
Oil’s initial reaction was to move higher, but the last two sessions seem to be the “correcter” move, given the incoming’s government intention to “drill baby, drill” as outlined in the equity section above:
Time to hit the send button.
Be SAFE and above all, remember to regularly hit that SAVE button!
André
Everything in this document is for educational purposes only (FEPO)
Nothing in this document should be considered investment advice
Investing real money can be costly; don’t do stupid shit
The views expressed in this document may differ from the views published by Neue Private Bank AG
Past performance is hopefully no indication of future performance


