Mind the Gap
The Quotedian - Vol VI, Issue 51 | Powered by NPB Neue Privat Bank AG
“An economist is someone who says, when an idea works in practice, 'let's see if it works in theory. '”
— Walter W. Heller
DASHBOARD
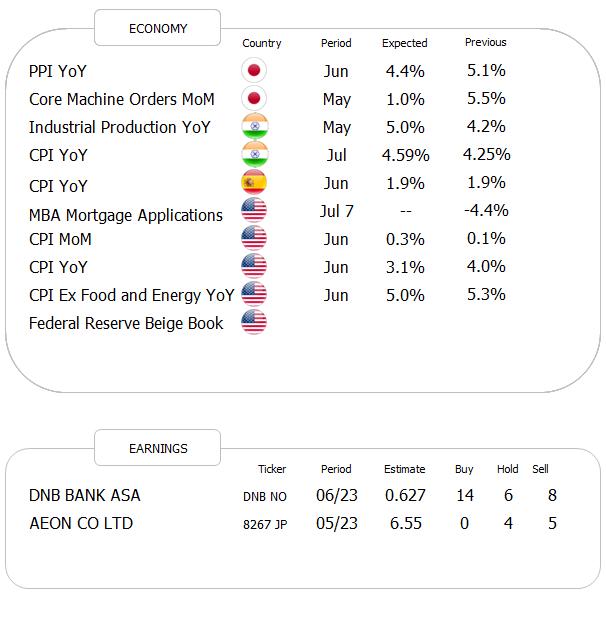
AGENDA
CROSS-ASSET DELIBERATIONS
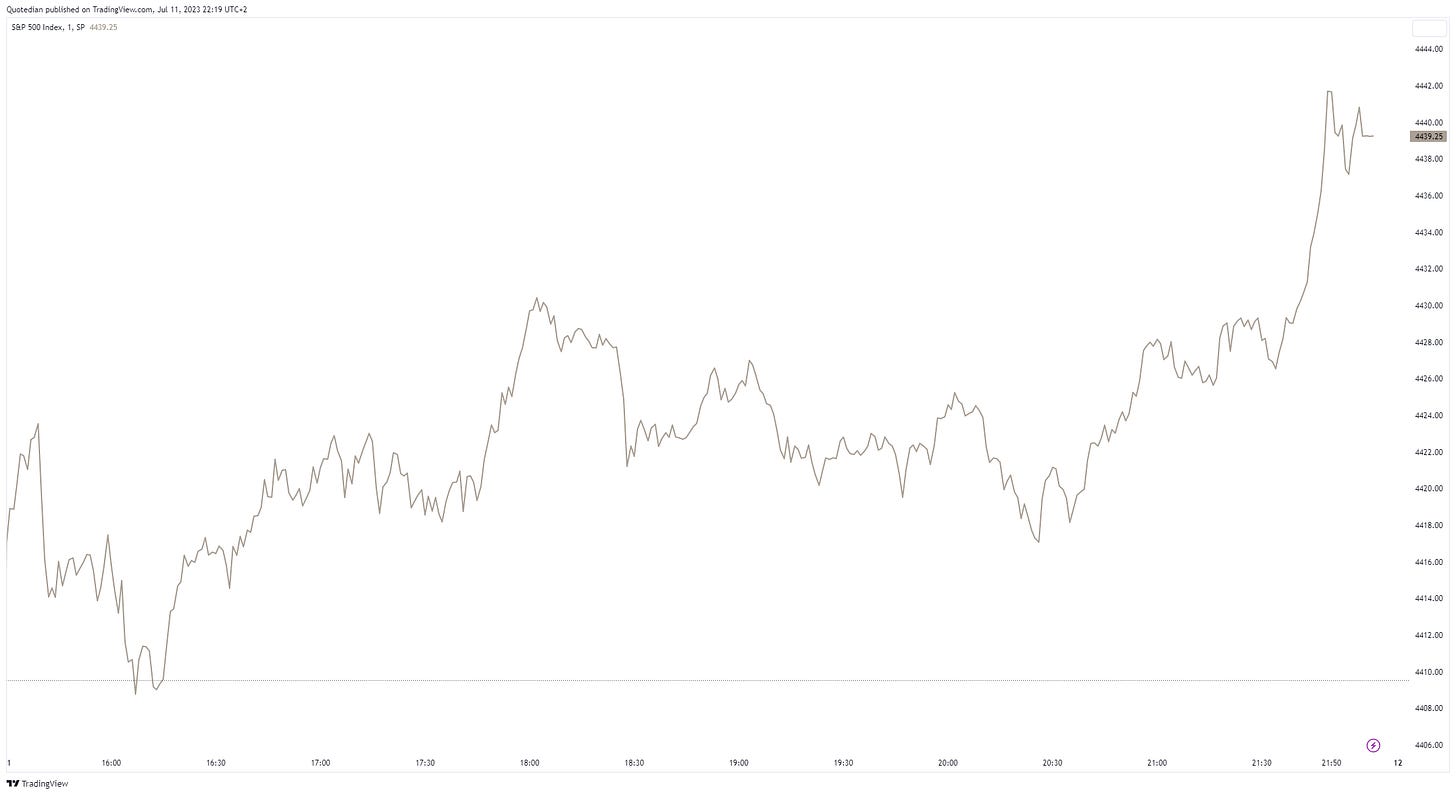
Stocks had a second consecutive strong day and the s&P 500 has now filled the gap, which opened as recently as last Thursday:
Similar to Monday session, most of the strength came in the last hour and a half of trading or so:
This reminded me of the Smart Money Flow index, which is calculated according to a proprietary formula by taking the action of the Dow in two time periods: shortly after the opening and within the last hour. The first minutes represent emotional buying, driven by greed and fear of the crowd based on good and bad news. Smart money waits until the end and they very often test the market before by shorting heavily just to see how the market reacts. Then they move in a big way.
The interpretation is that when the Dow makes a high which is not confirmed by the SMFI there is trouble ahead:
In 2021 for example, whilst the Dow was moving higher, the SMFI failed to confirm that strength, which eventually lead to the harsh bear market of 2022. However, no red light is coming from the SMFI on the current situation; quite to the contrary would a series of higher highs suggest that the Dow should break higher eventually.
And taking of breakouts, look at what happened to small caps stocks (Russell 2000), which we had just spoken about on Monday:
That’s about as clear as a breakout you could hope for (unless it turns out to be a bull trap of course).
Back to some market internals from yesterday’s session… turns out it was a very positive breadth day, with 416 stocks in the S&P 500 trading higher and all eleven economic sectors up on the day too. Leading the sectors were energy stocks, which pleasured us tremendously, as we highlight that specific market segment in our CIO Office Outlook for Q3 2023, which will be published later today.
The good old Quotedian, now powered by NPB Neue Privat Bank AG
Want to see our most recent CIO Outlook (published later today) applied in your portfolio?
Contact us at info@npb-bank.ch
Asian stocks this morning are trading mixed, with Japanese and Chinese Mainland stocks lower, but Hong Kong equities and some other regional markets eking out decent gains.
European index futures once again point to a friendly start for cash markets at 9 a.m.
But enough cheap equity talk - let’s look at the one asset class to rule them all: interest rates! Which again were not particularly interesting yesterday…
The US 10-year Treasury yield put in a yawning four bps trading range session, though on the daily chart we now have three consecutive red candles:
I think to remember that such a pattern in candlestick/tealeaves reading is called a “three crows” pattern with mildly bearish implications.
The yield curve also continued as steepening process, though it still early to call it a new trend:
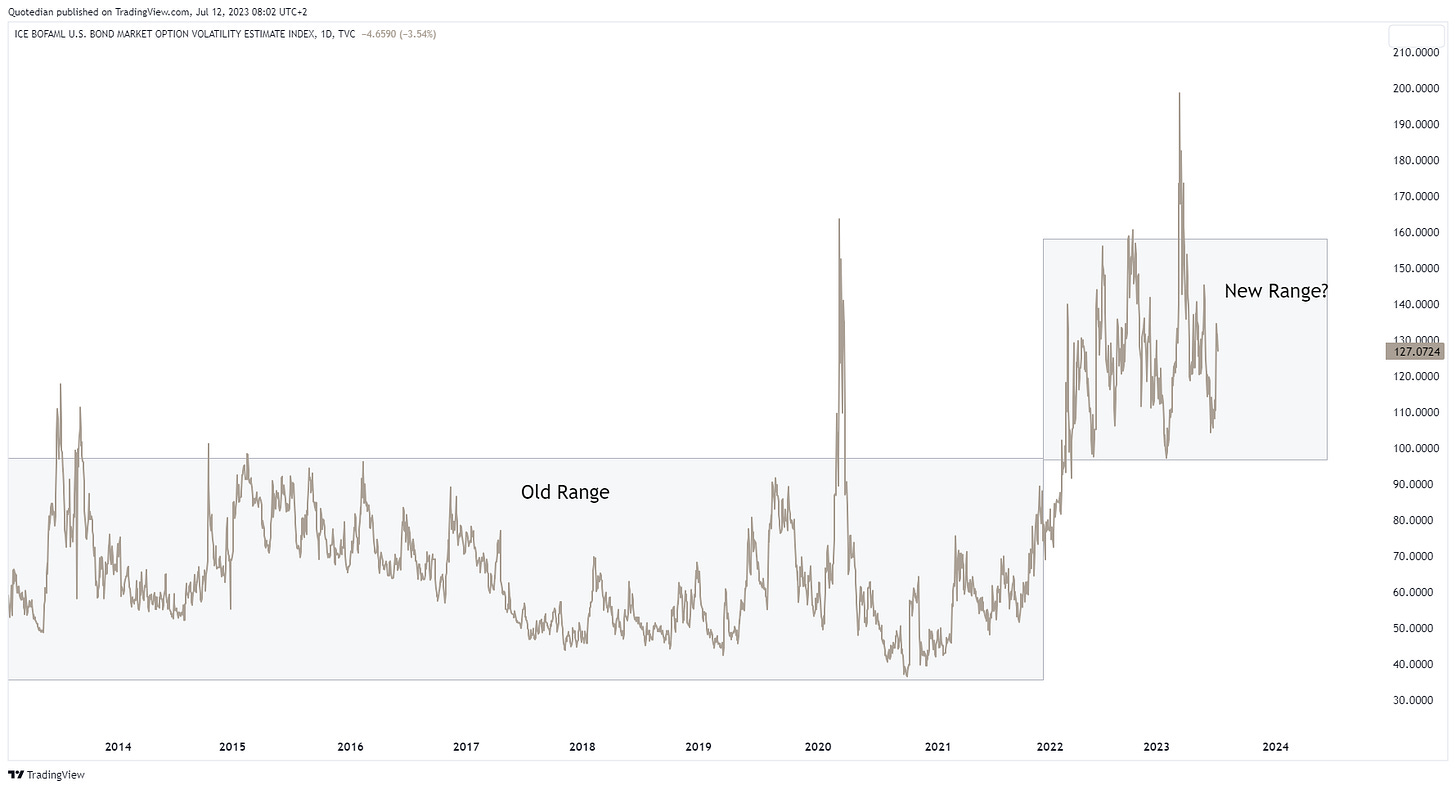
Also of interest, it seems that the bonds’ VIX equivalent, the MOVE, has entered a new multi-year range:
In currency markets, the US Dollar was weaker against basically everything else, and is slowly approaching a major inflection/support point at 101 on the US Dollar Index (DXY):
Below 101.00 I would tactically (and maybe even strategically) underweight the greenback.
This is also a theme we discuss in our NPB CIO Office Chartbook Q3/2023, which will also go online on our webpage later today.
Ok, enough for today (except a flamboyant COTD still to follow).
US CPI the focus later today, PPI tomorrow and bank earnings on Friday.
Stay safe,
André
CHART OF THE DAY
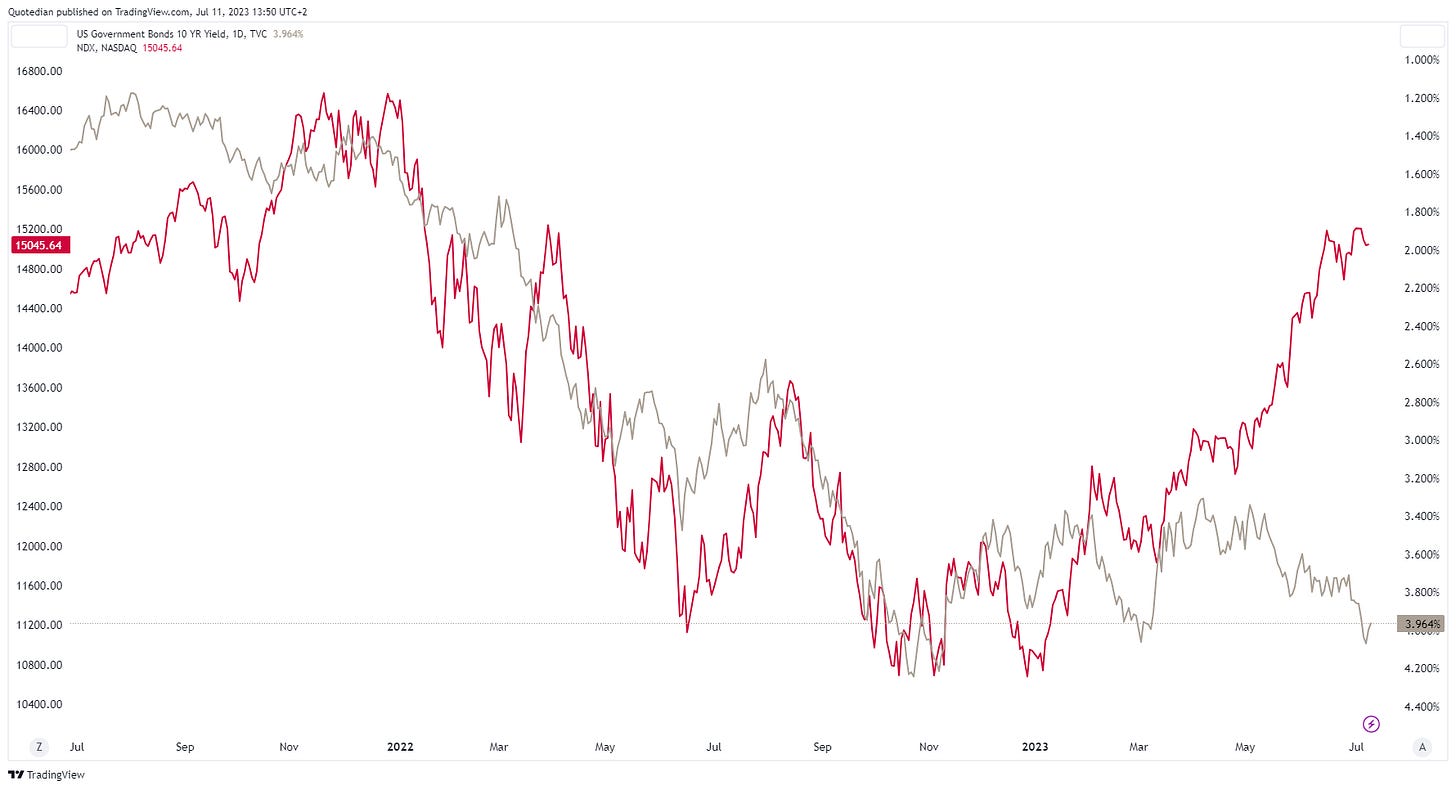
Today’s title “Mind the Gap” refers to the decorrelation that has taken place between the Nasdaq 100 index (red) and the (inverted) yield on 10-year US Treasuries (grey):
The usual correlation, that held up well in the past, makes intuitively sense, has high duration stocks in the Nasdaq should be sensitive to change in interest rates.
Oh, but wait, you will shout at me! We all know that the Nasdaq has been pushed higher by some chosen few (MSFT, NVDA & Co.), which are up because we are in a new paradigm bla bla bla …
Ok then, let’s add the Nasdaq 100 Equal-Weight index also the the above chart for good measure:
Same difference, I would say.
Now, it of course, could always be that tech stocks are “right” and bond yields “wrong”, in which case bond yields should collapse over the coming months. Perhaps.
But this brings me to the true “Mind the Gap” chart of today, which caught my attention as it crossed my inbox yesterday:
The purple line, a composite risk model courtesy of Mike Green’s Simplify Asset Management, is at peak levels (ex GFC). However, when at this level credit spread (green line) is usually also peaking, which is not the case this time around. Corporate bankruptcies (yellow line) however agree with the composite risk measure.
Mind the gap …
Thanks for reading The Quotedian! Subscribe for free to receive new posts the moment they are published.
DISCLAIMER
Everything in this document is for educational purposes only (FEPO)
Nothing in this document should be considered investment advice
The views expressed in this document may differ from the views published by Neue Private Bank AG
Past performance is hopefully no indication of future performance


