


"We must all suffer one of two things: the pain of discipline or the pain of regret."
— Jim Rohn

No, not all markets were closed yesterday in celebration of Whit Monday/Pentecost/Pfingsten, so while equities and bonds steamed higher, what were you doing?
But fret and regret not, that’s why you have your favourite cross-asset newsletter fresh, crisp and ready in your Inbox this early Tuesday morning!
And in case you want to have condensed but exceptional market insights on a nearly daily basis, do not forget to sign up to The Quotedian - Daily Edition, formerly known as The QuiCQ:
On to some market observations, starting with equities …
The US stock market, hereby proxied via the S&P 500, has been up for eight consecutive weeks:
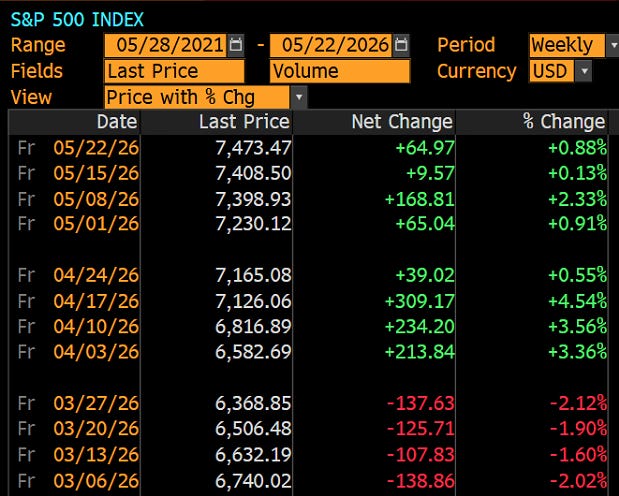
That’s quite an impressive pace on the weekly chart,
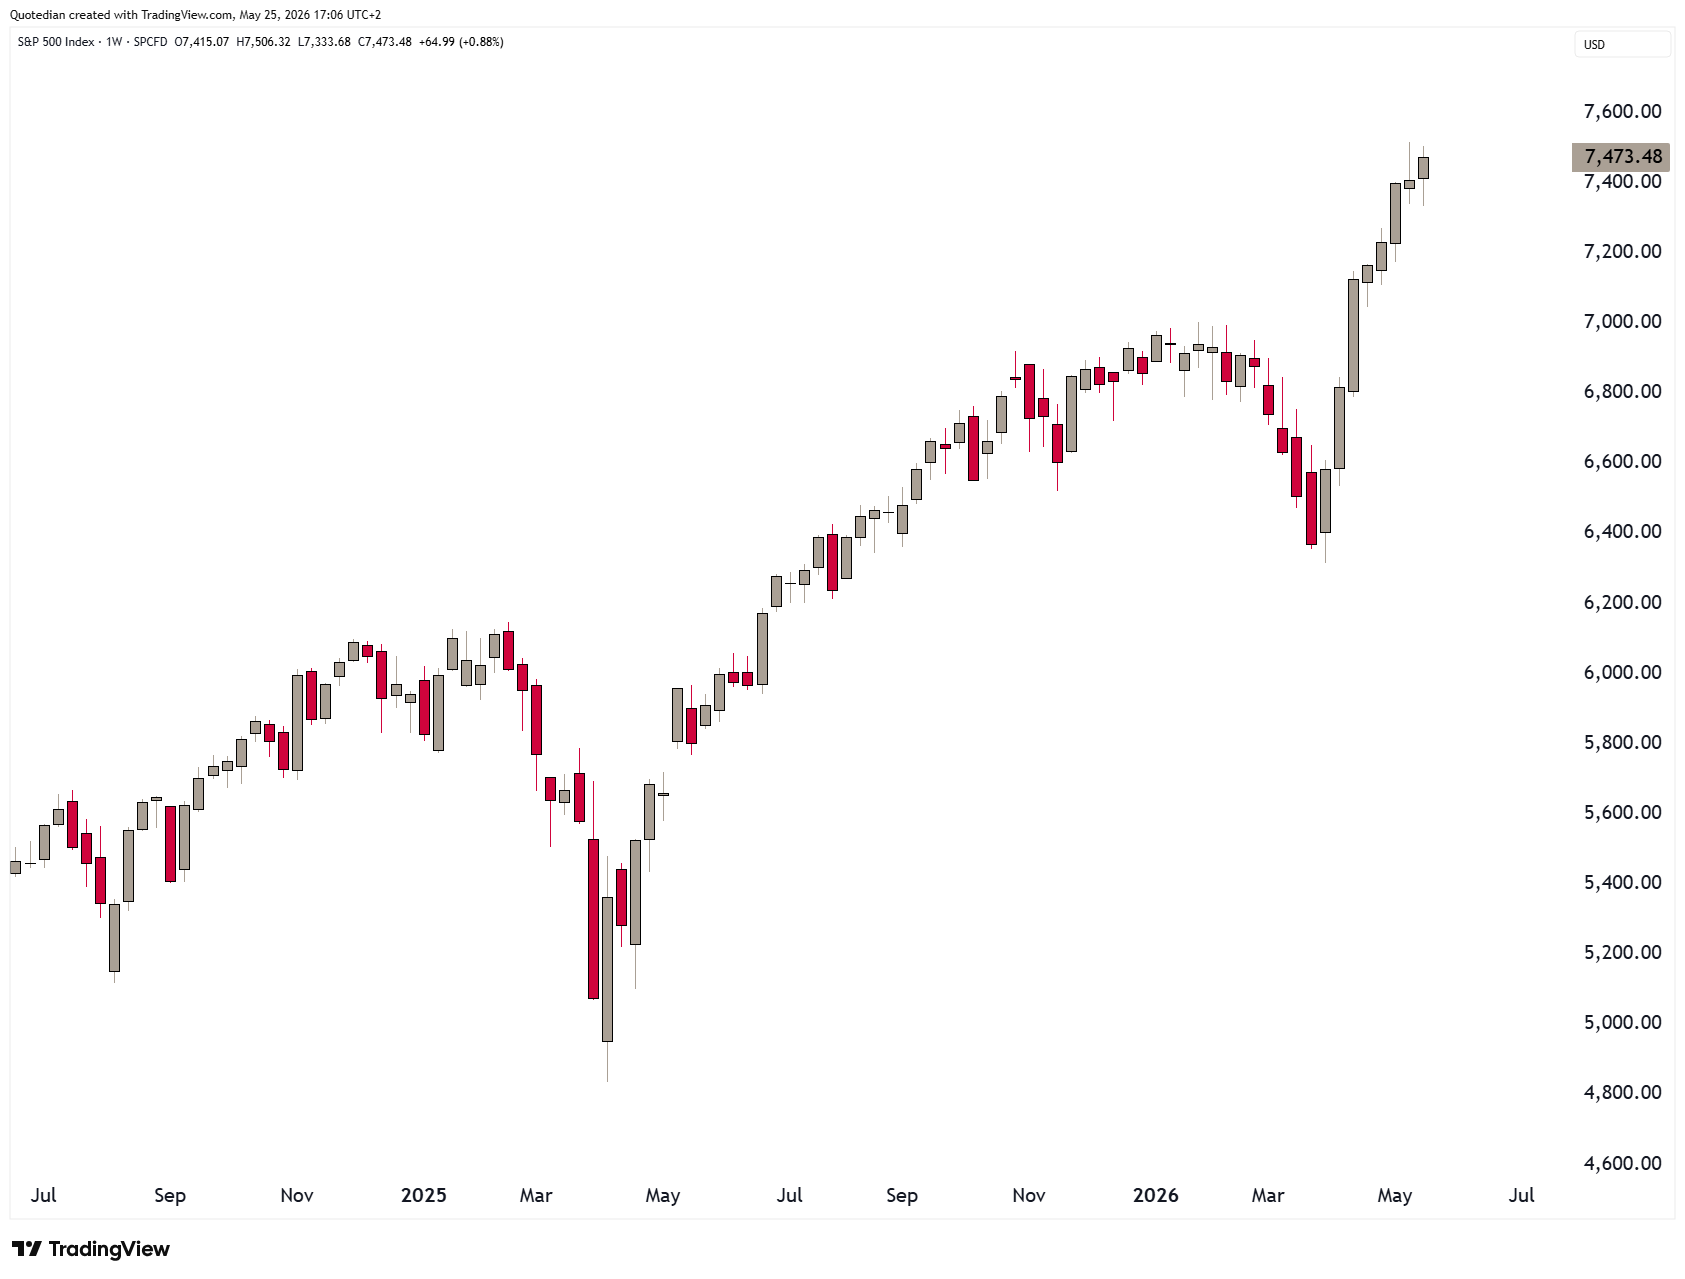
looking even more impressive on the daily version of the same:
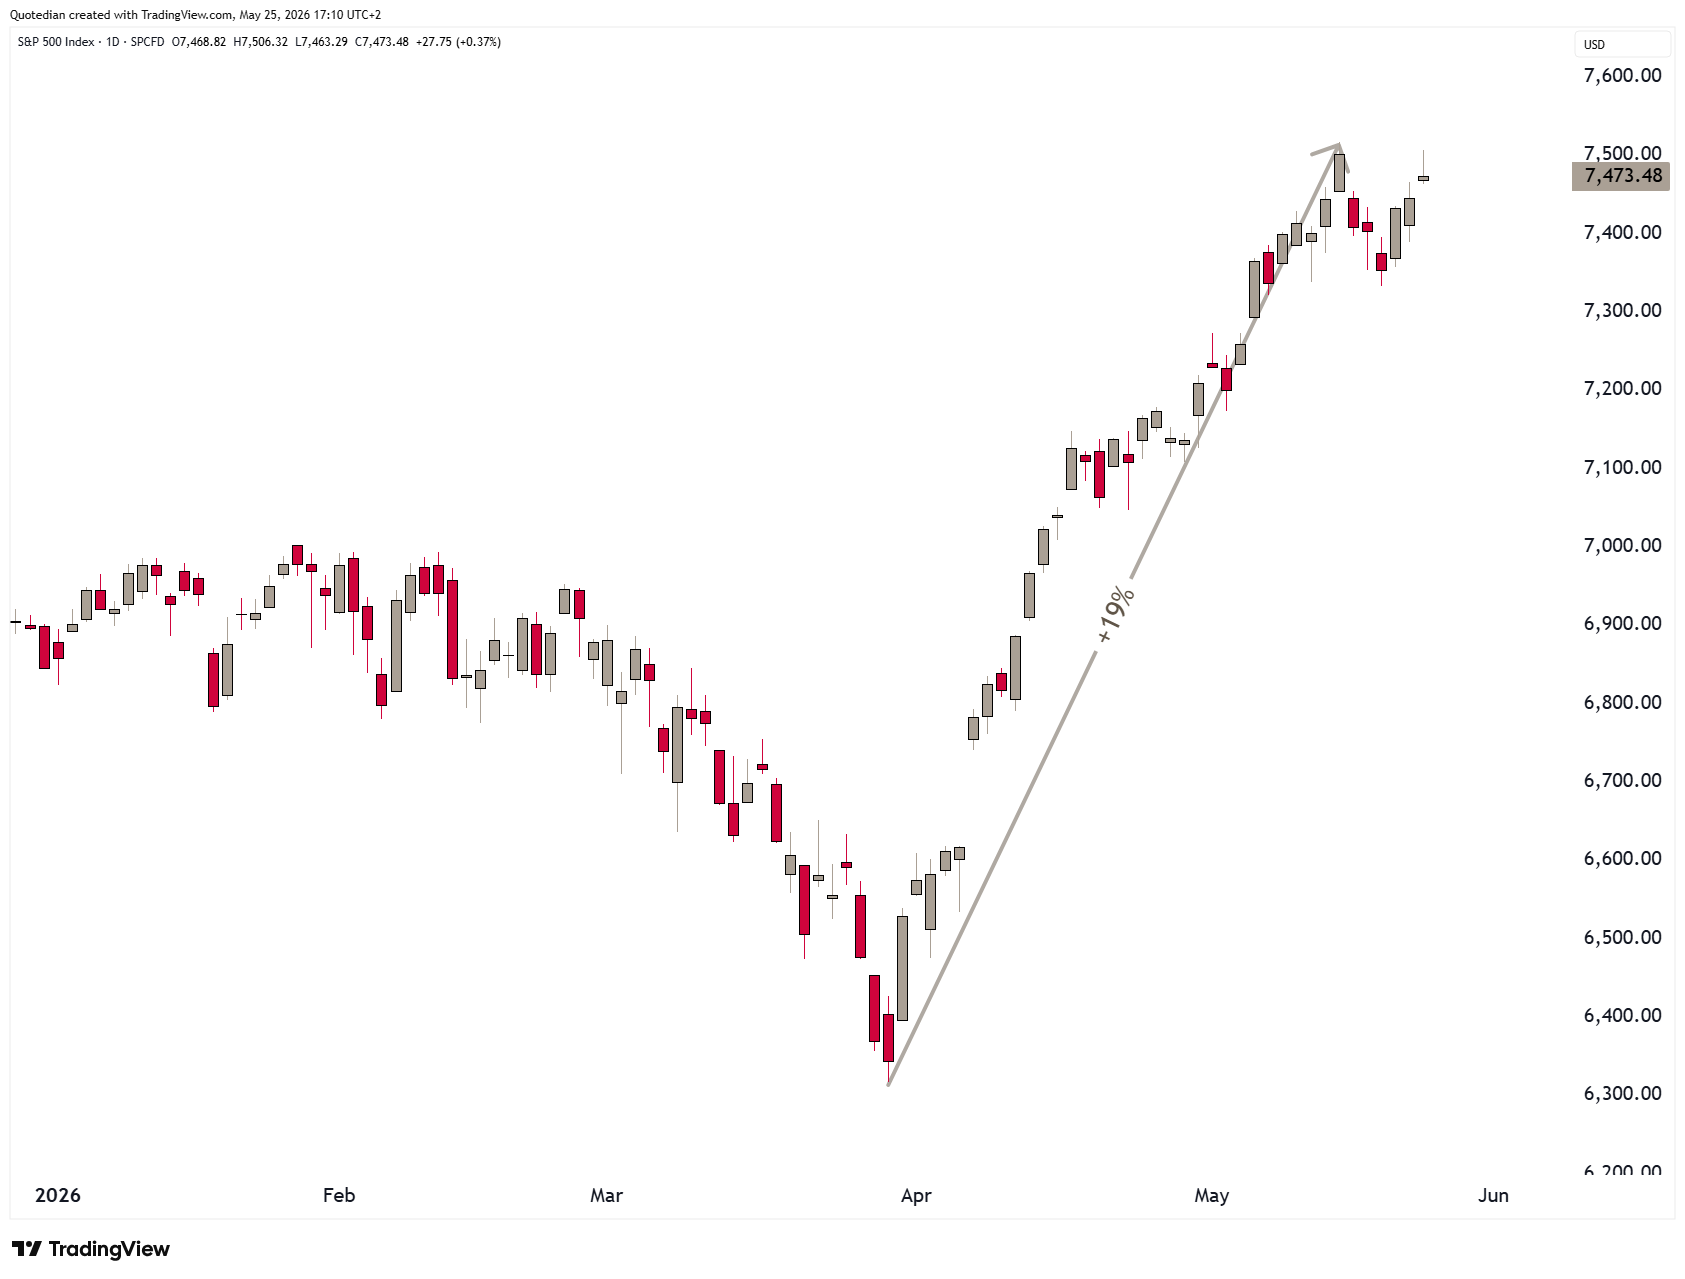
The Naysayers (aka bears) will immediately point out however, that the S&P 500 did not make a new high last week and that last candle could even be interpreted as a trend-reversing shooting star candlestick. The bulls in turn will retort that, yes but, the equal-weight version of the index (RSP) made a new all-time high on Friday, which is very bullish:
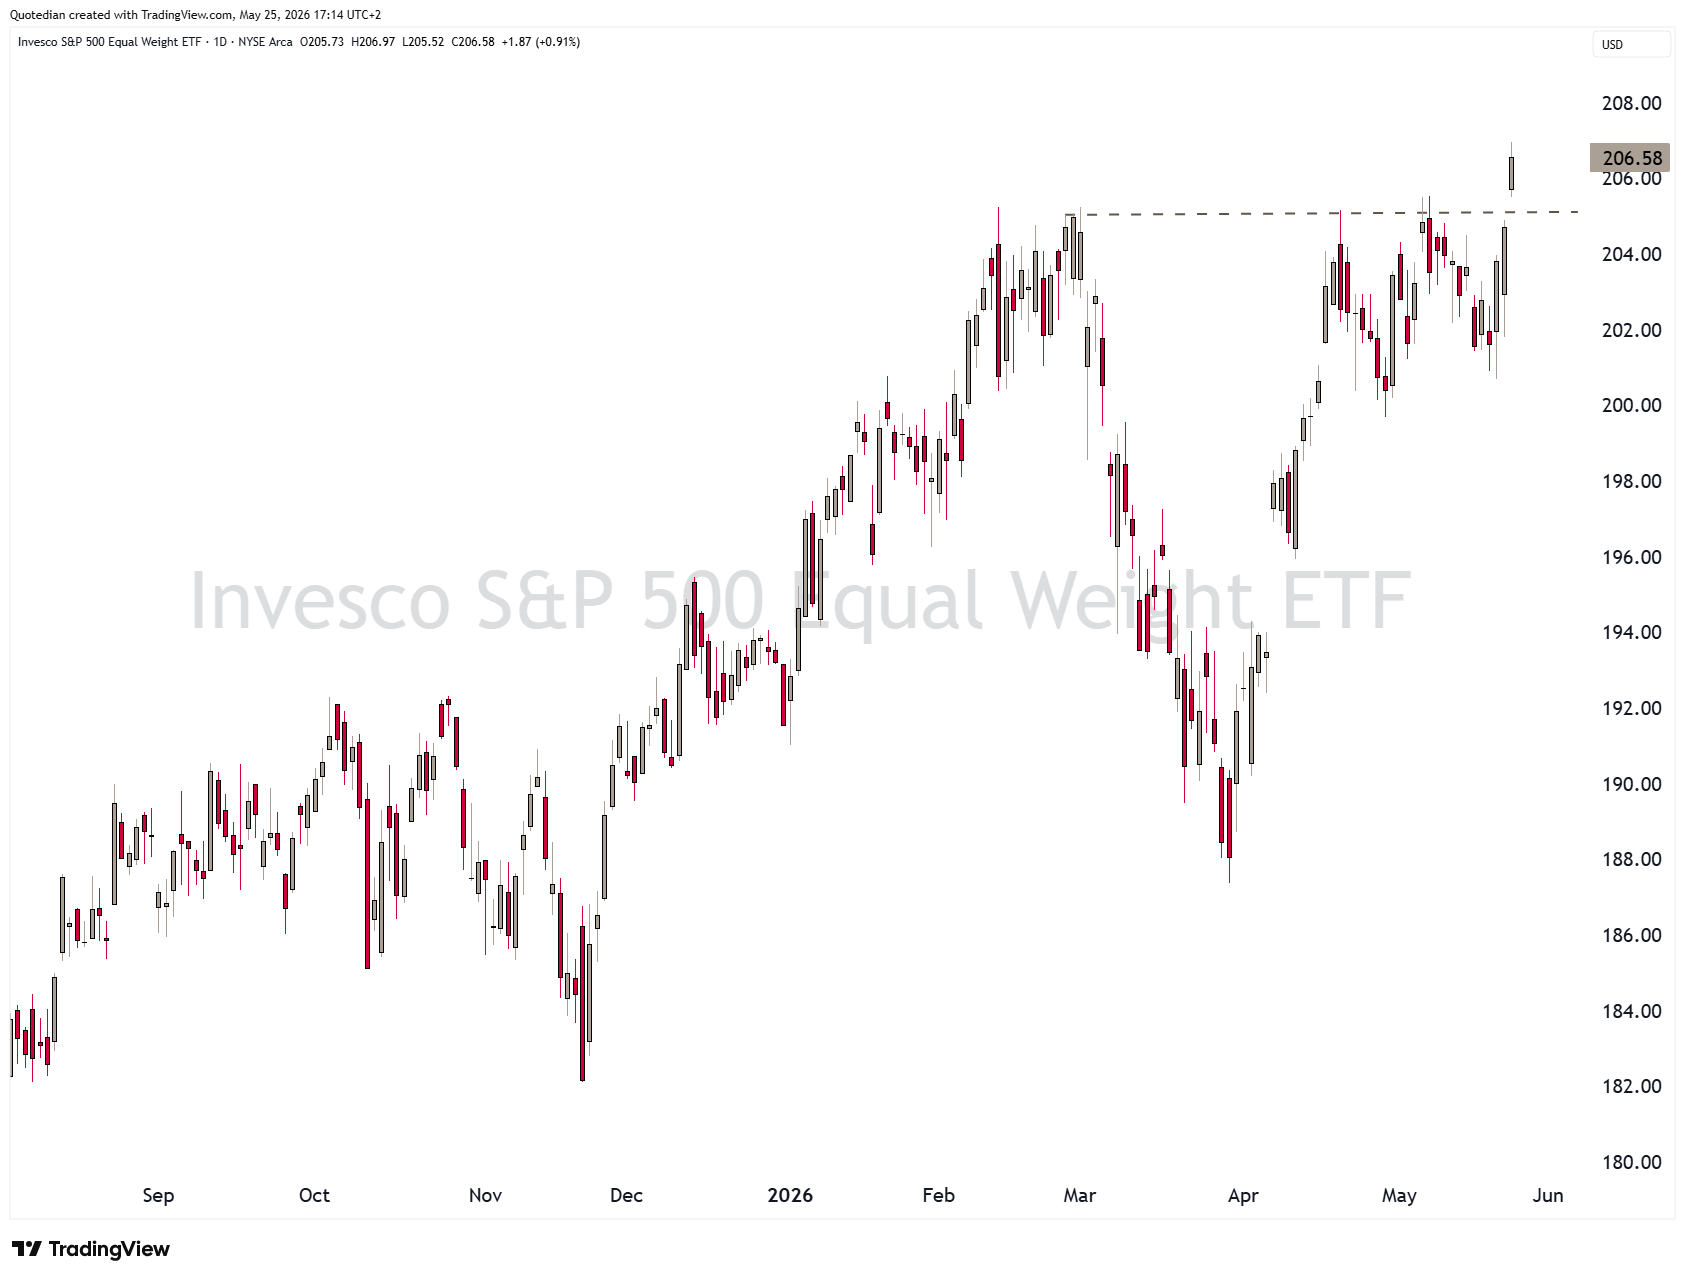
I concur with that latter interpretation and firmly believe that the burden of the prove lies with the bears here.
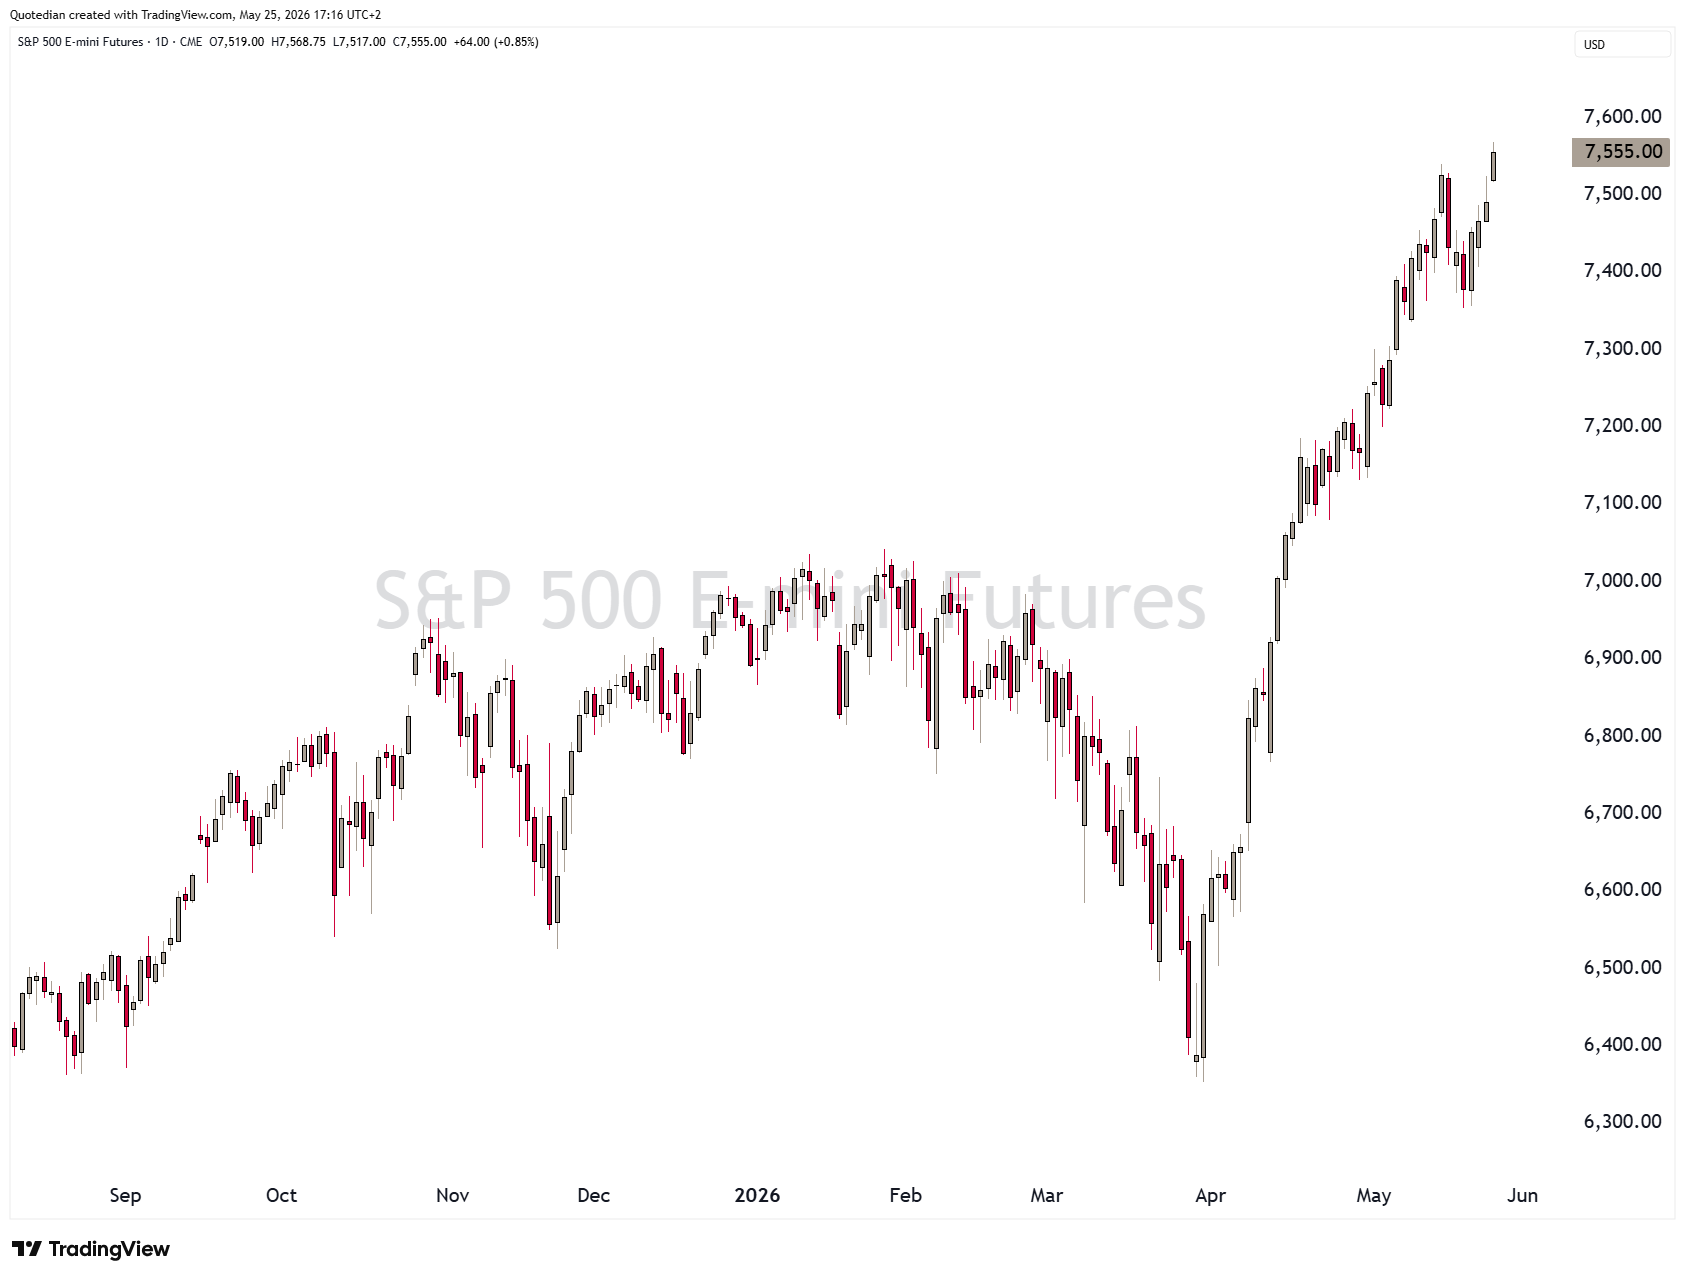
Some follow-through would of course be great, but given the further upswing during Monday’s shortened futures trading session, it seems likely we will get just that:
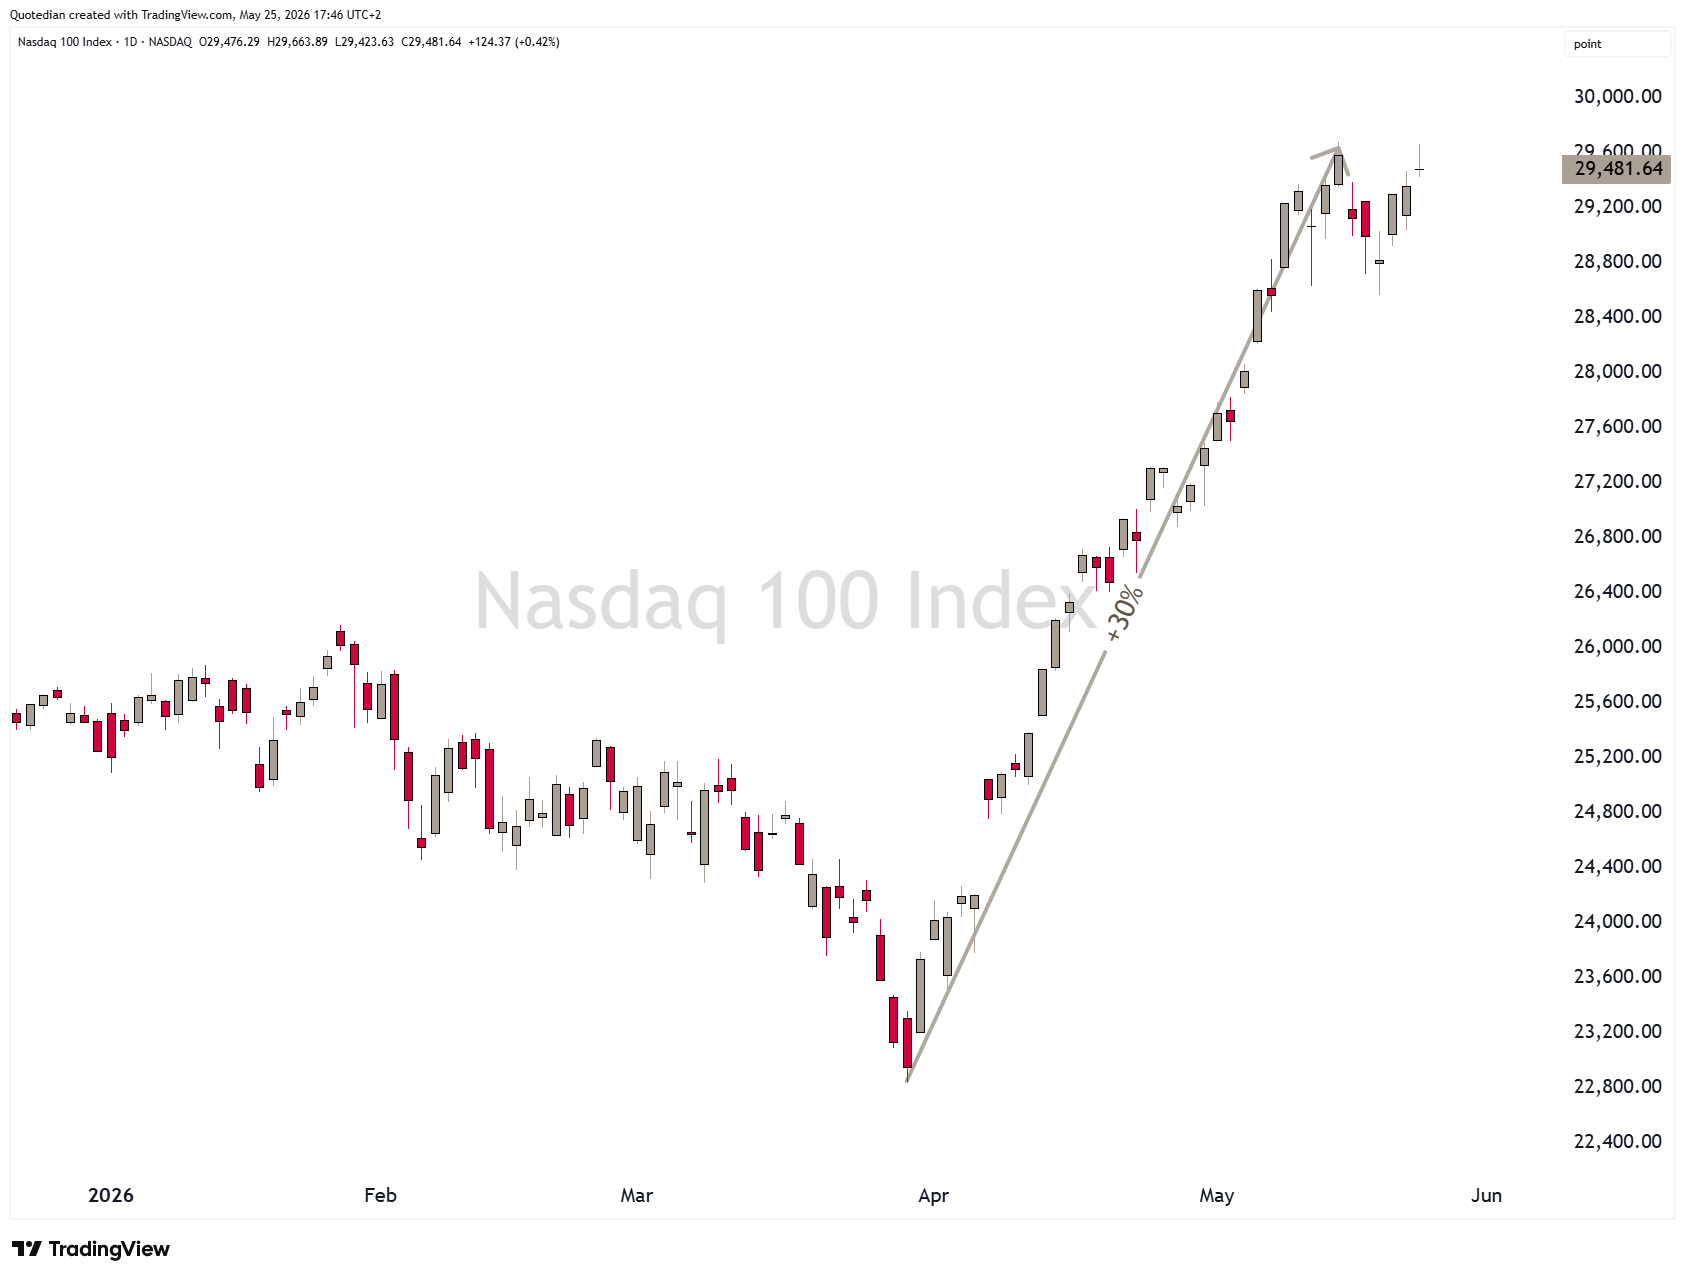
The tech-stock heavy Nasdaq 100 has done of course even better,
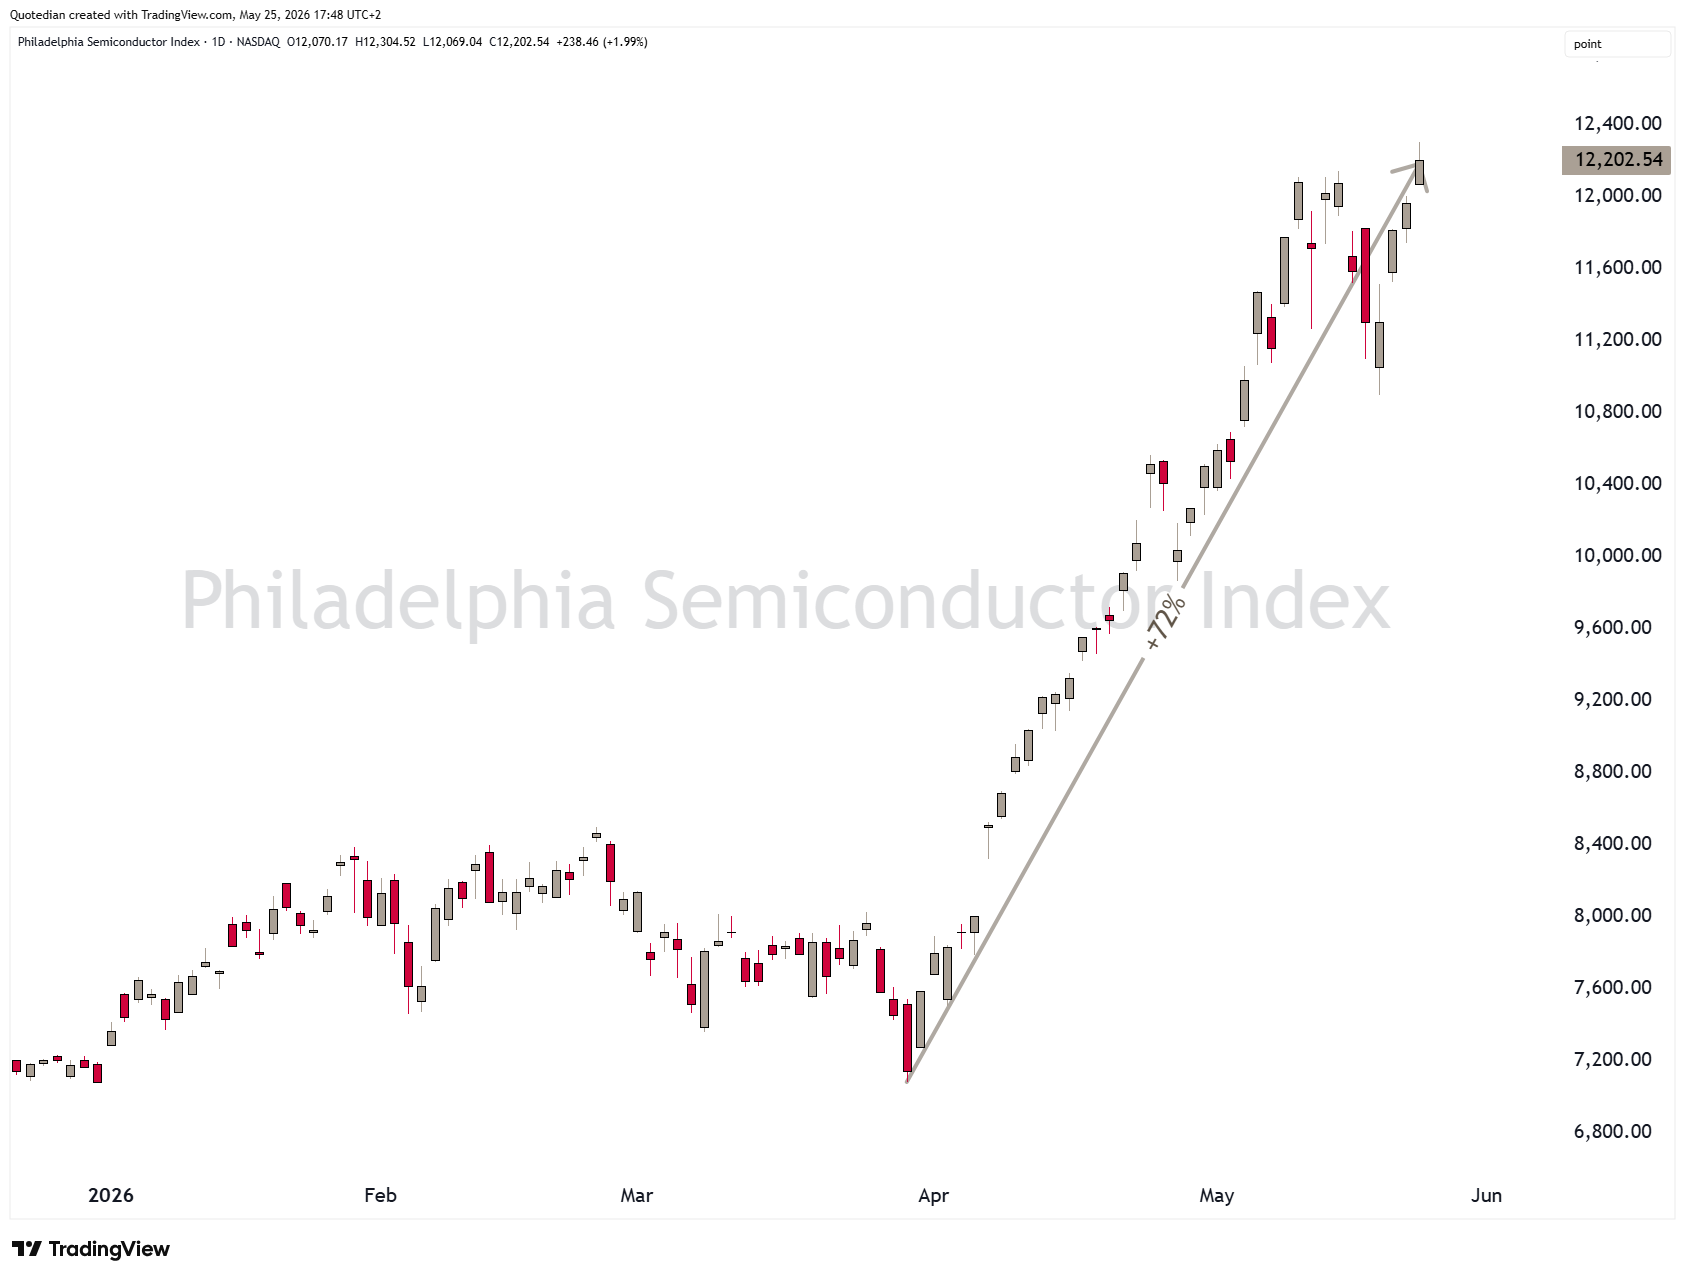
but even that 30% rally was dwarfed by that insane 70%-plus rally on the Philadelphia Semiconductor index:
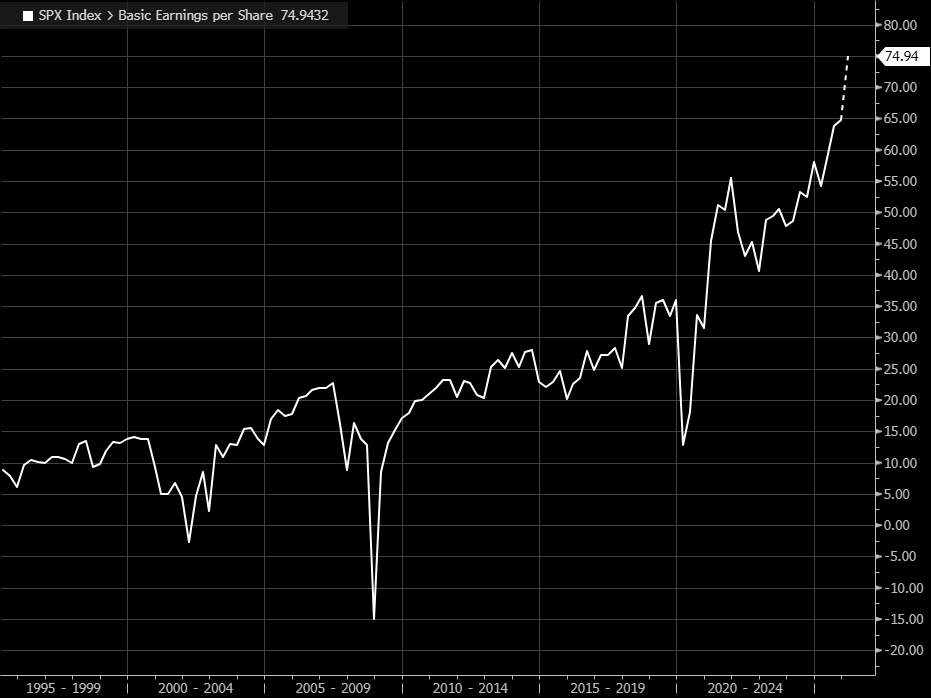
By all means, earnings have been supportive to the stock market advances, as the following chart of EPS on the S&P 500 shows:
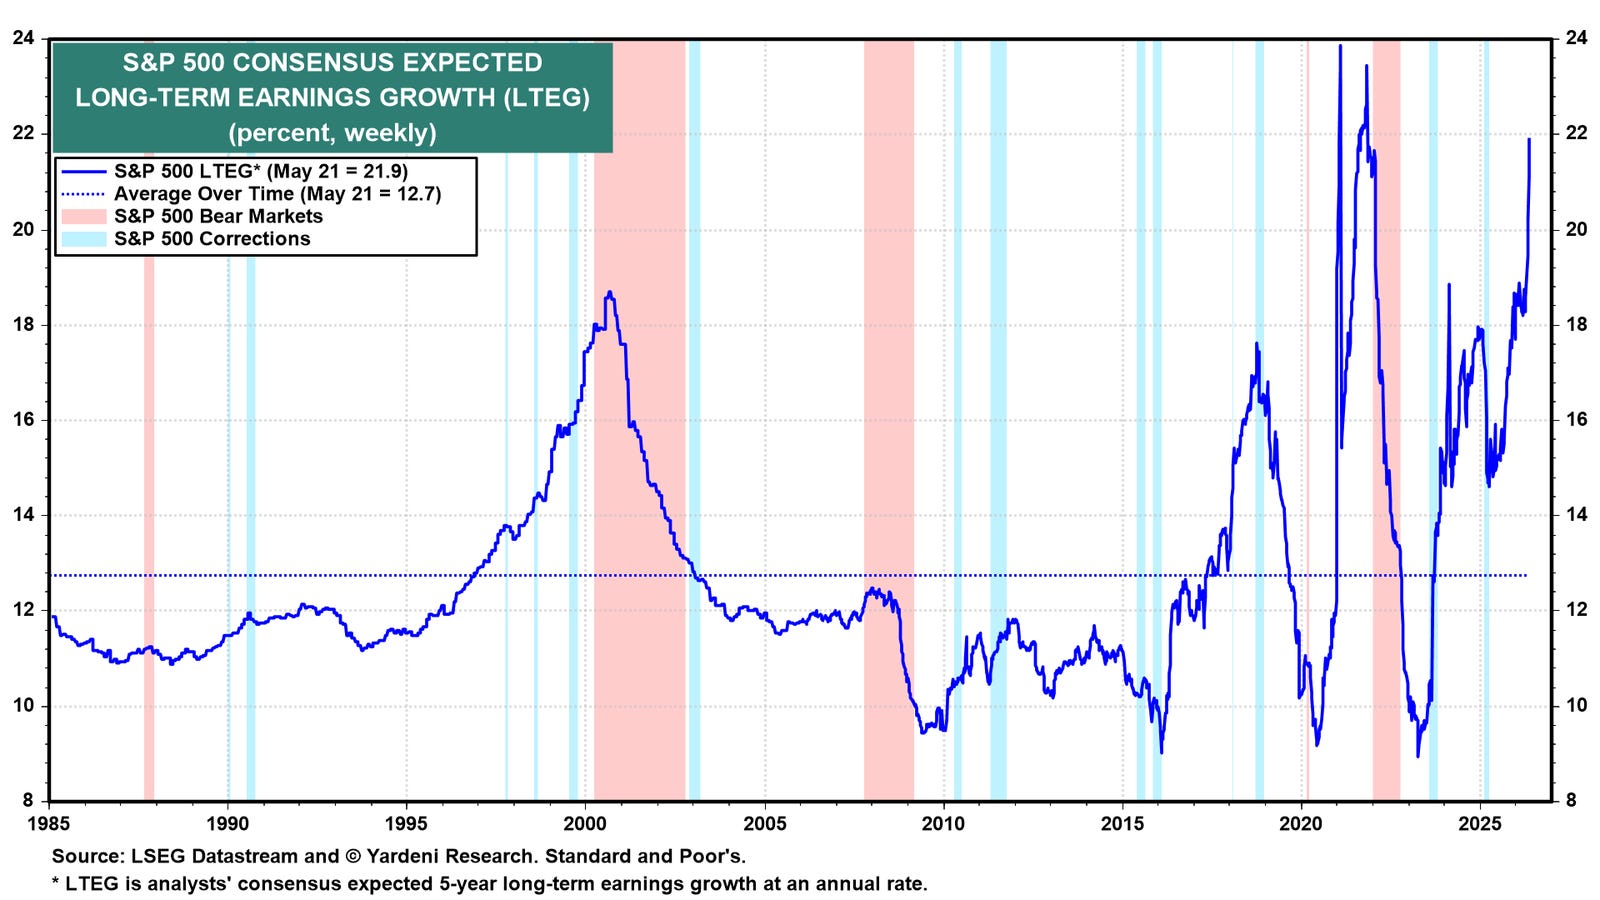
However, as the following fantastic chart from the equally fantastic folks at Yardeni Research shows, analysts may be over extrapolating earnings a tad:
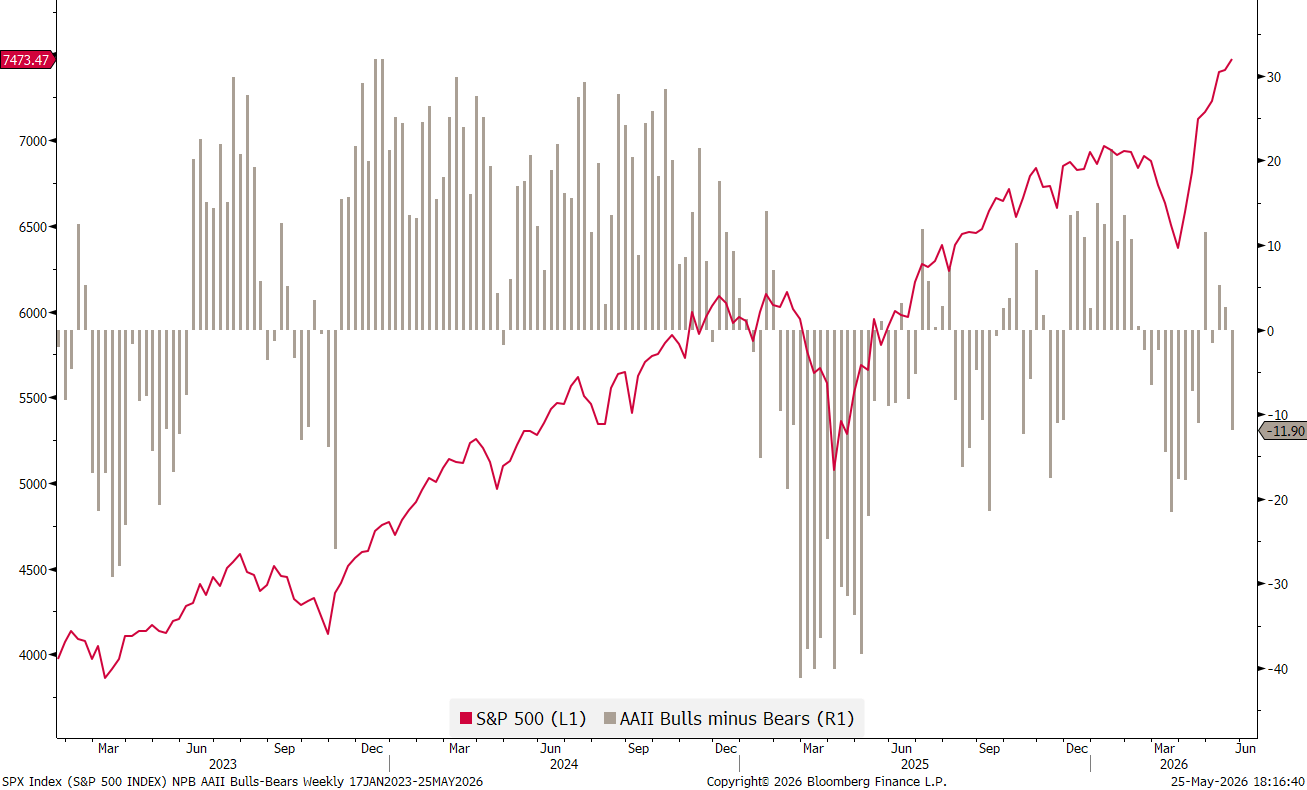
Nevertheless, for the time being, the rally could continue as sentiment is not frothy,
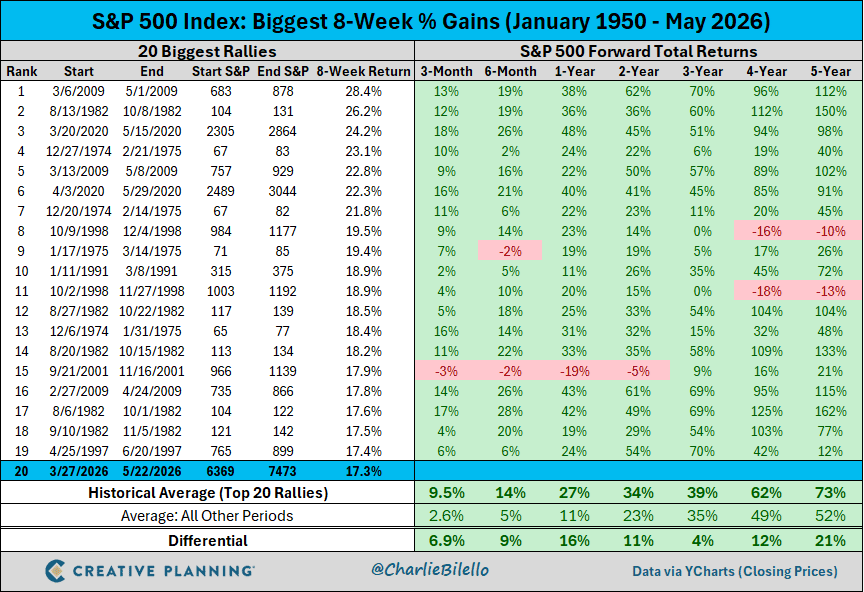
and previous bouts of strength like the one just witnessed brought above average returns over the following 12-months:
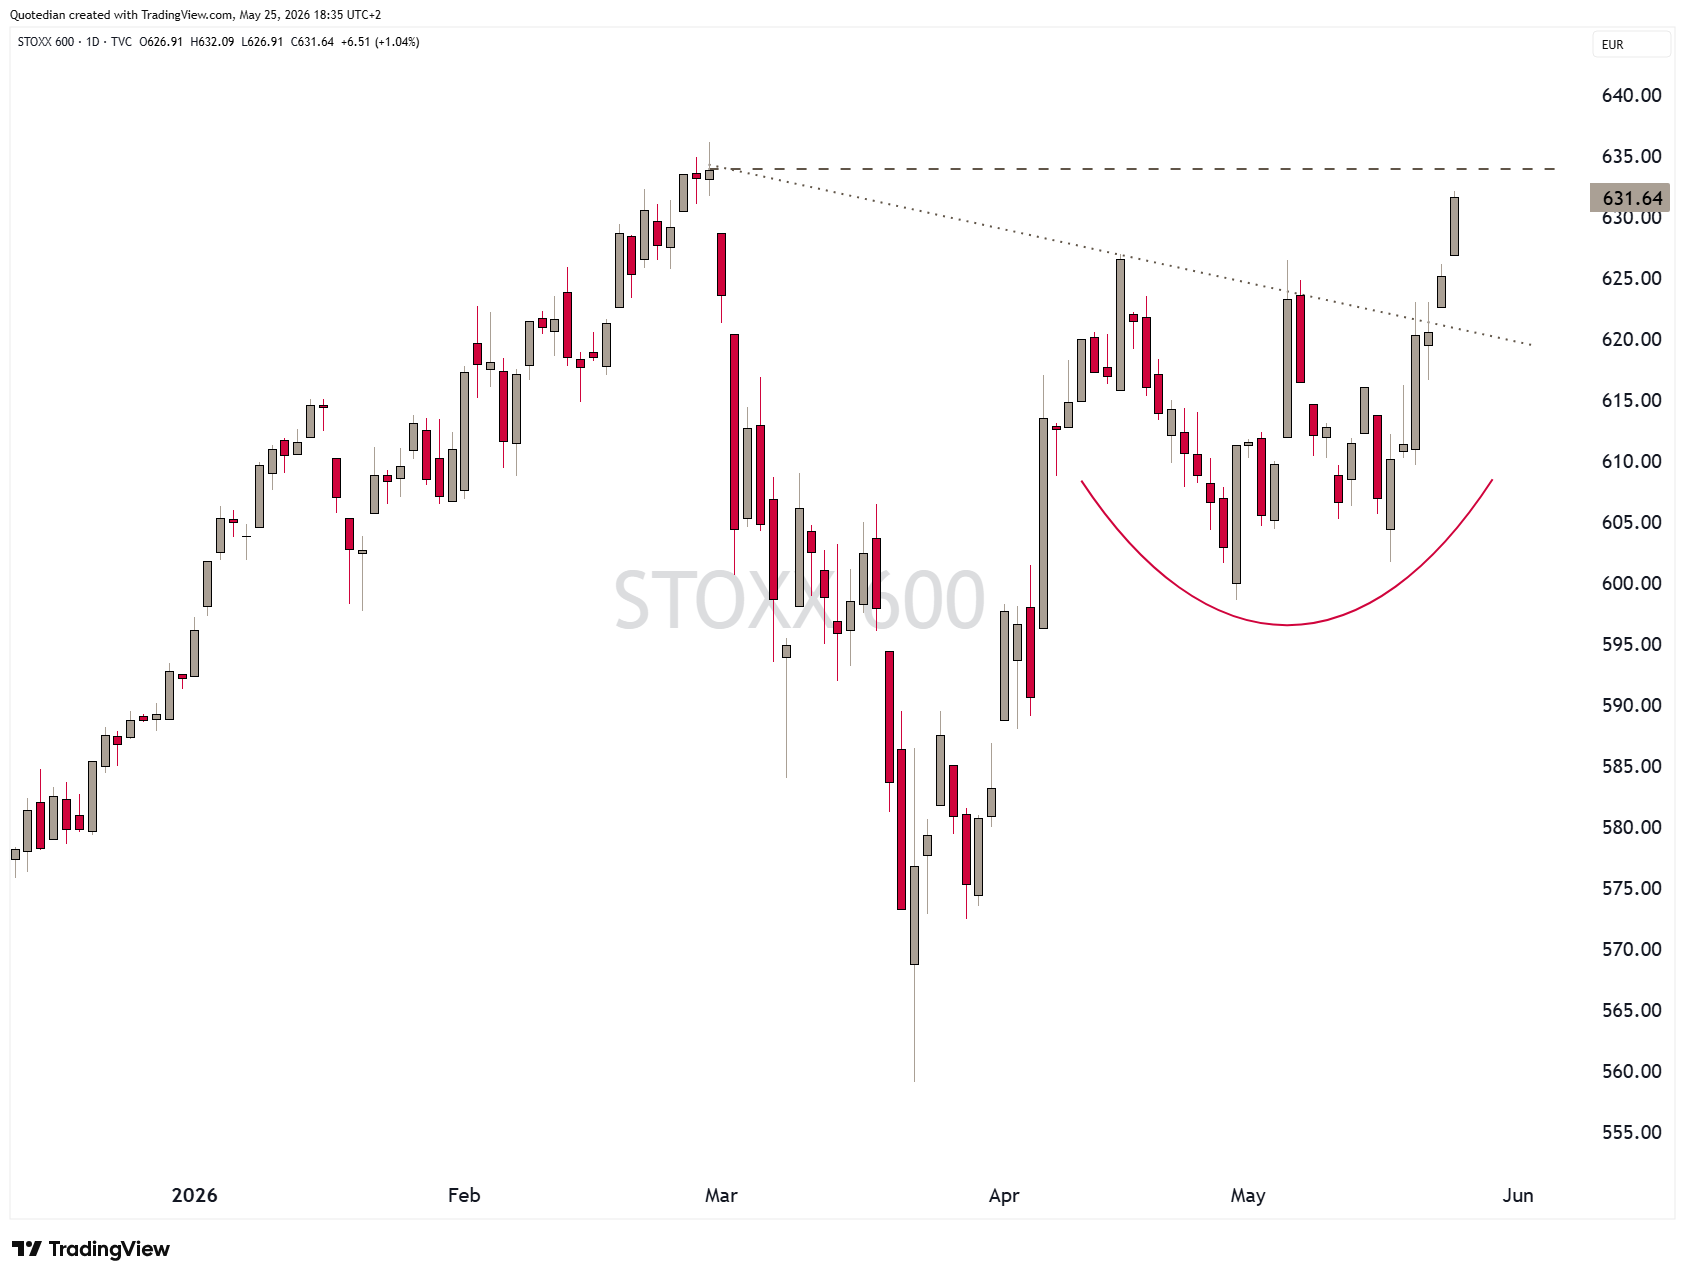
Even European stocks are now showing signs of life, with the STOXX 600 Europe index on the verge (verge=0.35%) of making a new all-time high (ATH):
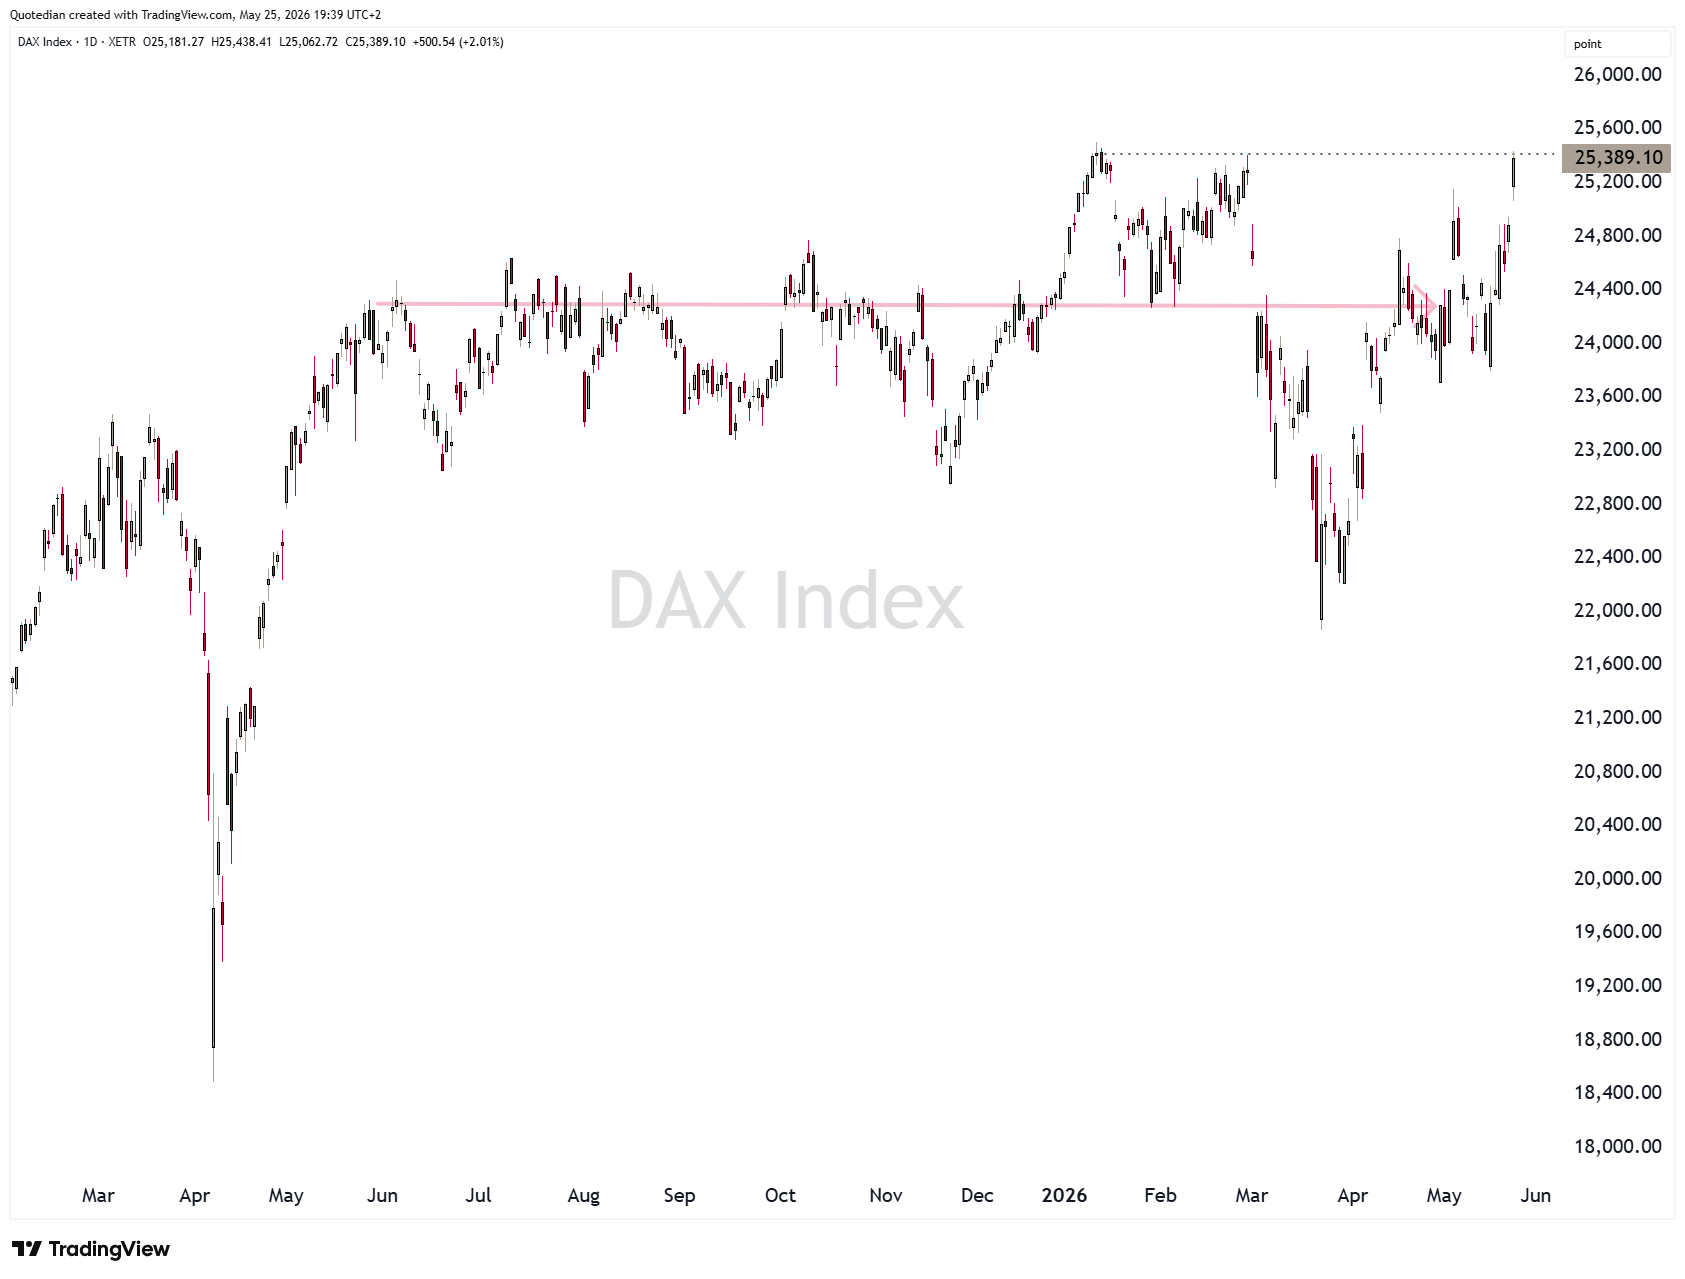
Germany’s DAX only needs 31 index points (or 0.12%) to reach a new ATH and officially break out of its 12-month lethargy:
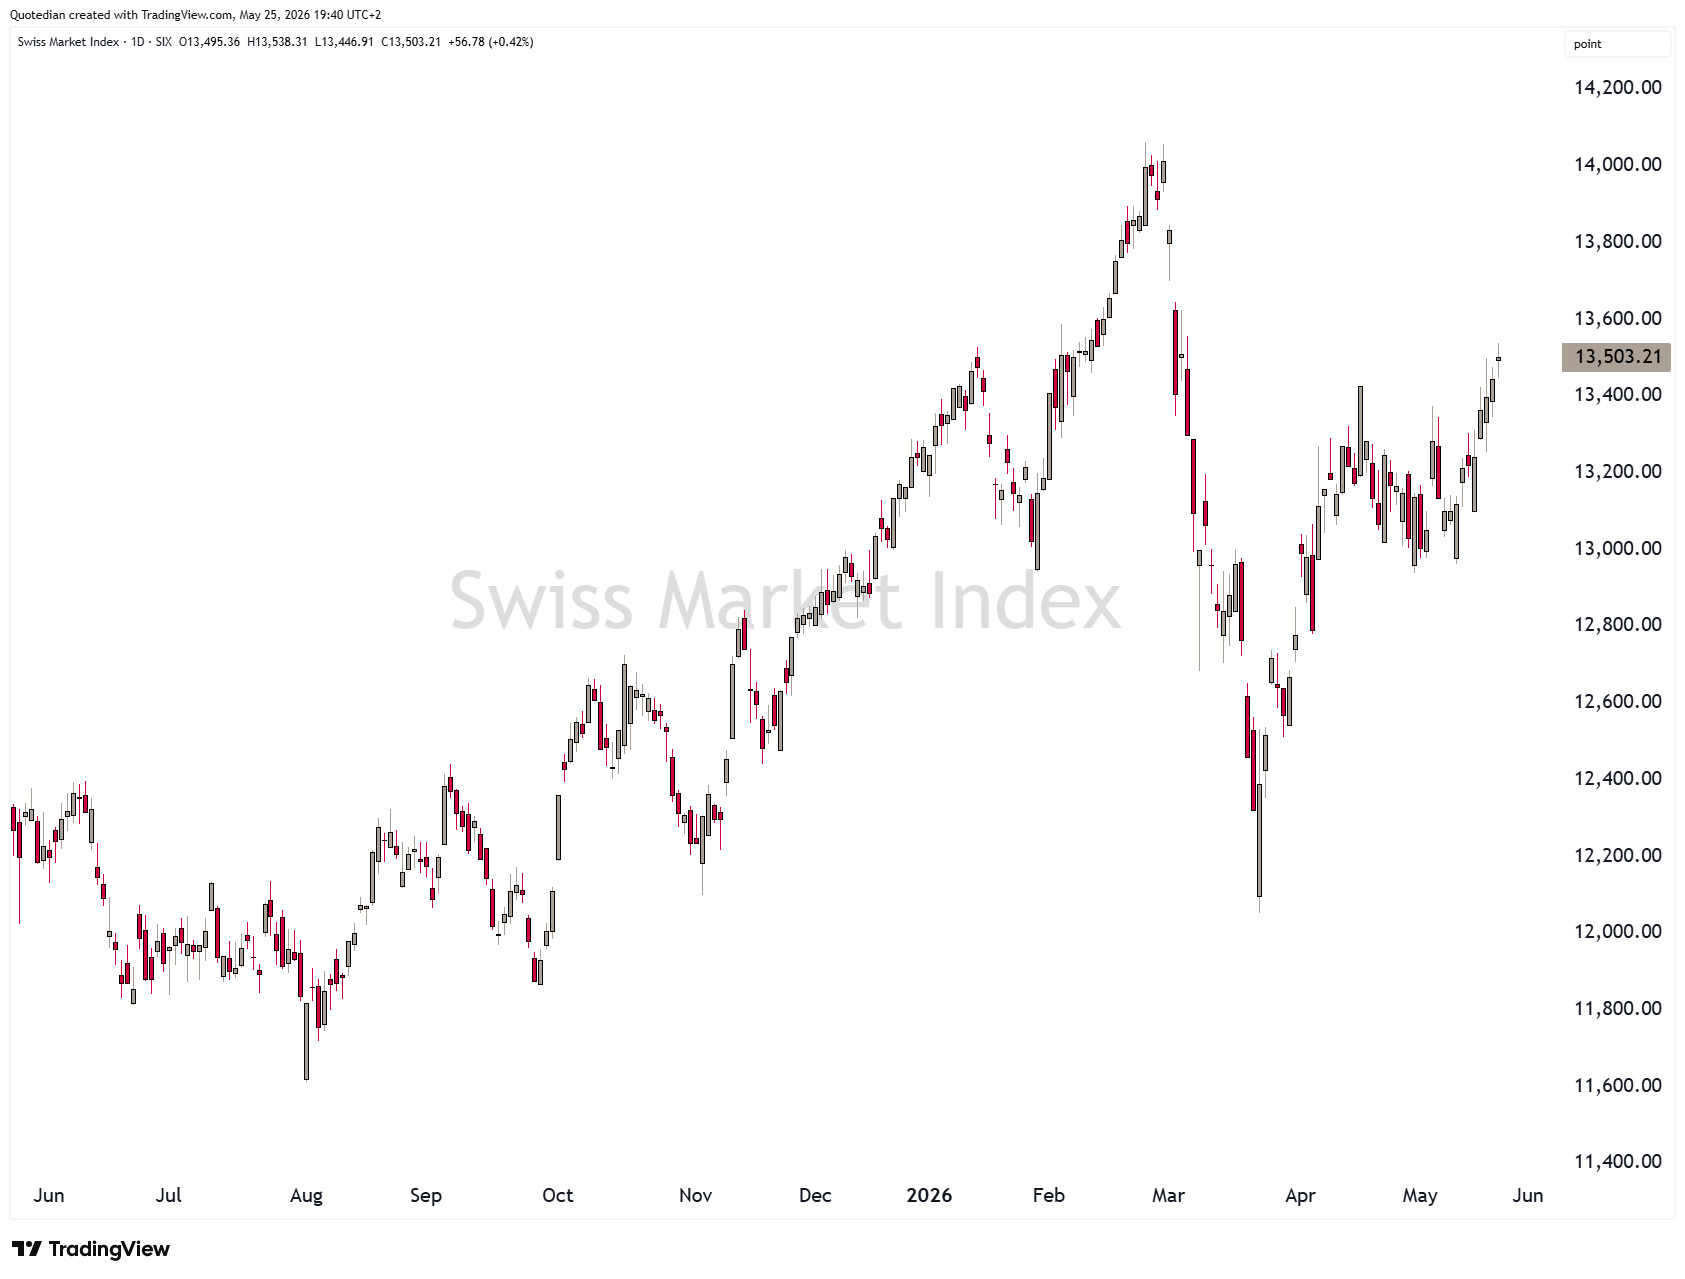
Even Switzerland’s SMI is showing signs of life again:
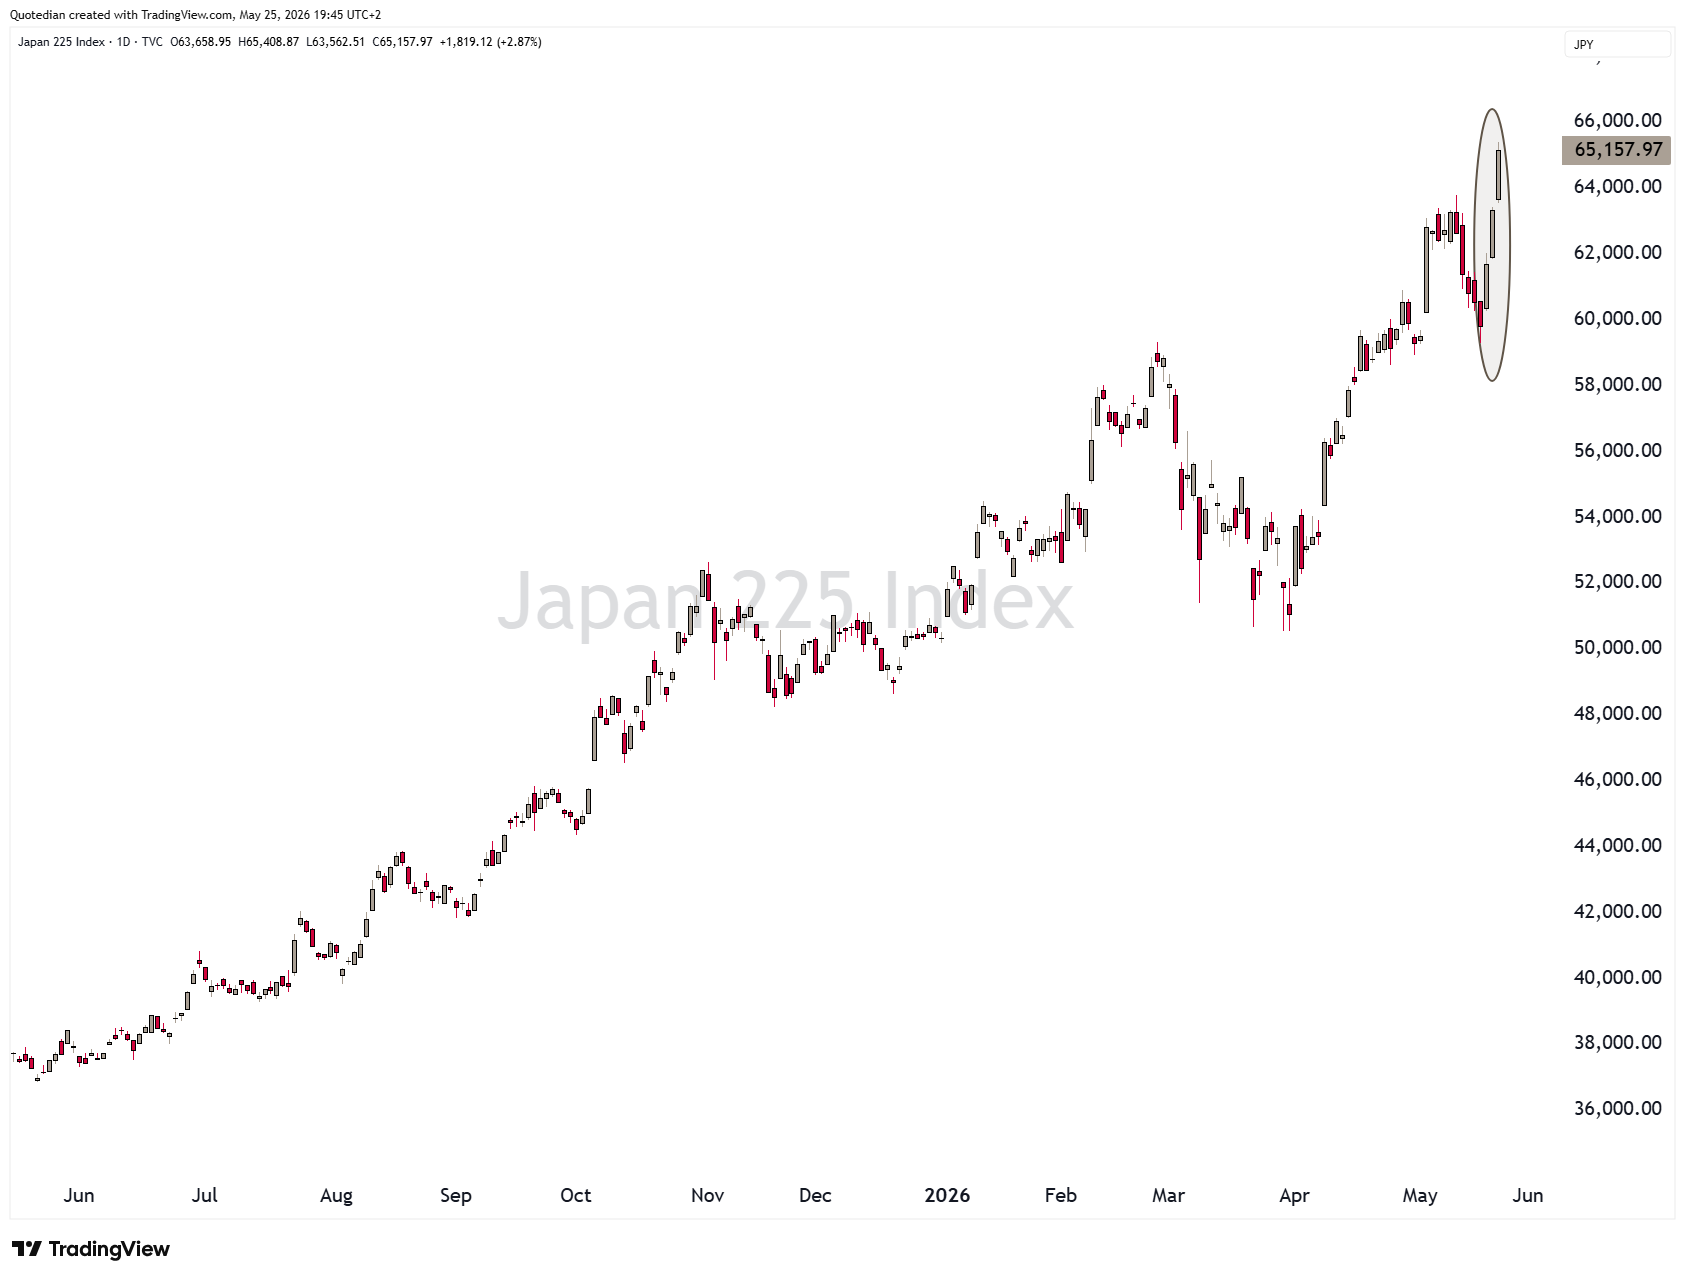
In Asia, Japan’s Nikkei is leaving everything else behind in the dust:
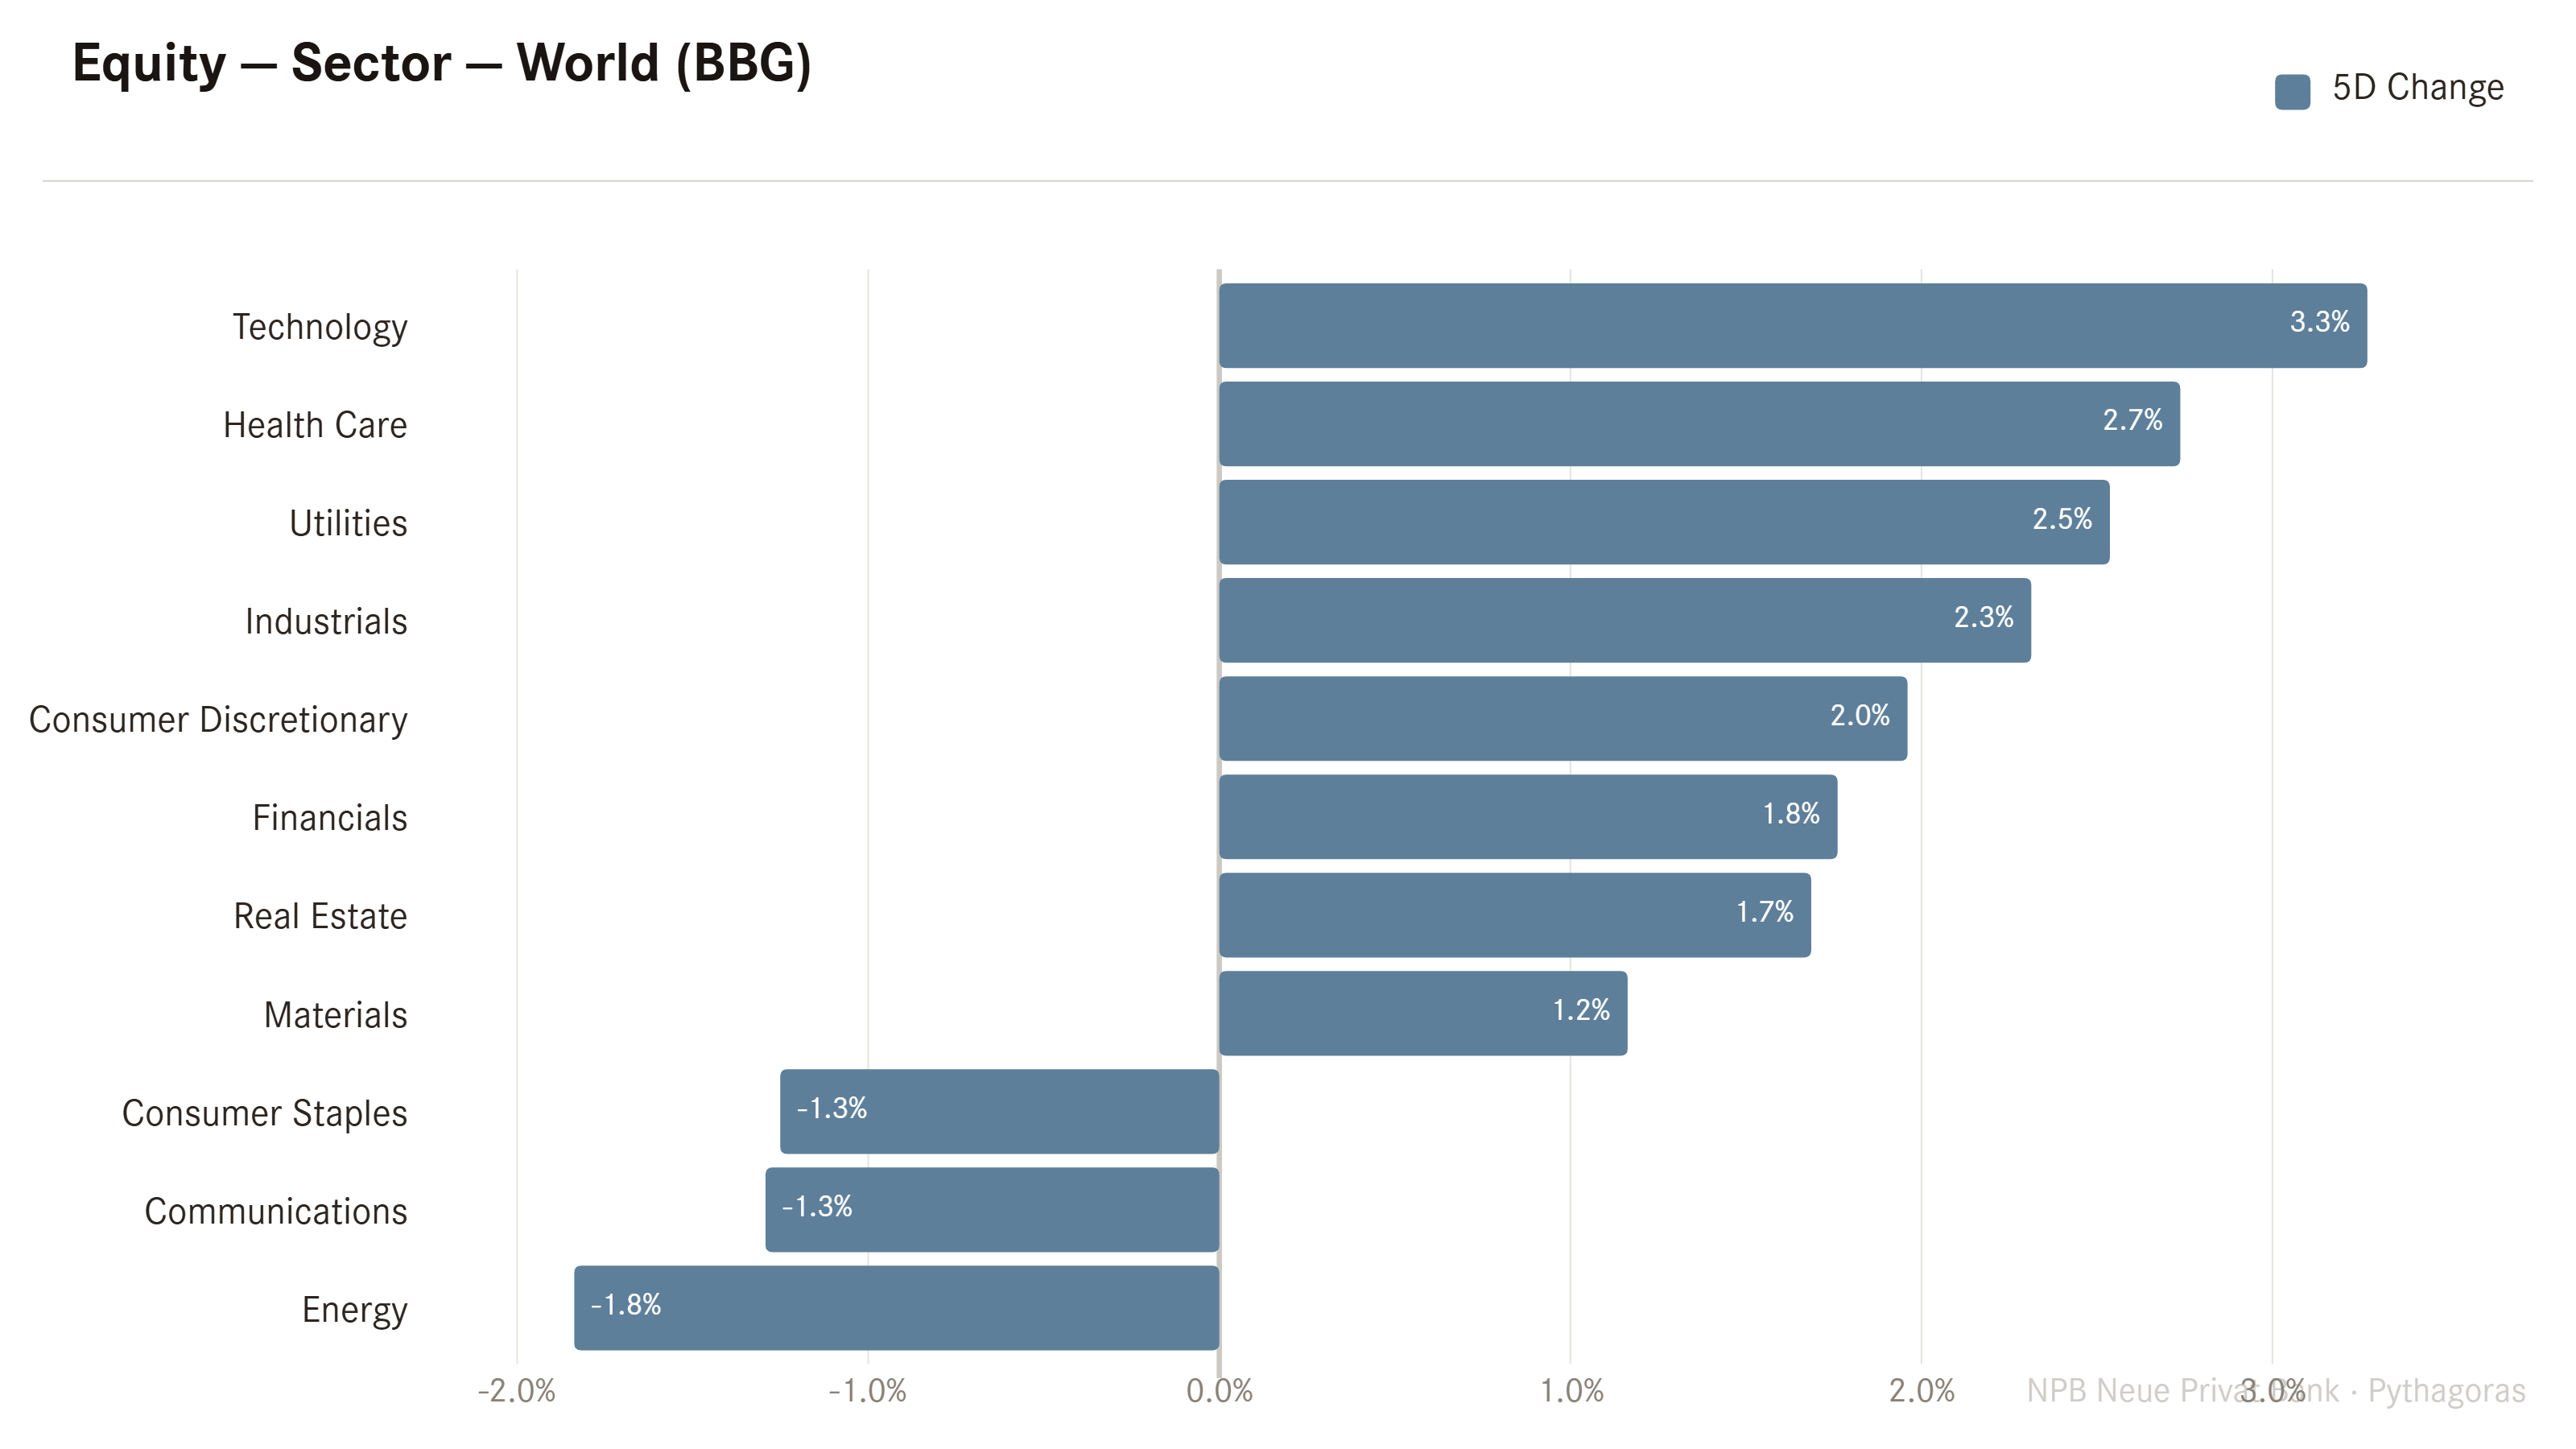
Sector performance-wise, technology stocks continued to dominate over the past few days, whilst energy-related stocks have been coming down on the back of lower oil and gas prices:
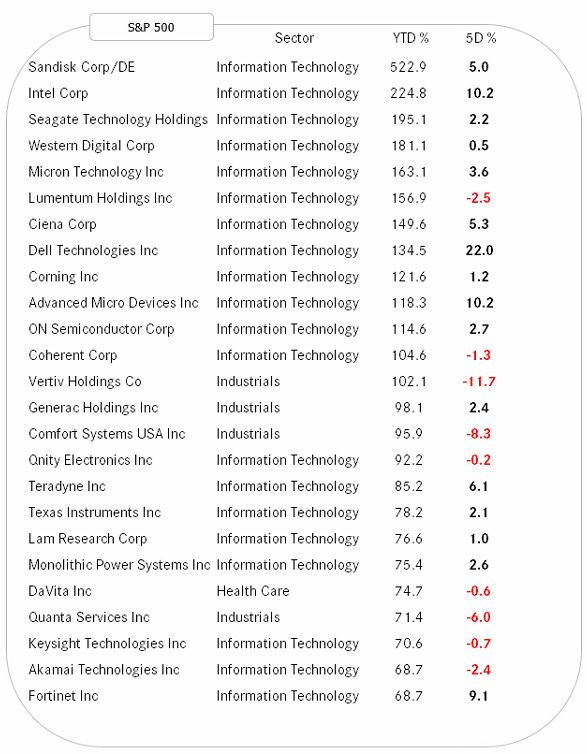
In our two (US & Europe) leaderboards of year-to-date performances, winners largely continue to be winners, or as I like to say: strength begets strength.
The US list shows many stocks building on their already hefty gains, with the exception of some of the AI infrastructure stocks (e.g. Vertiv, Quanta) which faced some profit taking:
European YTD champions also continued to push higher:
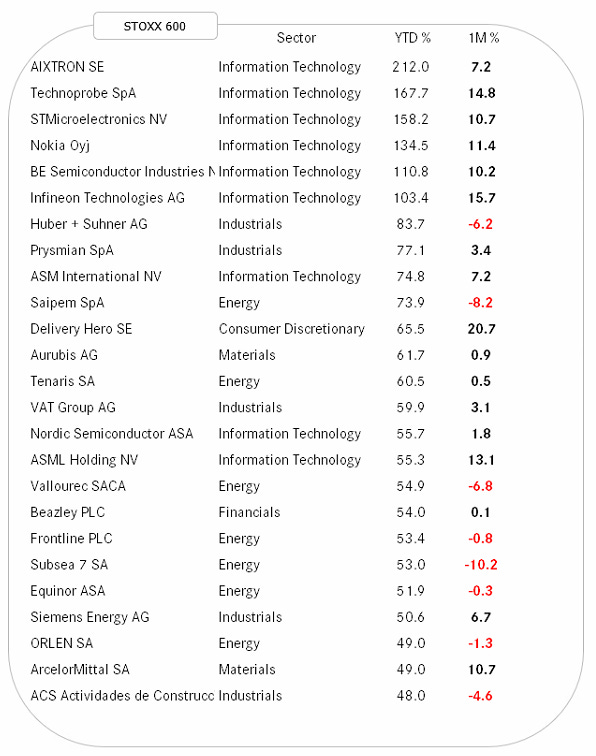
Looking at the European list a bit longer, older semesters such as me, which have the Dotcom scares to show we were there, will probably have tears in their eyes, seeing some of the old champions standing in the ring again.
Exhibit 1 - Nokia
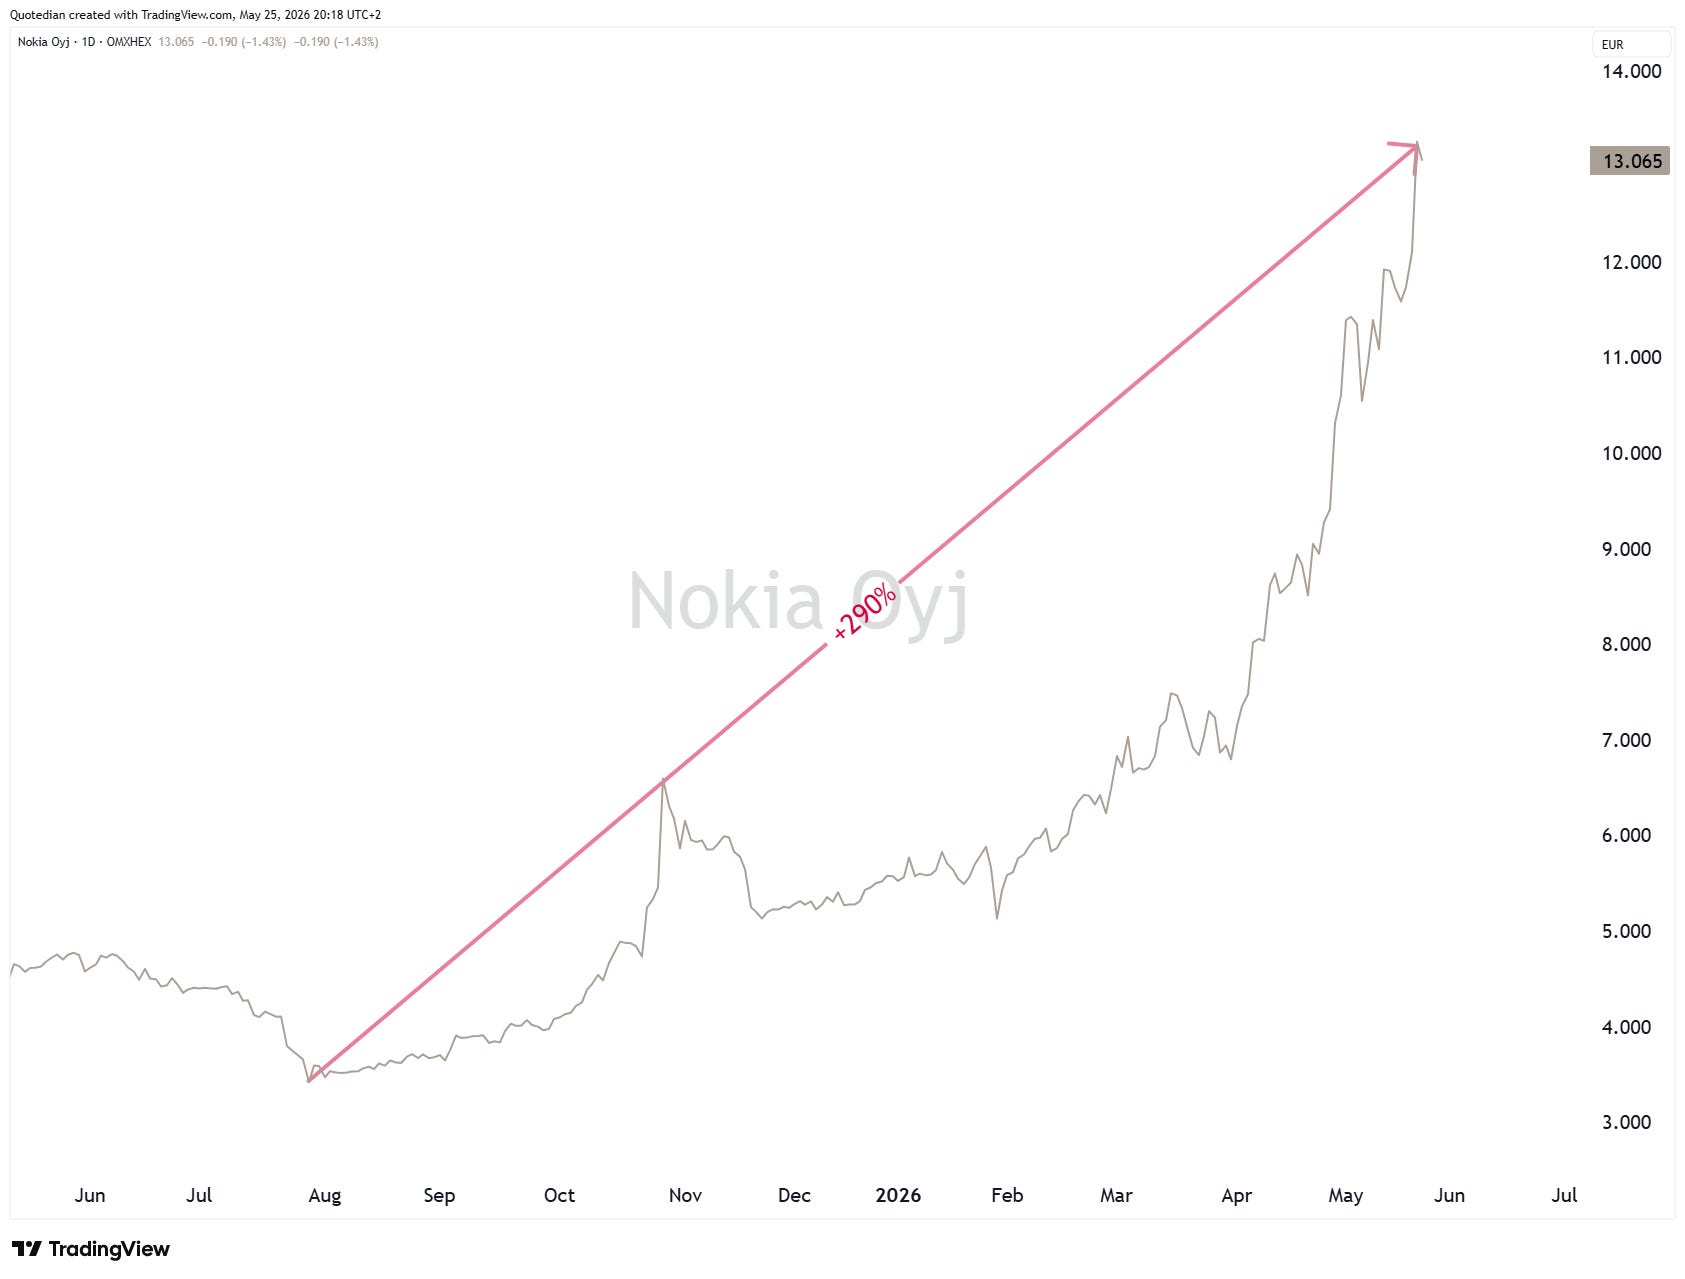
However, let’s contextualise this:
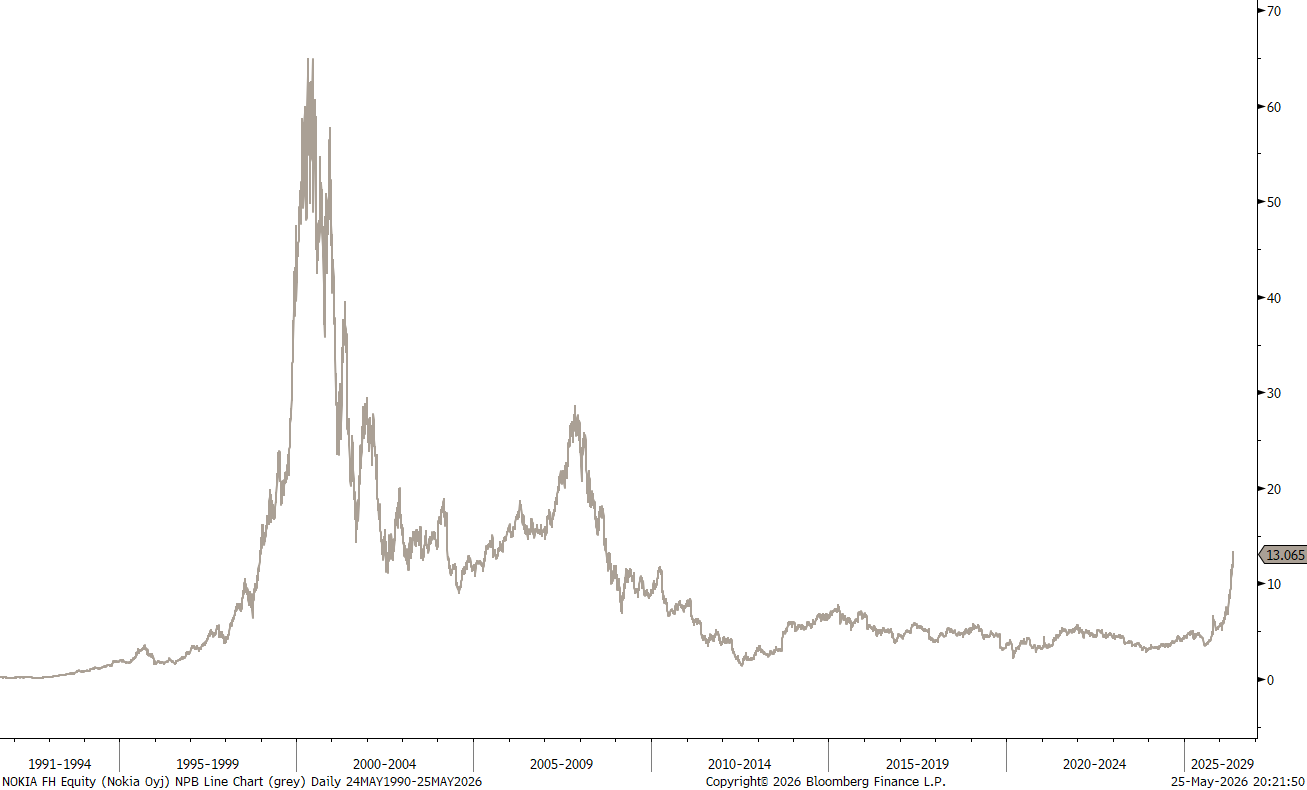
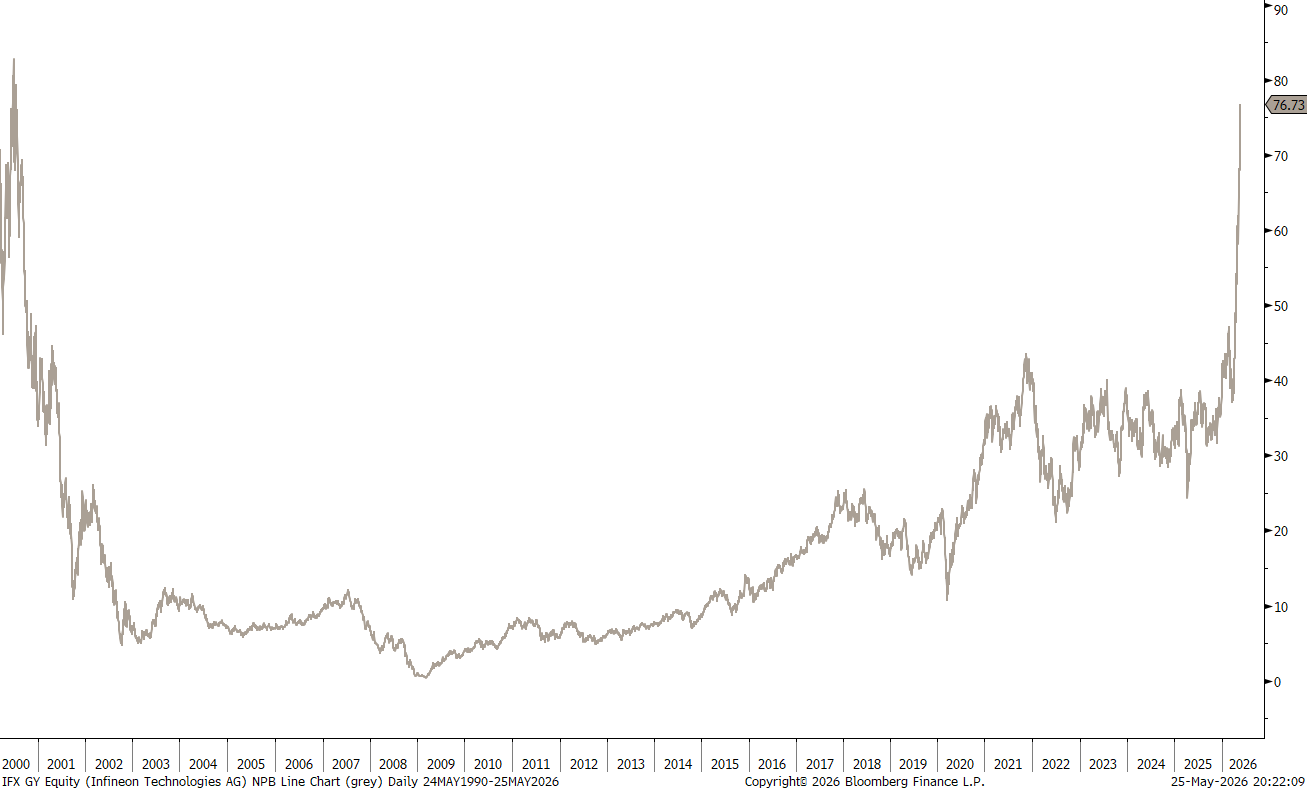
Exhibit 2 - Infineon:
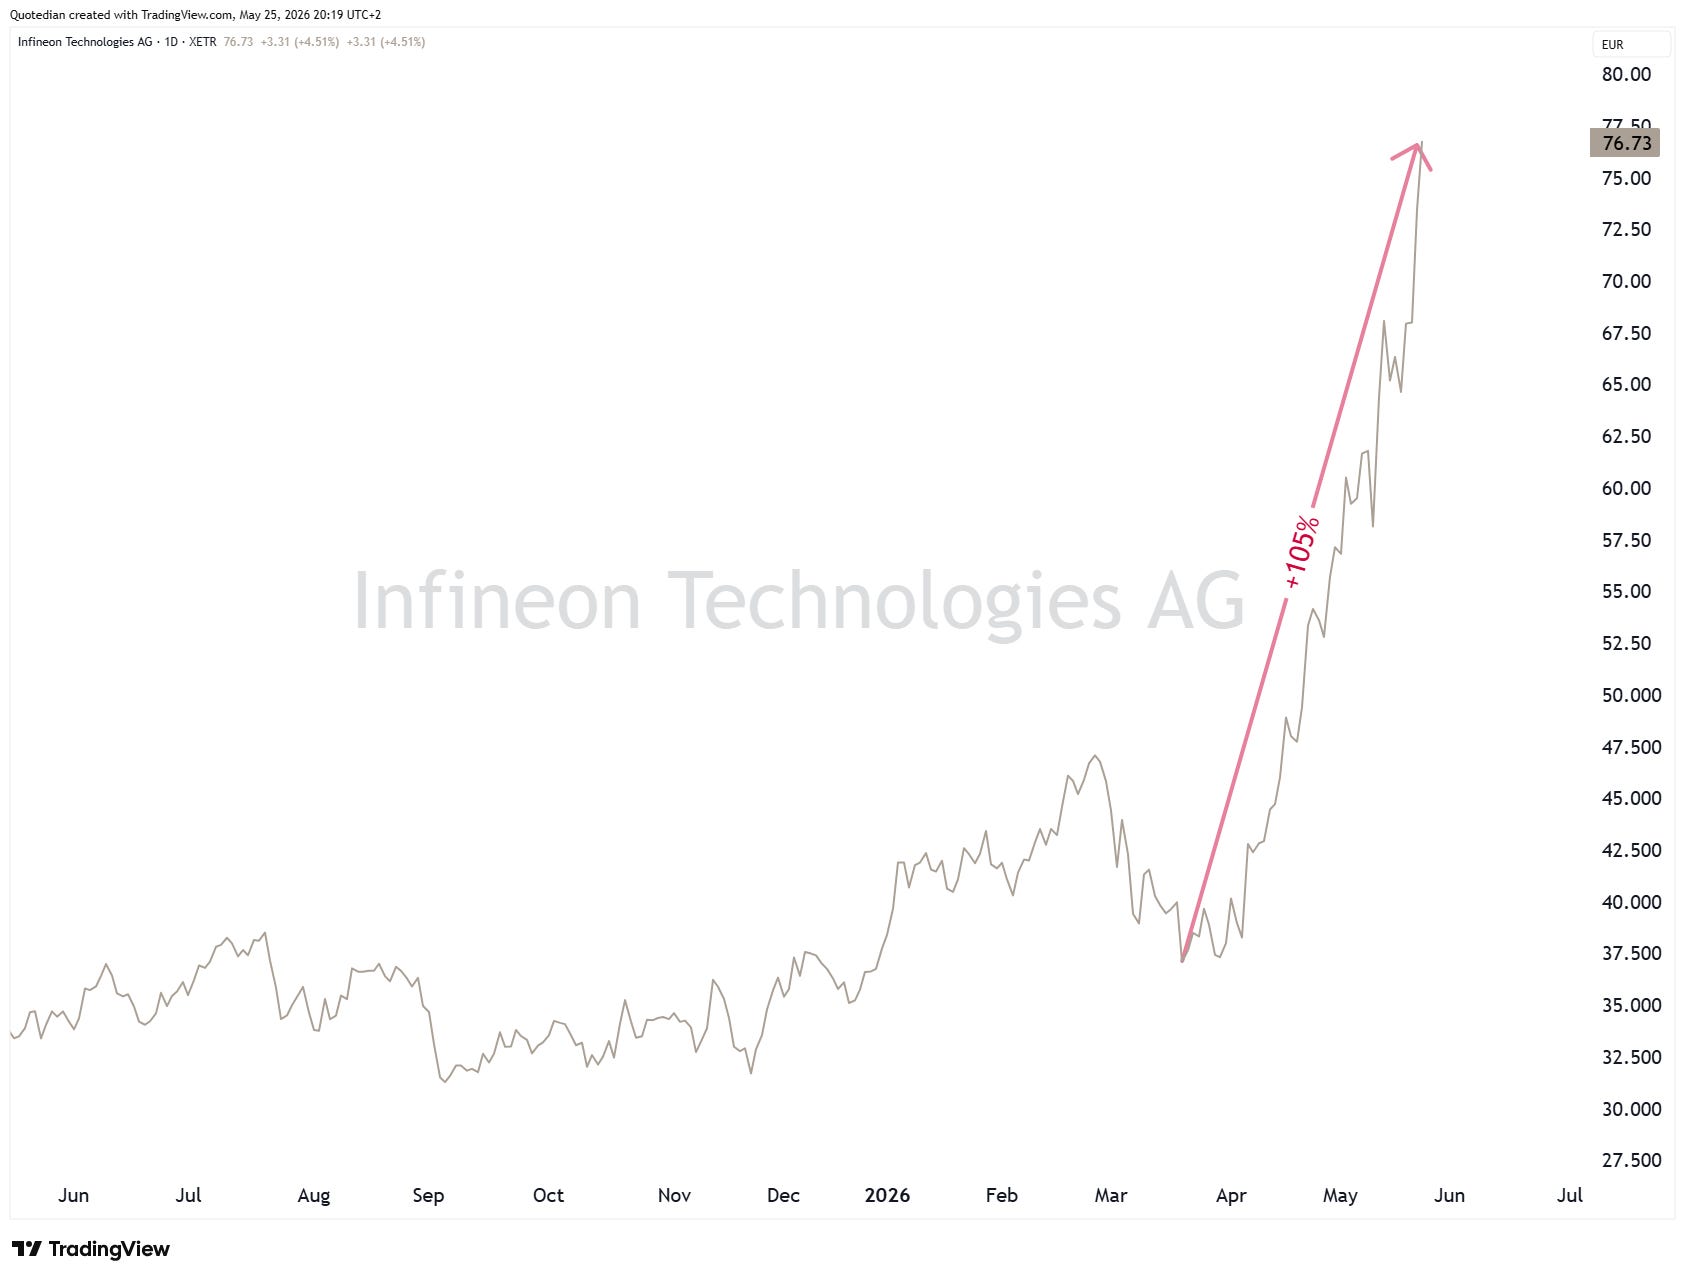
At least here we are break-even again if we bought at the top in 2000:
If you wait long enough, everything comes round. Even Rocky XXXVI …

One more on the story-telling equity side before we go over to the mafs-based fixed income part …
I already mentioned this in a late afternoon QuiCQ last Friday (click here), but in case you missed it, a short repeat:
Space stocks have been all the rage over the past twelve months - here we use an ETF as a proxy:
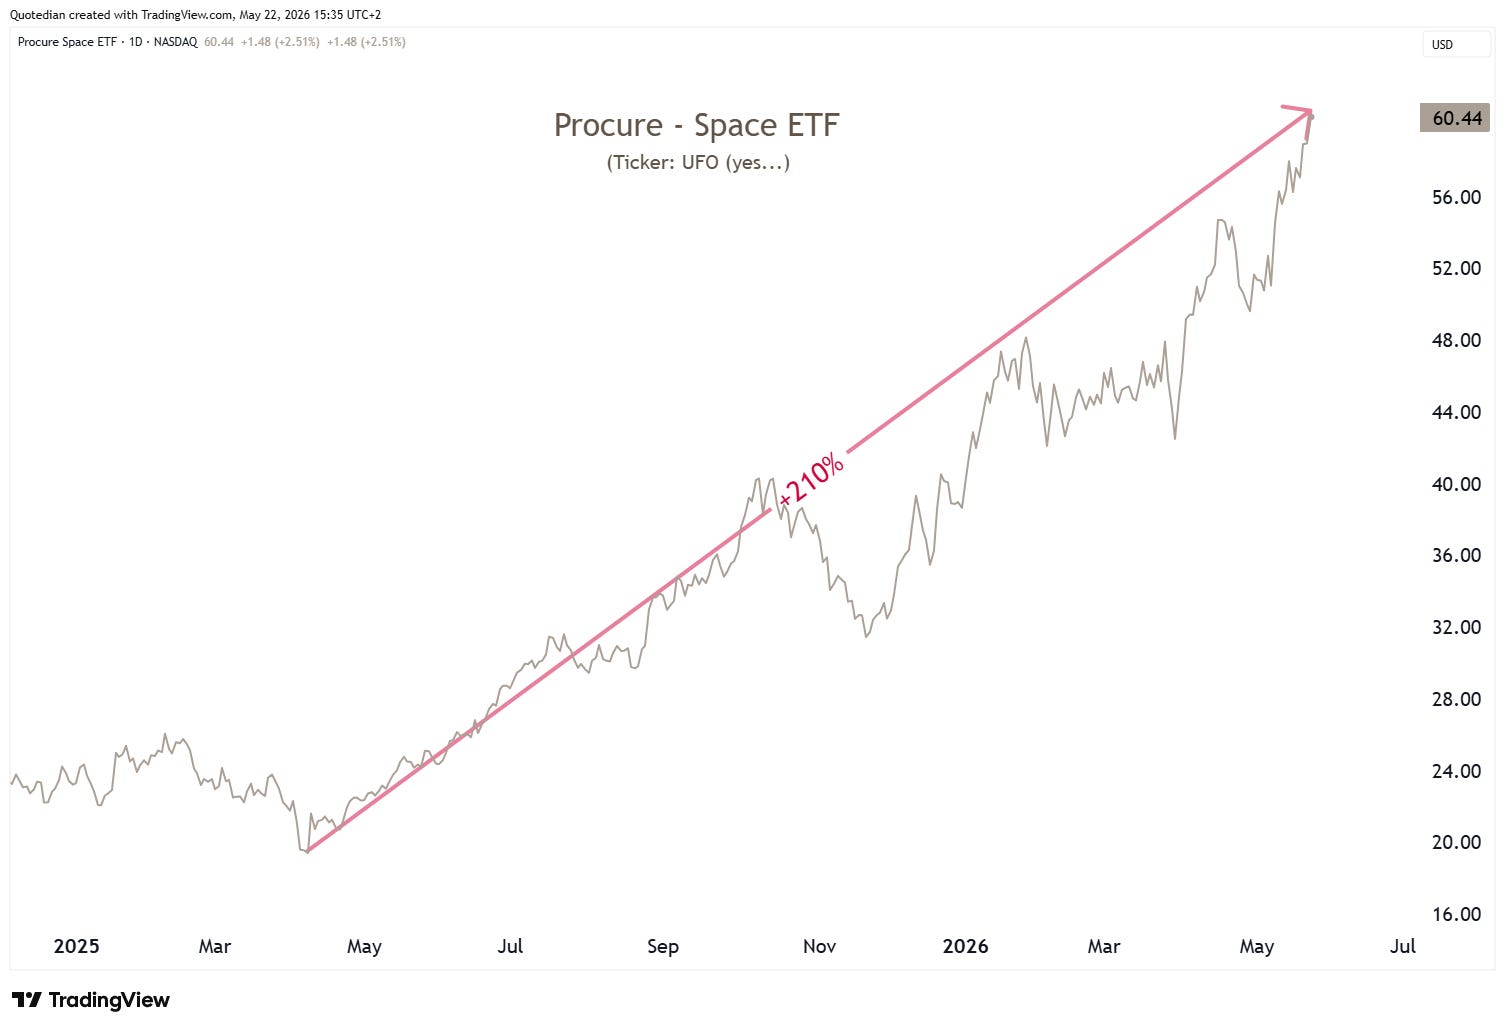
As I mentioned in that Friday post, in past bubbles rallies, it was a reliable “the top is near” indicator when suddenly everybody started talking about space-related equity investments - like, the craze of all madness, if you know what I mean.
However, this time I was ready to pronounce the four most expensive words in investing (This Time It’s Different), as, after all, we have that SpaceX IPO and AI-datacenters in space and all that stuff.
However, just as I was going to pronounce those fatal words,

The Economist came to save me and jinxed it all with their famous contrarian magazine cover:
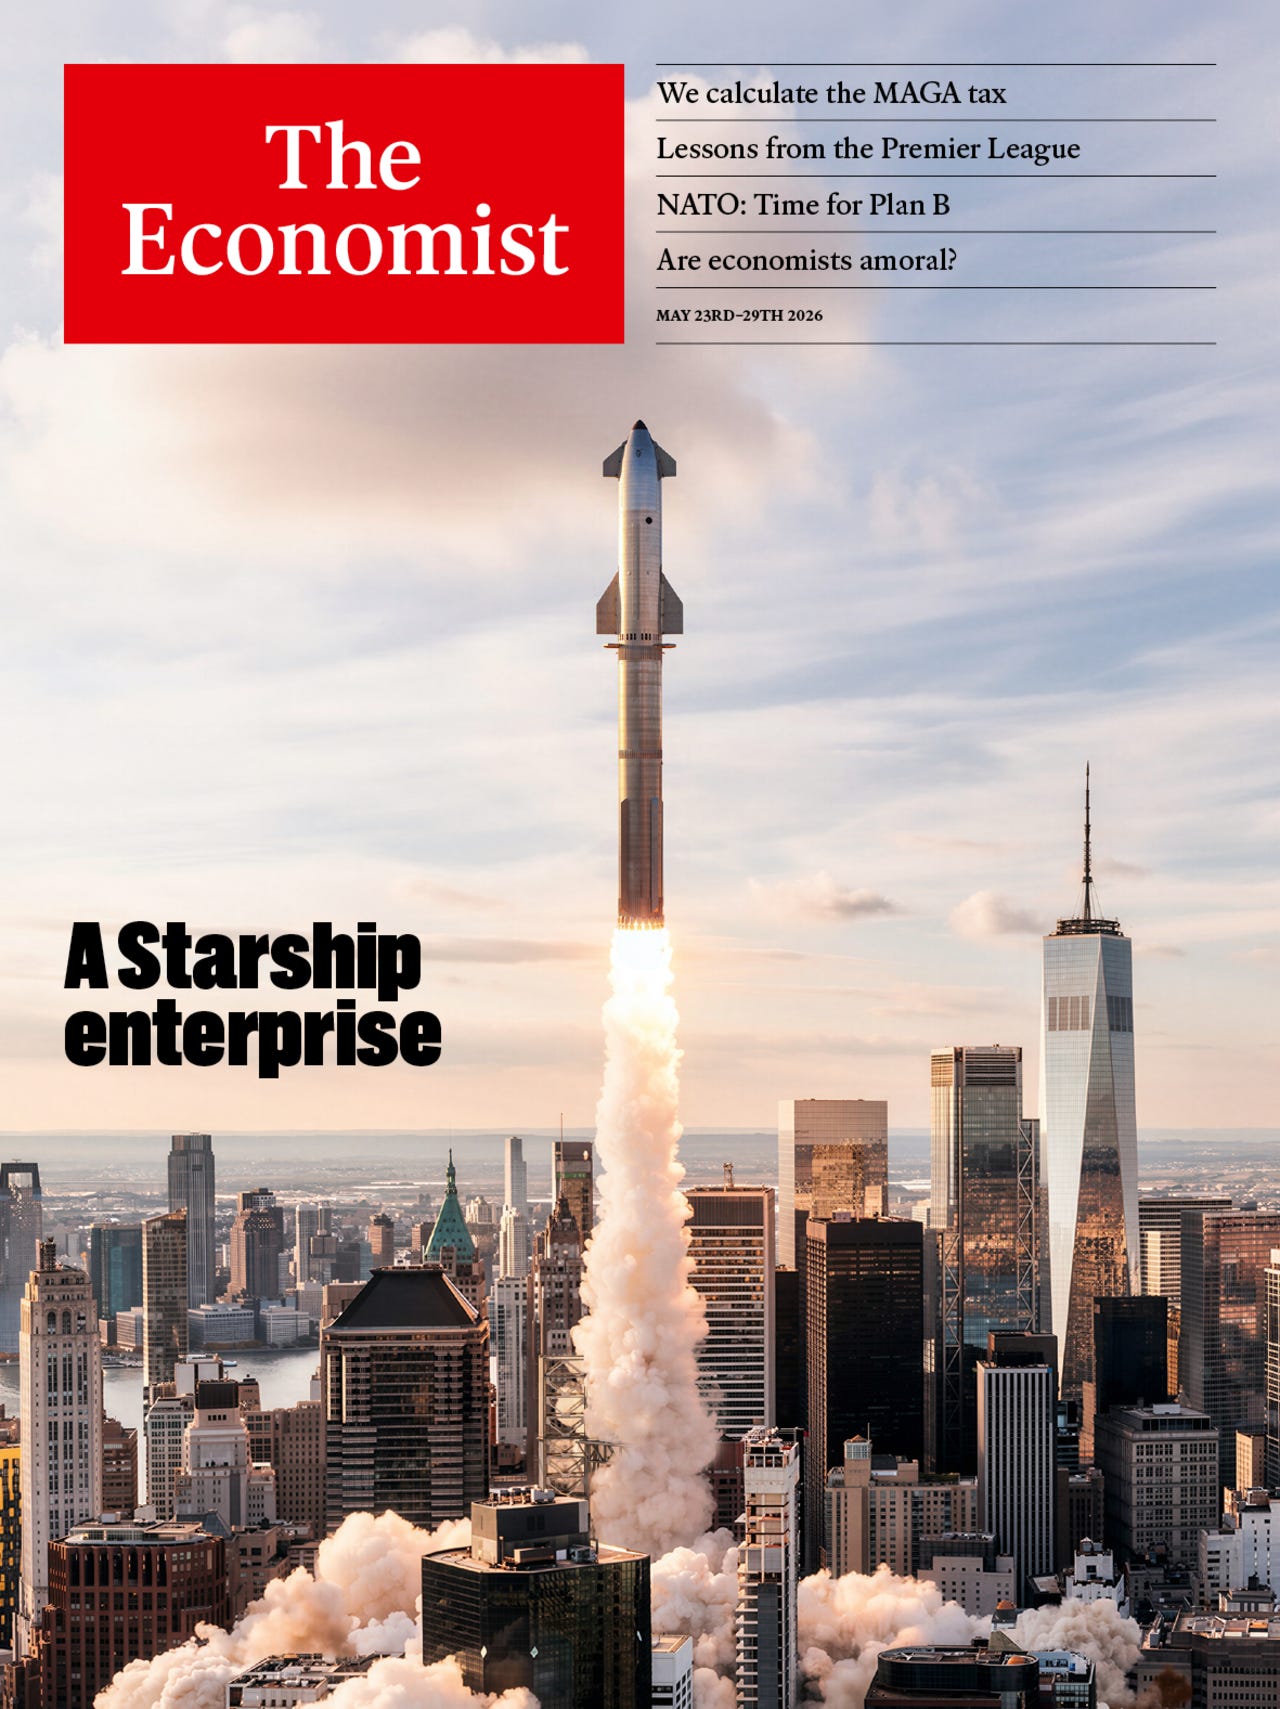
All bets on space are …. OFFFF!
And speaking of SpaceX, with the market cap estimate for the IPO at USD1.75 trillion and revenues (read: revenues, not profit) of USD19 billion, we get a price-to-sales ratio of approximately 100x.
Difficult not to find anything cheaper than that …
Anyway, let’s use another equity sector to hurl us into the bond section of this week’s letter…
The Energy sector (XLE) versus 20+ Year T-Bonds (TLT) has broken out to new all-time highs, whereas historically, that ratio has moved closely with the U.S. 30-year yield:
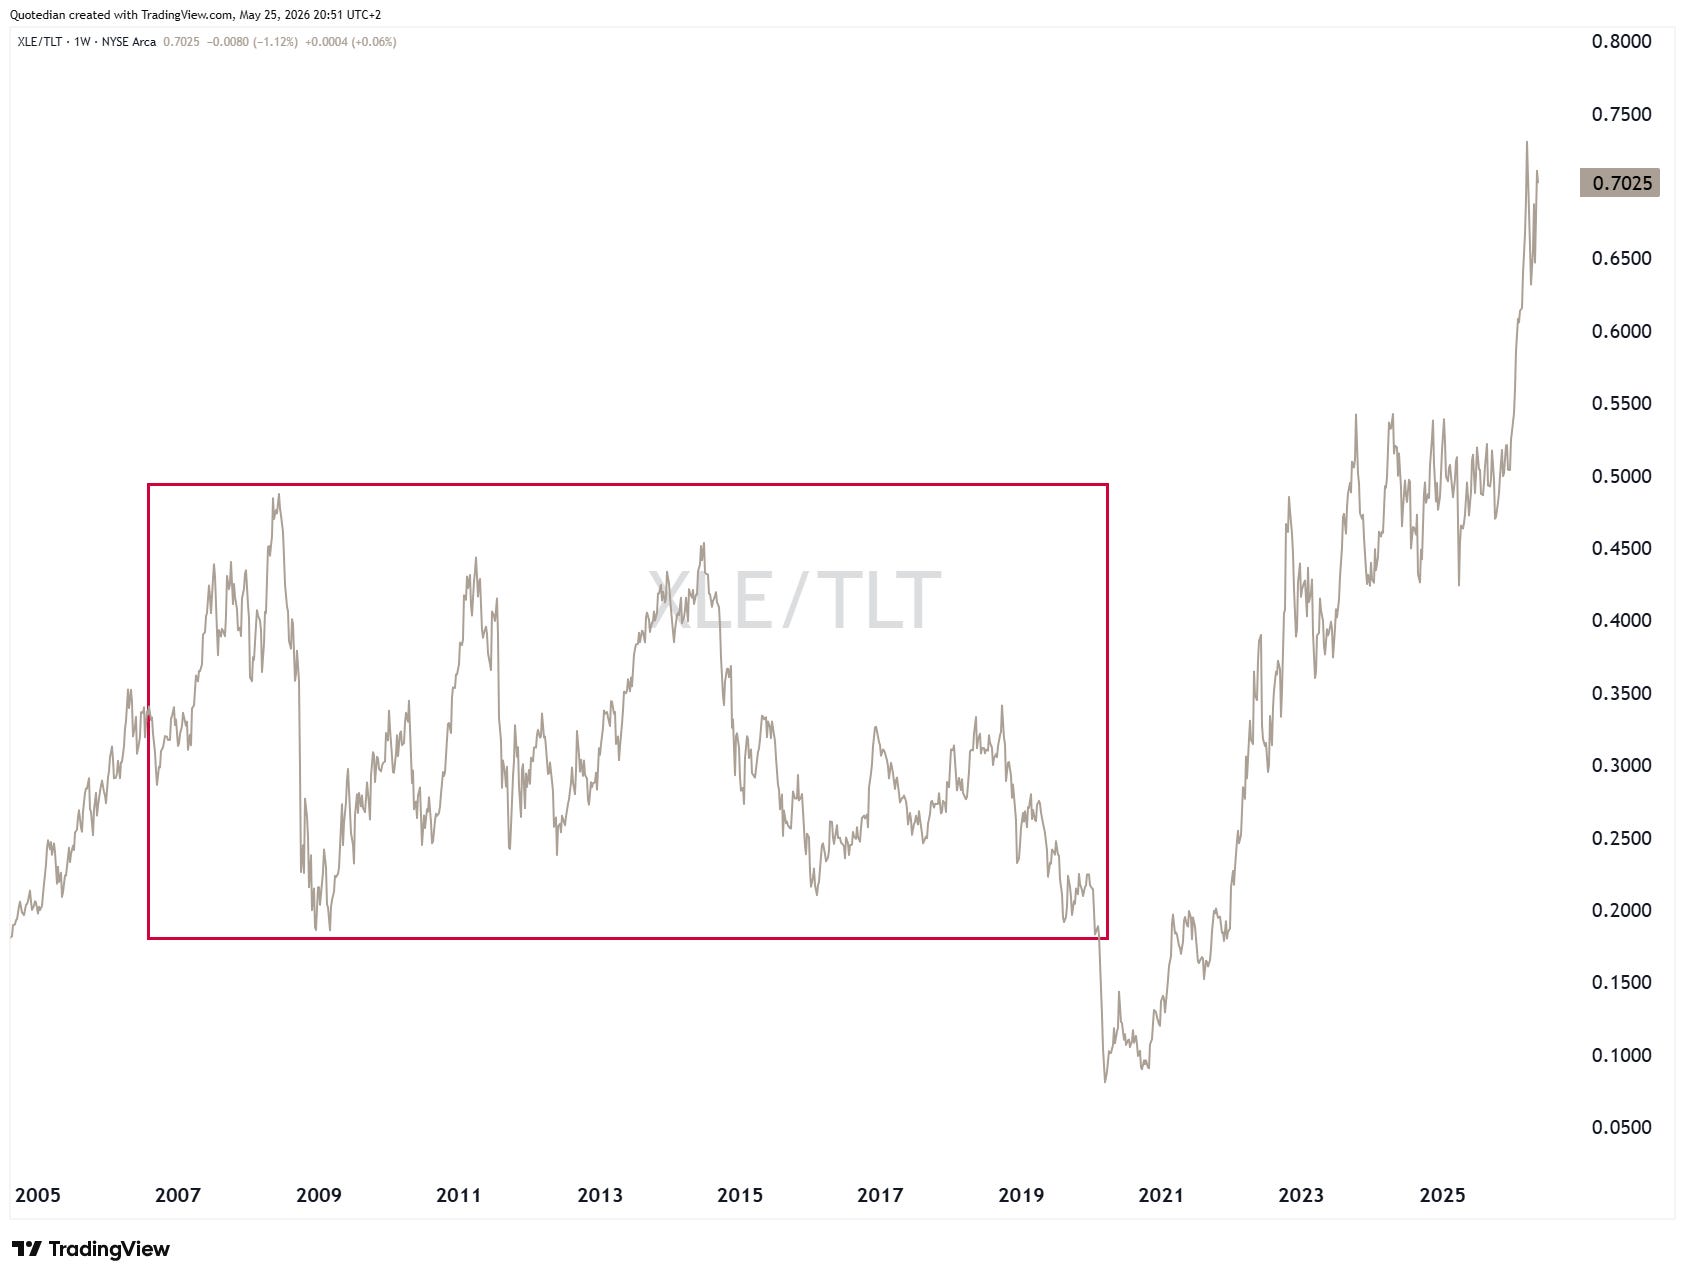
When energy stocks outperform long bonds, capital is moving toward real assets, inflationary cash flows, and companies tied to the physical economy.
At the same time, it’s moving away from duration in the bond market.
If this relationship holds, buying energy stocks may remain one of the best ways to express a bearish view on bonds – without touching the bond market at all.
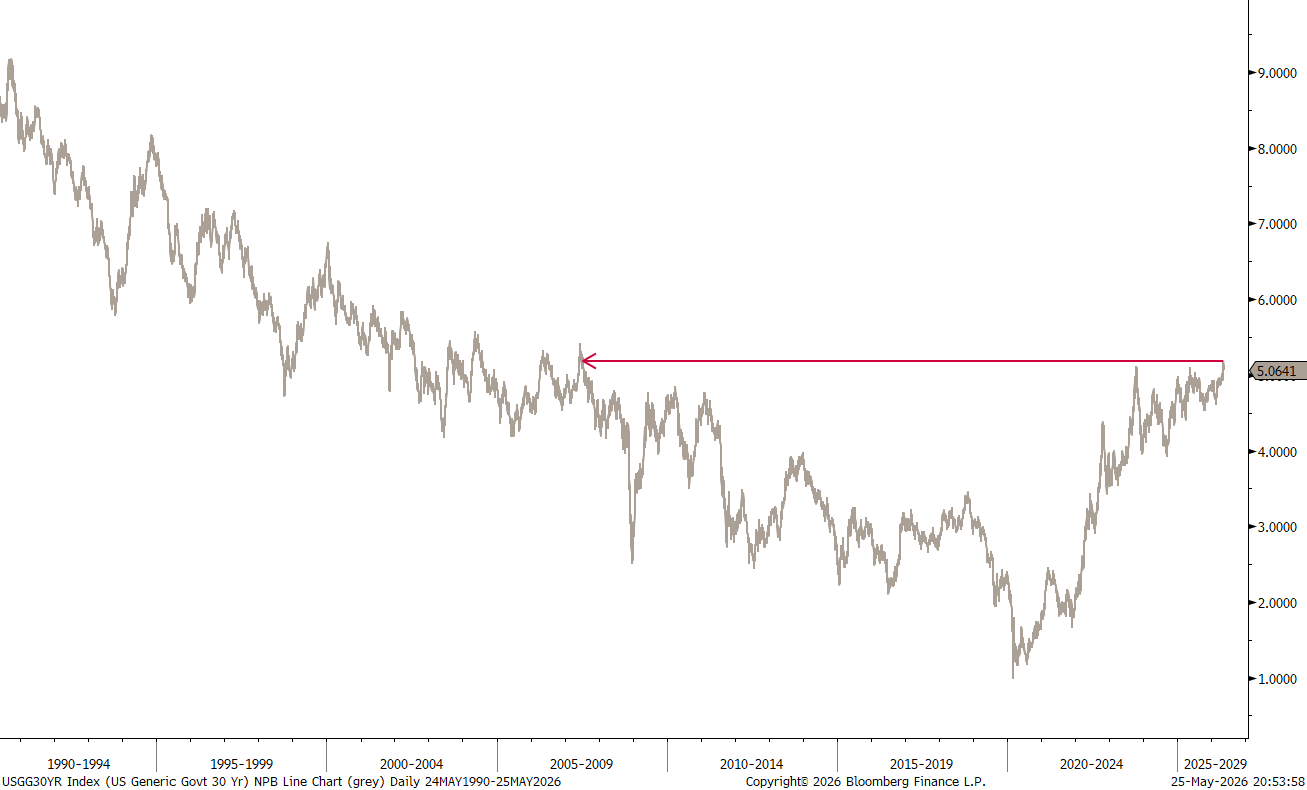
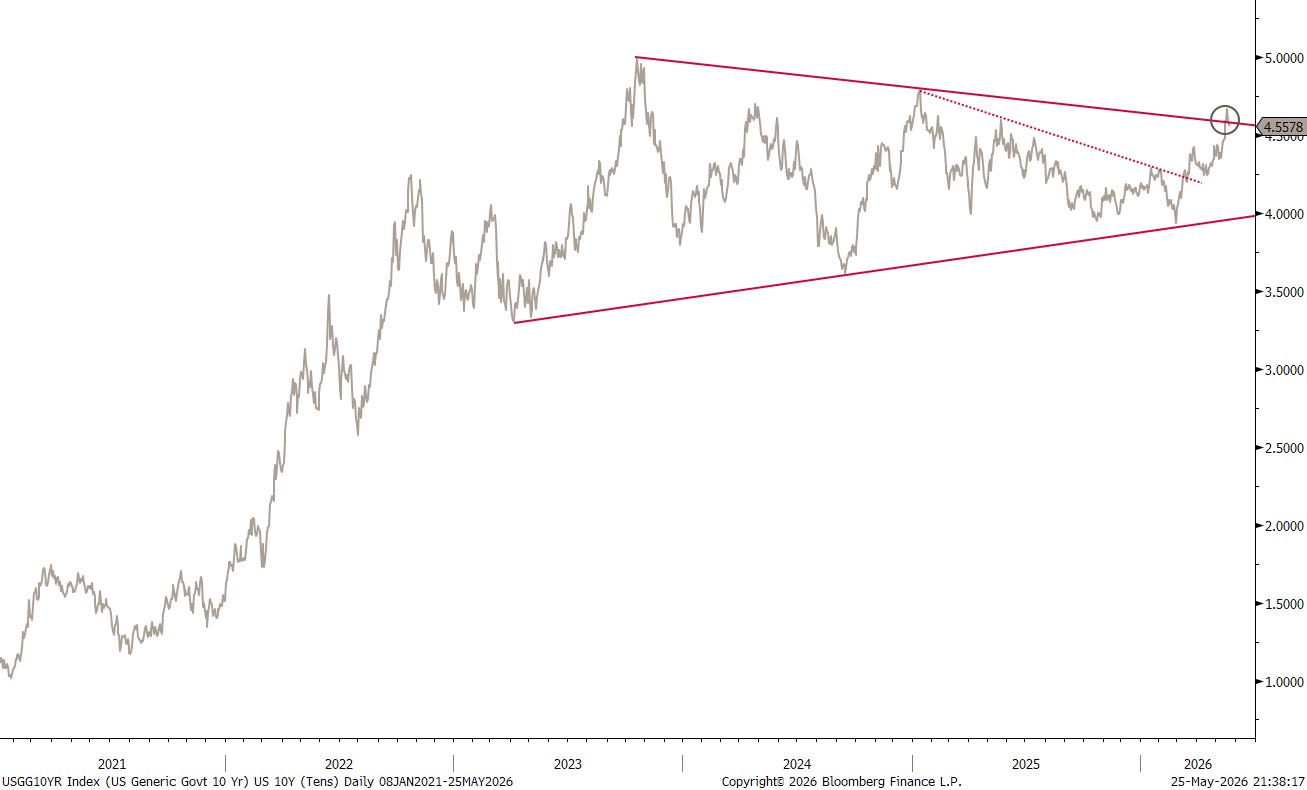
In any case, the US 30-year Treasury yields last week reached its highest since Q2/2007, which was before the GFC unraveled:
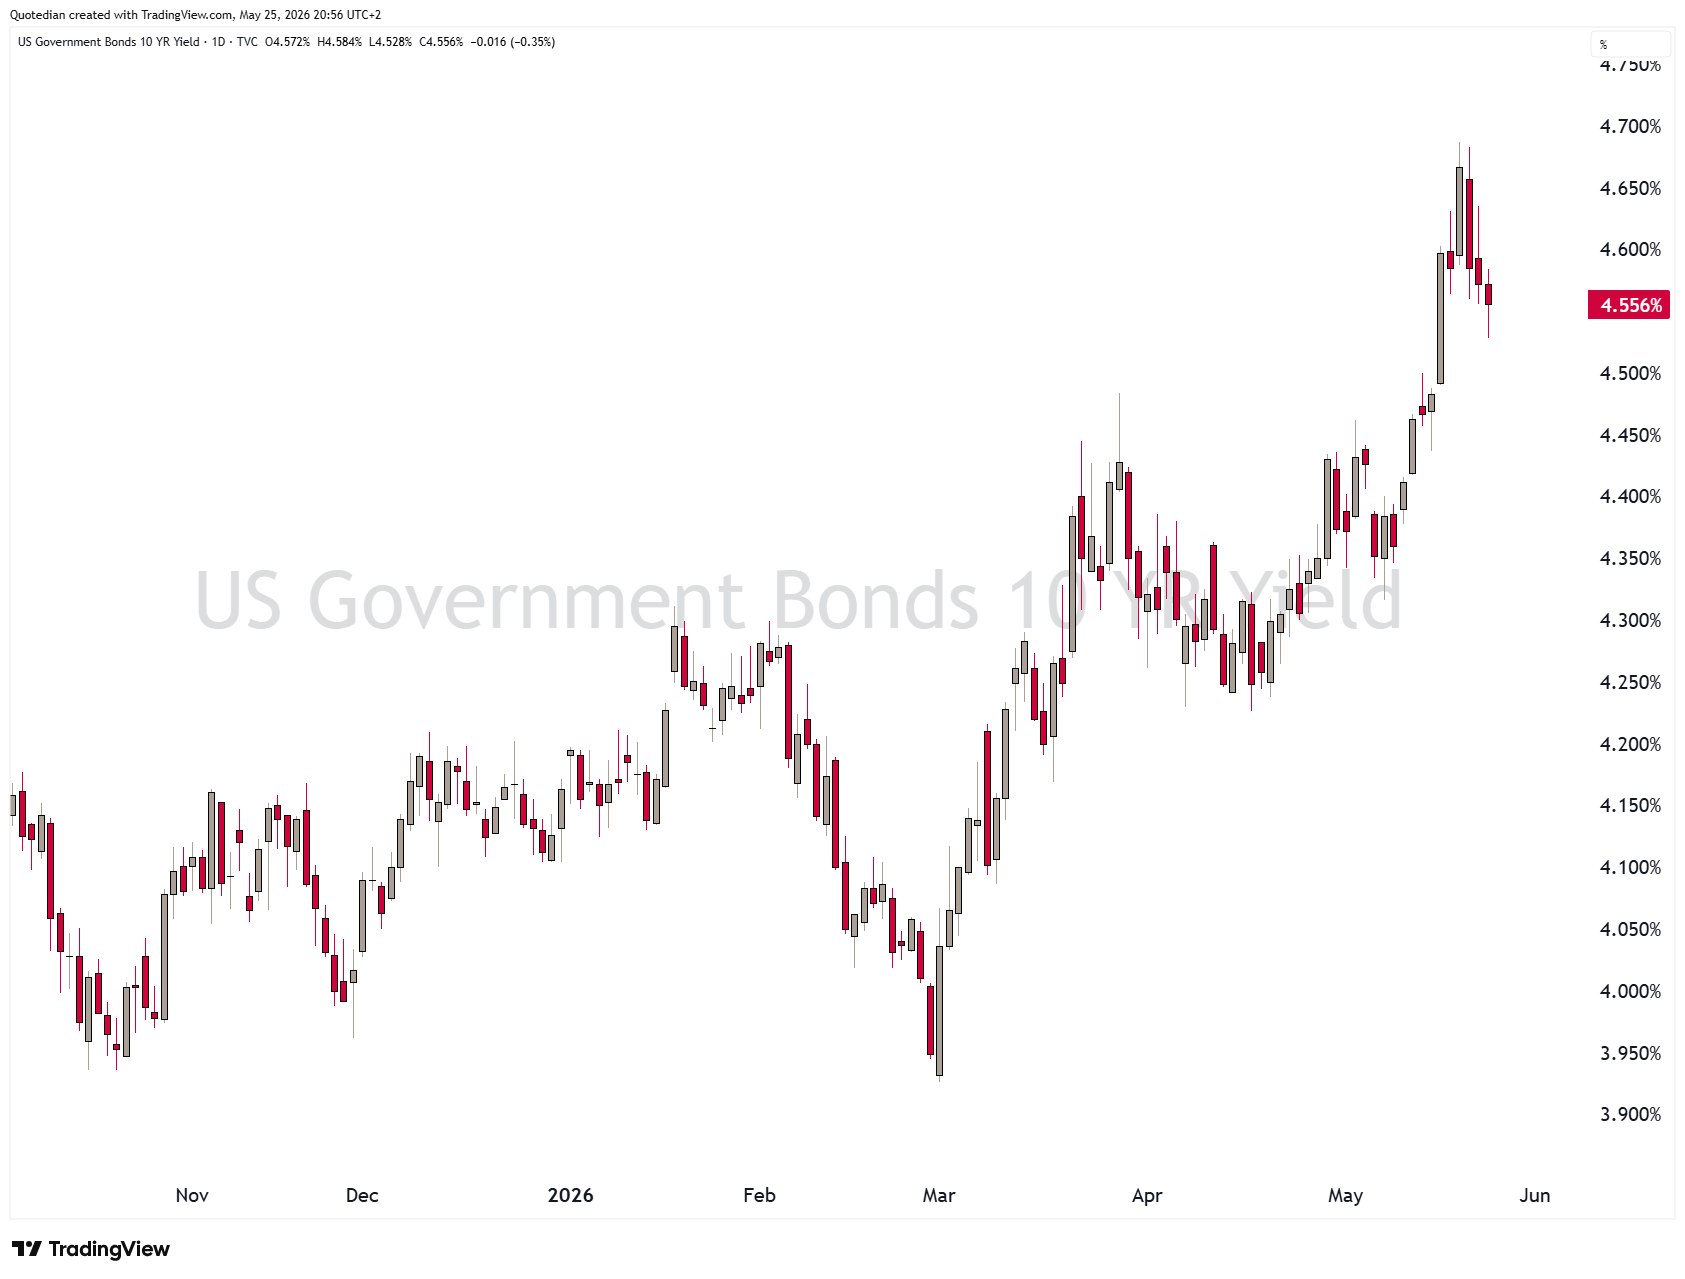
In the meantime, yields have come down a tad (below the 10-year treasury yield chart), but overall the pressure seems to remain to the upside:
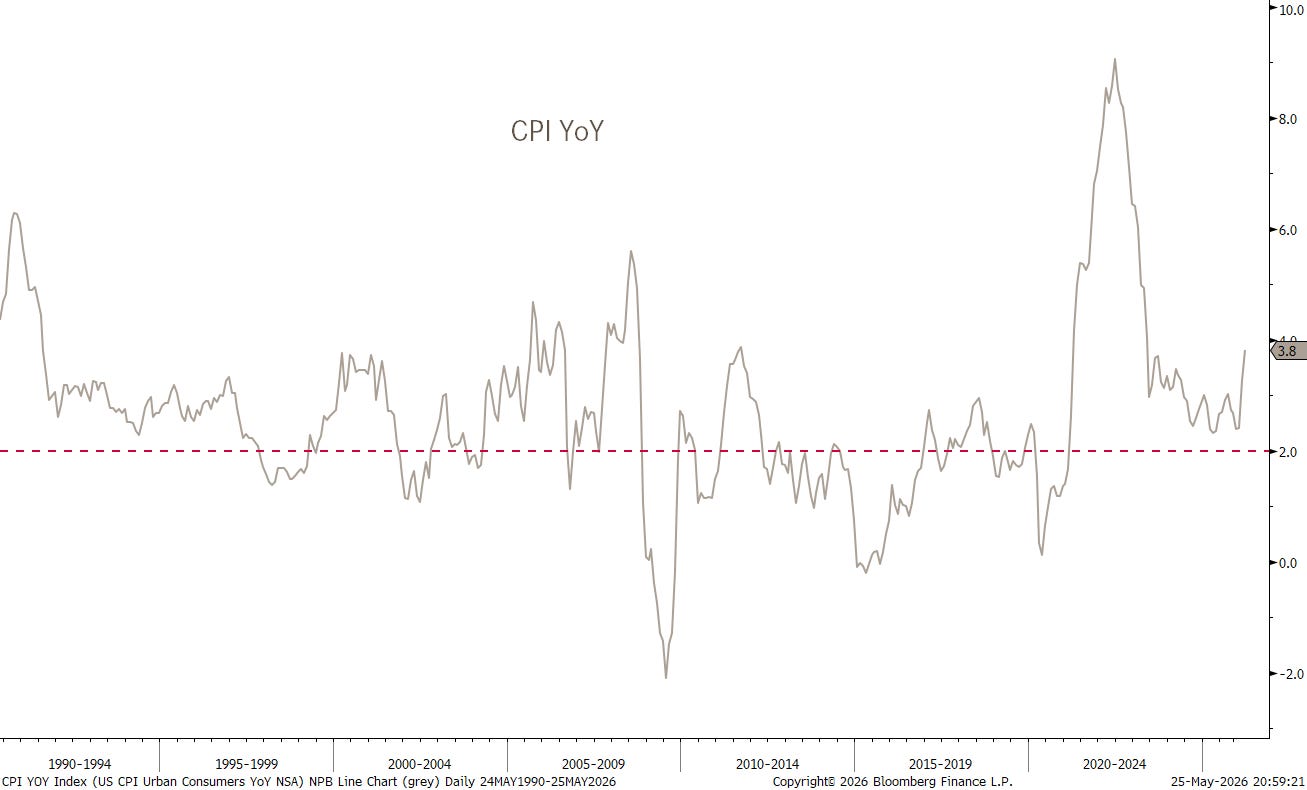
This is of course not only an inflation story, albeit the Fed has lost a lot of credibility, with inflation above its self-proclaimed two percent target rate for 64 months now:
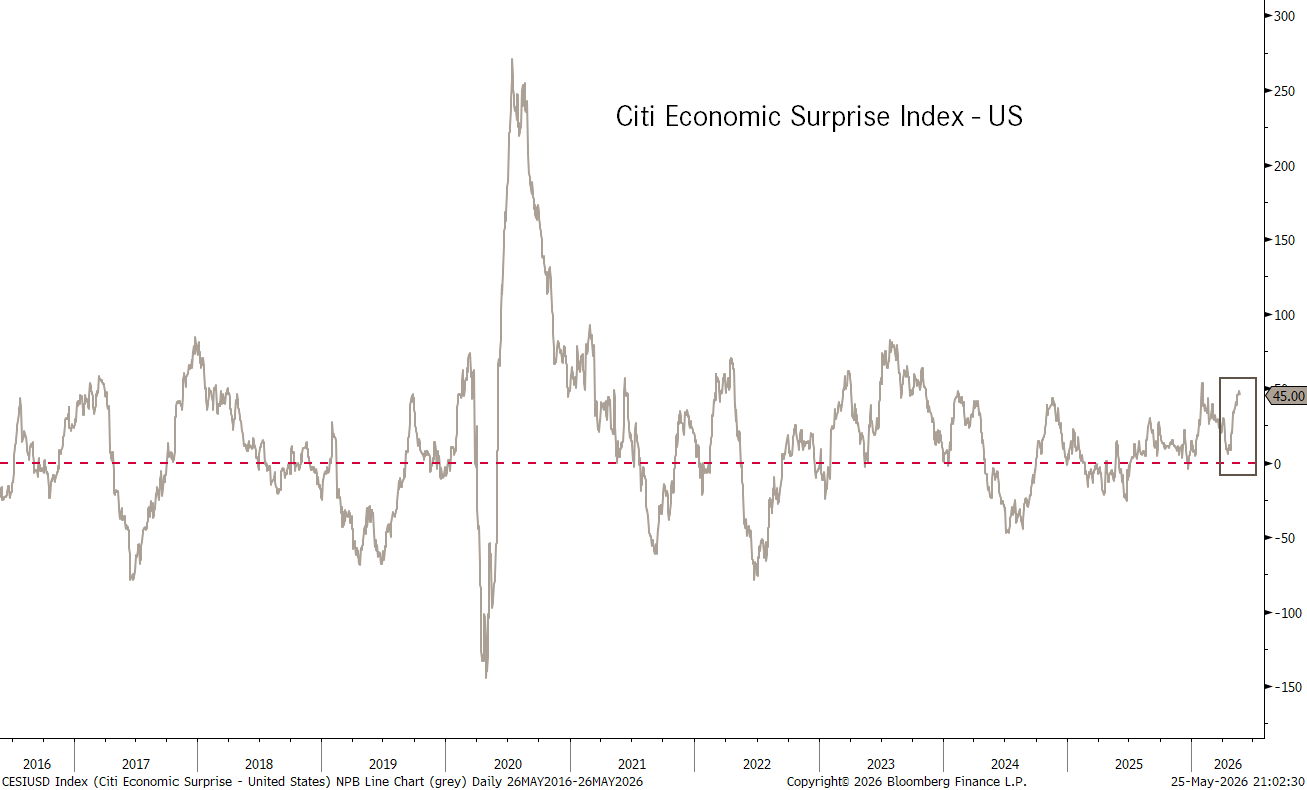
Economic growth in the US is probably stronger than suspected, a possibility we already highlighted in our 2026 outlook in the very early days of January. The Citigroup Economic Surprise index has been stampeding higher recently:
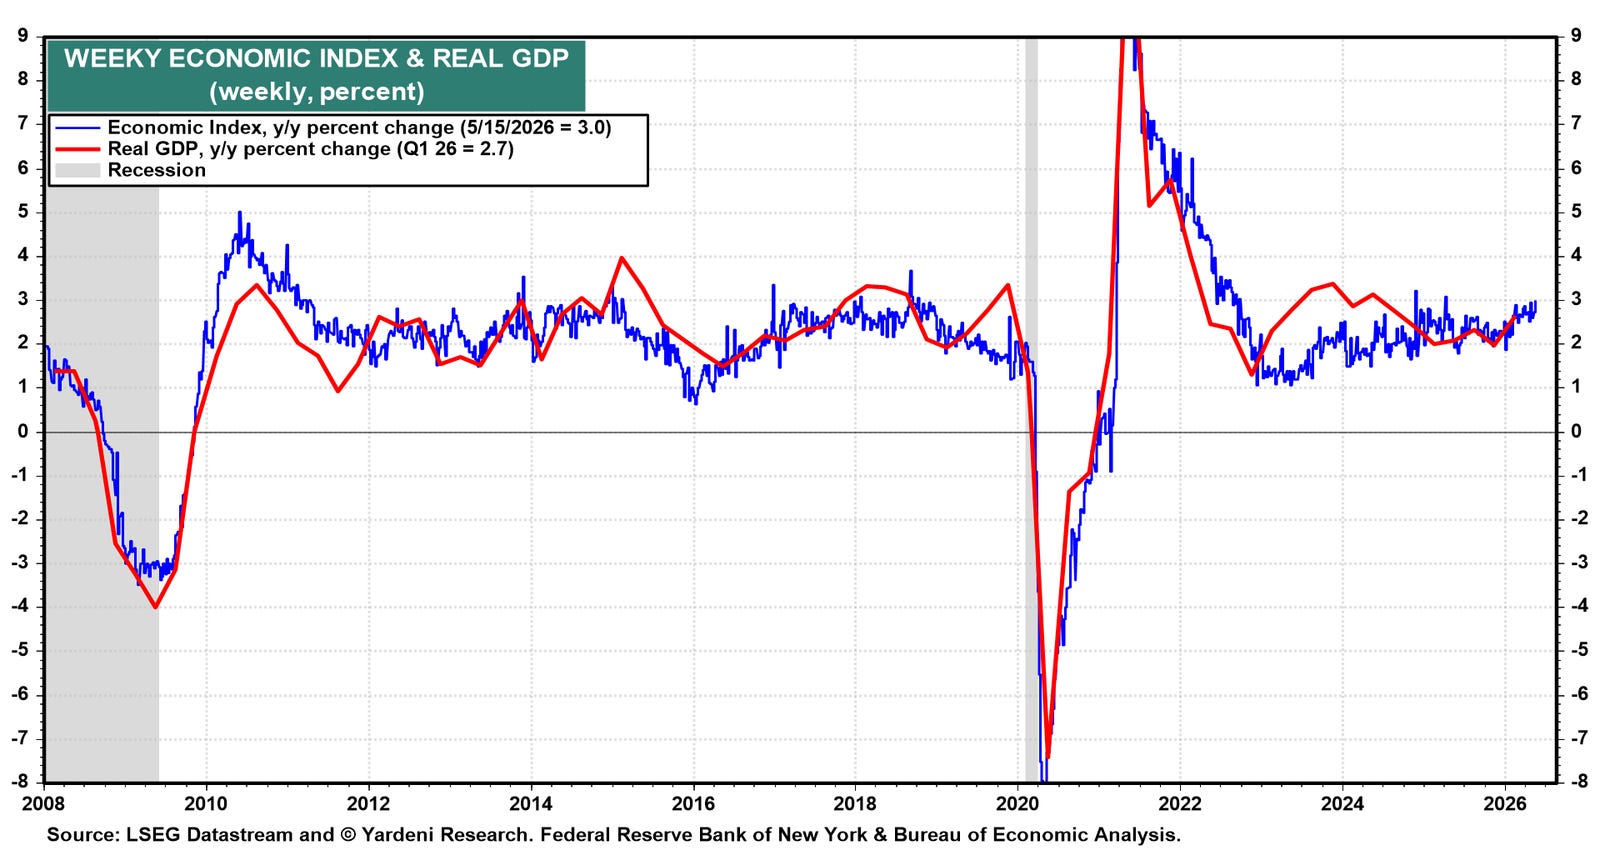
The New York Fed’s weekly economic index is showing that real GDP is growing 3.0% y/y as of the week of May 15 (chart).
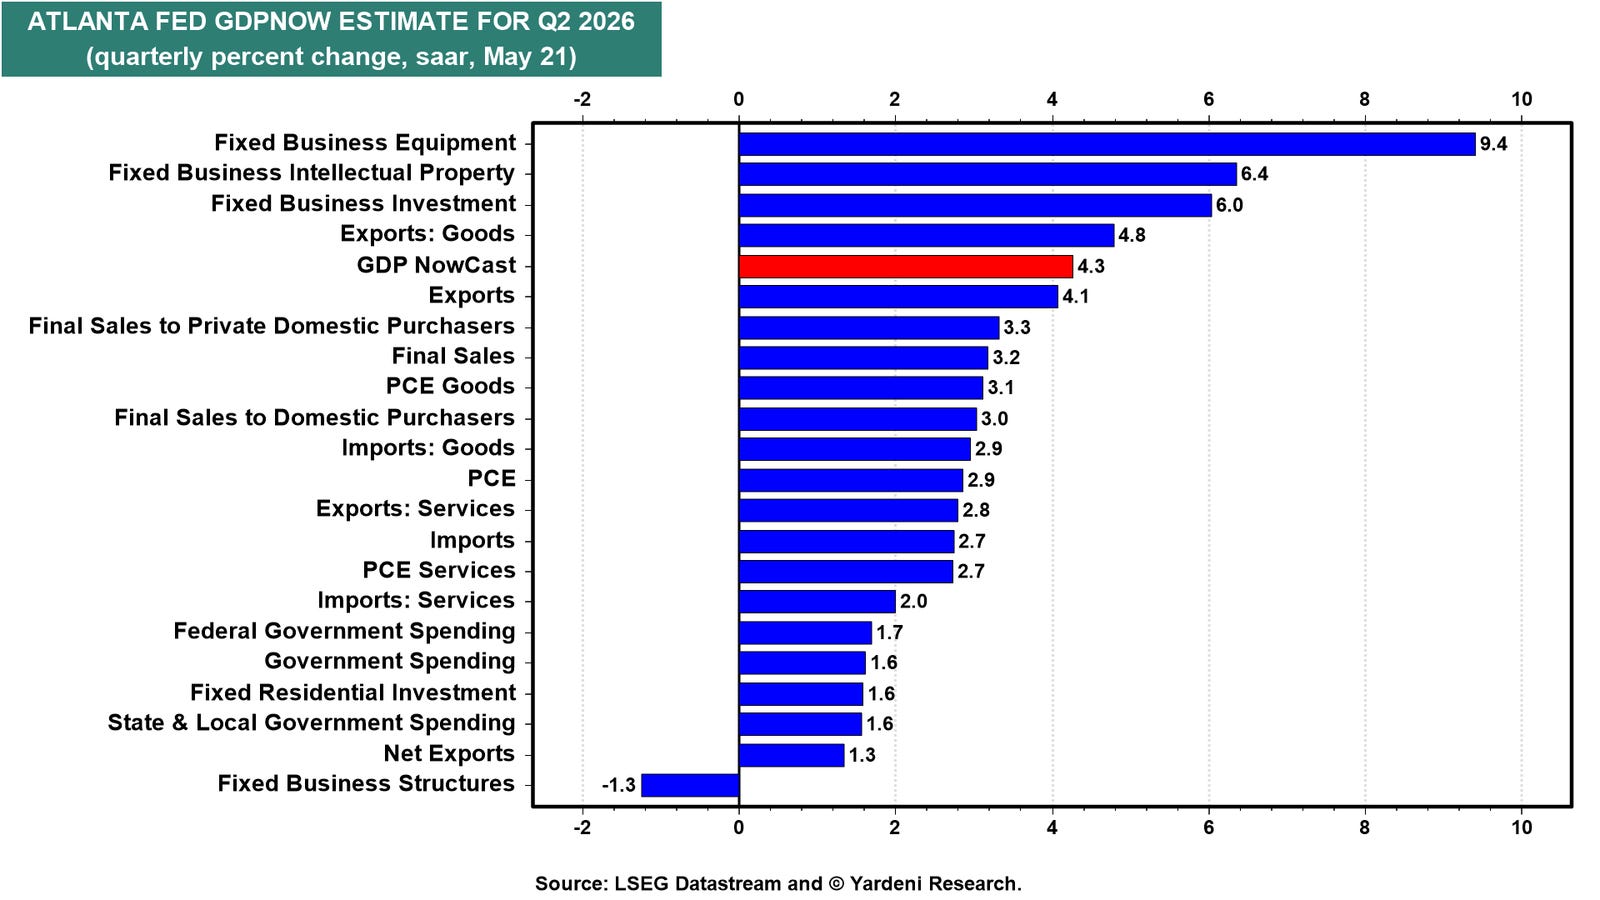
The latest Atlanta Fed GDPNow estimate for Q2-2026 is 4.3% q/q saar (chart). Capital spending is leading the way. Consumer spending is up solidly at 2.9%.
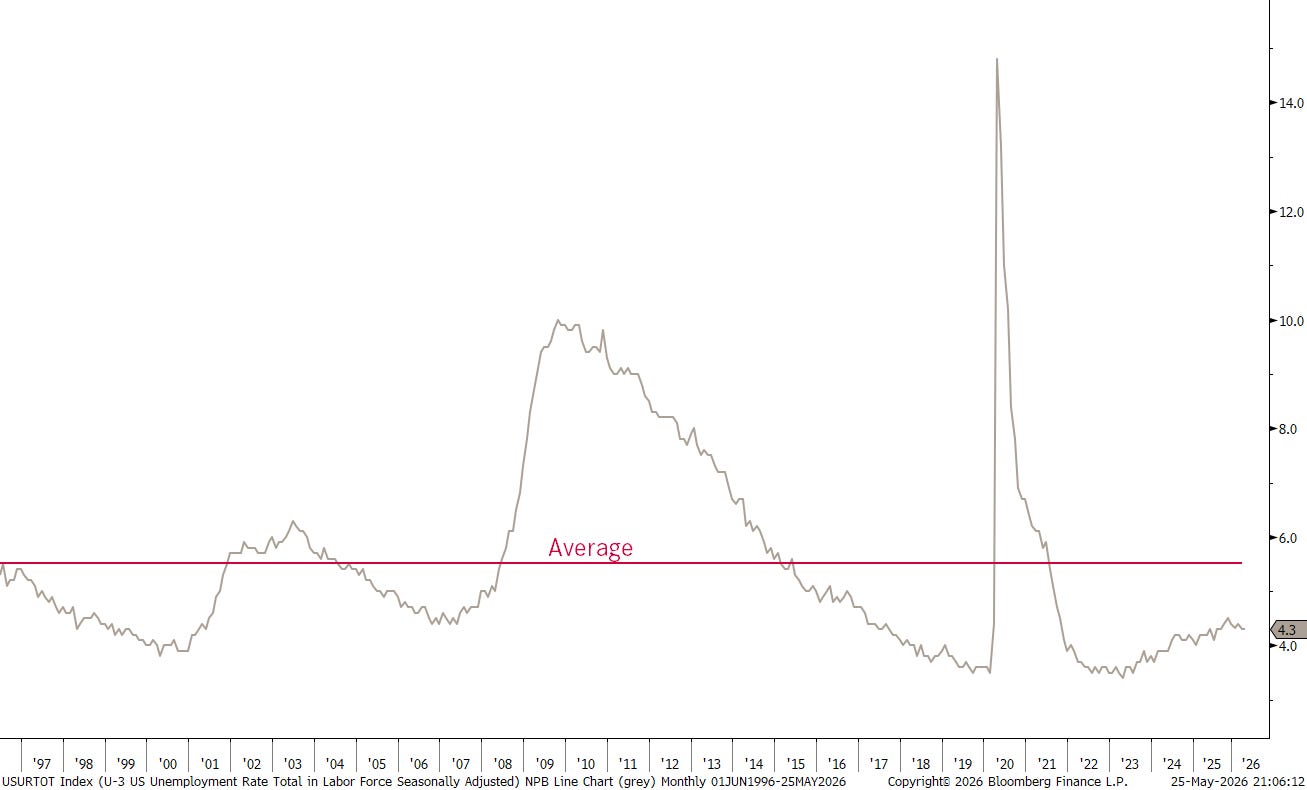
Unemployment is not really an issue,
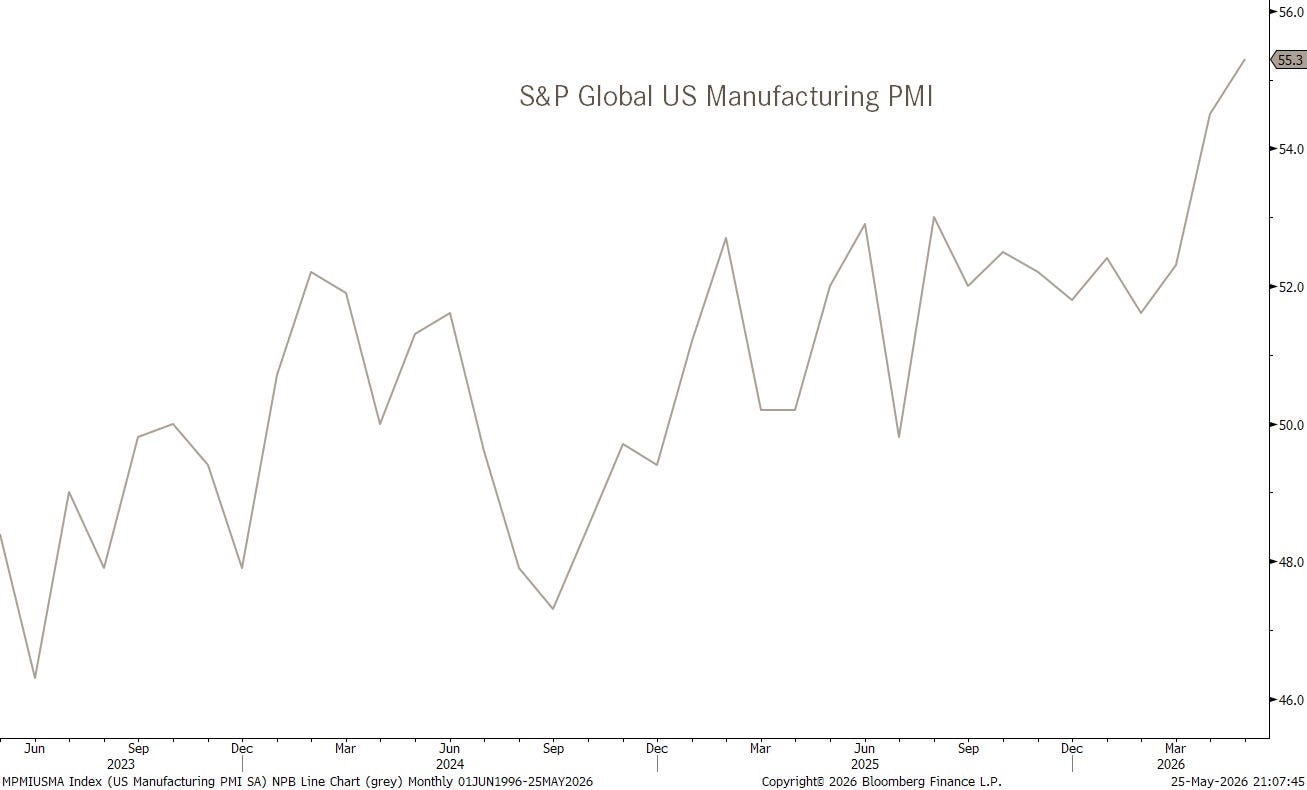
and the US PMI rose to 55.3 in May, it’s highest reading since May 2022:
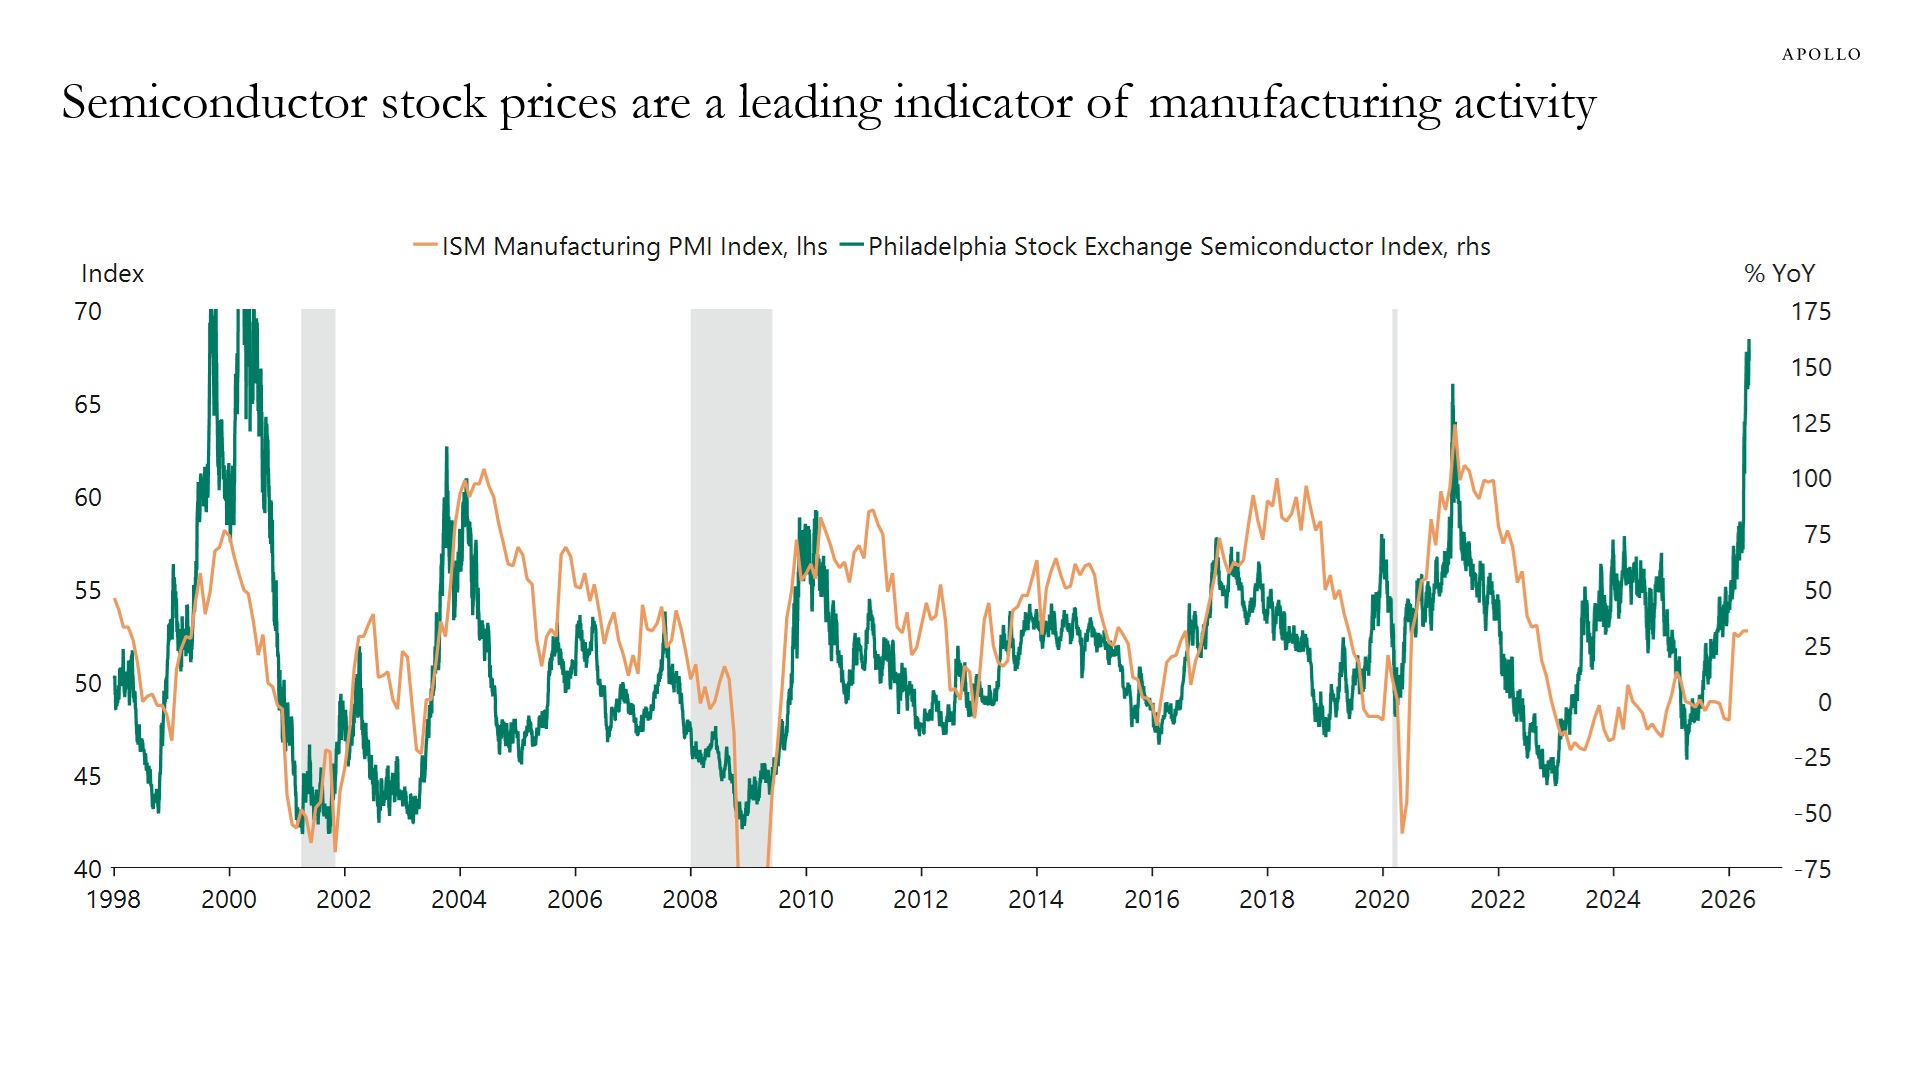
And if it is up to Semiconductors stocks, those Flash PMIs still have further to rise …
Hence, all-in-all, that upside pressure on the long-end of the curve is likely to remain for now:
And even at the short end (2y) have rates been rising and hence, our long-standing chart titled “Fed follows Rates” continues to hold true:
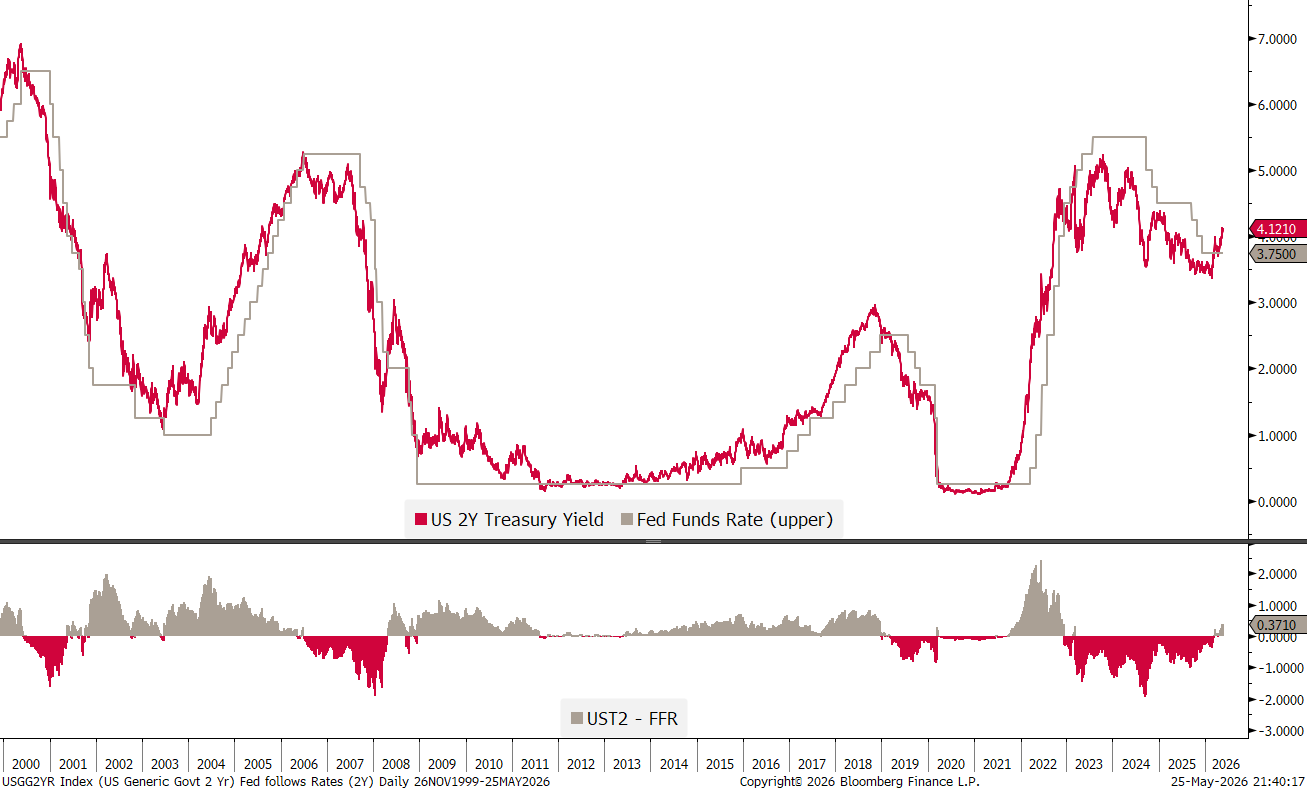
Of course, all truth being told, and in a small defence for the Fed, 2-year yields are set daily (or every tick as a matter of fact), whilst the FOMC sits together only every six weeks or so.
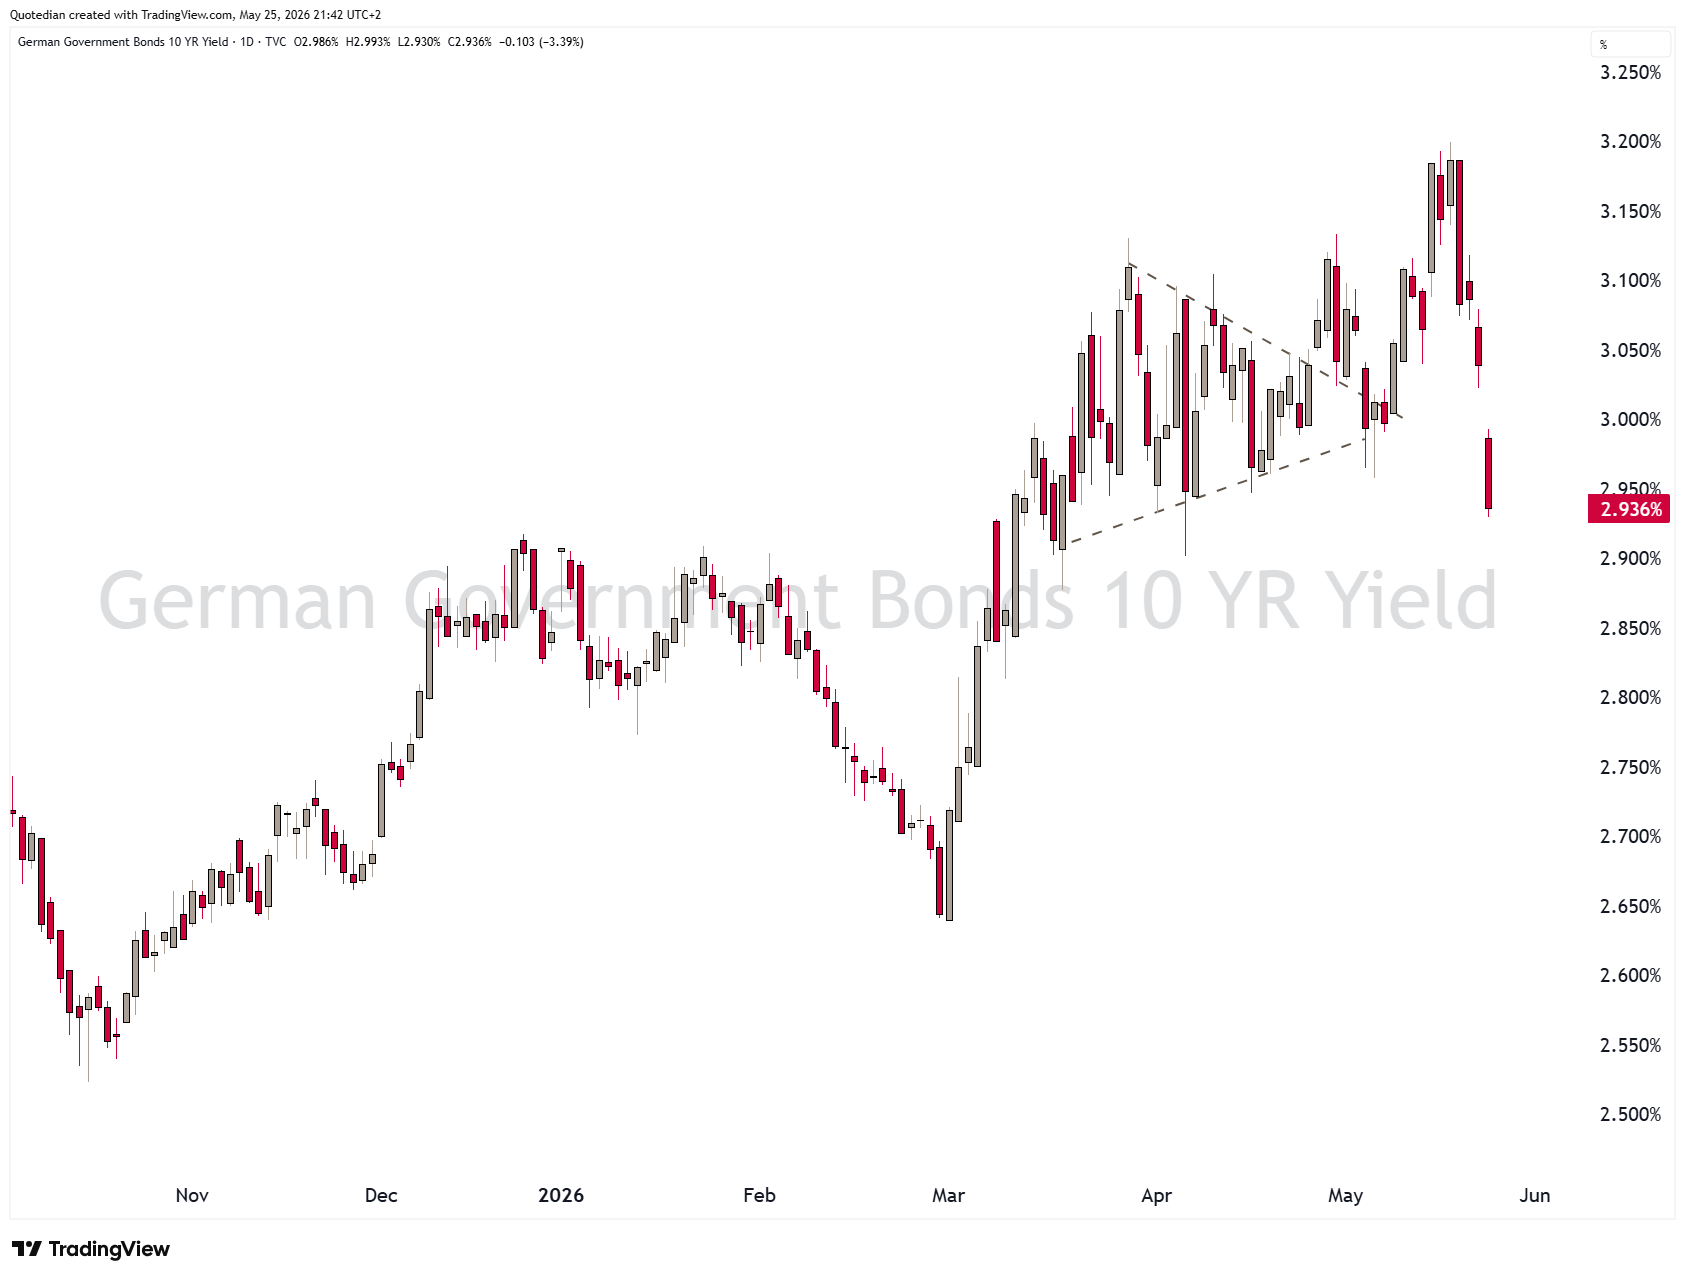
German yields have been dropping like a stone, including yesterday Pentecote-day, which is a strong signal from the bond market that it thinks the Iran conflict is truly over:
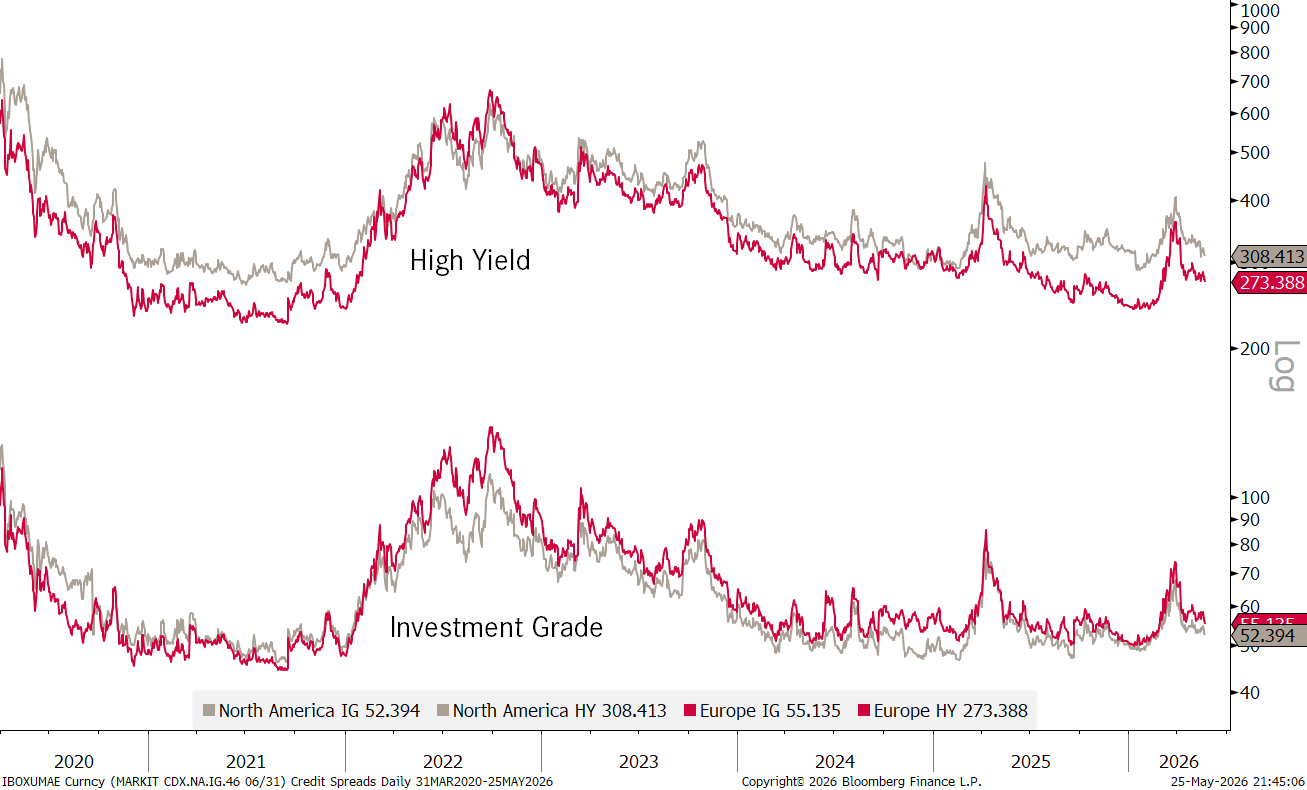
To finish the bond section, just a quick glance at credit spreads, which are NOT signalling any sign of distress whatsoever:
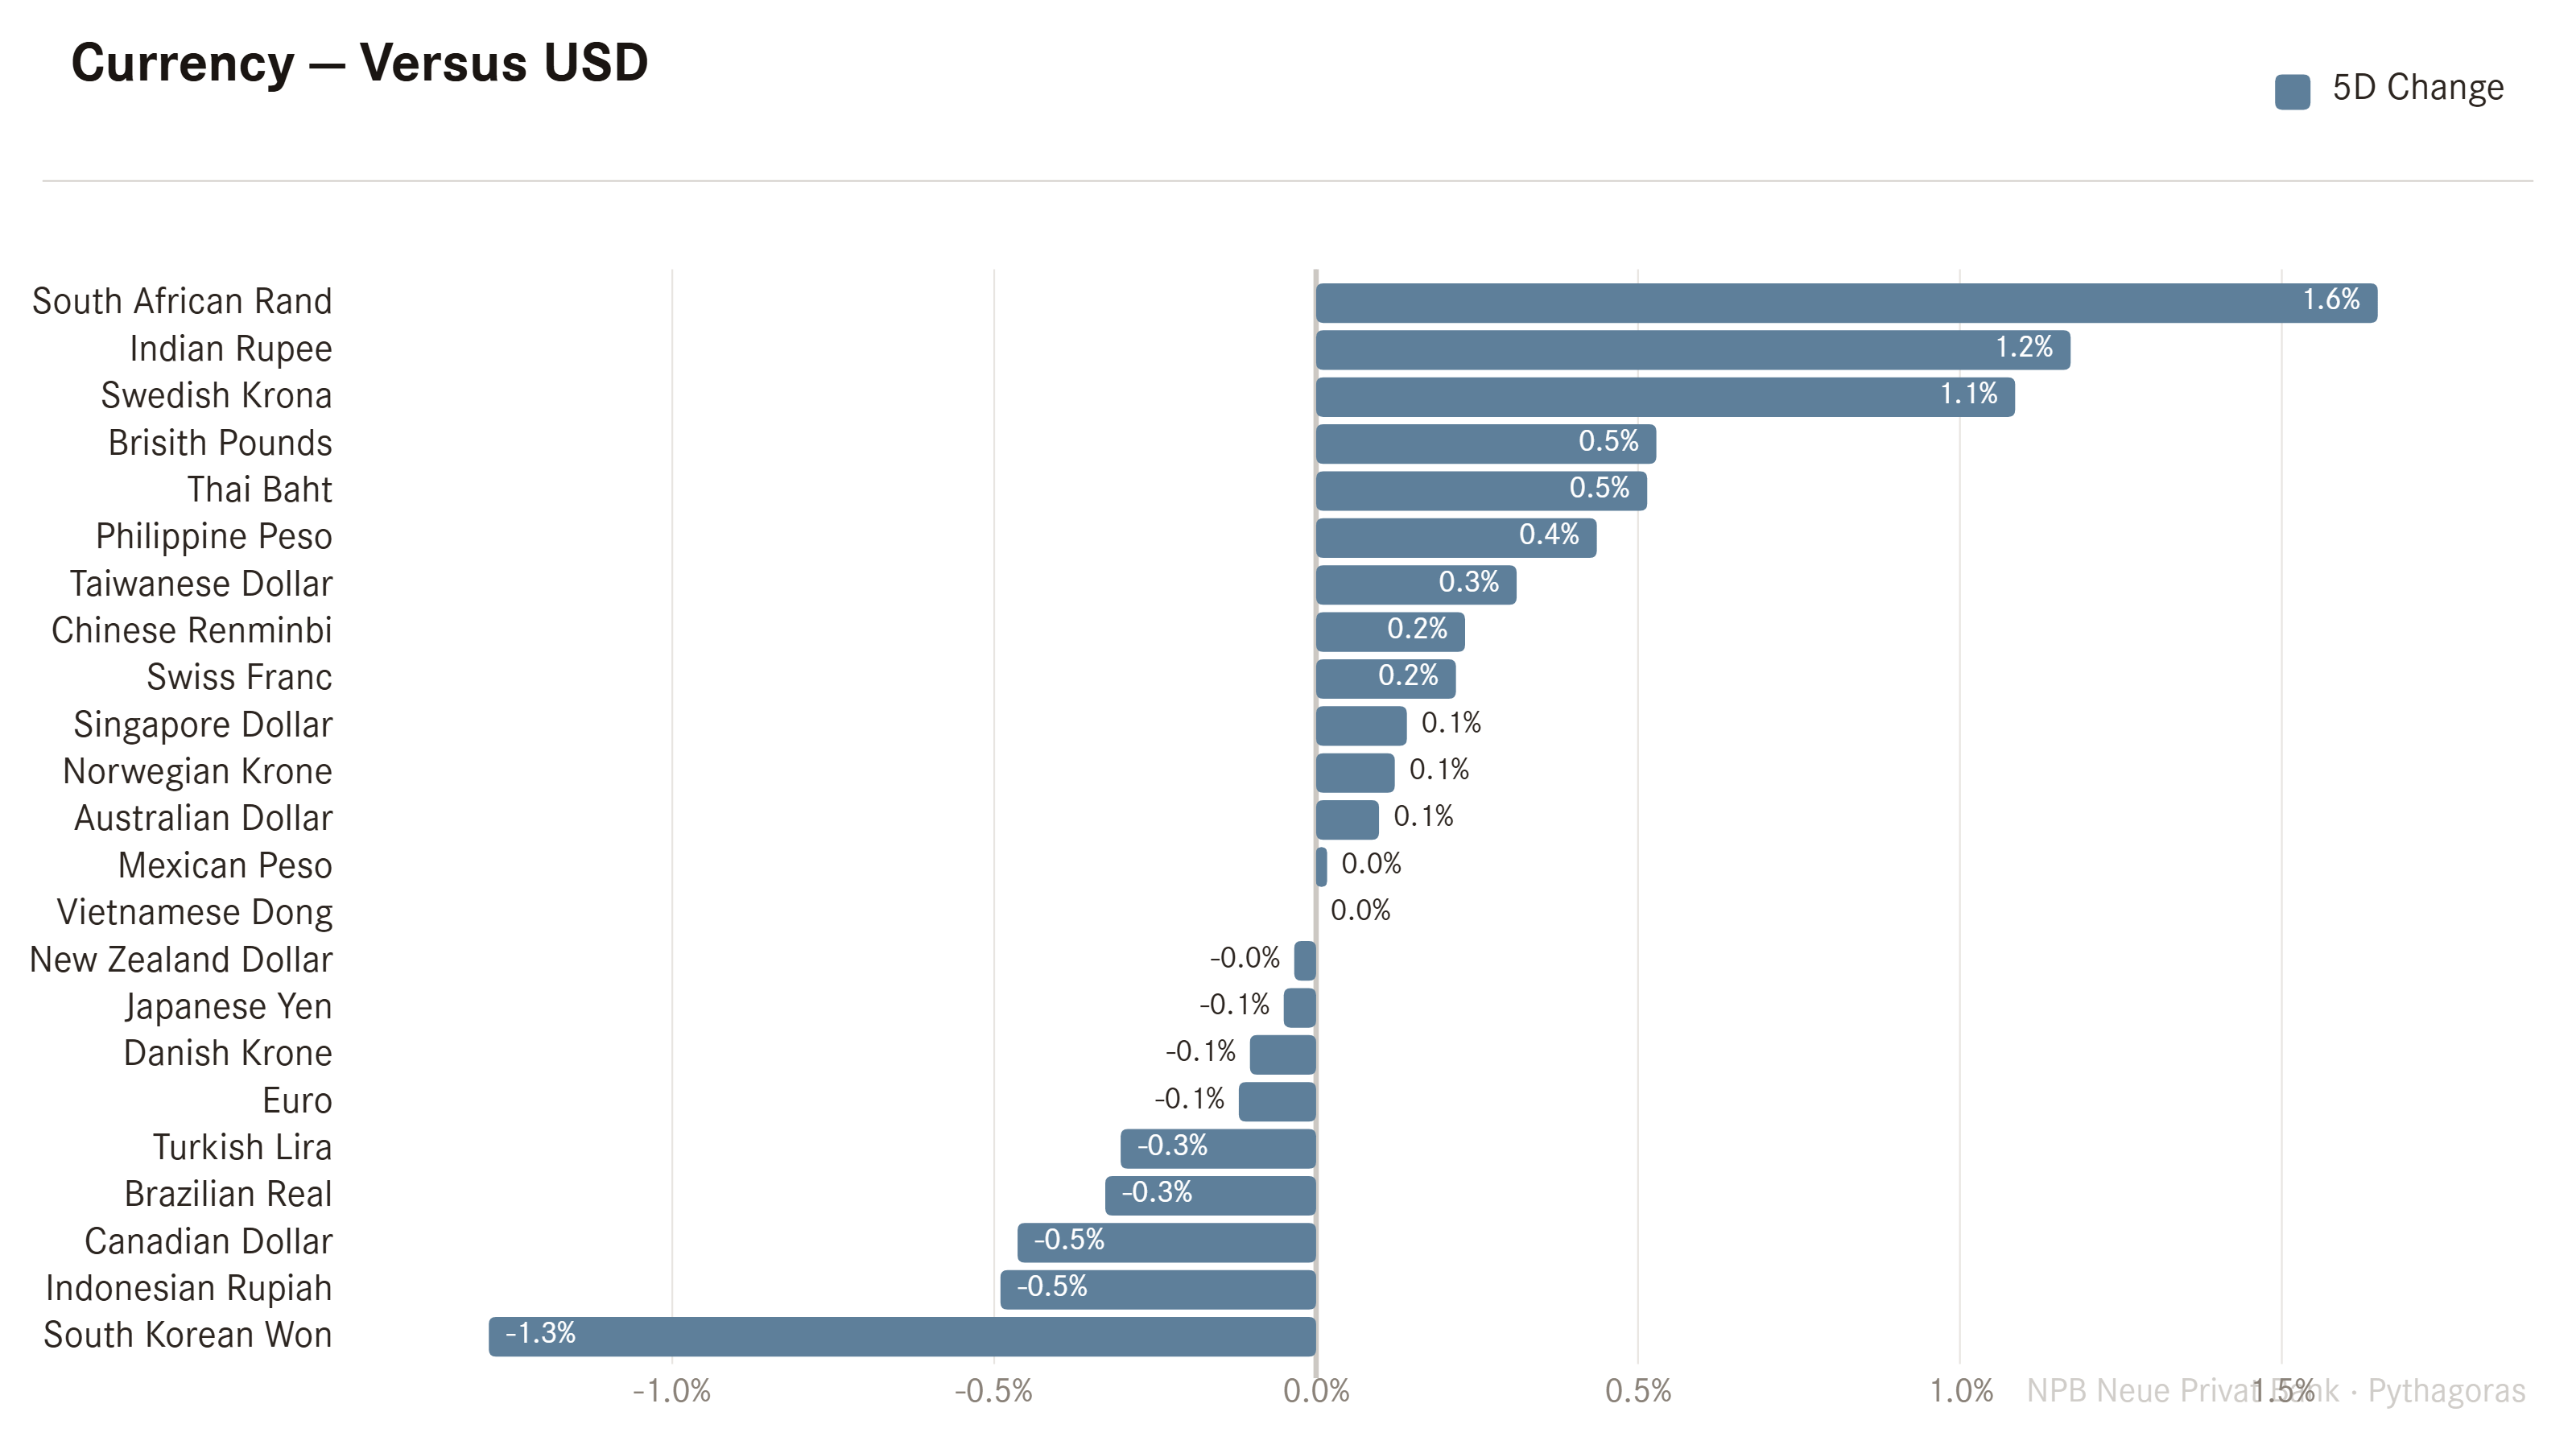
In currency markets over the past five days, nothing really (unless you take a specific interest in the South Korean Won or the South African Rand):
Which only leaves us to look at commodity markets, where oil seems finally to be coming lower now,
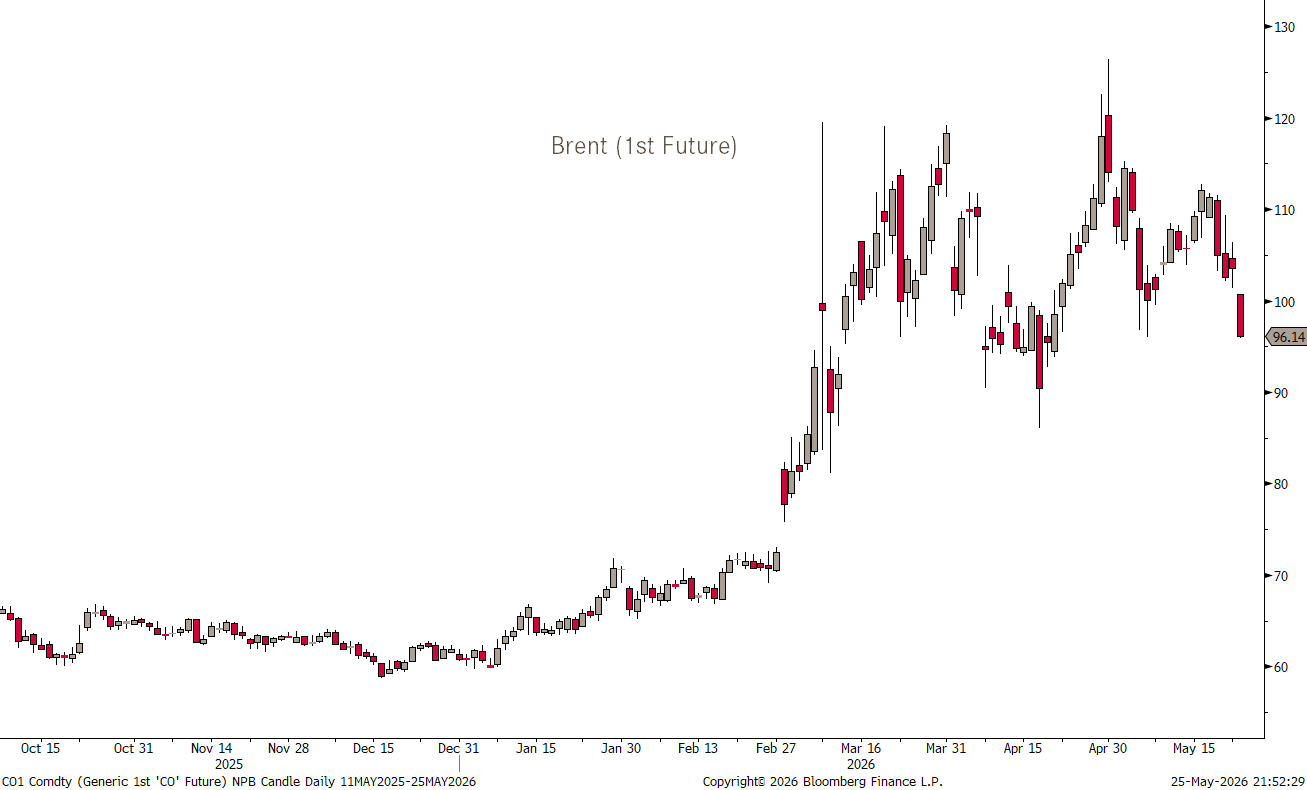
agreeing with the conclusions of German Bund traders discussed further up.
** Update as per Tuesday morning, 06:55:
Oil is a tad higher this morning as, despite persistence that a peace agreement is about to be signed, US attacks on two Iranian ships, followed by (protocol) retaliation by Iran on US planes put (limited) upside pressure on the price of black gold again:
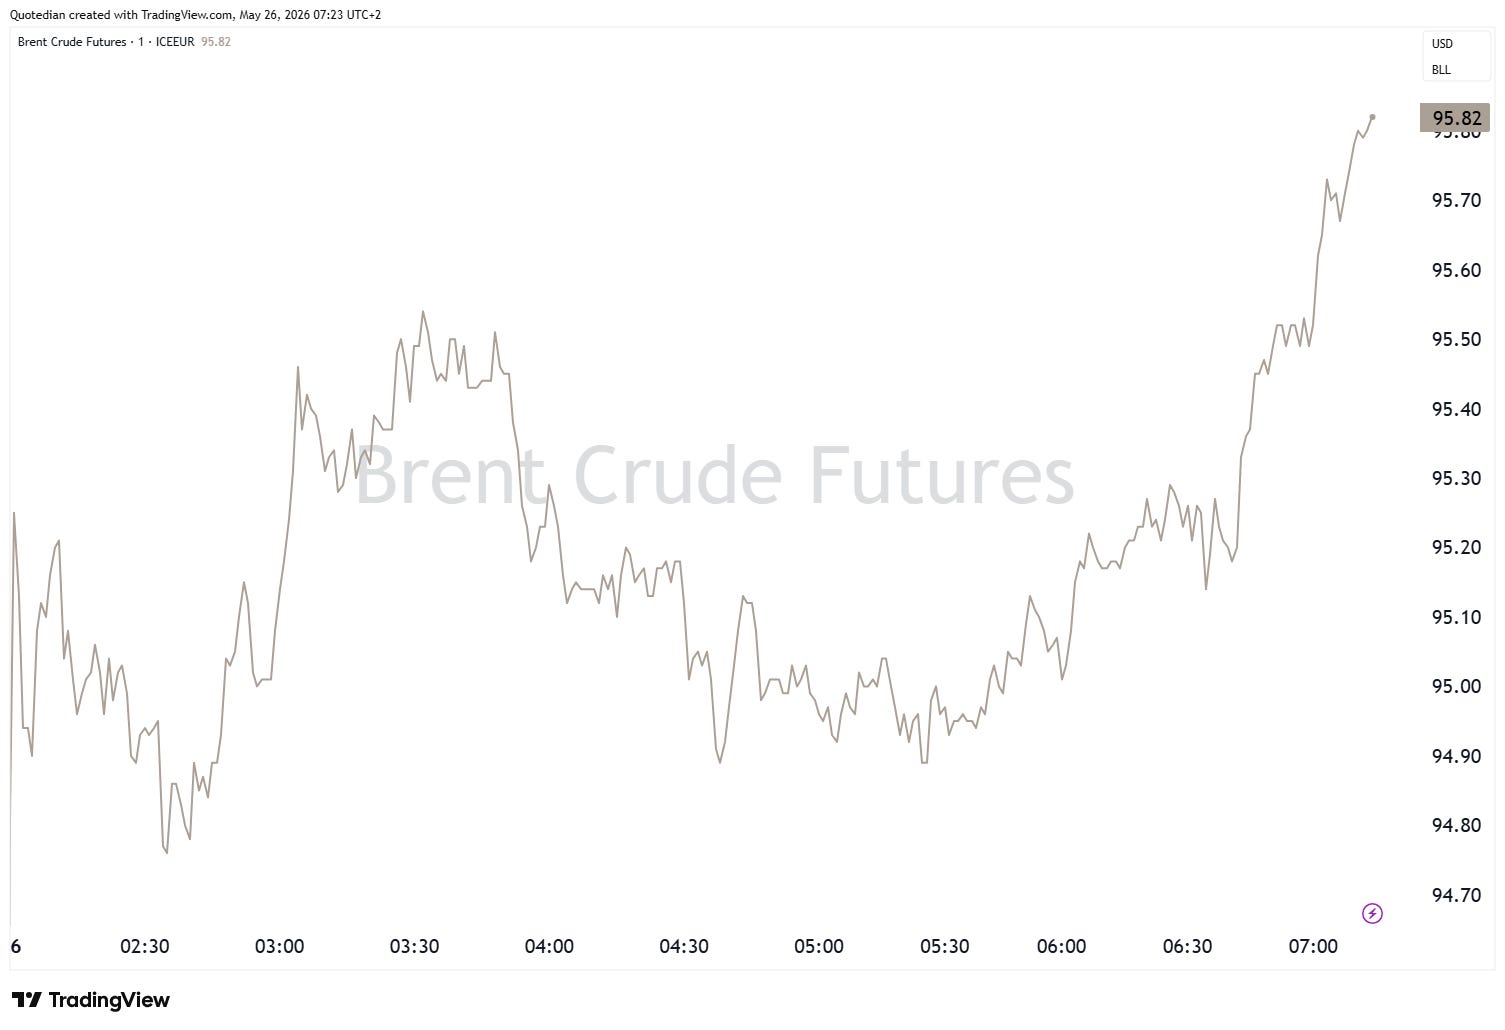
Nevertheless, all other parts of the market are screaming that they believe an agreement is around the corner and these last minute operations are quite typical ahead of peace documents being signed. After all, a Supertanker, which had been stuck for three months, apparently crossed the Strait of Hormuz this morning.
And via the fine folks at Rabobank we hear to rumour that Al Arabiya, a news channel, claims that it obtained a copy of the draft memorandum of understanding that reportedly has the support of both sides. Provision of the MOU are said to include:
Extension of the ceasefire for 60 days
Reopening the Strait of Hormuz to international navigation, guaranteeing free passage of commercial vessels and oil tankers without additional transit fees, with the Iranian side committing to take the necessary technical and security measures to ensure safety of navigation, including the removal of mines.
Enabling Iran to resume sale and export of oil.
Continuation of negotiations over Iran’s nuclear program with the aim of reaching a long-term understanding.
US to ease restrictions on Iranian ports and grant specific sanctions waivers for Iran.
Ending military operations on all regional fronts, including Lebanon.
Freedom of navigation to be restored in Hormuz over a period of 30 days, with maritime traffic set to return to pre-war levels by the end of the 30 day period.
Nuclear issues to be negotiated over 60 days.
Some Iranian frozen assets to be released during the first phase of implementation.
Onwards …
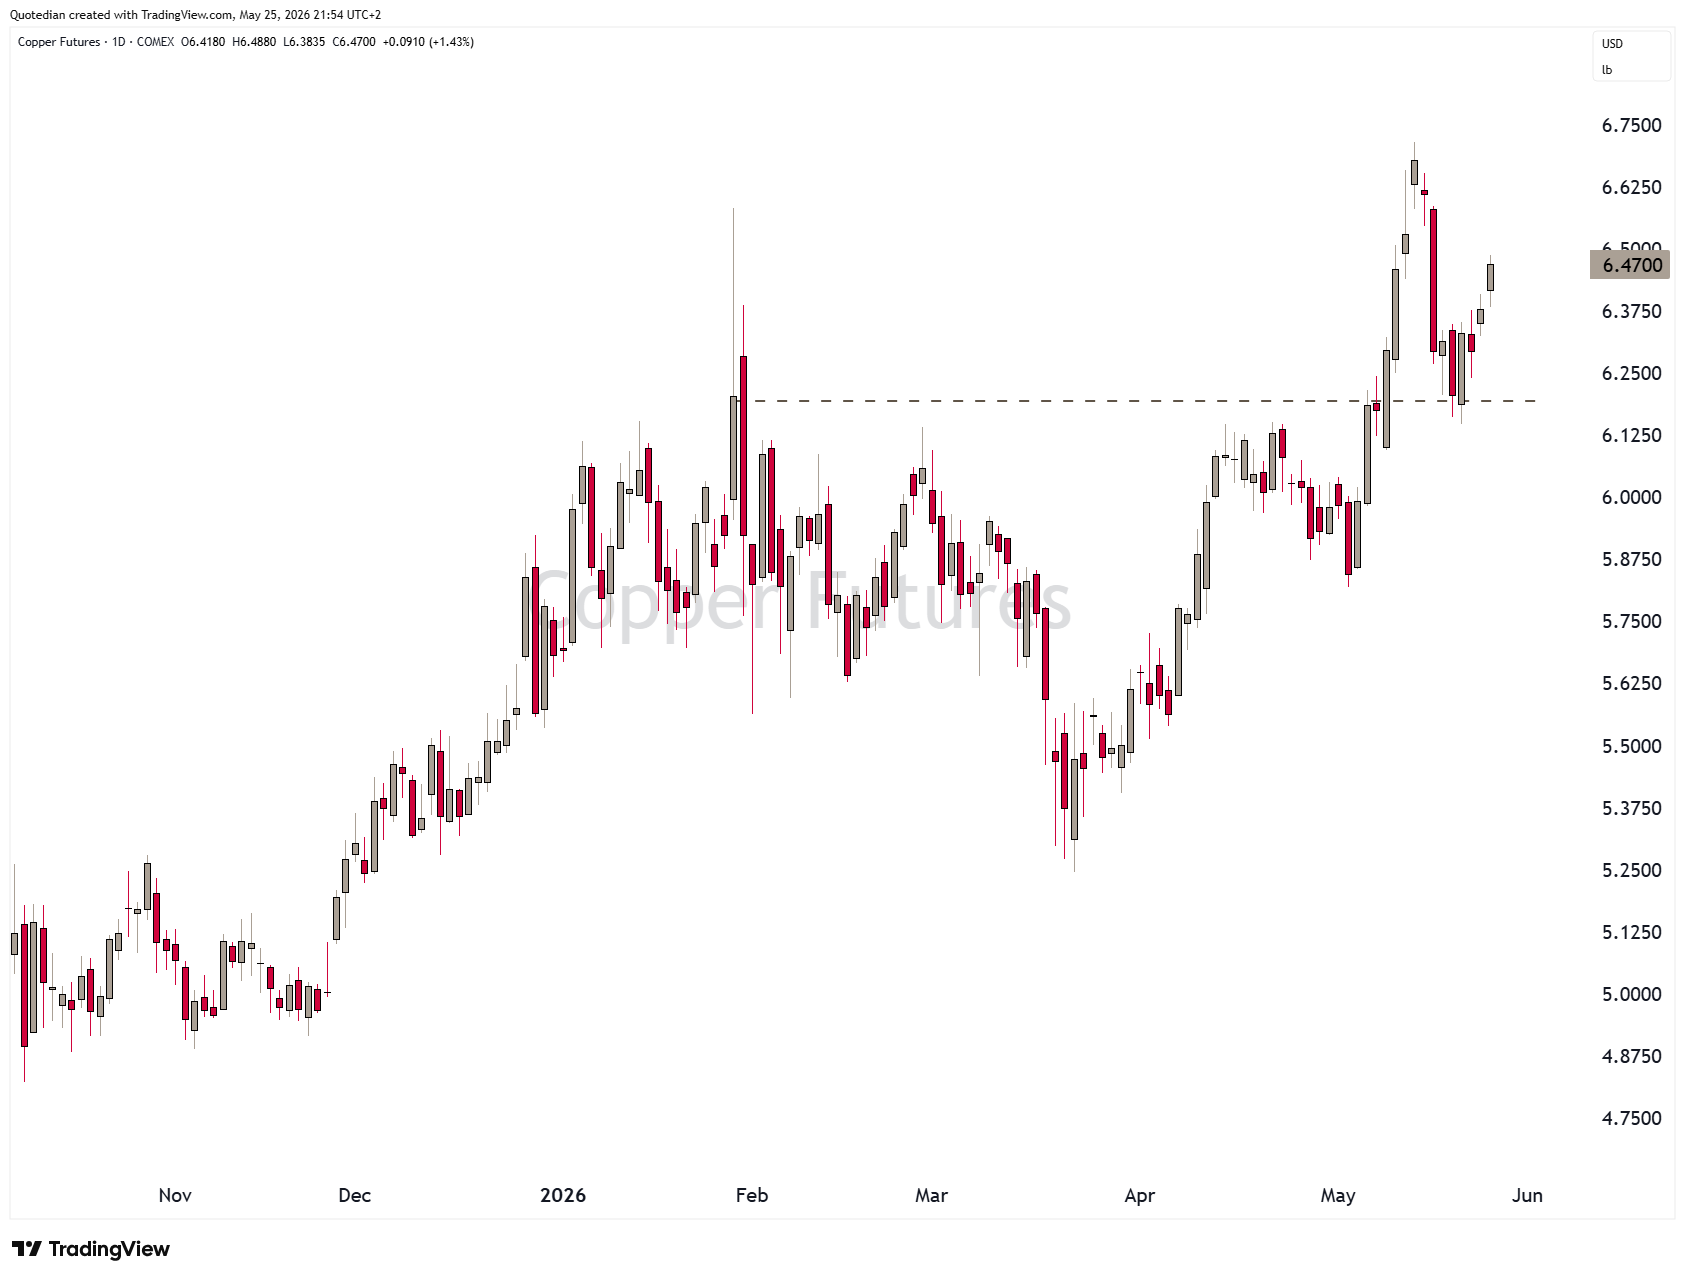
Our copper-bull trade also seems to be starting to work again after a little ‘artistic’ pause:

So, remember, Money Never Sleeps …

… but above all: LUNCH IS FOR WIMPS!

May the Trend be with You!
André

Everything in this document is for educational purposes only (FEPO)
Nothing in this document should be considered investment advice
Investing real money can be costly; don’t do stupid shit
Leave politics at the door—markets don’t care.
Past performance is hopefully no indication of future performance
The views expressed in this document may differ from the views published by NPB Neue Privat Bank AG