NFP is coming
The Quotedian - Vol V, Issue 119
I used to think that if there was reincarnation, I wanted to come back as the President or the Pope or as a 400 basball hitter. But now I would like to come back as the bond market. You can intimidate everybody.
— James Carville
DASHBOARD
AGENDA
CROSS-ASSET DELIBERATIONS
Stocks faced a wobbly start to yesterday's session, with major indices on both sides of the Atlantic down noticeably just before the European closing bell. Though once the Europeans had grabbed their bicycles for their commute home, stock in the US started to recover, eking out a nearly half a percentage gain by the time of the market close. This is what the session looks like on the intraday chart:
Whilst this was a very decent and probably much-needed turnaround after four consecutive days of lower prices, what did the move look like under the hood?
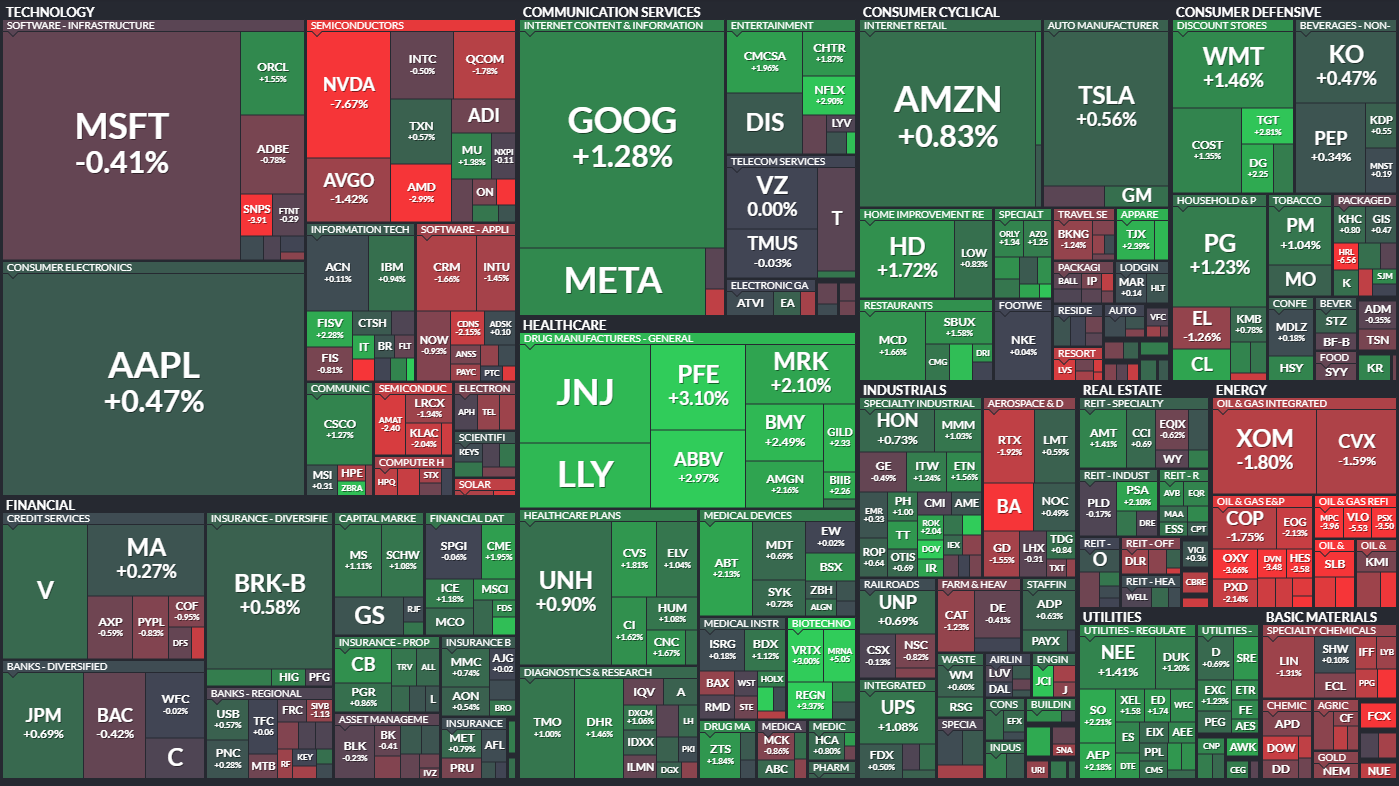
Mixed, would be the right answer. Whilst winners outpaced losers on the S&P 500 and the Dow, the broader Nasdaq and NYSE composite indices actually showed more decliners than advancers. Even so, on the market carpet for the stocks most of us consider to be our universe (S&P), green prevailed:
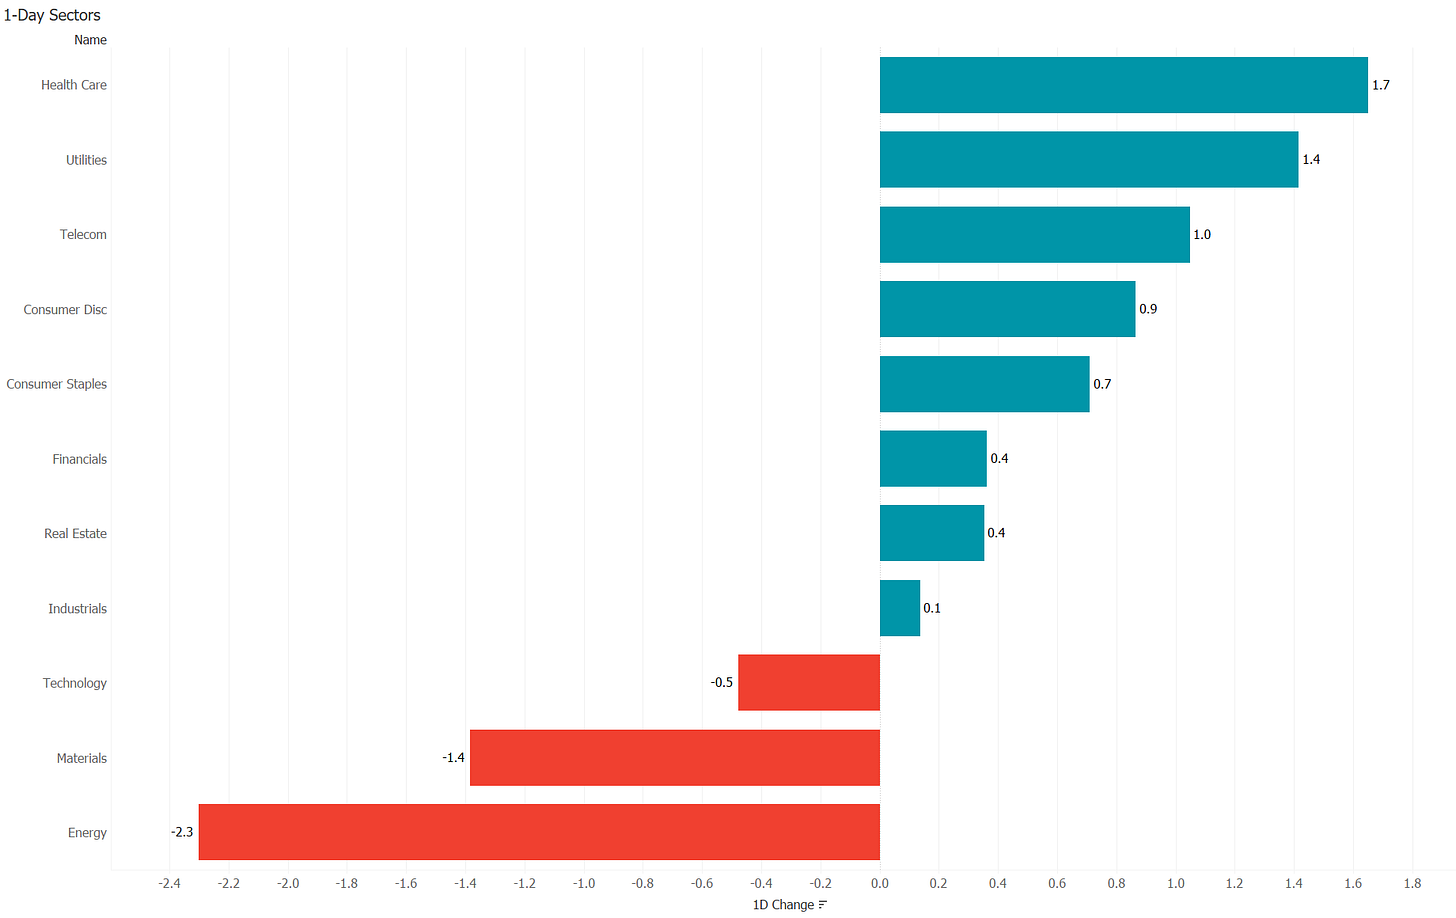
Eight out of the eleven economic sectors closed higher on the day, with the grunt of the losses accumulated in the Energy sectors, where some kind of profit taking seems to continue:
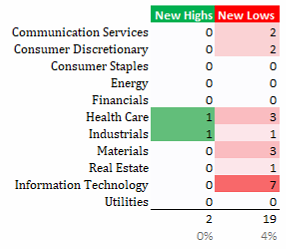
Another statistic I like to look at on a daily basis is less favourable, however. The following two tables show how many stocks in the S&P 500 (SPX) and the STOXX 600 Europe (SXXP) respectively show how many stocks it a new 52-Week high versus a new 52-Week low yesterday:
So all-in-all a lot more stocks hitting new lows versus new highs, with Tech stocks getting stick in the US (higher rates related) and industrials feeling the heat in Europe (economic recession/energy deficiency related).
Here’s an update on our ‘inverse traffic light’ chart, where we are now right in the middle of amber:
I realize the amber/yellow part is quite wide, but keep in mind that we are looking for the at least cyclical, if not secular trend continuation/reversal here.
To finish the equity section off, Asian stocks this Friday morning are not buying into Wall Street’s second half of day rally of yesterday, but are rather following European and US equity futures lower.
In fixed income markets, the stampede higher in yield continues, with all major 10-year government bond yields increasing yet again. The daily chart of the 10-year UK Gilt is pretty impressive:
Remember TINA and lower for longer? Were you one of those saying “I wish I could just put my money in a safe investment a clip a 4% coupon”. Four percent sounded outlandishly as most European bonds traded negative, no? Well, this G-7 country now pays you ~4%:
Be careful what you wish for, as they say.
Ok, let’s hope into FX markets, where the Yen continues being the focus of currency traders. The JPY in one session not only took out the previous multi-year high but also the psychological 140 level which was one target we had cited in this space a few months ago:
This chart is probably worth a Zoom out to a longer time period too:
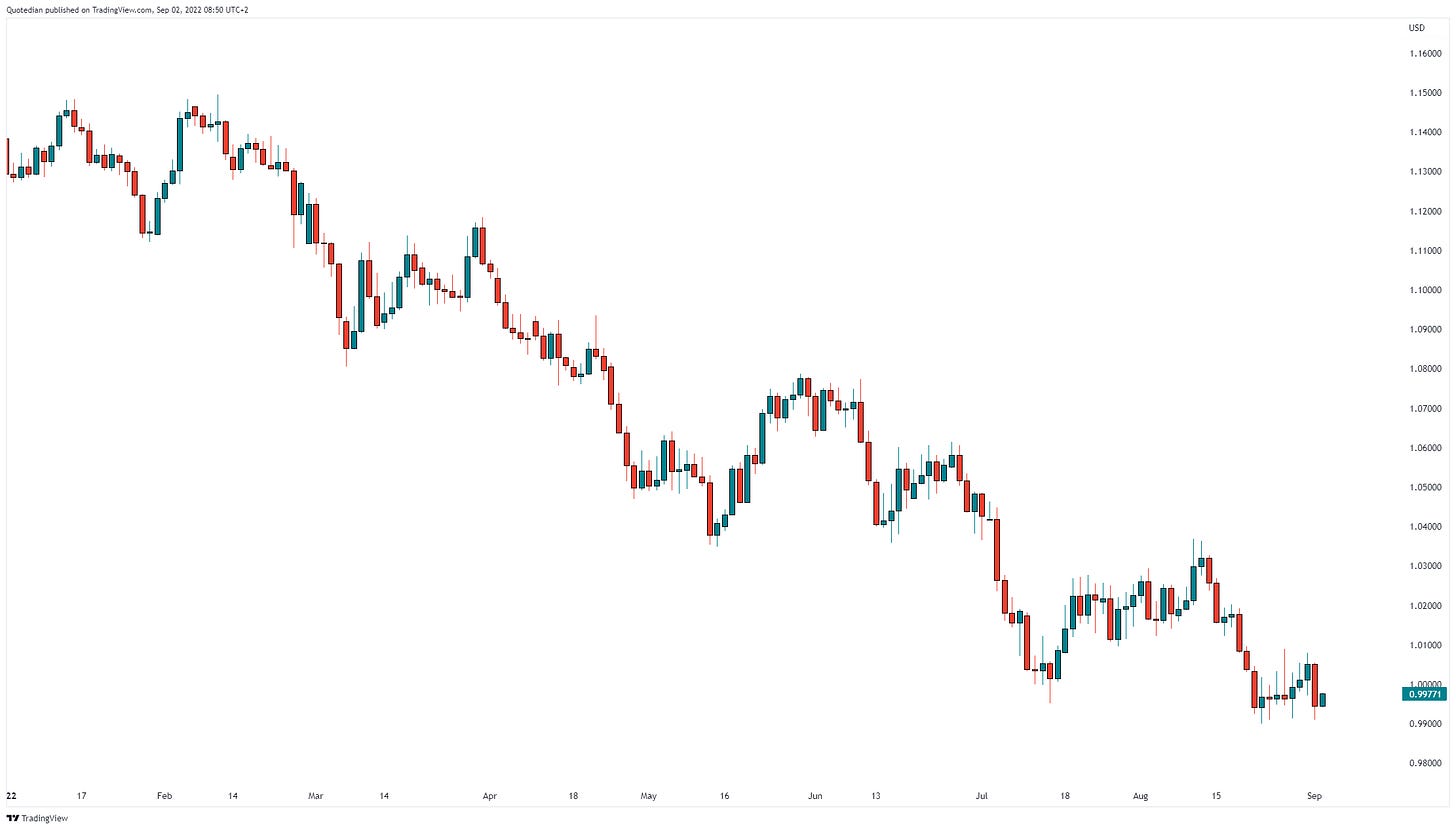
The EUR/USD cross-rate also saw a big, fat, red candle to the downside yesterday, pushing the currency pair right above key support again and increasing the likelihood of a trend continuation (to the downside) over the coming sessions:
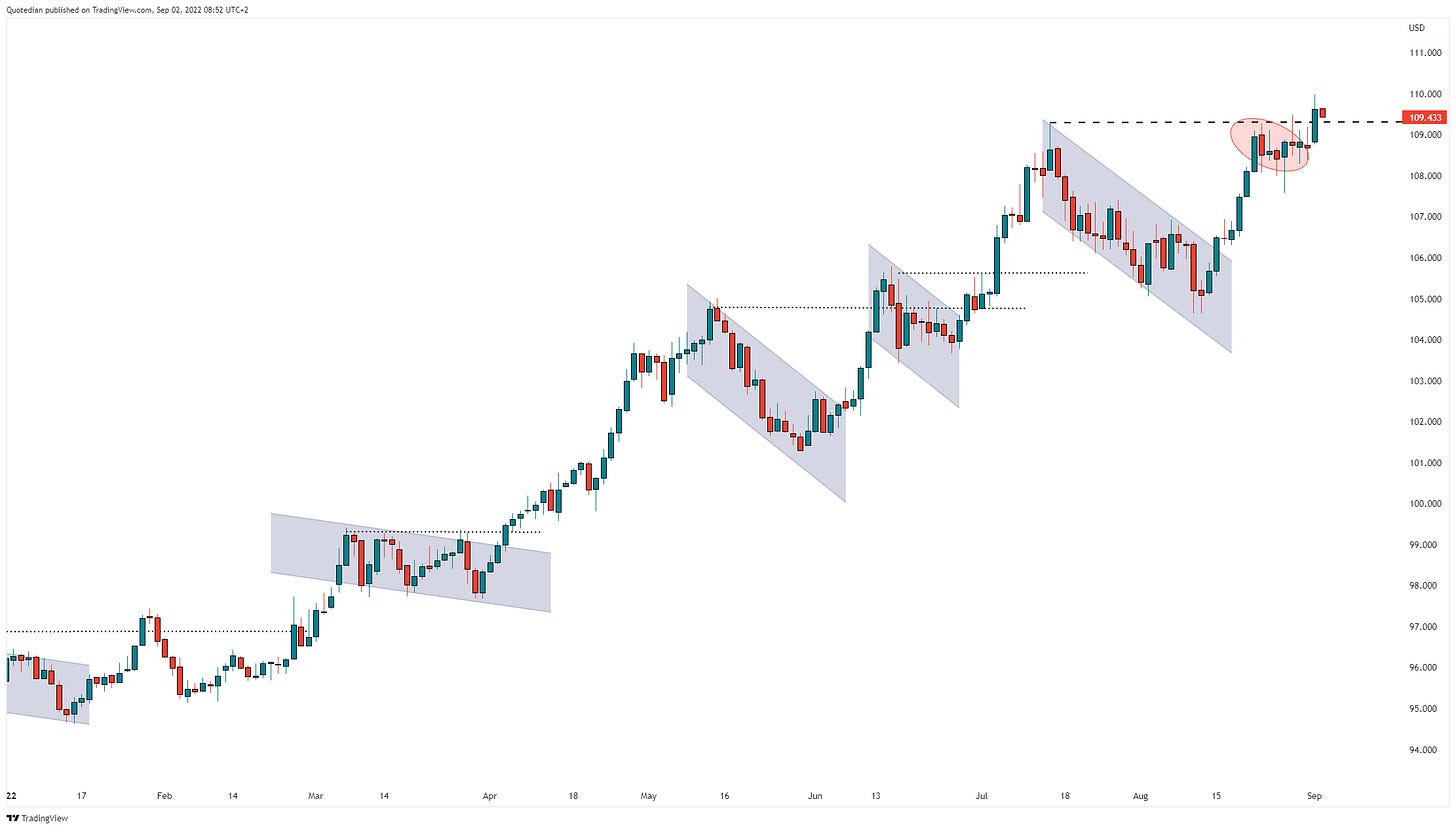
With the Euro and the Yen making up over 60% of the US Dollar Index (DXY), now wonder that index pushed to new multi-year highs again:
And finally, moving (briefly) into the commodity space, the following table of one-day performance of different commodities shows that it was a risk-off day for that asset class:
Recession fear related? Perhaps. Though noticeable remains that Nat Gas prices bucked the trend yesterday, remaining elevated due to fears of pipeline "maintenance” by Gazprom becoming more frequent or even … permanent!
Gold briefly dropped below the psychological mark of $1,700, upsetting all gold bugs and fiat-money haters, though the real key support to watch (from a TA viewpoint) is at 1,675:
Ok, dear friends, time to hit the send button.
As you can see from the economic and earnings calendar it could have been a pretty quiet day today, BUT …. drumroll …. it is NFP-Day! Hurrah! No early lunchtime drinks today - stay focused at least until 14:30 CET
Enjoy your weekend, but make sure to tune back in on Sunday evening to read The Quotedian’s weekend edition in order to get a head start on Monday ;-)
André
CHART OF THE DAY
Equities are in a bear market. Anyone disagreeing? We may disagree on where they head from here, but if only going by the 20% bull/bear market rule, stocks are in a bear market.
What about bonds? Have you heard anyone saying with the same level of emotion as on equities that bonds are in a bear market? Well, they are, according to this 20%-rule:
And arguably, given the (usually) lower volatility function of bonds, maybe 20% to define a bond-bear market may be too high.
In any case, stay tuned …
Thanks for reading The Quotedian! Subscribe for free to receive new posts and support my work.
DISCLAIMER
Everything in this document is for educational purposes only (FEPO)
Nothing in this document should be considered investment advice
Past performance is hopefully no indication of future performance


