

Obviously
The Quotedian - Vol VII, Issue 8 | Powered by NPB Neue Privat Bank AG

's review of Under My Skin")
“If it's obvious, it's obviously wrong.”
— Joseph Granville


Obviously NVDA could not live up to its overhyped earnings expectations…
Obviously the Nasdaq would crash thereafter …
Obviously General Custer would win the battle against the Sioux with ease at little Bighorn …
Looking for the not so obvious? Contact us!

Contact us at ahuwiler@npb-bank.ch
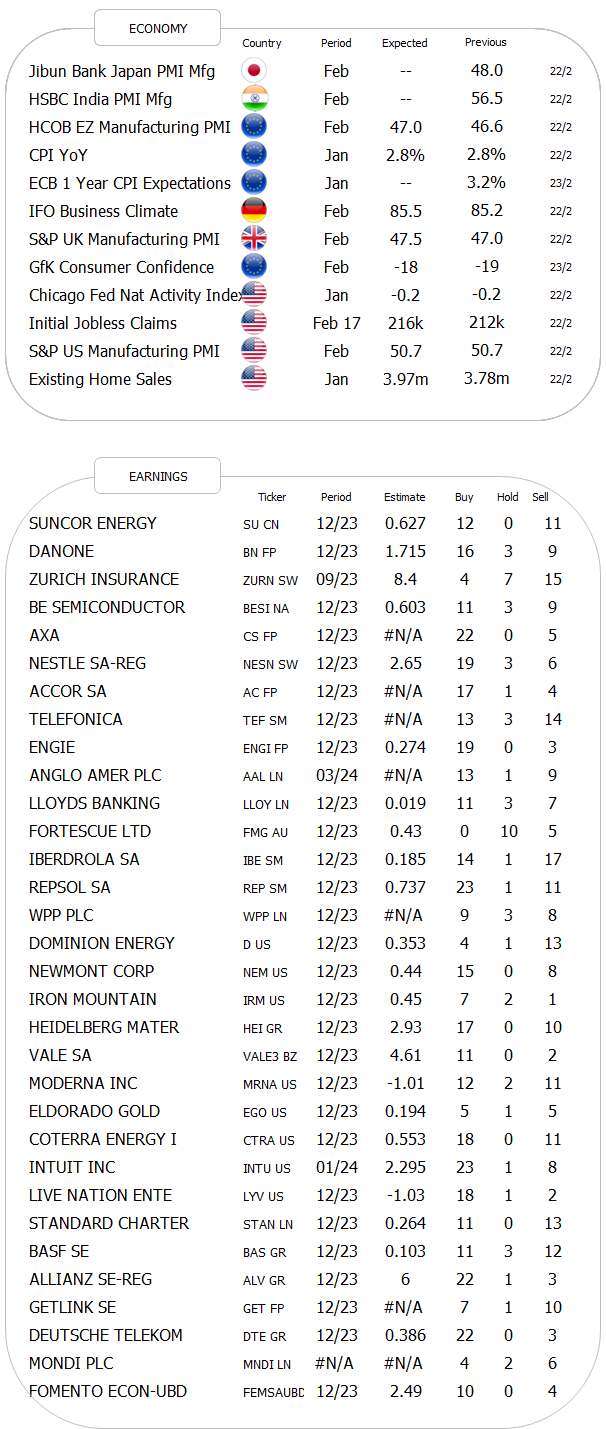
Just a few points of observation today, all probably invalid by lunchtime, as the trading session post Nvidia earnings has not even started yet as I type.
For now, that expected “earnings miss” of almighty NVDA has been averted, but the bears are still keeping their fingers crossed, for “buy the rumour, sell the fact” or “sell the rumous and asell the fact” or something similar. Whatever.

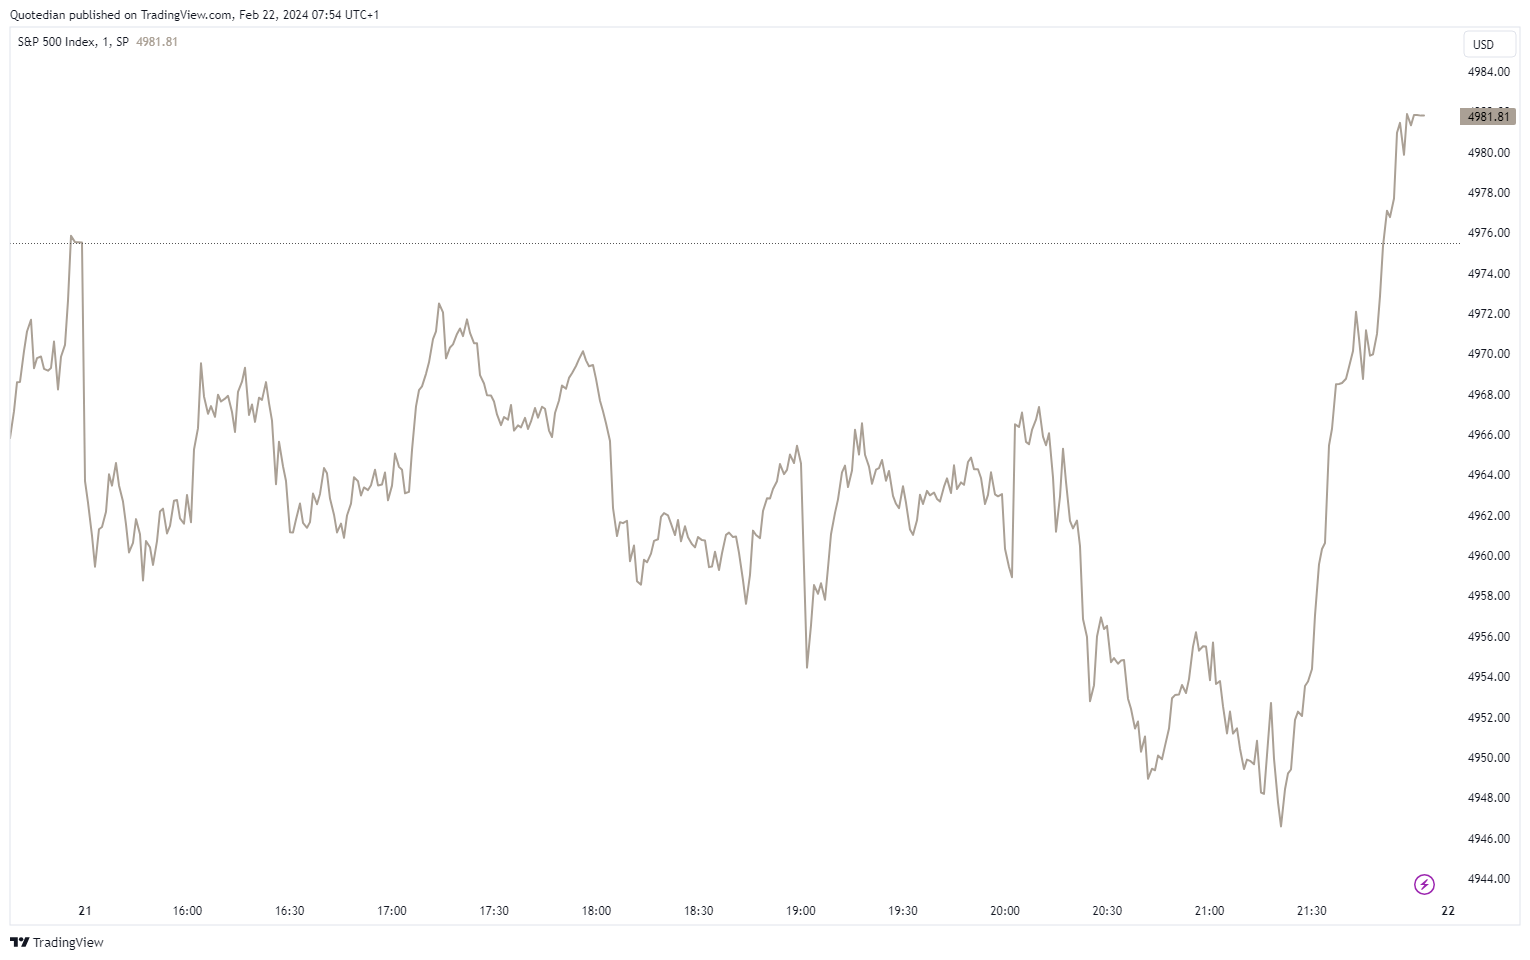
NVDA reported after the closing bell, but looking at the intraday chart of the Nasdaq it seems that somebody ‘reeked’ the coming positive earnings surprise:

The late rally was even enough to lift the S&P 500 into positive territory after having traded “below the surface” for the entire session:
This left the overall market with about two third of stocks up on the day versus one third down:

Our indicator of 52-Week highs versus 52-Week lows continues to demonstrate what is really going on under the hood:
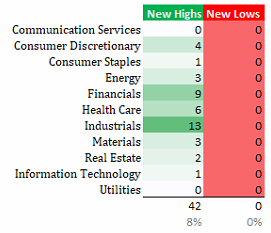
Most new highs coming out of industrials is especially intriguing, as it shows not only sector rotation going on, but also is witness to the underlying strength of the economy.
The S&P has been consolidating in a narrow range for 11 trading sessions now:

A bearish interpretation of the Nasdaq-100 could be completed wedge pattern (see below), which would put a price target below 16,400 or about 7% below the current level:
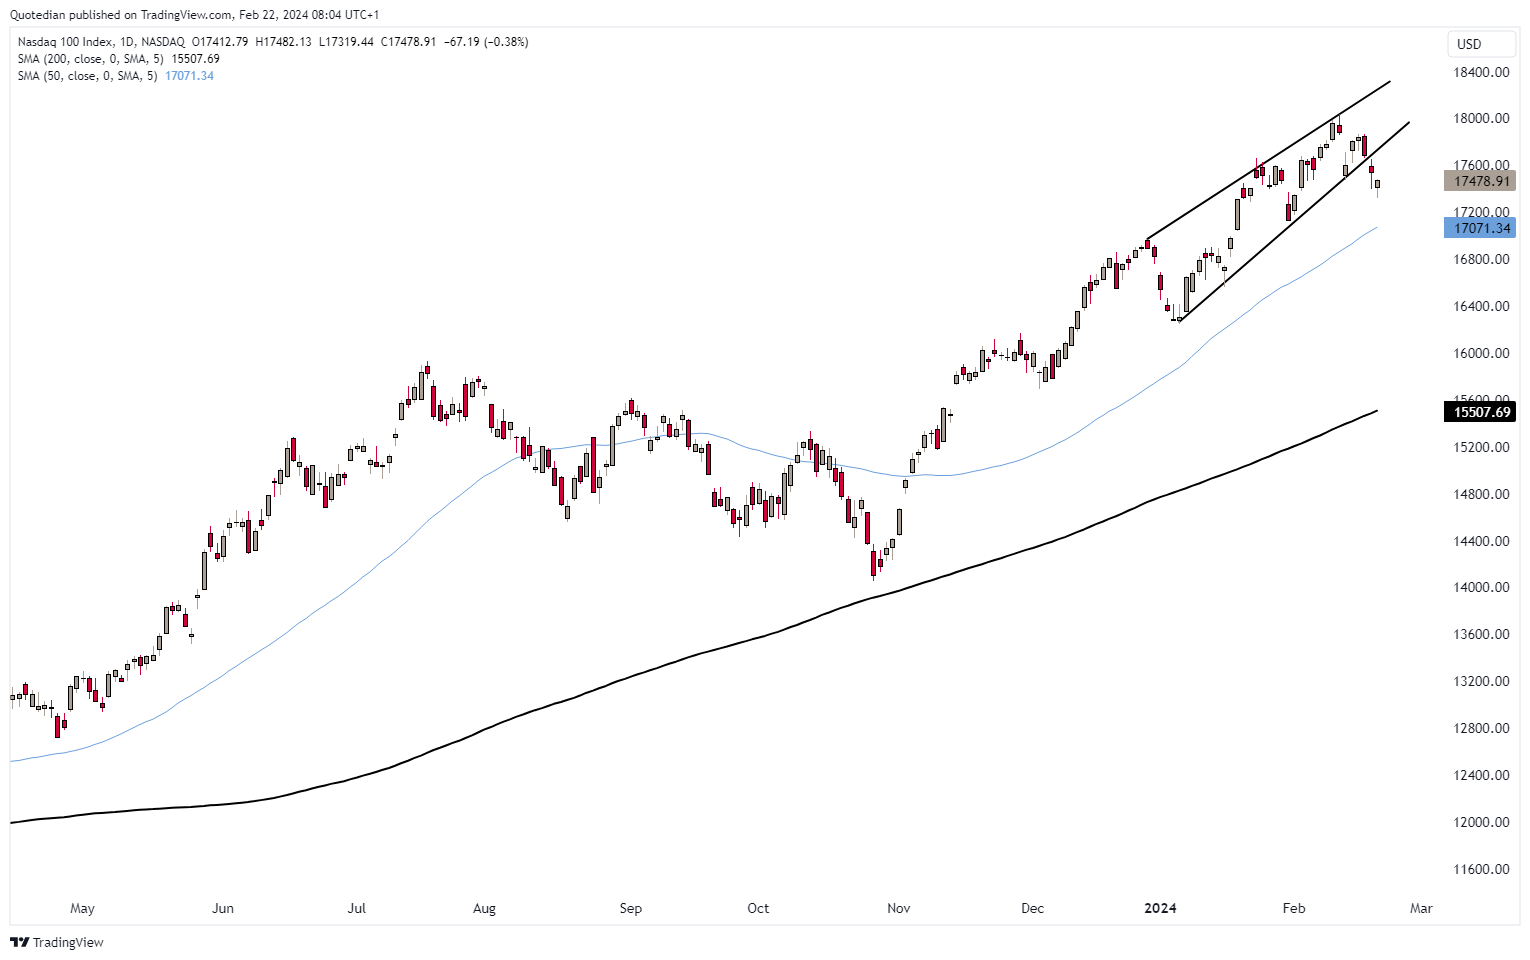
But as we said in yesterday’s QuiCQ note, “be very bullish, but less long”.
In Europe, STOXX 50 futures are steaming ahead this morning after last night’s NVDA results:

Since the start of the interest hiking cycle by the ECB, large cap stocks (SX5P - grey) have also been decoupling from the broader market (SXXP - red), which includes smaller, more indebted companies), as they have in the UU:

Last but not least, to finalize the equity section, today’s honorary mention goes to the Nikkei 225, which 35 years later hit a new all-time high this morning:

Ah, no, maybe one more ..
Just as you weren’t paying attention, Chinses stocks (CSI 300 are up 10% from the recent lows:

Admittedly, the index is still down 40% since last February, but I love this stealth moves were nobody is really paying attention because it has become uninvestable. Stay tuned, as somebody I know well would say… ;-)

Not much to say on the interest rate side of things, so let me keep it short.
The chart of US 10-year treasury yields seems like it wants to push higher:

Our intention was to increase duration as we approach 4.40%, but we have lost our guts somewhat, as we do expect higher yields over the coming years, we just thought not quite yet …

But here’s and interesting one…
We discussed a chart sometime last year, where we showed how bankruptcies were increasing, but credit spreads not.
Guess what? The divergence is closing, just not in the direction (i.e. widening credit spreads) we were expecting at the time:


In currency markets, the greenback (DXY) once again stalled right where it had too, after showing strength early in teh year:

I ingeniously enough coloured that last “stall point” in another color on the chart above :-)
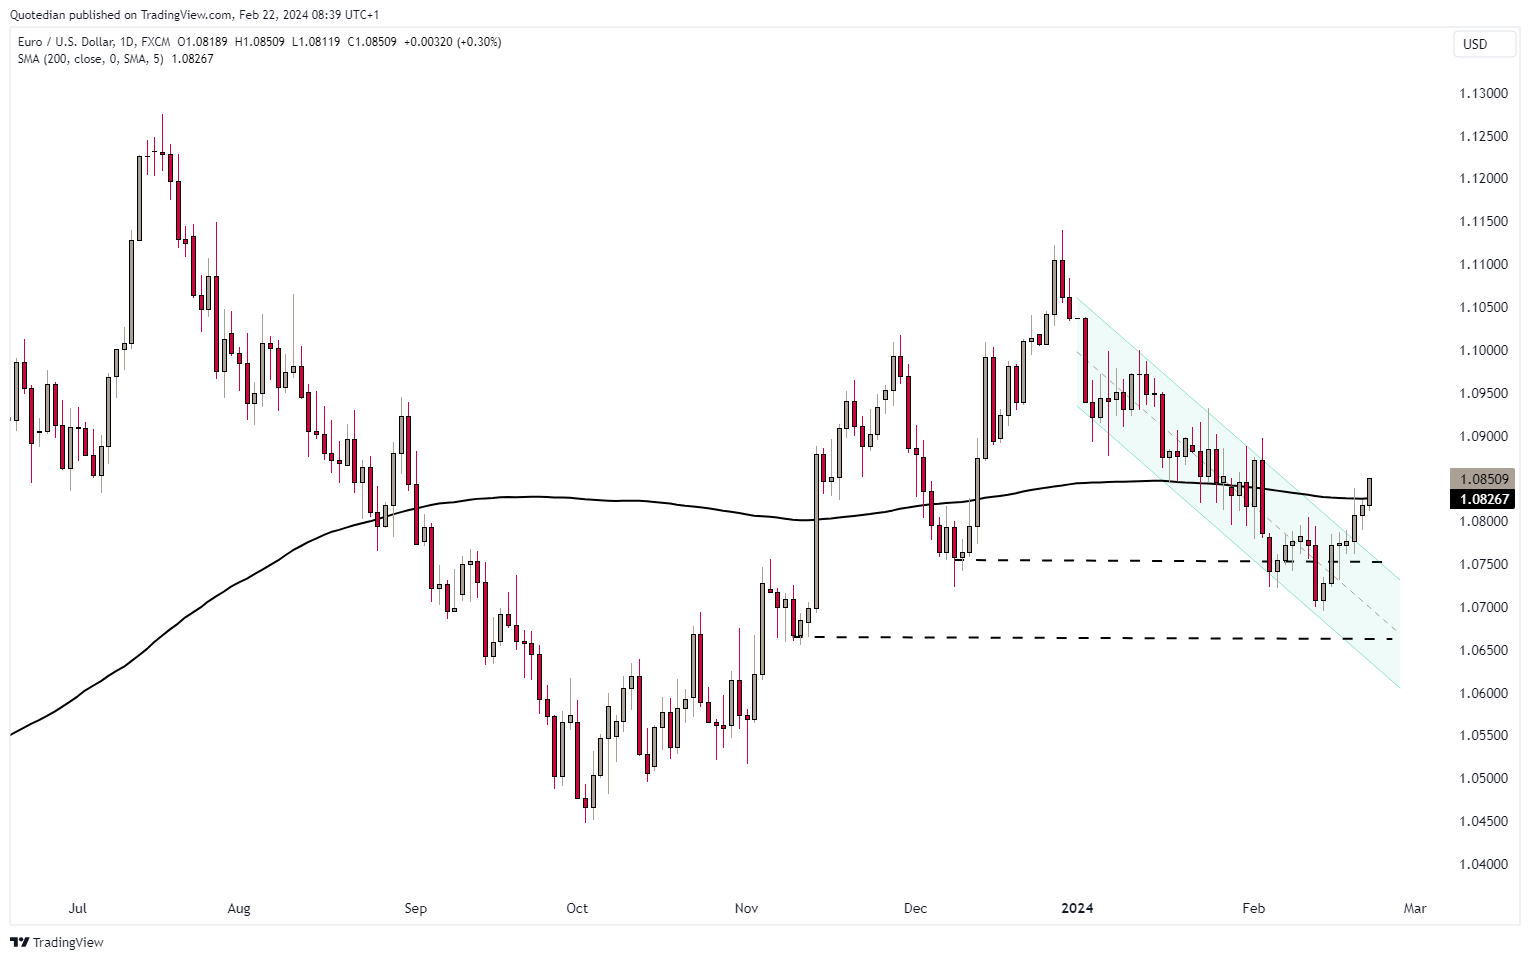
This translates into the EUR/USD chart suddenly looking bullish again, especially with the cross trading above its 200-day moving average:

Four observations in the commodity section and we are done (except for the COTD, of course).
Crude oil is suddenly not so sure about a recession anymore, with prices seemingly ready to push higher again. Here’s Brent:

And Dr. Copper, the metal with a Phd in Economics, has been on tear recently, up over 5% in a week:
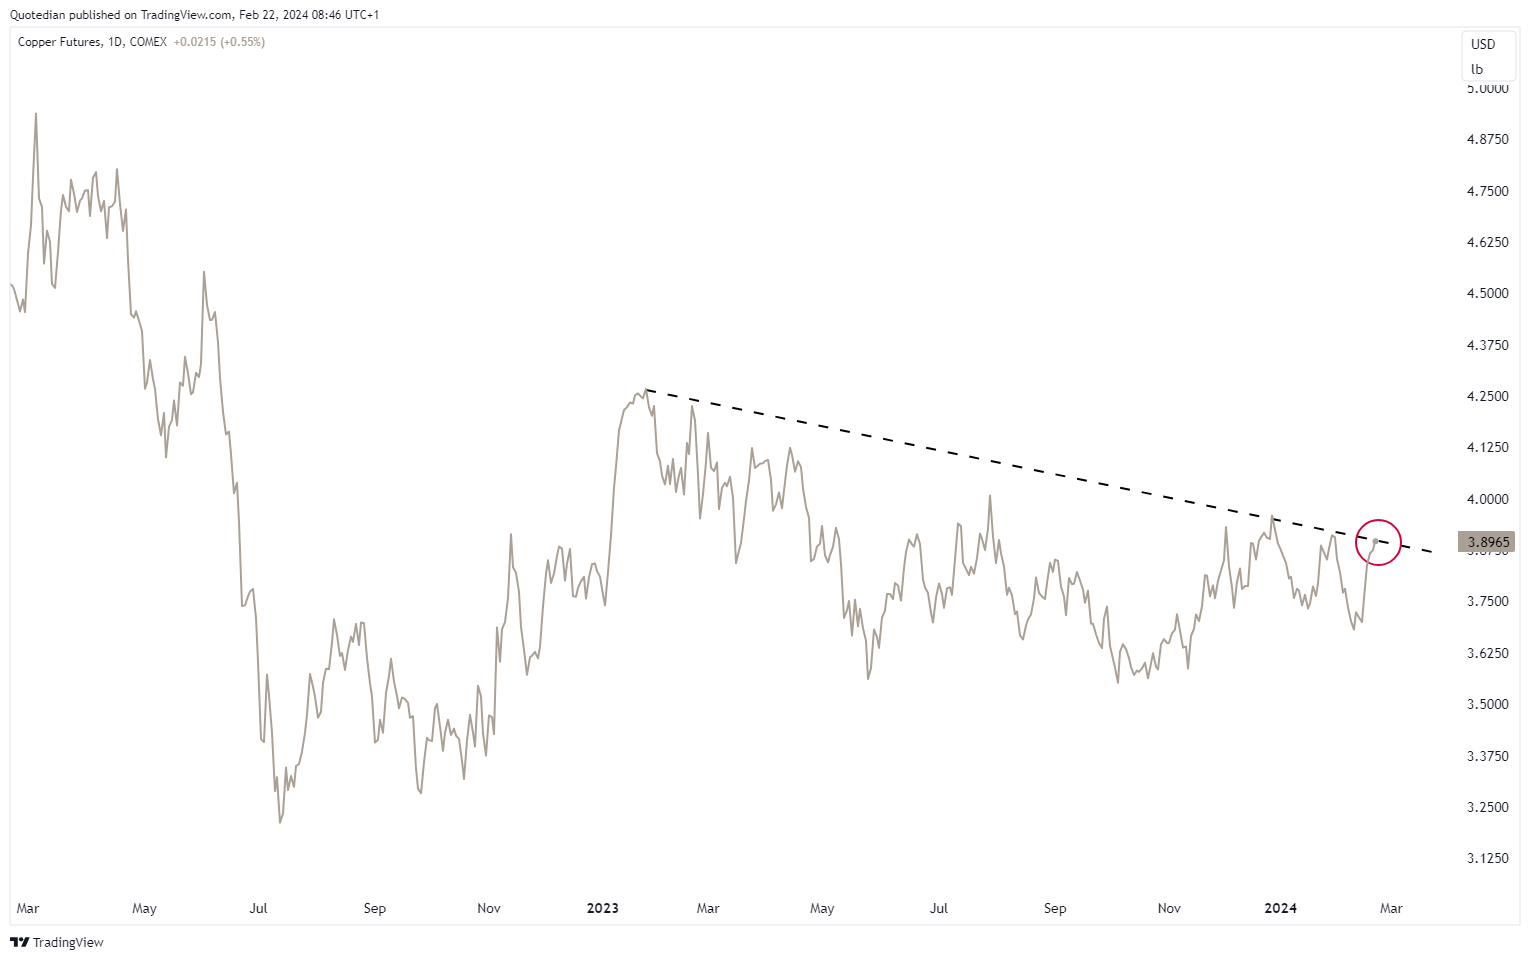
Will it break higher this time?
Such a break would have an impact on the copper/gold ratio (grey) and in turn on bond yields (red):

Natural gas prices are showing a half-hearted recovery attempt, as first gas producers (Chesapeake Energy) are staring to make noises about production slashes:

And finally, just has everybody was jumping on the nuclear renaissance bandwagon,

Uranium prices have started a seemingly more complex correction period:

This has also led to a more profound coreection amongst uranium mining stocks, of course:

And whilst there still seems a bit more downside ahead, this should turn out to be an opportunity to build exposure for those who have not done so yet.
Time to it the send button! Be carful out there!

André

The space company Intuitive Machines we all have heard of (ehem) is apparently on track to complete a moon-landing later today. Ticker is a fitting LUNR. Yet the stock was down15 yesterday! What happened? Well, probably just a bit more of “buy the rumour, sell the fact” as the company is about to report “Mission Complete” and the stock up 450% year-to-date before today’s reversal. Well, if the spike in March of last year is of any guidance, all we can ask is “ready for take-off?”


Everything in this document is for educational purposes only (FEPO)
Nothing in this document should be considered investment advice
The views expressed in this document may differ from the views published by Neue Private Bank AG
Past performance is hopefully no indication of future performance