Parenthesis
The Quotedian - Vol V, Issue 99
“Markets can stay irrational longer than you can stay solvent.”
John Maynard Keynes
DASHBOARD
AGENDA
CROSS-ASSET DELIBERATIONS
Our usual pathway through the macro landscape is as follows: equities → bonds → currencies → commodities. Given yesterday’s US CPI reading and its impact on all asset classes, please forgive me for jumping amongst those asset classes as we go on today’s journey. We will do criss-cross-asset deliberations, so to say ;-)
A quick look at the 9.1% headline CPI reading … not only is it ‘nasty’ in absolute terms, but looking under the hood it even gets kind of worse. In short, as the following chart from Bloomberg’s always excellent John Authers shows, is sticky inflation (e.g. rents) now also picking up:
This is exactly what the Fed wanted to avoid and in turn, has increased the market’s expectation of the FOMCs future hawkishness. At the same time, we got a rate hike out of Canada yesterday, with the Bank of Canada (BoC) not hiking rates by the expected 75 basis points, but rather by an entire percentage point. This and the fore-mentioned high CPI reading has increased expectations for 100 bp in the US too:
What happened on bond markets then, following the CPI release? Well, again, on the surface it seems not an awfully lot, with the 10-year US treasury yield (aka Tens) roughly ending the day where it had started:
Of course, there was this blip where rates jumped after the CPI release, but then the yield rally (bond sell-off) quickly reverted again.
Not quite the same picture for two-year rates though, where the yield ended the day decisively higher:
So, the logic goes that the Fed will move key interest rates higher and faster than expected, which in turn pushes up 1) interest rates at the short-end of the curve (e.g. 2Y) but 2) lowers rates at the longer end (e.g. 10Y) as too high rates will cool the economy and send it into a recession which in turn will push down future hike expectations. This is then also reflected in the shape of the yield curve, where the 10-2 year yield relationship is now deeply inverted:
In conclusion, an inverted yield curve increases (strongly) the odds of a recession, although technically this happens when it the line starts rising again (bull steepener).
This brings us to equities, which closed down, but relatively muted so only, given all the recession chatter. The following chart shows how some of the major indices recovered from the session lows, which were recorded right at the opening:
Not only did the higher beta indices outperform as illustrated in the graph above, but looking under the (S&P 500) hood, we see the same pattern of momentum, volatility and growth outperforming and value underperforming:
The argument of equity bulls would go something like this: a recession is good news for stocks, as it means the Fed will have to cut rates in the future in order to revive the economy, which in turn is good for stocks. Perhaps. But it is a bit like looking forward that you are going into cardiac arrest, which means the doctors will bring you back to life with one of those electro-shock thingies…
Of course, this is insanity and I think this statement by money manager Michael Kao captured on Twitter yesterday should remain our focus in a rising rate/inflation environment:
We are in a new era that values SHORT-DURATION exposure to ATOMS over LONG-DURATION exposure to BITS
Amen.
And talking Twitter, don’t miss to follow The Quotedian (@TheQuotedian) on Twitter for intraday updates and comments. I will increase ‘activity’ on that platform, but not by re-tweeting (only occasionally), but mostly through original content (if that exists at all).
One more on the equity side → I am closing the ‘Like’ on the tactical biotech stocks (via XBI) trade. Since inception around the long-term support line (cannot remember the exact date), the XBI has rallied nearly 30%, good enough for me for a tactical trade:
Anyway, we need to push on, and move into currencies, but not before leaving stocks with the observation that Asian equity markets are largely mixed this Thursday morning and Western index futures are in negative territory, but off the lows.
Currency markets continue as volatile and entertaining as they not have been in many, many years. Take the EUR/USD cross-rate for example, attacking parity for a second consecutive day, as the interest rate differential between the two economic zones rose (in favour of the USD) after the CPI reading. Here’s a five-day chart of the currency pair:
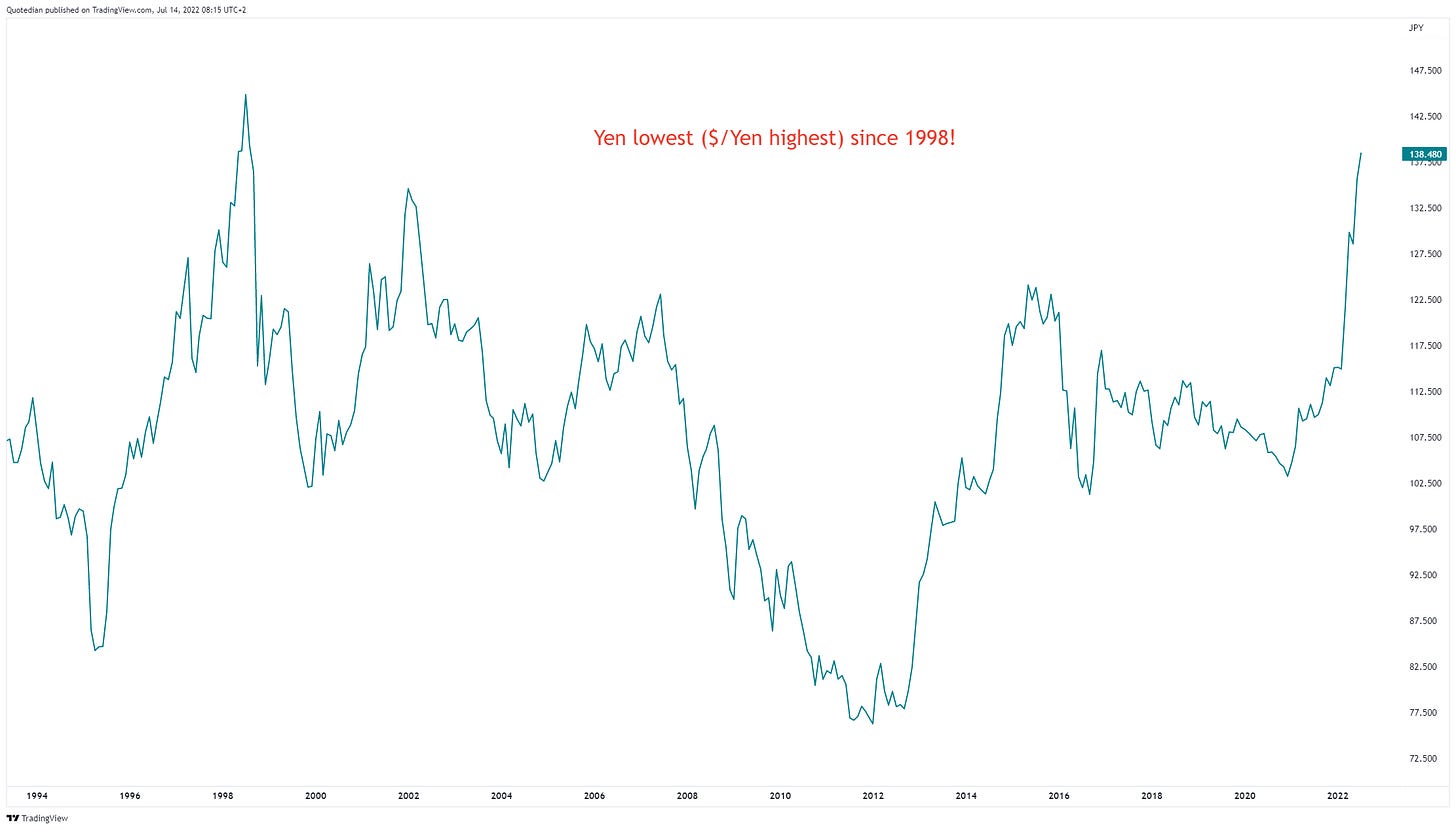
Obviously, there is some important buying interest at parity. Will it hold there? Perhaps, but probably not, given what is happening in another important FX couple. Here’s the USD/JPY chart, with the rate now above 138!!
Let’s leave it at this for today, as some technical difficulties with data sources have complicated today’s deliberations. We will skip commodities for today, but have a closer look tomorrow.
Time to hit the send button, but do not miss today’s COTD below.
CHART OF THE DAY
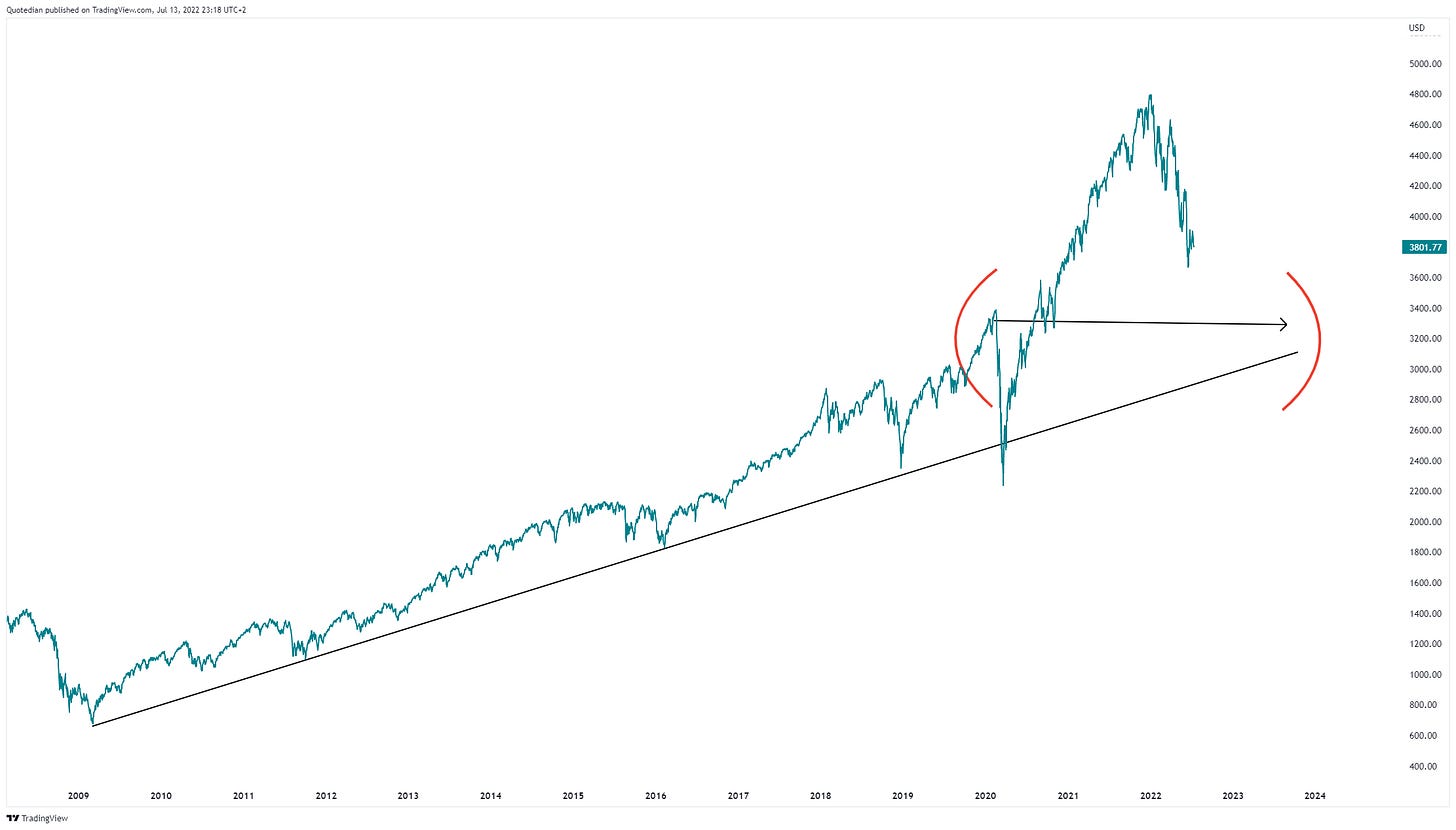
In early January I wrote in one of The Quotedians, that what if the whole COVID episode was just a kind of parenthesis (red brackets) in global economies and markets. Hence, I suggest that (equity) markets could fall back to pre-pandemic, pre-heavy-handed central bank intervention levels. This would bring the S&P 500 somewhere to around the 3,000 level, which conveniently also coincides with the long-term uptrend line (black line) on this index.
I will update on this ‘theory’ tongue-in-cheek on Twitter later today (@TheQuotedian).
LIKES N’ DISLIKES
Likes and Dislikes are not investment recommendations!
Long China equity (FXI) / short India equity (PIN)
Biotech (XBI); trailing stop now at $66Taking profitEnergy stocks (XLE); 1/2 usual position size
Long some Gold (direct or via short puts)
DISCLAIMER
Everything in this document is for educational purposes only (FEPO)
Nothing in this document should be considered investment advice
Past performance is hopefully no indication of future performance


Thanks André, very nice reading as usual.
Two comments on my side
- Very good to read the excellent John Authers
- and yes, I buy your assumption about the pandemic parenthesis.
Another way to look at it is to say that each and every shock that threatened financial stability since the GFC has been used as a justification for additional policy interventions.
It seems to me you can broaden your brackets...
Saludos,
Jacques